Analyst's Handbook: Health Care - Home » Yardeni … · Analyst’s Handbook: Health Care Yardeni...
19
Analyst’s Handbook: Health Care Yardeni Research, Inc. June 8, 2018 Dr. Edward Yardeni 516-972-7683 [email protected] Mali Quintana 480-664-1333 [email protected] Please visit our sites at www.yardeni.com blog.yardeni.com thinking outside the box
Transcript of Analyst's Handbook: Health Care - Home » Yardeni … · Analyst’s Handbook: Health Care Yardeni...

Analyst’s Handbook:Health Care
Yardeni Research, Inc.
June 8, 2018
Dr. Edward Yardeni516-972-7683
Mali Quintana480-664-1333
Please visit our sites atwww.yardeni.comblog.yardeni.com
thinking outside the box

Table Of Contents Table Of ContentsTable Of Contents
June 8, 2018 / Analyst’s Handbook: Health Care www.yardeni.com
Yardeni Research, Inc.
S&P 500 Health Care 1Earnings 2Revenues & Margins 3Earnings Growth & Valuation 4S&P 500: Health Care 5S&P 500: Health Care (cont) 6S&P 500/400/600 Health Care YTD 7-8Health Care 9-16

1995 1996 1997 1998 1999 2000 2001 2002 2003 2004 2005 2006 2007 2008 2009 2010 2011 2012 2013 2014 2015 2016 2017 2018 201975
275
475
675
875
1075
75
275
475
675
875
10756/8
yardeni.com
200-day moving average.* Ratio scale.
Source: Standard & Poor’s and Haver Analytics.
S&P 500 HEALTH CARE STOCK PRICE INDEX*
Figure 1.
78 80 82 84 86 88 90 92 94 96 98 00 02 04 06 08 10 12 14 16 18 20 22.1
.2
.3
.4
.5
.1
.2
.3
.4
.5
S&P 500 HEALTH CARE(as a ratio of S&P 500)
6/8
Note: Shaded areas denote recessions according to the National Bureau of Economic Research. Monthly through December 1990, then weekly. Monthlydata an average of Hospital Management, Medical Products, and Pharmaceutical industry ratios.Source: Standard & Poor’s Corporation.
yardeni.com
Figure 2.
S&P 500 Health Care
Page 1 / June 8, 2018 / Analyst’s Handbook: Health Care www.yardeni.com
Yardeni Research, Inc.

1995 1996 1997 1998 1999 2000 2001 2002 2003 2004 2005 2006 2007 2008 2009 2010 2011 2012 2013 2014 2015 2016 2017 2018 20195
20
35
50
65
80
5
20
35
50
65
80
1718 19 5/31
yardeni.com
* Time-weighted average of consensus estimates for current year and next year. Monthly through December 2005, then weekly.Source: Thomson Reuters I/B/E/S.
S&P 500 HEALTH CARE OPERATING EARNINGS PER SHARE(analysts’ average forecasts, ratio scale)
Consensus ForecastsAnnual estimates
Forward earnings*
Figure 3.
1995 1996 1997 1998 1999 2000 2001 2002 2003 2004 2005 2006 2007 2008 2009 2010 2011 2012 2013 2014 2015 2016 2017 2018 2019-20
-15
-10
-5
0
5
10
15
20
-20
-15
-10
-5
0
5
10
15
20
NERI Mar 18.2 Apr 15.6 May 10.6
May
yardeni.com
* Three-month moving average of the number of forward earnings estimates up less number of estimates down, expressed as a percentageof the total number of forward earnings estimates.Source: Thomson Reuters I/B/E/S.
S&P 500 HEALTH CARE NET EARNINGS REVISIONS*
Figure 4.
Earnings
Page 2 / June 8, 2018 / Analyst’s Handbook: Health Care www.yardeni.com
Yardeni Research, Inc.

2004 2005 2006 2007 2008 2009 2010 2011 2012 2013 2014 2015 2016 2017 2018 2019150
250
350
450
550
650
750
150
250
350
450
550
650
750
1718 19
5/31
yardeni.com
* Time-weighted average of consensus estimates for current year and next year. Monthly through December 2005, then weekly.Source: Thomson Reuters I/B/E/S.
S&P 500 HEALTH CARE REVENUES PER SHARE(analysts’ average forecasts, ratio scale)
Consensus ForecastsAnnual estimates
Forward revenues*
Figure 5.
2004 2005 2006 2007 2008 2009 2010 2011 2012 2013 2014 2015 2016 2017 2018 20199.5
10.0
10.5
11.0
11.5
12.0
12.5
9.5
10.0
10.5
11.0
11.5
12.0
12.5
17 18 19
5/31
yardeni.com
(using analysts’ average earnings and revenues forecasts)
* Time-weighted average of the consensus estimates for current year and next year. Monthly through December 2005, weekly thereafter.Source: Thomson Reuters I/B/E/S.
S&P 500 HEALTH CARE PROJECTED PROFIT MARGIN
Consensus ForecastsAnnual estimates
Forward profit margin* (10.5)
Figure 6.
Revenues & Margins
Page 3 / June 8, 2018 / Analyst’s Handbook: Health Care www.yardeni.com
Yardeni Research, Inc.

1995 1996 1997 1998 1999 2000 2001 2002 2003 2004 2005 2006 2007 2008 2009 2010 2011 2012 2013 2014 2015 2016 2017 2018 20190
5
10
15
20
0
5
10
15
20
5/31
yardeni.com
Note: STEG is year-ahead forward consensus expected short-term earnings growth. STRG is year-ahead forward consensus expected short-termrevenue growth. LTEG is five-year consensus expected long-term earnings growth.Monthly data through 2005, weekly thereafter.Source: Thomson Reuters I/B/E/S.
S&P 500 HEALTH CARE STRG, STEG, & LTEG(percent)
LTEG* (11.3)
STEG* (11.0)
STRG* (5.5)
Figure 7.
5
10
15
20
25
30
35
5
10
15
20
25
30
35
5/31
1995 1996 1997 1998 1999 2000 2001 2002 2003 2004 2005 2006 2007 2008 2009 2010 2011 2012 2013 2014 2015 2016 2017 2018 2019.50
.75
1.00
1.25
1.50
1.75
2.00
.50
.75
1.00
1.25
1.50
1.75
2.00
5/31
yardeni.com
* Price divided by 12-month forward consensus expected operating earnings per share.** Sector or industry forward P/E relative to S&P 500 forward P/E.
*** Sector or industry forward P/E relative to sector or industry consensus 5-year LTEG forecast.Source: Thomson Reuters I/B/E/S.
S&P 500 HEALTH CARE VALUATION
Forward P/E* (15.0)
Relative P/E** (0.9)
PEG Ratio*** (1.3)
Figure 8.
Earnings Growth & Valuation
Page 4 / June 8, 2018 / Analyst’s Handbook: Health Care www.yardeni.com
Yardeni Research, Inc.

Figure 9.
06 07 08 09 10 11 12 13 14 15 16 17 18 19 20200
400
600
800
1000
1200
6/8
S&P 500 HEALTH CARE
06 07 08 09 10 11 12 13 14 15 16 17 18 19 20250
350
450
550
650
750
850
950
1050
1150
1250
1350
14506/8S&P 500 HEALTH CARE EQUIPMENT(ABT BAX BCR BDX BSX EW HOLX ISRGMDT RMD STJ SYK VAR ZMH)
06 07 08 09 10 11 12 13 14 15 16 17 18 19 20200
600
1000
1400
1800
2200
2600
3000
3400
3800
4200
4600
6/8
S&P 500 BIOTECHNOLOGY(ABBV ALXN AMGN BIIB CELGGILD REGN VRTX)
06 07 08 09 10 11 12 13 14 15 16 17 18 19 200
50
100
150
200
250
300
350
400
450
500
550
600
6/8
S&P 500 HEALTH CARE FACILITIES(HCA UHS)
06 07 08 09 10 11 12 13 14 15 16 17 18 19 20100
200
300
400
500
600
700
800
900
1000
6/8
S&P 500 HEALTH CARE DISTRIBUTORS(ABC CAH HSIC MCK PDCO)
200-day moving average
Source: Standard & Poor’s Corporation.
06 07 08 09 10 11 12 13 14 15 16 17 18 19 2080
140
200
260
320
380
440
500
560
620
680
740
800
860
6/8
yardeni.com
S&P 500 HEALTH CARE SERVICES(DGX DVA ESRX LH)
S&P 500: Health Care
Page 5 / June 8, 2018 / Analyst’s Handbook: Health Care www.yardeni.com
Yardeni Research, Inc.
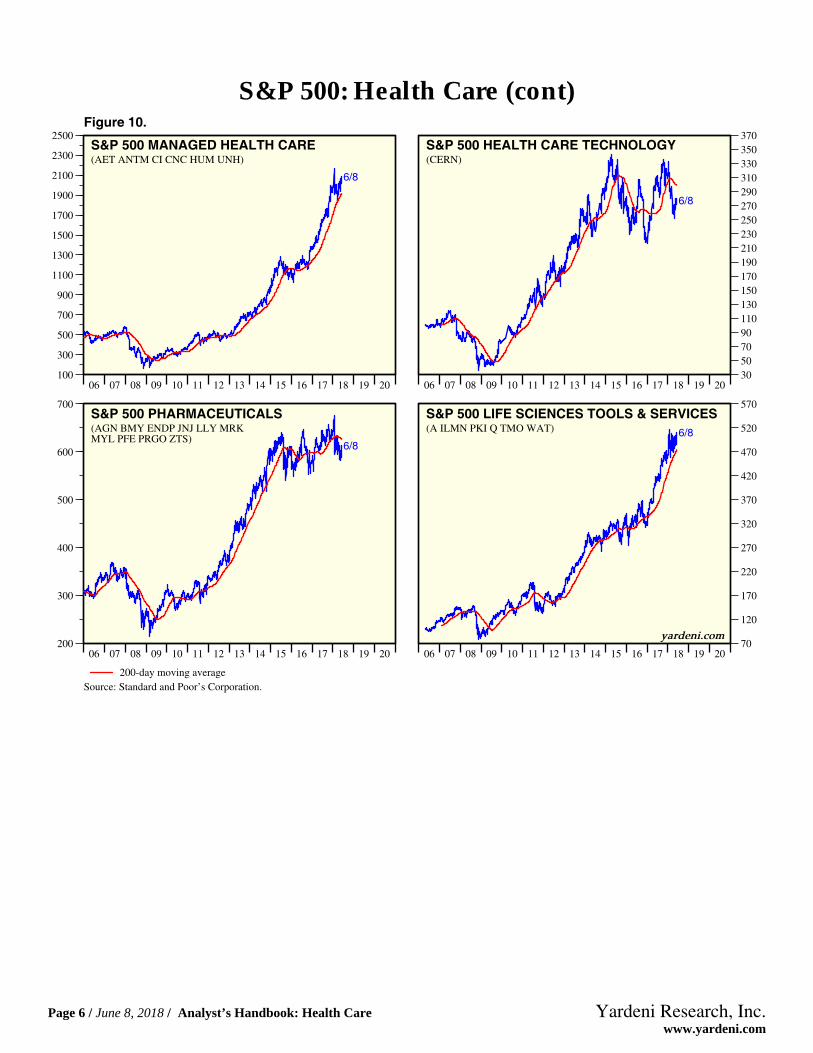
Figure 10.
06 07 08 09 10 11 12 13 14 15 16 17 18 19 20100
300
500
700
900
1100
1300
1500
1700
1900
2100
2300
2500
6/8
S&P 500 MANAGED HEALTH CARE(AET ANTM CI CNC HUM UNH)
06 07 08 09 10 11 12 13 14 15 16 17 18 19 2030507090110130150170190210230250270290310330350370
6/8
S&P 500 HEALTH CARE TECHNOLOGY(CERN)
06 07 08 09 10 11 12 13 14 15 16 17 18 19 20200
300
400
500
600
700
6/8
S&P 500 PHARMACEUTICALS(AGN BMY ENDP JNJ LLY MRKMYL PFE PRGO ZTS)
200-day moving averageSource: Standard and Poor’s Corporation.
06 07 08 09 10 11 12 13 14 15 16 17 18 19 2070
120
170
220
270
320
370
420
470
520
570
6/8
S&P 500 LIFE SCIENCES TOOLS & SERVICES(A ILMN PKI Q TMO WAT)
yardeni.com
S&P 500: Health Care (cont)
Page 6 / June 8, 2018 / Analyst’s Handbook: Health Care www.yardeni.com
Yardeni Research, Inc.

Jan Feb Mar Apr May Jun2018
-20
-10
0
10
20
30
40
3.9
Figure 11.S&P 500 LargeCap
All Sectors
Jan Feb Mar Apr May Jun2018
-15
-5
5
15
25
35
45
5.3
S&P 400 MidCap
Jan Feb Mar Apr May Jun2018
-15
-5
5
15
25
35
45
10.9
S&P 600 SmallCap
Jan Feb Mar Apr May Jun2018
-20
0
20
40
60
2.7
Health CareSector
Jan Feb Mar Apr May Jun2018
-20
0
20
40
60
19.1
Jan Feb Mar Apr May Jun2018
-20
0
20
40
60
29.8
Jan Feb Mar Apr May Jun2018
-50
-10
30
70
110
-3.1
Biotechnology
Jan Feb Mar Apr May Jun2018
-50
-10
30
70
110
33.7
Jan Feb Mar Apr May Jun2018
-50
-10
30
70
110
27.8
Jan Feb Mar Apr May Jun2018
-40
-20
0
20
40
60
80
-8.1
Health CareDistributors
Jan Feb Mar Apr May Jun2018
-60-40-20
020406080
-21.2
Jan Feb Mar Apr May Jun2018
-60-40-20
020406080
-34.0
Jan Feb Mar Apr May Jun2018
-25
-5
15
35
55
13.9Health CareEquipment
Jan Feb Mar Apr May Jun2018
-25
-5
15
35
55
30.9
Jan Feb Mar Apr May Jun2018
-25
-5
15
35
55
27.5
Jan Feb Mar Apr May Jun2018
-50
-30
-10
10
30
50
70
14.8Health CareFacilities
Jan Feb Mar Apr May Jun2018
-50
-30
-10
10
30
50
70
39.1
Jan Feb Mar Apr May Jun2018
-50
-30
-10
10
30
50
70
18.2
Jan Feb Mar Apr May Jun2018
-60
-40
-20
0
20
40
60
2.7Health CareServices
HC Supplies
Health CareTechnology
Jan Feb Mar Apr May Jun2018
-60
-40
-20
0
20
40
60
-13.1
Jan Feb Mar Apr May Jun2018
-60
-40
-20
0
20
40
60
26.0
Jan Feb Mar Apr May Jun2018
-15-55
1525354555
25.1
Jan Feb Mar Apr May Jun2018
-40-20
020406080
100
19.8
Jan Feb Mar Apr May Jun2018
-30
-10
10
30
50
70
90
11.8
Life SciencesTools & Services
Source: Standard & Poor’s.
Jan Feb Mar Apr May Jun2018
-30
-10
10
30
50
70
90
13.7
Jan Feb Mar Apr May Jun2018
-30
-10
10
30
50
70
90
14.0
yardeni.com
S&P 500/400/600 Health Care YTD
Page 7 / June 8, 2018 / Analyst’s Handbook: Health Care www.yardeni.com
Yardeni Research, Inc.

Jan Feb Mar Apr May Jun2018
-40
-20
0
20
40
60
80
7.9
Figure 12.S&P 500 LargeCap
ManagedHealth Care
Jan Feb Mar Apr May Jun2018
-40
-20
0
20
40
60
80
15.7
S&P 400 MidCap
Jan Feb Mar Apr May Jun2018
-40
-20
0
20
40
60
80
34.5
S&P 600 SmallCap
Jan Feb Mar Apr May Jun2018
-30-101030507090
110
-3.3
Pharmaceuticals
Source: Standard & Poor’s.
Jan Feb Mar Apr May Jun2018
-50-30-101030507090
110
-17.9
Jan Feb Mar Apr May Jun2018
-30-101030507090
110130
40.9
yardeni.com
S&P 500/400/600 Health Care YTD
Page 8 / June 8, 2018 / Analyst’s Handbook: Health Care www.yardeni.com
Yardeni Research, Inc.

90 91 92 93 94 95 96 97 98 99 00 01 02 03 04 05 06 07 08 09 10 11 12 13 14 15 16 17 18 19 200
500
1000
1500
2000
2500
3000
3500
4000
0
500
1000
1500
2000
2500
3000
3500
4000
6/8
S&P HEALTH CARE
S&P 500 (982)S&P 400 (1902)S&P 600 (3060)
Source: Standard & Poor’s Corporation.
yardeni.com
Figure 13.
90 91 92 93 94 95 96 97 98 99 00 01 02 03 04 05 06 07 08 09 10 11 12 13 14 15 16 17 18 19 200
1000
2000
3000
4000
5000
0
1000
2000
3000
4000
5000
6/8
S&P HEALTH CARE BIOTECHNOLOGY
S&P 500 (3785)S&P 400 (4453)S&P 600 (2411)
Source: Standard & Poor’s Corporation.
yard
eni.
com
Figure 14.
Health Care
Page 9 / June 8, 2018 / Analyst’s Handbook: Health Care www.yardeni.com
Yardeni Research, Inc.

90 91 92 93 94 95 96 97 98 99 00 01 02 03 04 05 06 07 08 09 10 11 12 13 14 15 16 17 18 19 200
200
400
600
800
1000
1200
0
200
400
600
800
1000
1200
6/8
S&P HEALTH CARE DISTRIBUTORS
S&P 500 (559)S&P 400 (358)S&P 600 (408)
Source: Standard & Poor’s Corporation.
yardeni.com
Figure 15.
90 91 92 93 94 95 96 97 98 99 00 01 02 03 04 05 06 07 08 09 10 11 12 13 14 15 16 17 18 19 200
2000
4000
6000
8000
0
2000
4000
6000
8000
6/8
S&P HEALTH CARE EQUIPMENT
S&P 500 (1421)S&P 400 (2476)S&P 600 (6196)
Source: Standard & Poor’s Corporation.
yardeni.com
Figure 16.
Health Care
Page 10 / June 8, 2018 / Analyst’s Handbook: Health Care www.yardeni.com
Yardeni Research, Inc.

04 05 06 07 08 09 10 11 12 13 14 15 16 17 18 190
200
400
600
800
1000
0
200
400
600
800
1000
6/8
S&P HEALTH CARE SERVICES
S&P 500 (713)S&P 400 (332)S&P 600 (811)
Source: Standard & Poor’s Corporation.
yardeni.com
Figure 17.
95 96 97 98 99 00 01 02 03 04 05 06 07 08 09 10 11 12 13 14 15 16 17 18 19 200
1000
2000
3000
4000
5000
0
1000
2000
3000
4000
5000
6/8S&P MANANGED HEALTH CARE
S&P 500 (2084)S&P 400 (896)S&P 600 (4636)
Source: Standard & Poor’s Corporation.
yard
eni.
com
Figure 18.
Health Care
Page 11 / June 8, 2018 / Analyst’s Handbook: Health Care www.yardeni.com
Yardeni Research, Inc.

90 91 92 93 94 95 96 97 98 99 00 01 02 03 04 05 06 07 08 09 10 11 12 13 14 15 16 17 18 19 200
5000
10000
15000
20000
0
5000
10000
15000
20000
6/8
S&P HEALTH CARE PHARMACEUTICALS
S&P 500 (613)S&P 400 (1207)S&P 600 (15114)
Source: Standard & Poor’s Corporation.
yard
eni.
com
Figure 19.
Health Care
Page 12 / June 8, 2018 / Analyst’s Handbook: Health Care www.yardeni.com
Yardeni Research, Inc.

95 96 97 98 99 00 01 02 03 04 05 06 07 08 09 10 11 12 13 14 15 16 17 18 19-50
0
50
100
-50
0
50
100
6/6
S&P HEALTH CARE(yearly percent change)
S&P 500 (10)S&P 400 (21)S&P 600 (53)
Source: Standard & Poor’s Corporation.
yardeni.com
Figure 20.
95 96 97 98 99 00 01 02 03 04 05 06 07 08 09 10 11 12 13 14 15 16 17 18 19-100
0
100
200
300
400
-100
0
100
200
300
400
6/6
S&P HEALTH CARE BIOTECHNOLOGY(yearly percent change)
S&P 500 (8)S&P 400 (38)S&P 600 (52)
Source: Standard & Poor’s Corporation.
yardeni.com
Figure 21.
Health Care
Page 13 / June 8, 2018 / Analyst’s Handbook: Health Care www.yardeni.com
Yardeni Research, Inc.

95 96 97 98 99 00 01 02 03 04 05 06 07 08 09 10 11 12 13 14 15 16 17 18 19-100
-50
0
50
100
150
-100
-50
0
50
100
150
6/6
S&P HEALTH CARE DISTRIBUTORS(yearly percent change)
S&P 500 (-18)
S&P 400 (-54)
S&P 600 (-38)
Source: Standard & Poor’s Corporation.
yardeni.com
Figure 22.
95 96 97 98 99 00 01 02 03 04 05 06 07 08 09 10 11 12 13 14 15 16 17 18 19-50
0
50
100
150
-50
0
50
100
150
6/6
S&P HEALTH CARE EQUIPMENT(yearly percent change)
S&P 500 (19)S&P 400 (48)S&P 600 (43)
Source: Standard & Poor’s Corporation.
yardeni.com
Figure 23.
Health Care
Page 14 / June 8, 2018 / Analyst’s Handbook: Health Care www.yardeni.com
Yardeni Research, Inc.

2004 2005 2006 2007 2008 2009 2010 2011 2012 2013 2014 2015 2016 2017 2018 2019-50
0
50
100
-50
0
50
100
6/6
S&P HEALTH CARE SERVICES(yearly percent change)
S&P 500 (10)S&P 400 (-14)S&P 600 (40)
Source: Standard & Poor’s Corporation.
yardeni.com
Figure 24.
95 96 97 98 99 00 01 02 03 04 05 06 07 08 09 10 11 12 13 14 15 16 17 18 19-100
0
100
200
-100
0
100
200
6/6
S&P MANANGED HEALTH CARE(yearly percent change)
S&P 500 (28)S&P 400 (28)S&P 600 (48)
Source: Standard & Poor’s Corporation.
yardeni.com
Figure 25.
Health Care
Page 15 / June 8, 2018 / Analyst’s Handbook: Health Care www.yardeni.com
Yardeni Research, Inc.

95 96 97 98 99 00 01 02 03 04 05 06 07 08 09 10 11 12 13 14 15 16 17 18 19-100
0
100
200
300
-100
0
100
200
300
6/6
S&P HEALTH CARE PHARMACEUTICALS(yearly percent change)
S&P 500 (-1)S&P 400 (-35)S&P 600 (108)
Source: Standard & Poor’s Corporation.
yard
eni.
com
Figure 26.
Health Care
Page 16 / June 8, 2018 / Analyst’s Handbook: Health Care www.yardeni.com
Yardeni Research, Inc.

http://blog.yardeni.com
http://blog.yardeni.com
Copyright (c) Yardeni Research, Inc. 2018. All rights reserved. The informationcontained herein has been obtained from sources believed to be reliable, but is notnecessarily complete and its accuracy cannot be guaranteed. No representation orwarranty, express or implied, is made as to the fairness, accuracy, completeness, orcorrectness of the information and opinions contained herein. The views and the otherinformation provided are subject to change without notice. All reports posted onwww.yardeni.com, blog.yardeni.com, and YRI’s Apps for iPads and iPhones are issuedwithout regard to the specific investment objectives, financial situation, or particular needsof any specific recipient and are not to be construed as a solicitation or an offer to buy or sellany securities or related financial instruments. Past performance is not necessarily a guideto future results. Company fundamentals and earnings may be mentioned occasionally, butshould not be construed as a recommendation to buy, sell, or hold the company’s stock.Predictions, forecasts, and estimates for any and all markets should not be construed asrecommendations to buy, sell, or hold any security--including mutual funds, futurescontracts, and exchange traded funds, or any similar instruments.
The text, images, and other materials contained or displayed on any Yardeni Research, Inc.product, service, report, email or website are proprietary to Yardeni Research, Inc. andconstitute valuable intellectual property. No material from any part of www.yardeni.com, blog.yardeni.com, and YRI’s Apps for iPads and iPhones may be downloaded, transmitted,broadcast, transferred, assigned, reproduced or in any other way used or otherwisedisseminated in any form to any person or entity, without the explicit written consent ofYardeni Research, Inc. All unauthorized reproduction or other use of material from YardeniResearch, Inc. shall be deemed willful infringement(s) of this copyright and other proprietaryand intellectual property rights, including but not limited to, rights of privacy. YardeniResearch, Inc. expressly reserves all rights in connection with its intellectual property,including without limitation the right to block the transfer of its products and services and/orto track usage thereof, through electronic tracking technology, and all other lawful means,now known or hereafter devised. Yardeni Research, Inc. reserves the right, without furthernotice, to pursue to the fullest extent allowed by the law any and all criminal and civilremedies for the violation of its rights.
The recipient should check any email and any attachments for the presence of viruses.Yardeni Research, Inc. accepts no liability for any damage caused by any virus transmittedby this company’s emails, website, blog and Apps. Additional information available onrequest.