Analysts A brisk walk, also thanks Valentina Romitelli to ... · Valentina Romitelli...
22
VALUE TRACK NOT FOR DISTRIBUTION IN OR INTO THE UNITED STATES, CANADA, JAPAN OR AUSTRALIA ValueTrack | www.value-track.com | ValueTrack | Update Report | 01 October 2018 BioDue Spa Sector: Healthcare A brisk walk, also thanks to extracts Analysts Valentina Romitelli [email protected] Marco Greco + 39 02 80886654 [email protected] BioDue is a leading player in the Italian nutraceutical market. It develops, manufactures and distributes food supplements, cosmetics, medical devices and herbal products. 1H18 results reassuring on key points 1H18 interim results just reported provide evidence that: 1) the company keeps growing (Top line +13% YoY, +6% YoY organic), 2) margin upside is materializing (EBITDA margin +390bps; +290bps like for like), 3) the demanding capex plan is on track, and 4) small scale M&A is a feasible, value enhancing growth path (the small acquisition announced in July implies multiples well below Group and sector). Forecasts (broadly unchanged) show 23% CAGR at EBITDA and 34% at adj. earnings into 2020 We have updated our 2018E-20E forecasts, with negligible impact on Top line and EBITDA, a 5-7% cut on 2018E-19E bottom line (driven by slightly higher amortization and taxes) and virtually unchanged FCF. New forecasts imply for the next three years a like for like CAGR of 8% and 23% for sales and EBITDA respectively, of 34% for adj. Net Profit and DPS doubling to €0.12 in 2019 from €0.06 in 2017. The cost of the July acquisition is factored as of FY18 (target not consolidated), yet BioDue should reduce its net debt to nil by 1H21, and this leaves room for further M&A, we believe. Sector moving sideways in Europe, M&A supportive The reference sector has not performed well as a whole this year (US leaders being an exception), but a major acquisition announced in Italy so far – the merger of Innova Italy 1 SPAC with its target Fine Foods SpA - offers good support to the sector in terms of implied valuation. BioDue still trades at small discount to its peer group, albeit the valuation gap is narrowing. Fair value at €6.0 per share, potential catalysts ahead We leave unchanged our €6.0 Fair value per share, coming from the average between peer analysis and DCF model. At fair value the stock would trade at 10.4x EV/EBITDA and 18.1x P/E on 2018E. We believe the stock should catalyse increasing interest in the next months and re-rate further due to: 1) the release of full details in relation to the acquisition announced, 2) the acceleration of growth from next quarters, and 3) the strong FCF generation expected from 2019E. Fair Value (€) 6.00 Market Price (€) 5.36 Market Cap. (€m) 59.8 KEY FINANCIALS (€’000) 2017A 2018E 2019E REVENUES 36.3 41.8 45.1 EBITDA 4.6 7.3 8.4 EBIT 3.2 5.4 6.2 ADJ. NET PROFIT 2.1 3.7 4.1 EQUITY 20.5 23.7 26.7 NET FIN. POS. -6.1 -9.3 -5.5 EPS ADJ. (€) 0.19 0.33 0.37 DPS (€) 0.06 0.11 0.12 Source: BioDue (historical figures), Value Track (2018E-19E estimates) RATIOS & MULTIPLES 2017A 2018E 2019E EBITDA MARGIN (%) 12.6% 17.6% 18.6% EBIT MARGIN (%) 8.7% 12.8% 13.7% NET DEBT / EBITDA (x) 1.3 1.3 0.7 NET DEBT / EQUITY (%) 30% 39% 21% EV/EBITDA (x) 13.8 9.4 7.9 EV/EBIT (x). 19.9 12.9 10.7 P/E ADJ. (x) 26.9 16.1 14.5 DIV YIELD (%) 1.2 2.1 2.2 Source: BioDue (historical figures), Value Track (2018E-19E estimates) STOCK DATA FAIR VALUE (€) 6.00 MARKET PRICE (€) 5.36 SHS. OUT. (m) 11.1 MARKET CAP. (€m) 59.8 FREE FLOAT (%) 21.0 AVG. -20D VOL. ('000) 12,000 RIC / BBG BIO2.MI / BIO2 IM 52 WK RANGE 4.84-7.10 Source: Stock Market Data THIS EQUITY RESEARCH IS PRODUCED IN THE NAME AND ON BEHALF OF INVEST BANCA S.P.A. THAT IS ACTING AS SPECIALIST ON BIODUE SHARES
Transcript of Analysts A brisk walk, also thanks Valentina Romitelli to ... · Valentina Romitelli...

VALUETRACK
NOT FOR DISTRIBUTION IN OR INTO THE UNITED STATES, CANADA, JAPAN OR AUSTRALIAValueTrack | www.value-track.com |
ValueTrack | Update Report | 01 October 2018
BioDue Spa Sector: Healthcare
A brisk walk, also thanks to extracts
Analysts
Valentina Romitelli [email protected]
Marco Greco + 39 02 80886654 [email protected]
BioDue is a leading player in the Italian nutraceutical market. It develops, manufactures and distributes food supplements, cosmetics, medical devices and herbal products.
1H18 results reassuring on key points 1H18 interim results just reported provide evidence that: 1) the company keeps growing (Top line +13% YoY, +6% YoY organic), 2) margin upside is materializing (EBITDA margin +390bps; +290bps like for like), 3) the demanding capex plan is on track, and 4) small scale M&A is a feasible, value enhancing growth path (the small acquisition announced in July implies multiples well below Group and sector).
Forecasts (broadly unchanged) show 23% CAGR at EBITDA and 34% at adj. earnings into 2020 We have updated our 2018E-20E forecasts, with negligible impact on Top line and EBITDA, a 5-7% cut on 2018E-19E bottom line (driven by slightly higher amortization and taxes) and virtually unchanged FCF. New forecasts imply for the next three years a like for like CAGR of 8% and 23% for sales and EBITDA respectively, of 34% for adj. Net Profit and DPS doubling to €0.12 in 2019 from €0.06 in 2017. The cost of the July acquisition is factored as of FY18 (target not consolidated), yet BioDue should reduce its net debt to nil by 1H21, and this leaves room for further M&A, we believe.
Sector moving sideways in Europe, M&A supportive The reference sector has not performed well as a whole this year (US leaders being an exception), but a major acquisition announced in Italy so far – the merger of Innova Italy 1 SPAC with its target Fine Foods SpA - offers good support to the sector in terms of implied valuation. BioDue still trades at small discount to its peer group, albeit the valuation gap is narrowing. Fair value at €6.0 per share, potential catalysts ahead We leave unchanged our €6.0 Fair value per share, coming from the average between peer analysis and DCF model. At fair value the stock would trade at 10.4x EV/EBITDA and 18.1x P/E on 2018E. We believe the stock should catalyse increasing interest in the next months and re-rate further due to: 1) the release of full details in relation to the acquisition announced, 2) the acceleration of growth from next quarters, and 3) the strong FCF generation expected from 2019E.
Fair Value (€) 6.00
Market Price (€) 5.36
Market Cap. (€m) 59.8
KEY FINANCIALS (€’000) 2017A 2018E 2019E
REVENUES 36.3 41.8 45.1
EBITDA 4.6 7.3 8.4
EBIT 3.2 5.4 6.2
ADJ. NET PROFIT 2.1 3.7 4.1
EQUITY 20.5 23.7 26.7
NET FIN. POS. -6.1 -9.3 -5.5
EPS ADJ. (€) 0.19 0.33 0.37
DPS (€) 0.06 0.11 0.12 Source: BioDue (historical figures), Value Track (2018E-19E estimates)
RATIOS & MULTIPLES 2017A 2018E 2019E
EBITDA MARGIN (%) 12.6% 17.6% 18.6%
EBIT MARGIN (%) 8.7% 12.8% 13.7%
NET DEBT / EBITDA (x) 1.3 1.3 0.7
NET DEBT / EQUITY (%) 30% 39% 21%
EV/EBITDA (x) 13.8 9.4 7.9
EV/EBIT (x). 19.9 12.9 10.7
P/E ADJ. (x) 26.9 16.1 14.5
DIV YIELD (%) 1.2 2.1 2.2 Source: BioDue (historical figures), Value Track (2018E-19E estimates)
STOCK DATA
FAIR VALUE (€) 6.00
MARKET PRICE (€) 5.36
SHS. OUT. (m) 11.1
MARKET CAP. (€m) 59.8
FREE FLOAT (%) 21.0
AVG. -20D VOL. ('000) 12,000
RIC / BBG BIO2.MI / BIO2 IM
52 WK RANGE 4.84-7.10 Source: Stock Market Data
THIS EQUITY RESEARCH IS PRODUCED IN THE NAME AND ON BEHALF OF INVEST BANCA S.P.A. THAT IS ACTING AS SPECIALIST ON BIODUE SHARES

VALUETRACK
NOT FOR DISTRIBUTION IN OR INTO THE UNITED STATES, CANADA, JAPAN OR AUSTRALIA
BioDue SPA | Update Report | 01 October 2018
2
Business Description BioDue is a leading player in the Italian nutraceutical market: it develops, manufactures and distributes food supplements, cosmetics, medical devices and herbal products. It operates as a manufacturer for third parties (national and international pharmaceutical players) as well as for its own brands, Pharcos, BiOfta and Selerbe with a well-defined focus on dermatological, ophthalmic and herbal products respectively. It is also a supplier of vegetal extracts (LaBiotre), ranging from liquid extracts to soft and granular dry extracts. The main distribution channel for all BioDue products is the pharmacy/parapharmacy channel, and in marginal part herbalists, mostly served with private labels.
Shareholders Structure
Vanni Benedetti37.2%
Ruffo Benedetti23.2%
Pierluigi Guasti18.1%
Free float21.0%
Treasury shares0.5%
Source: BioDue SpA
Key Financials €’000 2017A 2018E 2019E 2020E
Net Revenues 36.3 41.8 45.1 48.7
Chg. % YoY 5% 15% 8% 8%
EBITDA 4.6 7.3 8.4 9.8
EBITDA Margin (% of Net Revenues) 12.6% 17.6% 18.6% 20.2%
EBIT 3.2 5.4 6.2 7.6
EBIT Margin (% of Net Revenues) 8.7% 12.8% 13.7% 15.6%
Net Profit 4.1 3.7 4.1 5.0
Chg. % YoY 87% -10.% 11% 11%
Adjusted Net Profit 2.1 3.7 4.1 5.0
Chg. % YoY -4% 75% 11% 22%
Net Fin. Debt 6.1 9.3 5.5 1.5
Net Fin. Debt / EBITDA (x) 1.3 1.3 0.7 0.2
Capex 2.3 5.6 1.1 1.3
OpFCF b.t. 0.8 0.5 7.1 7.7
OpFCF b.t. as % of EBITDA 18.5% 7.0% 84.7% 78.8%
Source: BioDue SpA (historical figures), Value Track (estimates)
Sales breakdown by product line
Industrial51.6%
Pharcos19.0%
BiOfta 6.9%
Selerbe15.2%
LaBiotre6.7%
Others0.5%
Source: BioDue SpA
Sales breakdown by geography
Italy85.8%
Abroad14.2%
Source: BioDue SpA
Investment case Strengths / Opportunities
® Leading player in the Italian nutraceutical market with young and committed shareholders and management;
® High level of diversification (clients, functional areas, products);
® Highly attractive reference market, seen keep growing in coming years;
® Demanding investment phase due to end in 2H18;
Weaknesses / Risk
® Increasing competition from large multinational of the pharma industry;
® Potential risks from possible introduction of stricter rules for “hybrid products” (e.g. food supplements) and liberalization of pharmacy sector.
Stock multiples @ €6.0 Fair Value
2018E 2019E
EV / SALES (x) 1.8 1.6
EV / EBITDA (x) 10.4 8.7
EV / EBIT (x) 14.3 11.8
EV / CAP.EMP. (x) 2.3 2.3
OpFCF Yield (%) 0.7 9.7
P / E (x) 18.1 16.3
P / BV (x) 3.1 2.7
Div. Yield. (%) 1.8 2.0
Source: Value Track

VALUETRACK
NOT FOR DISTRIBUTION IN OR INTO THE UNITED STATES, CANADA, JAPAN OR AUSTRALIA
BioDue SPA | Update Report | 01 October 2018
3
BioDue at a glance Leading player in the Italian nutraceutical market high BioDue is a leading player in the Italian nutraceutical market which develops, manufactures and distributes solid and liquid food supplements, herbal supplements, cosmetics and medical devices. It operates as a manufacturer for third parties (national and international pharmaceutical players) as well as for its own brands. In addition, the company is also involved in the production of Private Labels for the retail market (pharmacies, parapharmacies and herbalist’s shop).
Headquartered in Tavarnelle Val di Pesa (Florence), BioDue employs more than 180 people and is organized in three main divisions:
1. Industrial division - (51.6% of Total Sales in 1H18, €10.8mn), is the internal division active in the production on behalf of third parties, both national and international pharmaceutical companies, of liquid and solid food supplements, cosmetics, medical devices and herbal products in different forms like drops, capsules, tablets, bags, powders, vials, skin gels, creams and spray.
2. Own brands - (41.1% of Total Sales in 1H18, €8.6mn), is dedicated to the production and marketing of its own brands’ products, with a well-defined focus on dermatological, ophthalmic and herbal products, and of products under pharmacies' and herbalists' private labels.
BioDue: Own brands division
Pharcos, operating since the early nineties is the brand dedicated to dermatology. Thanks to its innovation, its line of dermocosmetic products, food supplements and medical devices are currently available across 20 countries worldwide. Pharcos revenues in 1H18 accounted for ca. €4.0mn, corresponding to 19% of Group Total Sales
BiOfta, is the brand dedicated to ophthalmology. Its products consist of a range of food supplements specific to each eye area as well as more innovative products like ophthalmic cosmetics for “care” of the periocular area Products under this brand contributed to Group Net Sales in 1H18 for ca. 6.9% (€1.4mn)
Selerbe, is the brand dedicated to herbal medicine, with products and extracts from vegetables, aromatic and medicinal herbs. It also provides tailored production of private labels to pharmacies, parapharmacies and herbalist’s shops. In 1H18 achieved €3.2mn (15.2% of Group Net Sales).
Source: Value Track Analysis
3. LaBiotre - (6.7% of Total Sales in 1H18, i.e. €1.4mn) is a supplier of vegetal extracts ranging from liquid extracts (alcohol, glycol, hydroglyceric, etc.) to soft extracts and granular dry extracts.
An hybrid and diversified player BioDue management has always been keen to maintain a strong diversification within the industrial division and among different divisions. As a pure manufacturer, BioDue strategy has always been focused in offering a wide and high quality product, with innovative production processes, top quality control standards, flexibility and long lasting transparent relationships which enable BioDue to run this business in combination with its B2C activity. This includes the lack of overlapping products and precise procedures to protect clients' intellectual properties and data, as well as their commercial position.

VALUETRACK
NOT FOR DISTRIBUTION IN OR INTO THE UNITED STATES, CANADA, JAPAN OR AUSTRALIA
BioDue SPA | Update Report | 01 October 2018
4
On the “Own brand” division, BioDue has several products covered by proprietary patent and group’s strategy remains consistent with the past, that is, based on the launch of new products within the current functional areas and keeping critical attention to quality standards.
That said, the hybrid nature and the diversified model of BioDue are quite peculiar and have three main implications: (i) reduced risk profile towards single clients, market technologies, product segments and regulation, (ii) stabilized profitability, due to fragmented client base and minimal exposure to long term contracts and (iii) reduced profitability potential, as a “side-effect” of high flexibility, diversification and relatively small scale of each business units.
The main distribution channel for all BioDue products is the pharmacy/parapharmacy channel - and in marginal part herbalists, mostly served with private labels. BioDue lines are supported by typical pharma marketing, i.e. products are promoted by a network of MSIs with the physicians (dermatologists and ophthalmologists in particular).
BioDue: product lines classified by brand, customer type and distribution channel
Division Brand
Product lines Customer type /mktg channel
Pharma Mktg
Dietary supplements Cosmetic Herbal
products Medical devices
Vegetal extracts Liquid Solid
Industrial (B2B) - ✓ ✓ ✓ ✓ ✓ ca. 130 clients (pharma)
Own brands & Private Label
Pharcos ✓ ✓ ✓ Wholesalers / Distributors
40 MSIs
BiOfta ✓ ✓ ✓ Selerbe ✓ ✓ ✓ ✓ ✓ Pharmacies,
Herbalists 30 agents
Private Label ✓ ✓ ✓ ✓ ✓
LaBiotre (B2B) - ✓ pharma. companies
Source: Value Track Analysis
Reference markets expected to accelerate in coming years The main reference markets for BioDue is the nutraceutical one (the products of this segment represent ca. two thirds of Group's total revenues), while the remaining is made in the cosmetic segment (cosmeceutical in particular).
BioDue’s reference market in a picture: "not just" personal care, "not just" food
Source: Value Track Analysis
The nutraceutical industry includes functional food & beverages and dietary supplements - i.e. products like multivitamin tablets or capsules for rebalancing pigmentation disorders (in the form of
PersonalCare
Pharmaceuticals
Nutrition
Cosmeceuticals
Nutricosmetics
Nutraceuticals
Food&liquidsupplements
Medicaldevices
Herbalsupplements
BioDue activitiesarefocusedonthesemarketsegments

VALUETRACK
NOT FOR DISTRIBUTION IN OR INTO THE UNITED STATES, CANADA, JAPAN OR AUSTRALIA
BioDue SPA | Update Report | 01 October 2018
5
tablets, capsules and liquids) - and medical devices, with key ingredients being pre-biotic and pro-biotic vitamins, minerals, fibres, proteins, omega3 and structured lipids, amino acids and others. The global nutraceutical market was valued at around 383 USD bn in 2016 and is expected to reach around 561 USD bn by 2022, at a CAGR of 6.8% (source: Mordor Intelligence). As concern the European field, the market value is expected to grow at a steady and health rate, with a CAGR 17-21 of ca. 4.2% (source: Euromonitor, Fine Foods / Innova Italy 1 presentation).
Cosmeceutical products are characterized as cosmetic products with biologically active ingredients claiming to have medical or drug-like benefits. Currently, much of the innovation in this field is being carried out by cosmetic companies who are investing heavily in R&D for cosmeceuticals, in a manner more typical of pharmaceutical companies. On the other side, pharmaceutical companies are competing to jump into the cosmetics business by releasing cosmeceuticals products. We are talking about a large market, growing in value and volumes, increasingly crowded and with a high level of innovation, also in Italy. Looking at the different product lines, skin care is the dominant segment, followed by hair care and injectable. The global cosmeceuticals market was valued at $47bn in 2017, and is expected to grow at a CAGR 2018-2023 of 9.4%, reaching a value of $80bn.
Group structure and related companies In the last two years, BioDue has carried on a modernization process, aiming at increasing its output capacity and vertical integration, improving logistical and distributive activities and expanding its geographic footprint. Indeed, several efforts and sizeable investments have been finalized, leading to a new organizational structure.
BioDue: Group structure as of September 2018
BioDueS.p.A.
Farcoderma43.4%
Pharcomed Corp. 50.0%
Two Bee S.r.l.50.0%
LaBiotre 51.2%
Pharcomed Mexico SA 50%
Source: Value Track Analysis.. Companies in light blue are consolidated on a line by line basis starting as of 1/1/2018
Consolidated and related companies are totally functional to BioDue business. In particular:
® LaBiotre S.r.l. was born in 2011 from the joint efforts of a group of experienced professionals, working in the botanicals' extraction and food supplement formulation. LaBiotre production is only partially devoted to the Group, with a fast growing business related to third parties.
® Pharcomed Corp, together with Pharmacomed Mexico, is a JV with an exclusive license to distribute Pharcos’ products in the Americas through 1) the pharmaceutical marketing channel, 2) the retail distribution and 3) the e-Commerce channel.
® Two Bee S.r.l. is a JV established in to realize a new industrial plant in Albania for the production of pharmaceutical capsules and tables. Investments for the new 2100sqm production plant should start within 2018 year-end and first output is expected in 2019.
® Farcoderma, is a small player. BioDue announced the acquisition of a ca. 43% stake in July 2018, but talks are still in progress in order to purchase a further stake and reach control of the company, albeit retaining the founder and owner of Farcoderma to manage the company.

VALUETRACK
NOT FOR DISTRIBUTION IN OR INTO THE UNITED STATES, CANADA, JAPAN OR AUSTRALIA
BioDue SPA | Update Report | 01 October 2018
6
What about BioDue in 1H18 As detailed in our Initiation of Coverage report published back on May 2018, FY2017 has been an intensive and eventful year for BioDue. This trend continued across 1H18, in particular additional changes have occurred, both on the commercial / business side, as well as in terms of financial efforts (financial investments and capex).
Brief recap on key recent industrial events The main points worthy to mention are:
® A reinforced management structure and a renewed corporate governance;
® The approval of a buyback program and of a stock option plan;
® New certificate for the development and production of medical devices.
Reinforced management structure and renewed corporate governance As of February, the company has strengthened its managerial structure, aiming at promoting the commercial development of its own brands and boosting growth, through: (i) the appointment as CFO of the previous Administrative Director, Mr. Emanuele Angellotto, in BioDue since 2010 as tax, finance and account manager, and (ii) the recruitment of three new managers with track record in the pharmaceutical sector, appointed as Director of Business Development, Operations Director for Pharcos Italia and Operations Director for BiOfta Italia.
Also the Board of Directors has been renewed, and currently includes: (i) Mr. Vanni Benedetti as Chairman, with significant experiences in production plants & processes management, in business strategy and dietary foods and cosmetics markets as well, (ii) Mr. Enrico Russo as Vice President, with deep knowledge in dietary food products and (iii) Mr. Roberto Nisica and Mr. Luca Sforazzini as Board members, with long managerial experiences in the pharmaceutical packaging sector and liquid dietary foods production respectively.
Approval of a buyback program and of a stock option plan The BoD took relevant decisions regarding:
® Buyback program. As of April 26th, shareholders signed an agreement through which the company commits to repurchase (within 18 months) a maximum of 200,000 shares, equal to 1.79% of BioDue’s share capital, for an amount not exceeding €1.5mn. The ratio behind this buyback agreement is the set up of a securities warehouse, coherent with company’s future strategies (i.e. possible extraordinary transactions or strategic agreements, including the assignment within loyalty retention plans to strength commercial relationships);
® Stock Option Plan. Shareholders approved the 2018-2020 Stock Option plan, through a share capital increase of ca. €1.5mn and the issue of 300,000 new ordinary shares with no nominal value. This share incentive plan will involve employees, directors and partners, aiming at strengthening their sense of belonging and involvement, improving company's performances, and it will increase the company's appeal to new potential professionals in the industry.
New certificate for the development and production of medical devices BioDue achieved the EN ISO 13485 certificate for its plant in via Caravaggio in Tavarnelle Val di Pesa (FI), for the development and production of medical devices for oral, nasal, topical and vaginal uses in different forms (solid, semisolid and liquid). The certification, necessary for the registration and sale of the above medical devices in some important and growth potential markets such as Russia, Saudi Arabia, Yemen, United Arab Emirates and Lebanon, concerns the management of the entire production and distribution chain, from the procurement of raw materials, to the production, traceability, logistics, up to the management of human resources and contracts.

VALUETRACK
NOT FOR DISTRIBUTION IN OR INTO THE UNITED STATES, CANADA, JAPAN OR AUSTRALIA
BioDue SPA | Update Report | 01 October 2018
7
1H18 financial performance BioDue’s 1H18 results recorded a sound growth in all industrial KPIs, with main P&L figures growing at double-digit rate, as a result of both organic and external growth (i.e. LaBiotre consolidation, as it was consolidated at equity in FY17 P&L, majority control achieved in December 2017 and consolidated on a line by line basis as of 1/1/2018).
That said, in order to better highlight the industrial performance of the Group we hereby provide also some pro-forma figures including the business to third parties carried by LaBiotre (as reported in 1H17 interim report).
BioDue: Key Financials 1H17 &1H18
(€mn) 1H17 1H18 YoY (%)
Total Revenues 18.6 20.9 +13%
COGS -12.8 -13.5 +5%
Labour costs -2.9 -3.4 +17%
Other Operating Costs -0.5 -0.6 +9%
EBITDA 2.4 3.5 +47%
EBITDA margin (%) 13.0% 16.9% +390bps
D&A -0.7 -1.0 +47%
EBIT 1.7 2.5 +46%
EBIT margin (%) 9.4% 12.2% +280bps
Net Financial Charge -0.1 -0.1 -24%
Non-Recurring Items 0.1 0.0 n.m.
Taxes -0.6 -0.6 +16%
Minorities 0.0 -0.1 n.m.
Net Profit 1.2 1.8 +44%
Total Revenues PF(*) 19.8 20.9 +6%
EBITDA PF(*) 2.8 3.5 +28%
EBITDA margin (%) 14.0% 16.9% +290bps
EBIT PF(*) 2.0 2.5 +28%
Group’s Equity 15.6 21.6 n.m.
Net Financial Position -7.0 -9.8 n.m.
OpFCF a.t. -1.7 -2.7 -52%
Source: Company figures, Value Track Analysis (*)Pro-Forma figures by Value Track (consolidation of LaBiotre as of 1.1.2017)
Key messages of 1H18 figures 1. Double-digit growth in Revenues from sales (+13% YoY);
2. Profitability is now proven, but the best is yet to come;
3. Net financial debt at ca. €10mn, strongly affected LaBiotre development Capex (i.e. €4.1mn).

VALUETRACK
NOT FOR DISTRIBUTION IN OR INTO THE UNITED STATES, CANADA, JAPAN OR AUSTRALIA
BioDue SPA | Update Report | 01 October 2018
8
Double-digit growth in Revenues from sales (+13% YoY) Reported Revenues from sales reached ca. €20.9mn in 1H18, +13.3% YoY, while on a Pro-forma basis Total Revenues increased by 6.4% YoY, with the difference vs. reported figures being due to LaBiotre consolidation.
As widely discussed in our Initiation of coverage, revenues analysis in the first half of the year provides some evidence of the viability of company strategy aimed at promoting the commercial development of own brands and exploiting LaBiotre growth opportunities. In particular, by looking at the specific business lines, we highlight:
• The “Industrial” division increased revenues by 3% YoY in 1H18, growing at +9% in 1Q18 followed by a slight decrease across 2Q18 mainly due to some stop & go and inefficiencies in the production process;
• The “Own brands” division registered an organic and healthy growth (+8.1%), in particular: o Selerbe achieved ca. €3.2mn in 1H18 (+15.9% YoY), mainly thanks to revenues deriving
from the “private label” business, i.e. sales of customized products to pharmacies and herbalist shops;
o BiOfta is continuing to grow at double-digit rate, reaching ca. €1.4mn in 1H18 (+11.4% YoY), mainly due to the increasing penetration and recognition of the brand in the ophthalmologist specialist channel;
o Pharcos recorded the lowest growth (+1.5% YoY) at ca. €4.0mn, denoting a small deceleration across 2Q18, mainly attributable to some inefficiencies which arose from the management reorganization at Pharcos Italia, and a slight contraction in market demand.
• LaBiotre added ca. €1.4mn to BioDue’s topline in 1H18, showing a relevant organic growth (+20% YoY), thanks to an enlarged sales network and an improved managerial structure through the appointment of a new manager.
BioDue: Revenues evolution by divisions
(€’000) 1Q17 2Q17 1H17 1Q18 2Q18 1H18
Industrial division 5,085 5,383 10,468 5,544 5,237 10,781
YoY Change (%) nm nm nm 9.0% -2.7% 3.0%
Selerbe 1,428 1,311 2,739 1,650 1,525 3,175
YoY Change (%) nm nm nm 15.5% 16.3% 15.9%
Pharcos 1,341 2,573 3,914 1,407 2,567 3,974
YoY Change (%) nm nm nm 4.9% -0.2% 1.5%
BiOfta 501 792 1,293 553 888 1,441
YoY Change (%) nm nm nm 10.4% 12.1% 11.4%
Own brands division 3,270 4,676 7,946 3,610 4,980 8,590
YoY Change (%) nm nm nm 10.4% 6.5% 8.1%
Other Sales 3 47 50 10 97 107
Revenues from Sales (ex LaBiotre) 8,358 10,106 18,464 9,164 10,314 19,478
YoY Change (%) nm nm nm 9.6% 2.1% 5.5%
LaBiotre 584 824 1,408
YoY Change (%) nm nm 20.0%
Total Revenues from Sales 8,358 10,106 18,464 9,748 11,138 20,886
YoY Change (%) nm nm nm 16.6% 10.2% 13.3%
Source: Company figures, Value Track Analysis

VALUETRACK
NOT FOR DISTRIBUTION IN OR INTO THE UNITED STATES, CANADA, JAPAN OR AUSTRALIA
BioDue SPA | Update Report | 01 October 2018
9
BioDue: Revenues by business division (1H17 vs. 1H18)
BioDue 1H17 BioDue 1H18vvv
Source: Company figures, Value Track Analysis
Last consideration concerns the geographical distribution, with foreign revenues posting a 33% YoY growth to ca.€3mn, consistently with strategic goal of strengthening the internationalization process and entering new markets. The net increase in foreign sales is entirely attributable to the own brands division (ca. €0.5mn, + 68.8% YoY), in particular due to the JV Pharcomed active in the Americas.
Margin expansion is now on sight, but the best is yet to come By looking at profitability, reported EBITDA came in at €3.5mn in 1H18 (+46.7% YoY), corresponding to an EBITDA margin of 16.9% (+390bps YoY). On a like for like basis, i.e. based on the same perimeter of consolidation, EBITDA “organic” growth is around 28% YoY with a margin expansion of 290bps.
The main drivers of profitability are the following:
® Consolidation of LaBiotre; ® Increasing contribution of own brand products, by nature more profitable than the industrial
division; ® Greater efficiencies achieved across the reorganized sales network; ® Organic growth, i.e. the improving scale, for the smaller product lines in particular.
As for operating costs, we highlight a sound and general improvement on main fronts:
1. A decrease of raw material costs as a percentage of sales, as a result of a better management of input factors. Raw materials account for 42.6% vs. 44.9% in 1H17 (-230bps YoY);
2. An important reduction in cost of services’ incidence on sales (-210bps YoY) due to the changes undertaken in sales strategy, leading to lower commissions to sales network;
3. A slight increase in labour costs, mainly attributable to Labiotre consolidation and to the strengthening of the management structure;
4. Other operating costs flat YoY, remaining a residual item.
56.7% 21.2%
7.0%
14.8%
51.6%
19.0%
6.9%
15.2%
6.7% Industrial
Pharcos
BiOfta
Selerbe
LaBiotre

VALUETRACK
NOT FOR DISTRIBUTION IN OR INTO THE UNITED STATES, CANADA, JAPAN OR AUSTRALIA
BioDue SPA | Update Report | 01 October 2018
10
BioDue: Opex structure 1H17 & 1H18 (€ mn) 1H17 1H18
Raw Materials & Consumables 8.4 8.9
Raw Materials & Consumables / Sales 44.9% 42.6%
Cost of Services 4.4 4.5
Cost of Services / Sales 23.8% 21.7%
Labour costs 2.9 3.4
Labour costs / Sales 15.5% 16.1%
Other Costs 0.5 0.6
Other Costs / Sales 2.1% 2.7%
Total Opex 16.2 17.4
As % of Revenues 87.0% 83.1%
Source: Company figures, Value Track Analysis
Below the EBITDA, we reckon an increase in D&A costs (+48% YoY), moving from €0.7mn to €1.0mn, attributable for ca. €0.1mn to LaBiotre depreciations and the remaining €0.2mn to PPA related higher amortization. EBIT reached €2.5mn, equivalent to an EBIT margin of 12.2% (+280bps YoY).
Bottom line also benefits from a lower tax rate: 26.1% in 1H18 vs. 31.4% in 1H17, since BioDue got access to the special regime for intellectual property (so called Patent Box).
BioDue: From EBITDA down to the Bottom Line 1H17 & 1H18 (€'000) 1H18 2H18 YoY (%)
EBITDA 2.4 3.5 46.7%
EBITDA margin 13.0% 16.9% +390bps
Depreciation on Tangible Assets -0.7 -0.8
Amortisation on Intangible Assets -0.0 -0.2
EBIT 1.7 2.5 46.3%
EBIT margin 9.4% 12.2% +280bps
Net Interest income / expense -0.1 -0.1
Non-Operating Income 0.1 0.0
Pre-tax profit 1.8 2.5 39.5%
Taxes -0.6 -0.6
Tax Rate -31.4% -26.1%
Net profit before minorities 1.2 1.8
Minorities 0.0 -0.1
Net Profit (Loss) 1.2 1.8 44.2%
Source: Company figures, Value Track Analysis
Balance sheet and Cash flow generation At the Balance Sheet / Cash Flow Statement level, we consider worthy of note the following items:
® Net Working Capital increased from €9.7mn at FY17 year-end to €11.2mn in 1H18, as a result of an increase in volumes driven by the underlying business growth;
® A worsening in Net Financial Debt which stands at €9.8mn, ca. +€3.7mn with respect FY17. By looking at the operating cash flow, the Group faced €1.4mn cash absorption to working capital
VALUETRACK
NOT FOR DISTRIBUTION IN OR INTO THE UNITED STATES, CANADA, JAPAN OR AUSTRALIA
BioDue SPA | Update Report | 01 October 2018
11
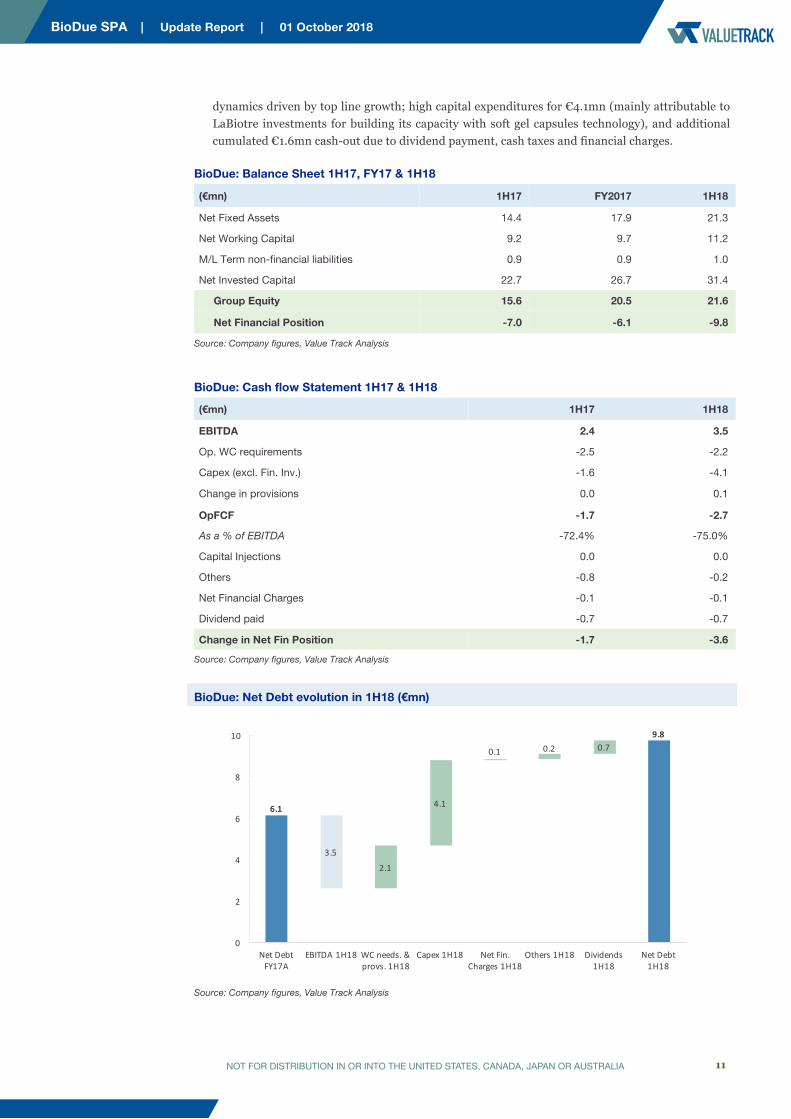
dynamics driven by top line growth; high capital expenditures for €4.1mn (mainly attributable to LaBiotre investments for building its capacity with soft gel capsules technology), and additional cumulated €1.6mn cash-out due to dividend payment, cash taxes and financial charges.
BioDue: Balance Sheet 1H17, FY17 & 1H18
(€mn) 1H17 FY2017 1H18
Net Fixed Assets 14.4 17.9 21.3
Net Working Capital 9.2 9.7 11.2
M/L Term non-financial liabilities 0.9 0.9 1.0
Net Invested Capital 22.7 26.7 31.4
Group Equity 15.6 20.5 21.6
Net Financial Position -7.0 -6.1 -9.8
Source: Company figures, Value Track Analysis
BioDue: Cash flow Statement 1H17 & 1H18
(€mn) 1H17 1H18
EBITDA 2.4 3.5
Op. WC requirements -2.5 -2.2
Capex (excl. Fin. Inv.) -1.6 -4.1
Change in provisions 0.0 0.1
OpFCF -1.7 -2.7
As a % of EBITDA -72.4% -75.0%
Capital Injections 0.0 0.0
Others -0.8 -0.2
Net Financial Charges -0.1 -0.1
Dividend paid -0.7 -0.7
Change in Net Fin Position -1.7 -3.6
Source: Company figures, Value Track Analysis
BioDue: Net Debt evolution in 1H18 (€mn)
6.1
9.8
3.5
2.1
4.1
0.1 0.2 0.7
0
2
4
6
8
10
NetDebtFY17A
EBITDA1H18 WCneeds.&provs.1H18
Capex1H18 NetFin.Charges1H18
Others1H18 Dividends1H18
NetDebt1H18
Source: Company figures, Value Track Analysis

VALUETRACK
NOT FOR DISTRIBUTION IN OR INTO THE UNITED STATES, CANADA, JAPAN OR AUSTRALIA
BioDue SPA | Update Report | 01 October 2018
12
2018E-onwards financial forecasts
Relevant events occurred after June 2018
Acquisition of a minority stake in Farcoderma BioDue has recently announced the acquisition of a minority stake (43.42%) in Farcoderma S.r.l., a company which develops and manufactures food supplements, medical devices and cosmetics products for third parties. Production and logistics are currently all located in a single plant of ca. 1,500sqm in Calcio (Bergamo), but a second production plant of ca. 5,000sqm located in Torre Pallavicina, a few miles away, is expected to be finished by year-end.
Founded in 2006, Farcoderma started its activity with the production of tooth pastes and powders. Over the years, Farcoderma has always been careful to adapt its products to market developments by providing timely and appropriate responses to its customers, becoming an important player both in the domestic market and abroad.
Farcoderma registered in FY17 Revenues from Sales of ca. €6.0mn and EBITDA of ca. €1.6mn, (EBITDA margin around 27%).
The terms of the deal suggest BioDue has finalized the acquisition of a 43.42% stake for an equivalent amount of €1.35mn, based on a net debt position of €0.7mn. However, the two companies are currently in the middle of a negotiation phase which should lead to the sharing of a business plan, as well as to the acquisition of the controlling stake in Farcoderma by BioDue.
The additional cost BioDue will sustain for the acquisition should not exceed €1.65mn (to be paid in cash). At this stage the only consideration we can draw on the price of the deal is that, based on the maximum price set (total consideration of €3mn) and on the minimum stake to be acquired to get control (5x1%), the valuation should not exceed 2017 EV/Sales of 1.1x and EV/EBITDA of 4.2x.
The deal is expected to be completed in the next months and it is reasonable to expect material synergies to arise from operations (manufacturing and logistics in primis), as confirmed by BioDue’s Chairman, Vanni Benedetti, who considers the operation a relevant growth opportunity for the group.
For the time being we only incorporate in our revised Cash Flow Model and Net Financial Position the acquisition of the minority stake (considered as a “peripheral asset”), with no direct impact on P&L.
New agreement for exclusive license and supply BioDue has signed an exclusive license and supply agreement with a global healthcare company for the commercialization of a patented medical device in the respiratory function, across several countries among which Russia, Ukraine and CIS countries.
In other words, under this agreement the licensee will take care of the distribution, commercialization and promotion activities, while BioDue will act as product manufacturer. On the base of this five-year partnership, BioDue expects a cumulated potential turnover of ca. €4.0mn.
REWCAPTM patent gets twenty-year grant for the Chinese market The company announced it has obtained the twenty-year license of REWCAPTM patent for the Chinese market. BioDue is already active in China with REWCAPTM, since it has previously signed an important contract with a leading Chinese pharmaceutical multinational for the supply of both first production machines that use REWCAPTM, and first quantities of REWCAPTM packaging.

VALUETRACK
NOT FOR DISTRIBUTION IN OR INTO THE UNITED STATES, CANADA, JAPAN OR AUSTRALIA
BioDue SPA | Update Report | 01 October 2018
13
Updated 2018-2020E forecasts The reassuring first half results are broadly consistent with our FY 2018E projections and the outlook remains unchanged compared to the one depicted in our Initiation of coverage (May 2018).
That said, we are going to update our 2018E-20E forecasts, as some fine tuning is required due to the following factors:
® D&A charges being revised slightly upwards, driven by the higher impact of LaBiotre consolidation, due to its asset value reassessment (PPA);
® Forecasted tax rate revised slightly up for current year (27%) and reduced in 2019-20 (from previous 32% estimate to ca. 30%) due to the potentially higher benefits of the Patent Box;
® Slightly higher minorities, due to the stronger performance of LaBiotre (51.2% owned);
® Increase in Net Financial Debt due to the above mentioned acquisition of a minority stake in Farcoderma (€1.35mn cash out).
Please refer to our Initiation of coverage, for other key assumptions on financial model and industrial drivers behind BioDue business development. As anticipated, our forecasts are based on the current perimeter of consolidation, i.e. Farcoderma contribution and synergies have not been considered.
BioDue: New vs. Old estimates 2018E 2019E 2020E
(€mn) Old New Change Old New Change Old New Change
Total Revenue from Sales 42.0 41.8 -0.5% 45.3 45.1 -0.5% 49.0 48.7 -0.6%
EBITDA 7.3 7.3 +0.4% 8.3 8.4 +0.5% 9.8 9.8 +0.6%
EBITDA margin 17.4% 17.6% nm 18.4% 18.6% nm 19.9% 20.2% Nm
EBIT 5.6 5.4 -4.5% 6.3 6.2 -2.5% 7.7 7.6 -1.8%
EBIT margin 13.4% 12.8% nm 14.0% 13.7% nm 15.7% 15.6% Nm
Net Profit 4.0 3.7 -7.6% 4.3 4.1 -5.2% 5.0 5.0 -0.1%
Group Net Equity 23.9 23.7 nm 27.1 26.7 nm 31.1 30.8 nm
Net Fin. Pos. -7.5 -9.3 nm -4.3 -5.5 nm -0.6 -1.5 nm
Source: Value Track Analysis
Income statement 2018E-20E As far as P&L forecast are concerned, our 2018E-20E estimates can be summarized as follows:
® Total Revenues from Sales are expected to grow at 11% CAGR over the next three years based on 2017A reported figures, or ca.8% on a Pro-Forma basis, thus reaching ca. €49mn in 2020E. In particular, we expect:
o LaBiotre to experience the highest CAGR (ca. 26%), mainly due to the finalization of production capacity expansion and new products launch;
o The own brands division to increase with a CAGR of ca.9% (ca. €20.9mn in 2020E), sustained by an increase in foreign sales and a product range expansion after well-defined investments, reorganization of sales network and management restructuring;
o The industrial division to grow at low single-digit with a 5% CAGR, reaching ca. €22.7mn., achievable thanks to higher manufacturing capacity, new customer acquisitions and a minor

VALUETRACK
NOT FOR DISTRIBUTION IN OR INTO THE UNITED STATES, CANADA, JAPAN OR AUSTRALIA
BioDue SPA | Update Report | 01 October 2018
14
effect from licensing agreements (previously leading to royalties’ income, included in other revenues).
® Enhancing profitability dynamics, with EBITDA expected to increase at double-digit rate and EBITDA margin in 2020E expected at 20.2%, according to the following key drivers:
o Exploiting operating leverage in the industrial division, resulting from a mix effect of increasing volumes and controlled fixed costs;
o Higher contribution from the own brands division, with a positive impact on Group’s margin in itself and a further benefit on brands’ profitability thanks to improving scale of smaller lines in particular;
o Key contribution from LaBiotre, expected to experience an EBITDA margin above 38% in 2020E (from 32% in FY2018), as result of above mentioned investment projects.
BioDue: Income Statement 2017A-2020E
(€mn) 2017A 2017PF* 2018E 2019E 2020E Total Revenues from Sales 36.3 38.7 41.8 45.1 48.7
COGS -25.2 -26.8 -28.8 -30.9 Gross profit 10.1 14.9 16.2 17.8 Gross margin 28.4% 35.7% 36.0% 36.5%
Labour costs -5.6 -6.7 -7.0 -7.1
Other costs -0.9 -0.9 -0.9 -0.9
EBITDA 4.6 5.2 7.3 8.4 9.8 EBITDA margin 12.6% 13.5% 17.6% 18.6% 20.2%
D&A -1.4 -1.8
EBIT 3.2 3.4 5.4 6.2 7.6 EBIT margin 8.9% 8.8% 12.8% 13.7% 15.6%
Net Financial Charge -0.2 -0.2 -0.2 -0.1
Non-Recurring and other Items 2.2 0.0 0.0 2.2
Taxes -1.0 -1.2 -1.0 -1.0
Minorities 0.0 -0.1 -0.2 -0.3
Net Profit (Loss) 4.1 3.7 4.1 5.0
Adjusted Net Profit 2.1 3.7 4.1 5.0
Source: Company figures, Value Track Analysis * Pro-Forma figures by Value Track
BioDue: Revenues contribution forecasts (2017PF vs. 2020E)
Vvvv BioDue in FY17 PF vv BioDue in 2020Evvv
46.6%
19.8%
8.0%
14.9%
10.3%
Industrial
Pharcos
BiOfta
Selerbe
LaBiotre
51.0%
21.5%
7.1%
14.0%
6.4%
Source: Company figures, Value Track Analysis

VALUETRACK
NOT FOR DISTRIBUTION IN OR INTO THE UNITED STATES, CANADA, JAPAN OR AUSTRALIA
BioDue SPA | Update Report | 01 October 2018
15
High cash-conversion leads to an average dividend per share of €0.12 per year As for Balance Sheet and Cash Flow statement forecasts, we underline:
® Capex expected at €5.6mn in 2018E, of which €4.1mn already faced in 1H18;
® Reduced Capex over 2019-20E, with favorable working capital dynamics after "peak" in 2017;
® Cash Conversion before taxes at ca. 80% (i.e. OpFCFb.t./EBITDA);
® Attractive EFCF expected at ca. €5.4mn per year (average 2019E-20E), following the completion of the Group strengthening plan;
® €3.2mn of dividends across next three years (i.e. payout ratio about 30%);
® Net Financial Debt expected close to zero as of 2021E.
BioDue: Balance Sheet 2017A-20E
(€mn) 2017A 2018E 2019E 2020E
Net Fixed Assets 17.9 23.0 22.1 21.4
Net Working Capital 9.7 11.0 11.4 12.3
Severance pay and other funds 0.9 1.1 1.2 1.4
Total Capital Employed 26.7 33.0 32.2 32.3
o/w Group Net Equity 20.5 23.7 26.7 30.8
Net Fin. Position [Net debt (-) / Cash (+)] -6.1 -9.3 -5.5 -1.5
Source: Company figures, Value Track Analysis
BioDue: ROCE b.t. 2015A-20E
15.820.4
26.7
33.0 32.2 32.3
23%
16%
12% 16%
19%
23%
0%
5%
10%
15%
20%
25%
0.0
5.0
10.0
15.0
20.0
25.0
30.0
35.0
2015 2016 2017 2018E 2019E 2020E
€mn
Total Capital Employed (lhs) ROCE (%) before tax (rhs)
Source: Company figures, Value Track Analysis By looking at the graph, it can be noticed that return on invested capital moved from 23% of 2015 to 12% in 2017 (13% on a pro-forma basis). This is attributable mainly to the expansion of invested capital (mostly fixed assets), due to the extraordinary investment activity carried out by the company over the last two years, combined with its short-term negative implications on productivity.
We expect ROCE to come back to 2015 levels, as margins start benefitting from increased capacity, productions brought in-house and consolidation and growth of LaBiotre.

VALUETRACK
NOT FOR DISTRIBUTION IN OR INTO THE UNITED STATES, CANADA, JAPAN OR AUSTRALIA
BioDue SPA | Update Report | 01 October 2018
16
BioDue: Cash Flow Statement 2017A-20E
(€mn) 2017A 2018E 2019E 2020E
EBITDA 4.6 7.3 8.4 9.8
Op. WC requirements -1.5 -1.3 -0.3 -0.9
Capex (excl. Fin. Inv.) -2.3 -5.6 -1.1 -1.3
Change in provisions 0.0 0.1 0.1 0.1
OpFCF b.t. 0.8 0.5 7.1 7.7
As a % of EBITDA 18.5% 7.0% 84.7% 78.8%
Cash Taxes -1.0 -1.4 -1.8 -2.3
OpFCF a.t. -0.2 -0.9 5.2 5.5
As a % of EBITDA -4.3% -12.3% 62.8% 55.5%
Capital Injections 0.0 0.0 0.0 0.0
Other (incl. Fin. Inv.) 0.3 -1.4 0.0 0.0
CF available to serve debt / equity investors 0.1 -2.3 5.2 5.5
Net Financial Charges -0.2 -0.2 -0.2 -0.1
Dividend paid -0.7 -0.7 -1.2 -1.3
Change in Net Fin Position -0.8 -3.1 3.8 4.0
Source: Company figures, Value Track Analysis
BioDue: Net Debt evolution 2018E-20E (€mn)
9.8 9.3
+2.6 1.5
+1.0
+2.4
+4.5-18.2
-10
-7
-4
-1
2
5
8
11
NetDebt1H18
NetDebtFY18E
EBITDA19E-20E
WCneeds.&provs.19E-
20E
Capex19E-20E
CashTaxes&NetFin.Cha.19E-20E
Dividends19E-20E
NetDebt2020E
Source: Value Track Analysis

VALUETRACK
NOT FOR DISTRIBUTION IN OR INTO THE UNITED STATES, CANADA, JAPAN OR AUSTRALIA
BioDue SPA | Update Report | 01 October 2018
17
Valuation Update Taking into account the revised 2018E-20E forecast on the one side and updated sector multiples / DCF results on the other, we confirm a fair value of €6.0 per share, unchanged if compared to our Initiation of coverage report, published back as of May 28th. Such a fair value substantially comes from the average between Peers analysis and DCF model.
BioDue: Sensitivity of implicit stock trading multiples in the €5.2 - €7.0 share price range
Share price
(€)
Market Cap
(€mn)
EV* (€mn) EV / Sales EV / EBITDA EV / EBIT P / E P / B
2018E 2019E 2018E 2019E 2018E 2019E 2018E 2019E 2018E 2019E 2018E 2019E 5.20 58.0 67.6 64.0 1.6 1.4 9.2 7.7 12.6 10.4 15.7 14.1 2.7 2.4
5.40 60.2 69.8 66.3 1.7 1.5 9.5 7.9 13.0 10.8 16.3 14.6 2.8 2.5
5.60 62.4 72.0 68.5 1.7 1.5 9.8 8.2 13.5 11.1 16.9 15.2 2.9 2.6
5.80 64.7 74.3 70.7 1.8 1.6 10.1 8.5 13.9 11.5 17.5 15.7 3.0 2.6
6.00 66.9 76.5 73.0 1.8 1.6 10.4 8.7 14.3 11.8 18.1 16.3 3.1 2.7
6.20 69.1 78.7 75.2 1.9 1.7 10.7 9.0 14.7 12.2 18.7 16.8 3.2 2.8
6.40 71.4 80.9 77.4 1.9 1.7 11.0 9.3 15.1 12.6 19.3 17.4 3.3 2.9
6.60 73.6 83.2 79.6 2.0 1.8 11.3 9.5 15.5 12.9 19.9 17.9 3.4 3.0
6.80 75.8 85.4 81.9 2.0 1.8 11.7 9.8 16.0 13.3 20.5 18.4 3.5 3.1
7.00 78.0 87.6 84.1 2.1 1.9 12.0 10.1 16.4 13.7 21.1 19.0 3.6 3.2
Source: Value Track Analysis BioDue *EV includes Farcoderma stake (€ 1.4mn) as a peripheral asset
Peers analysis As highlighted in our Initiation of coverage, it is not so easy to identify peers with a business model perfectly aligned to BioDue, with both “pure industrial” and B2C branded segments, with a high level of integration as well as a diversified product offer (food supplements, herbal products, cosmetics and medical devices).
In addition, there are a lot of players in this reference market, including pharmaceutical firms, which are integrating their value chains with nutraceutical and cosmeceutical solutions (to get also out of "ethics"); “pure” food producers, whose activity is more and more addressed to functional foods and dietary supplements; "pure" consumer/personal care product manufacturers, which are moving up towards the higher quality cosmeceutical segment.
In our view, the most similar companies to compare for valuation purposes are the European and US mid-size players, with a specialized business (or division). In details we include:
® Four Italian firms which are active in the nutraceutical market and / or in the production of cosmeceuticals: Pharmanutra, Kolinpharma, Enervit and Finefoods (one of the main Italian players in the nutraceutical market and recently involved in the business combination with the Spac Innova Italy 1);
® A couple of US firms and four European companies engaged in the development and manufacturing of health and well-being products: Herbalife Nutrition, Usana Health Science, Naturhouse, Midsona, Boiron and Sarantis Group, with the latter mainly focused in the manufacturing of cosmetics and hair care products.

VALUETRACK
NOT FOR DISTRIBUTION IN OR INTO THE UNITED STATES, CANADA, JAPAN OR AUSTRALIA
BioDue SPA | Update Report | 01 October 2018
18
As far as Fine Foods / Innova Italy is concerned - being the business combination effective as of October 1st - we assume multiples based on a fully diluted number of shares (i.e. including the new shares and warrants issued and to be issued to SPAC promoters and Fine Foods current shareholders).
By looking at Bio Due’ peers stock price evolution across 2018, we highlight how US companies (Usana and Herbalife) have undergone a significant share price performance, supported also by the bullish US stock market, currently at its peak levels.
On the opposite, European stocks’ performance remains flattish year to date, with share prices in the +/- 10% trading range. However, the sector as a whole has not experienced any clear rerating since our Initiation of Coverage’s release date.
As for BioDue, its market cap touched its year peak at the beginning of July, followed by a gradual downtrend over the last months, with the stock price currently trading again at slight discount on major multiples.
BioDue: Peers’ stock price evolution year to date
BioDue Pharmanutra Kolinpharma Naturhouse Enervit Boiron Sarantis Midsona Herbalife Usana
28/05/18 - IoC release date
Source: S&P Capital IQ, Value Track Analysis
We do not believe, however, a discount to be justified, given the outlook: the Group is going to face a period of margins and FCF acceleration, following the phase of investments and capacity expansion to be completed in 2018.
Also, we believe that a consistent delivery of strong results (combining growth and profitability) should be a key driver of stock’s re-rating, reducing the perception of execution risk.

VALUETRACK
NOT FOR DISTRIBUTION IN OR INTO THE UNITED STATES, CANADA, JAPAN OR AUSTRALIA
BioDue SPA | Update Report | 01 October 2018
19
Taking into account the median of all stocks included in the above mentioned clusters, and focussing on EV/EBITDA, EV/EBIT and P/E as the most suitable multiples, we calculate a multiple based fair value for BioDue shares of €6.6.
BioDue: Peers stocks’ trading multiples
Company EV / Sales EV / EBITDA EV / EBIT P / E
2018E 2019E 2018E 2019E 2018E 2019E 2018E 2019E Pharmanutra 3.2 2.7 12.3 10.5 13.1 11.3 21.4 18.6
Kolinpharma 1.5 1.1 6.0 3.8 11.0 5.4 15.9 9.0
Enervit 0.9 0.9 9.9 9.0 15.5 12.6 23.9 20.4
Fine Foods 1.5 1.4 11.3 9.8 19.1 17.1 35.8 32.7
Naturhouse 1.8 1.8 6.2 6.1 6.5 6.4 9.7 9.2
Sarantis Group 1.5 1.4 12.7 11.1 14.3 12.3 17.7 15.7
Midsona 1.1 1.1 12.7 11.2 15.1 13.1 18.9 15.9
Boiron 1.4 1.3 6.3 5.8 7.8 7.2 15.6 15.4
Herbalife 2.1 2.0 12.6 11.9 15.5 14.2 26.3 21.5
Usana 2.2 1.9 12.0 10.6 13.9 12.0 23.5 20.8
Average 1.7 1.5 10.2 9.0 13.2 11.1 20.9 17.9
Median 1.5 1.4 11.7 10.2 14.1 12.2 20.2 17.2
BioDue @ mkt price 1.7 1.5 9.5 7.8 13.0 10.6 16.1 14.5
Source: Market Consensus, Value Track Analysis
DCF valuation Our Discounted Cash Flow model is applied assuming the current capital structure of the company (30% D/E, i.e. 23% D/D+E), an overall cost of Equity of 11.9% and a 10.0% WACC. The detailed calculation is based on the following assumptions:
Cost of Equity
1. Risk-free rate at 2.0% which reflects medium term-target inflation in the Eurozone;
2. Unlevered beta at 0.8 (average of Healthcare Products and Healthcare Support services);
3. Implied Italian Equity Risk Premium at 7.9%, derived using a relative stock market volatility approach considering an implied US ERP at 4.7% (source: Damodaran, July 2018);
4. Additional 2% Equity Risk Premium to compensate for the Italian AIM lower liquidity.
Cost of Debt
® Pre-tax cost of debt at 4.5% reflects the sum of 2.0% risk free and 2.5% of additional credit spread;
® Corporate Tax rate at 24%.

VALUETRACK
NOT FOR DISTRIBUTION IN OR INTO THE UNITED STATES, CANADA, JAPAN OR AUSTRALIA
BioDue SPA | Update Report | 01 October 2018
20
BioDue: WACC calculation
Risk free 2.0%
Risk Premium 7.9%
Beta Unlevered 0.8
Beta Levered 1.0
Small-Size Risk Premium 2%
COST OF EQUITY 11.9%
COST OF DEBT (after-tax) 3.4%
D/D+E 23.0%
WACC 10.0%
Source: Value Track Analysis
Other additional DCF model assumptions are the following:
® Financial statements projection starting from 2018E to 2028E;
® Terminal Value at 2028E, obtained applying a 2.5% Perpetuity Growth Rate (PGR), which corresponds to an exit multiple of 8.5x EV/EBITDA (compared to current 9.8x).
That said, we estimate a fair equity value per share at €5.4, corresponding to a fair equity value of €60mn. BioDue: Discounted Cash Flows
(€’000)
PV of future cash flows FY18E-FY27E 31.7
PV of Terminal value with PGR at 2% 35.6
Fair Enterprise value 67.3
Net Debt Position 2017A year-end -6.1
Cost of minorities (LaBiotre) -1.7
Fair Equity value 60
Fair Equity Value per share (€) 5.4
Source: Value Track Analysis In addition, we run some sensitivity analysis to WACC and PGR.
BioDue: Fair Equity Value p.s. Sensitivity Analysis Perpetuity Growth Rate
WACC
2.00% 2.25% 2.50% 2.75% 3.00%
9.0% 6.1 6.2 6.4 6.6 6.8
9.5% 5.6 5.7 5.8 6.0 6.1
10.0% 5.1 5.2 5.4 5.5 5.6
10.5% 4.8 4.8 4.9 5.0 5.1
11.0% 4.4 4.5 4.6 4.7 4.7
Source: Value Track Analysis

VALUETRACK
NOT FOR DISTRIBUTION IN OR INTO THE UNITED STATES, CANADA, JAPAN OR AUSTRALIA
BioDue SPA | Update Report | 01 October 2018
21
Appendix 1: Additional info on peers ® Pharmanutra: based in Italy and listed on AIM Italia, it is a global pharmaceutical firm, which
develops nutraceutical and medical devices with a well-defined focus on oral iron supplements and muscle and joint pain relievers;
® Kolinpharma: listed on AIM Italia, it is a nutraceutical Italian company whose products are positioned just below pure pharmaceutical formulations and do not include generic food/nutritional supplements;
® Enervit: one of the main players in the Italian nutraceutical market, with a leading position in the welness segment and second player in the diet field;
® Fine Foods & Pharmaceuticals: an Italian CDMO (Contract Development & Manufacturing Organization) of solid oral forms, for the nutraceutical and pharmaceutical industries;
® Naturhouse: a Spanish company engaged in the manufacturing of nutrition and weight management products, classified in the following categories: Food Supplements, Healthy Foods & Drinks, and Cosmetics & Body Care;
® Sarantis Group: established in Greece, the company manufactures and distributes mainly cosmetics (mass market and luxury segments) and households products, but also Health & Care Products (vitamins, nutrition supplements, testing kits, pharmacy cosmetics);
® Midsona: based in Sweden, it is engaged in manufacturing and distributing of health and well-being products (health foods, sports nutrition, super food, dietary supplements, cold remedies, skin-care and beauty products), With 70% of revenues still represented by healthfoods sold though the "grocery" channel its positioning is relatively less qualified than other peers;
® Boiron: a France-based multinational Group that manufactures and markets single homeopatic medicines and drugs, but also medicines based on trace elements, phytotherapy remedies, food supplements as well as health and beauty care products;
® Herbalife Nutrition: a global direct-selling corporation that develops, markets and sells nutrition supplements, weight management, sports nutrition and (to a very minor extent) personal-care products;
® Usana Health Sciences: a US company which develops and manufactures science-based nutritional and personal care products and operates with a global direct-selling formula.
BioDue: Peers’ features and main business activities
Company Country Currency Mkt Cap
(€mn) Revenues
2017A Nutraceutical Cosmetics Other
Yes/Not (as %) Yes/Not (as %) Yes/Not (as %)
Pharmanutra Italy (AIM) EUR 147 38 ✓ 100%
Kolinpharma Italy (AIM) EUR 10 4 ✓ 100%
Enervit Italy EUR 57 56 ✓ 100%
Fine Foods(*) Italy (AIM) EUR 262 120 ✓ 77% ✓ 23%
Naturhouse Spain EUR 182 95 ✓ n.a. ✓ n.a. ✓ n.a.
Sarantis Group Greece EUR 566 343 ✓ 10% ✓ 47% ✓ 43%
Midsona Sweden SEK 3,175 2,173 ✓ n.a. ✓ n.a. ✓ n.a.
Boiron France EUR 1,139 618 ✓ n.a. ✓ n.a.
Herbalife US USD 9,143 4,428 ✓ 98% ✓ 2%
Usana US USD 2,912 1,047 ✓ 83% ✓ 6% ✓ 10%
BioDue Italy (AIM) EUR 61 36 ✓ 85% ✓ 15%
Source: Value Track Analysis (BioDue Medical devices are included in Nutraceutical) *business combination to become effective from October 1ststst

ValueTrack | www.value-track.com |
VALUETRACK
DISCLAIMER THIS DOCUMENT IS PREPARED BY VALUE TRACK S.R.L. THIS DOCUMENT IS BEING FURNISHED TO YOU SOLELY FOR YOUR INFORMATION ON A CONFIDENTIAL BASIS AND MAY NOT BE REPRODUCED, REDISTRIBUTED OR PASSED ON, IN WHOLE OR IN PART, TO ANY OTHER PERSON. IN PARTICULAR, NEITHER THIS DOCUMENT NOR ANY COPY THEREOF MAY BE TAKEN OR TRANSMITTED OR DISTRIBUTED, DIRECTLY OR INDIRECTLY, INTO CANADA OR JAPAN OR AUSTRALIA TO ANY RESIDENT THEREOF OR INTO THE UNITED STATES, ITS TERRITORIES OR POSSESSIONS. THE DISTRIBUTION OF THIS DOCUMENT IN OTHER JURISDICTIONS MAY BE RESTRICTED BY LAW AND PERSONS INTO WHOSE POSSESSION THIS DOCUMENT COMES SHOULD INFORM THEMSELVES ABOUT, AND OBSERVE, ANY SUCH RESTRICTION. ANY FAILURE TO COMPLY WITH THESE RESTRICTIONS MAY CONSTITUTE A VIOLATION OF THE LAWS OF ANY SUCH OTHER JURISDICTION. THIS DOCUMENT DOES NOT CONSTITUTE OR FORM PART OF, AND SHOULD NOT BE CONSTRUED AS, AN OFFER, INVITATION OR INDUCEMENT TO SUBSCRIBE FOR OR PURCHASE ANY SECURITIES, AND NEITHER THIS DOCUMENT NOR ANYTHING CONTAINED HEREIN SHALL FORM THE BASIS OF OR BE RELIED ON IN CONNECTION WITH OR ACT AS AN INVITATION OR INDUCEMENT TO ENTER INTO ANY CONTRACT OR COMMITMENT WHATSOEVER. THIS DOCUMENT HAS NOT BEEN PUBLISHED GENERALLY AND HAS ONLY BEEN MADE AVAILABLE TO INSTITUTIONAL INVESTORS. IN MAKING AN INVESTMENT DECISION, POTENTIAL INVESTORS MUST RELY ON THEIR OWN EXAMINATION OF THE COMPANY AND ITS GROUP INCLUDING THE MERITS AND RISKS INVOLVED. THIS DOCUMENT IS FOR DISTRIBUTION IN OR FROM THE UNITED KINGDOM ONLY TO PERSONS WHO: (I) HAVE PROFESSIONAL EXPERIENCE IN MATTERS RELATING TO INVESTMENTS FALLING WITHIN ARTICLE 19(5) OF THE FINANCIAL SERVICES AND MARKETS ACT 2000 (FINANCIAL PROMOTION) ORDER 2005 (AS AMENDED, THE “FINANCIAL PROMOTION ORDER”), (II) ARE PERSONS FALLING WITHIN ARTICLE 49(2)(A) TO (D) (“HIGH NET WORTH COMPANIES, UNINCORPORATED ASSOCIATIONS ETC.”) OF THE FINANCIAL PROMOTION ORDER, (III) ARE OUTSIDE THE UNITED KINGDOM, OR (IV) ARE PERSONS TO WHOM AN INVITATION OR INDUCEMENT TO ENGAGE IN INVESTMENT ACTIVITY (WITHIN THE MEANING OF SECTION 21 OF THE FINANCIAL SERVICES AND MARKETS ACT 2000) IN CONNECTION WITH THE ISSUE OR SALE OF ANY SECURITIES MAY OTHERWISE LAWFULLY BE COMMUNICATED OR CAUSED TO BE COMMUNICATED (ALL SUCH PERSONS TOGETHER BEING REFERRED TO AS “RELEVANT PERSONS”). THIS DOCUMENT IS DIRECTED ONLY AT RELEVANT PERSONS AND MUST NOT BE ACTED ON OR RELIED ON BY PERSONS WHO ARE NOT RELEVANT PERSONS. ANY INVESTMENT OR INVESTMENT ACTIVITY TO WHICH THIS DOCUMENT RELATES IS AVAILABLE ONLY TO RELEVANT PERSONS AND WILL BE ENGAGED IN ONLY WITH RELEVANT PERSONS. IN ITALY THIS DOCUMENT IS BEING DISTRIBUTED ONLY TO, AND IS DIRECTED AT QUALIFIED INVESTORS WITHIN THE MEANING OF ARTICLE 100 OF LEGISLATIVE DECREE NO. 58 OF 24 FEBRUARY 1998, AS AMENDED, AND ARTICLE 34-TER, PARAGRAPH 1, LETTER B), OF CONSOB REGULATION ON ISSUERS NO. 11971 OF MAY 14, 1999, AS SUBSEQUENTLY AMENDED (THE “ISSUERS’ REGULATION”) PROVIDED THAT SUCH QUALIFIED INVESTORS WILL ACT IN THEIR CAPACITY AND NOT AS DEPOSITARIES OR NOMINEES FOR OTHER SHAREHOLDERS, SUCH AS PERSONS AUTHORISED AND REGULATED TO OPERATE IN FINANCIAL MARKETS, BOTH ITALIAN AND FOREIGN, I.E.: A) BANKS; B) INVESTMENT FIRMS; C) OTHER AUTHORISED AND REGULATED FINANCIAL INSTITUTIONS; D) INSURANCE COMPANIES; E) COLLECTIVE INVESTMENT UNDERTAKINGS AND MANAGEMENT COMPANIES FOR SUCH UNDERTAKINGS; F) PENSION FUNDS AND MANAGEMENT COMPANIES FOR SUCH FUNDS; G) DEALERS ACTING ON THEIR OWN ACCOUNT ON COMMODITIES AND COMMODITY-BASED DERIVATIVES; H) PERSONS DEALING EXCLUSIVELY ON THEIR OWN ACCOUNT ON FINANCIAL INSTRUMENTS MARKETS WITH INDIRECT MEMBERSHIP OF CLEARING AND SETTLEMENT SERVICES AND THE LOCAL COMPENSATORY AND GUARANTEE SYSTEM; I) OTHER INSTITUTIONAL INVESTORS; L) STOCKBROKERS; (2) LARGE COMPANIES WHICH AT INDIVIDUAL COMPANY LEVEL MEET AT LEAST TWO OF THE FOLLOWING REQUIREMENTS: — BALANCE SHEET TOTAL: 20,000,000 EURO, — NET REVENUES: 40,000,000 EURO, — OWN FUNDS: 2,000,000 EURO; (3) INSTITUTIONAL INVESTORS WHOSE MAIN ACTIVITY IS INVESTMENT IN FINANCIAL INSTRUMENTS, INCLUDING COMPANIES DEDICATED TO THE SECURITISATION OF ASSETS AND OTHER FINANCIAL TRANSACTIONS (ALL SUCH PERSONS TOGETHER BEING REFERRED TO AS “RELEVANT PERSONS”). ANY PERSON WHO IS NOT A RELEVANT PERSON SHOULD NOT ACT OR RELY ON THIS DOCUMENT OR ANY OF ITS CONTENTS. THIS DOCUMENT IS NOT ADDRESSED TO ANY MEMBER OF THE GENERAL PUBLIC IN ITALY. UNDER NO CIRCUMSTANCES SHOULD THIS DOCUMENT CIRCULATE AMONG, OR BE DISTRIBUTED IN ITALY TO (I) A MEMBER OF THE GENERAL PUBLIC, (II) INDIVIDUALS OR ENTITIES FALLING OUTSIDE THE DEFINITION OF “QUALIFIED INVESTORS” AS SPECIFIED ABOVE OR (III) DISTRIBUTION CHANNELS THROUGH WHICH INFORMATION IS OR IS LIKELY TO BECOME AVAILABLE TO A LARGE NUMBER OF PERSONS. THIS DOCUMENT IS BEING DISTRIBUTED TO AND IS DIRECTED ONLY AT PERSONS IN MEMBER STATES OF THE EUROPEAN ECONOMIC AREA (“EEA”) WHO ARE “QUALIFIED INVESTORS” WITHIN THE MEANING OF ARTICLE 2(1)(E) OF THE PROSPECTUS DIRECTIVE (DIRECTIVE 2003/71/EC), (“QUALIFIED INVESTORS”). ANY PERSON IN THE EEA WHO RECEIVES THIS DOCUMENT WILL BE DEEMED TO HAVE REPRESENTED AND AGREED THAT IT IS A QUALIFIED INVESTOR. ANY SUCH RECIPIENT WILL ALSO BE DEEMED TO HAVE REPRESENTED AND AGREED THAT IT HAS NOT RECEIVED THIS DOCUMENT ON BEHALF OF PERSONS IN THE EEA OTHER THAN QUALIFIED INVESTORS OR PERSONS IN THE UK, ITALY AND OTHER MEMBER STATES (WHERE EQUIVALENT LEGISLATION EXISTS) FOR WHOM THE INVESTOR HAS AUTHORITY TO MAKE DECISIONS ON A WHOLLY DISCRETIONARY BASIS. THE COMPANY, VALUE TRACK S.R.L. AND THEIR AFFILIATES, AND OTHERS WILL RELY UPON THE TRUTH AND ACCURACY OF THE FOREGOING REPRESENTATIONS AND AGREEMENTS. ANY PERSON IN THE EEA WHO IS NOT A QUALIFIED INVESTOR SHOULD NOT ACT OR RELY ON THIS DOCUMENT OR ANY OF ITS CONTENTS. THE EXPRESSION “PROSPECTUS DIRECTIVE” MEANS DIRECTIVE 2003/71/EC (AND AMENDMENTS THERETO, INCLUDING THE 2010 PD AMENDING DIRECTIVE, TO THE EXTENT IMPLEMENTED IN THE RELEVANT MEMBER STATE), AND INCLUDES ANY RELEVANT IMPLEMENTING MEASURE IN THE RELEVANT MEMBER STATE AND THE EXPRESSION “2010 PD AMENDING DIRECTIVE” MEANS DIRECTIVE 2010/73/EU. THIS DOCUMENT HAS BEEN PRODUCED IN THE NAME AND ON BEHALF OF INVEST BANCA S.P.A. THAT IS ACTING AS SPECIALIST ON BIODUE SHARES. THIS DOCUMENT HAS BEEN PRODUCED INDEPENDENTLY OF BIODUE S.P.A. AND ITS SHAREHOLDERS, AND ANY FORECASTS, OPINIONS AND EXPECTATIONS CONTAINED HEREIN ARE ENTIRELY THOSE OF VALUE TRACK S.R.L. AND ARE GIVEN AS PART OF ITS NORMAL RESEARCH ACTIVITY AND SHOULD NOT BE RELIED UPON AS HAVING BEEN AUTHORISED OR APPROVED BY ANY OTHER PERSON. VALUE TRACK S.R.L. HAS NO AUTHORITY WHATSOEVER TO MAKE ANY REPRESENTATION OR WARRANTY ON BEHALF OF THE COMPANY, ITS SHAREHOLDERS, ANY OF ITS ADVISORS, OR ANY OTHER PERSON IN CONNECTION THEREWITH. WHILE ALL REASONABLE CARE HAS BEEN TAKEN TO ENSURE THAT THE FACTS STATED HEREIN ARE ACCURATE AND THAT THE FORECASTS, OPINIONS AND EXPECTATIONS CONTAINED HEREIN ARE FAIR AND REASONABLE, VALUE TRACK S.R.L. HAS NOT VERIFIED THE CONTENTS HEREOF AND ACCORDINGLY NONE OF VALUE TRACK S.R.L., THE COMPANY, ITS SHAREHOLDERS, ANY ADVISORS TO THE COMPANY OR ITS SHAREHOLDERS OR ANY OTHER PERSON IN CONNECTION THEREWITH NOR ANY OF THEIR RESPECTIVE DIRECTORS, OFFICERS OR EMPLOYEES, SHALL BE IN ANY WAY RESPONSIBLE FOR THE CONTENTS HEREOF AND NO RELIANCE SHOULD BE PLACED ON THE ACCURACY, FAIRNESS, OR COMPLETENESS OF THE INFORMATION CONTAINED IN THIS DOCUMENT. NO PERSON ACCEPTS ANY LIABILITY WHATSOEVER FOR ANY LOSS HOWSOEVER ARISING FROM THE USE OF THIS DOCUMENT OR OF ITS CONTENTS OR OTHERWISE ARISING IN CONNECTION THEREWITH. TO THE EXTENT PERMITTED BY LAW AND BY REGULATIONS, VALUE TRACK S.R.L. (OR ITS OFFICERS, DIRECTORS OR EMPLOYEES) MAY HAVE A POSITION IN THE SECURITIES OF (OR OPTIONS, WARRANTS OR RIGHTS WITH RESPECT TO, OR INTEREST IN THE SHARES OR OTHER SECURITIES OF) THE COMPANY AND MAY MAKE A MARKET OR ACT AS A PRINCIPAL IN ANY TRANSACTIONS I SUCH SECURITIES.