Analyst Presentation - sbi.co.in PPT... · Dominant presence in Capital Markets, Gen. Insurance and...
39
Quarterly Results Q3FY19 Analyst Presentation 01.02.2019
Transcript of Analyst Presentation - sbi.co.in PPT... · Dominant presence in Capital Markets, Gen. Insurance and...

Quarterly Results Q3FY19
Analyst Presentation
01.02.2019

Safe Harbor
Certain statements in these slides are forward-
looking statements. These statements are based on
Management's current expectations and are subject
to uncertainty and changes in circumstances. Actual
outcomes may differ materially from those included
in these statements due to a variety of factors.
2
3
Contents
Financial Performance1
Business2
Capital Adequacy & Asset Quality3
Digital Banking & Financial Inclusion4
Subsidiaries, Group Financials & Balance Sheet5
4
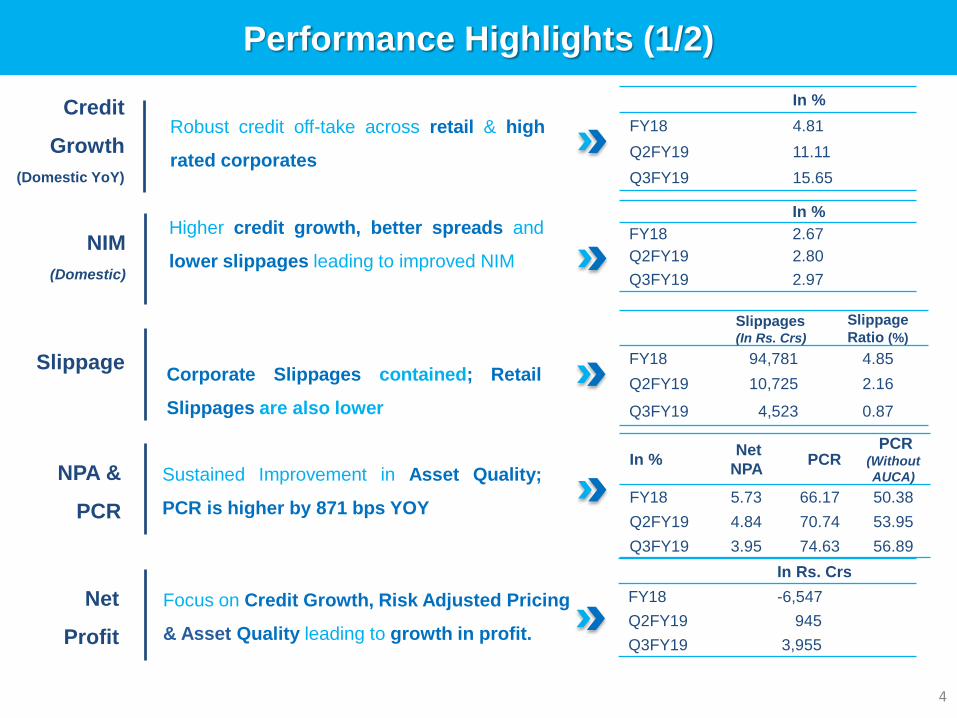
Performance Highlights (1/2)
Credit
Growth
(Domestic YoY)
Robust credit off-take across retail & high
rated corporates
NIM
(Domestic)
Higher credit growth, better spreads and
lower slippages leading to improved NIM
SlippageCorporate Slippages contained; Retail
Slippages are also lower
NPA &
PCR
Sustained Improvement in Asset Quality;
PCR is higher by 871 bps YOY
Net
Profit
Focus on Credit Growth, Risk Adjusted Pricing
& Asset Quality leading to growth in profit.
In %
FY18 4.81
Q2FY19 11.11
Q3FY19 15.65
In %
FY18 2.67
Q2FY19 2.80
Q3FY19 2.97
Slippages(In Rs. Crs)
Slippage
Ratio (%)
FY18 94,781 4.85
Q2FY19 10,725 2.16
Q3FY19 4,523 0.87
In %Net
NPAPCR
PCR (Without
AUCA)
FY18 5.73 66.17 50.38
Q2FY19 4.84 70.74 53.95
Q3FY19 3.95 74.63 56.89
In Rs. Crs
FY18 -6,547
Q2FY19 945
Q3FY19 3,955
5
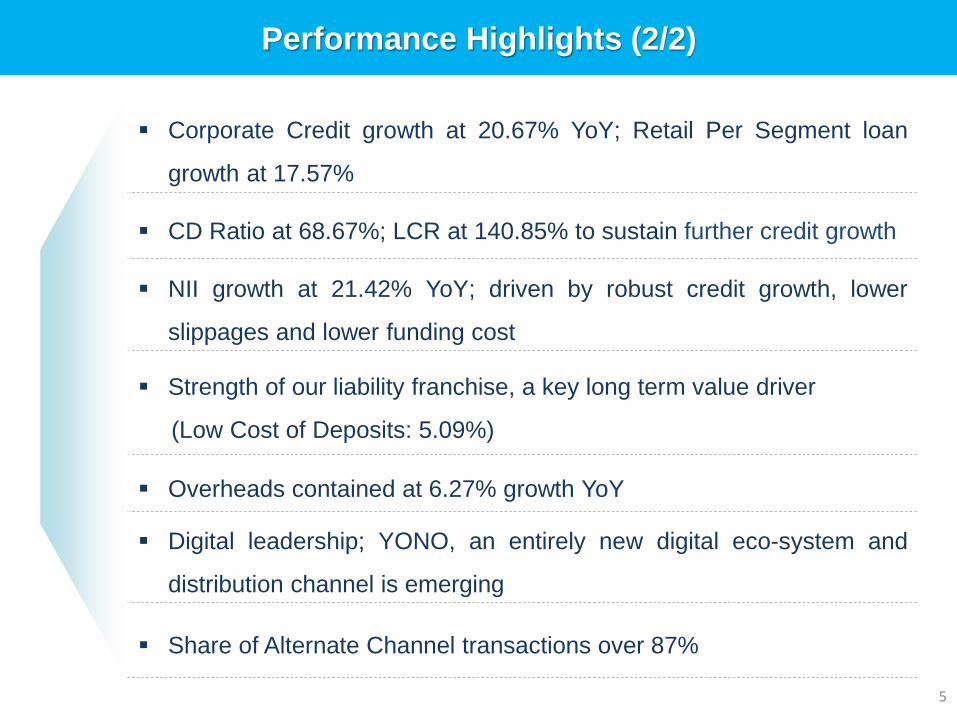
Performance Highlights (2/2)
Corporate Credit growth at 20.67% YoY; Retail Per Segment loan
growth at 17.57%
CD Ratio at 68.67%; LCR at 140.85% to sustain further credit growth
NII growth at 21.42% YoY; driven by robust credit growth, lower
slippages and lower funding cost
Strength of our liability franchise, a key long term value driver
(Low Cost of Deposits: 5.09%)
Overheads contained at 6.27% growth YoY
Digital leadership; YONO, an entirely new digital eco-system and
distribution channel is emerging
Share of Alternate Channel transactions over 87%
6
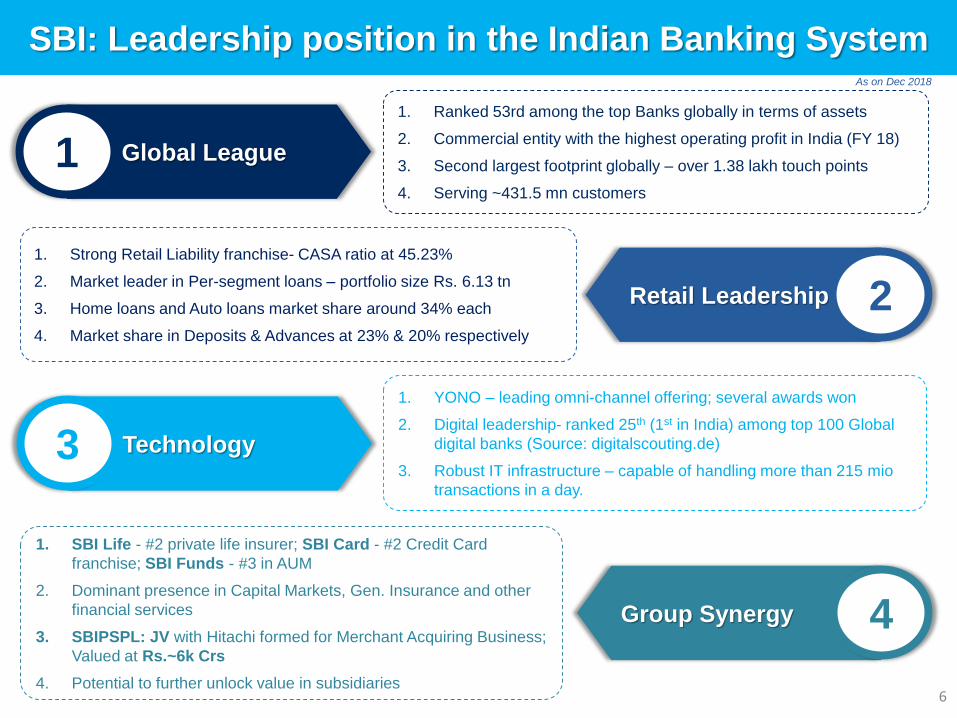
SBI: Leadership position in the Indian Banking System
1. Ranked 53rd among the top Banks globally in terms of assets
2. Commercial entity with the highest operating profit in India (FY 18)
3. Second largest footprint globally – over 1.38 lakh touch points
4. Serving ~431.5 mn customers
1. Strong Retail Liability franchise- CASA ratio at 45.23%
2. Market leader in Per-segment loans – portfolio size Rs. 6.13 tn
3. Home loans and Auto loans market share around 34% each
4. Market share in Deposits & Advances at 23% & 20% respectively
1. YONO – leading omni-channel offering; several awards won
2. Digital leadership- ranked 25th (1st in India) among top 100 Global
digital banks (Source: digitalscouting.de)
3. Robust IT infrastructure – capable of handling more than 215 mio
transactions in a day.
Retail Leadership 2
Global League1
Technology3
1. SBI Life - #2 private life insurer; SBI Card - #2 Credit Card
franchise; SBI Funds - #3 in AUM
2. Dominant presence in Capital Markets, Gen. Insurance and other
financial services
3. SBIPSPL: JV with Hitachi formed for Merchant Acquiring Business;
Valued at Rs.~6k Crs
4. Potential to further unlock value in subsidiaries
Group Synergy 4
As on Dec 2018

7
Financial Performance

Financials – At a Glance
Rs. in Crores
8
$ Includes exceptional item of Rs.5,436 Crores on stake sale through IPO in SBI Life # Includes exceptional items of Rs.1,087 Crores on sale of MAB & Rs.473 Crores on stake sale in SBI General
NIM (Domestic-Cumulative) (%) 2.92 2.88 2.61 2.92 2.61 31 bps 4 bps 31 bps
Cost to Income Ratio (%) 56.97 55.96 49.84 56.97 49.84 713 bps 101 bps 713 bps
Interest Income 62,277 58,793 54,803 1,79,883 1,64,558 9.31 5.92 13.64
Interest Expenses 39,586 37,888 36,115 1,14,488 1,09,679 4.39 4.48 9.61
Net Interest Income 22,691 20,906 18,688 65,395 54,879 19.16 8.54 21.42
Non Interest Income 8,035 9,375# 8,084 24,090# 32,106$ -24.97 -14.29 -0.61
Operating Income 30,726 30,281 26,772 89,485 86,985 2.87 1.47 14.77
Operating Expenses 18,101 16,376 15,017 50,982 43,358 17.58 10.54 20.54
Operating Profit 12,625 13,905 11,755 38,503 43,628 -11.75 -9.20 7.40
Total Provisions 8,670 12,960 14,171 38,479 42,457 -9.37 -33.10 -38.82
Net Profit 3,955 945 -2,416 24 1,171 -97.96 318.56
Quarter ended Nine Months Ended Growth (%)
Q3FY19 Q2FY19 Q3FY18 9MFY19 9MFY18
9MFY19
over
9MFY18
Q3FY19
over
Q2FY19
Q3FY19
over
Q3FY18

Total Income
Rs. in Crores
9
Fee Income 4,724 5,015 4,979 14,715 15,206 -3.23 -5.81 -5.13
Profit/Loss on Sale of
Investments 425 1,328 1,026 489 11,362 -95.70 -67.98 -58.56
Forex Income 564 493 597 1,485 1,938 -23.40 14.34 -5.50
Misc. Income 2,322 2,539 1,482 7,401 3,600 105.59 -8.53 56.70
of which:
Recovery in w/o accounts 2,107 1,327 1,351 5,860 3,221 81.94 58.80 55.98
Total Non Interest Income 8,035 9,375 8,084 24,090 32,106 -24.97 -14.29 -0.61
Total Income 70,312 68,169 62,887 2,03,973 1,96,664 3.72 3.14 11.81
Interest on Loans 41,821 38,326 35,185 1,19,012 1,07,128 11.09 9.12 18.86
Interest on Resources 19,131 19,310 18,422 57,273 54,053 5.96 -0.93 3.85
Other Interest income 1,325 1,157 1,196 3,598 3,376 6.57 14.53 10.86
Total Interest Income 62,277 58,793 54,803 1,79,883 1,64,558 9.31 5.92 13.64
Quarter ended Nine Months Ended Growth (%)
Q3FY19 Q2FY19 Q3FY18 9MFY19 9MFY18
9MFY19
over
9MFY18
Q3FY19
over
Q2FY19
Q3FY19
over
Q3FY18
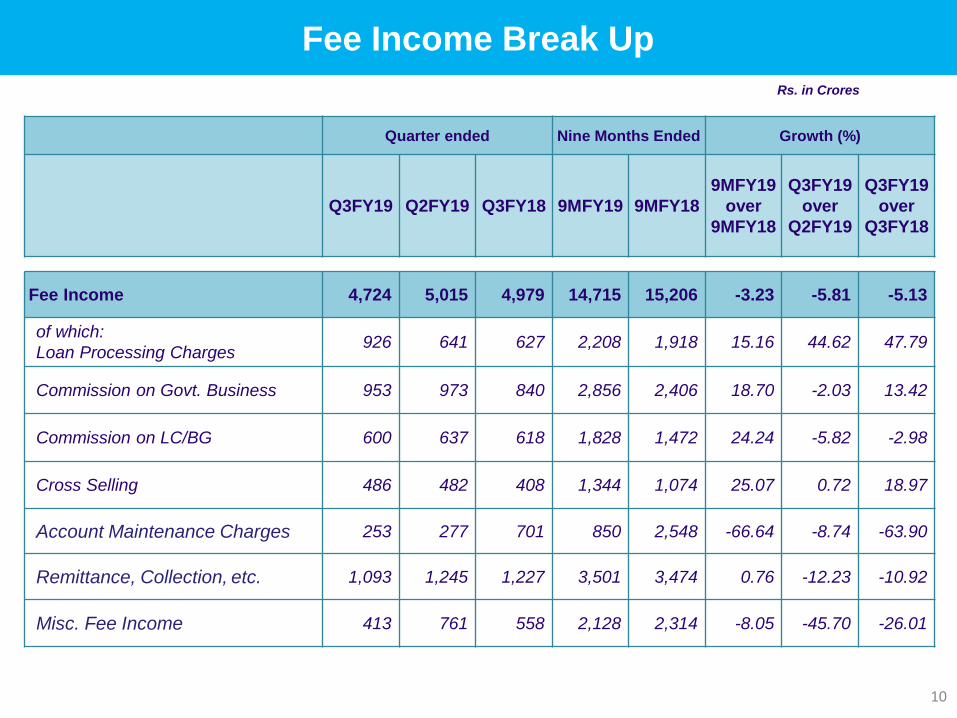
Fee Income Break Up
Rs. in Crores
10
Quarter ended Nine Months Ended Growth (%)
Q3FY19 Q2FY19 Q3FY18 9MFY19 9MFY18
9MFY19
over
9MFY18
Q3FY19
over
Q2FY19
Q3FY19
over
Q3FY18
Fee Income 4,724 5,015 4,979 14,715 15,206 -3.23 -5.81 -5.13
of which:
Loan Processing Charges 926 641 627 2,208 1,918 15.16 44.62 47.79
Commission on Govt. Business 953 973 840 2,856 2,406 18.70 -2.03 13.42
Commission on LC/BG 600 637 618 1,828 1,472 24.24 -5.82 -2.98
Cross Selling 486 482 408 1,344 1,074 25.07 0.72 18.97
Account Maintenance Charges 253 277 701 850 2,548 -66.64 -8.74 -63.90
Remittance, Collection, etc. 1,093 1,245 1,227 3,501 3,474 0.76 -12.23 -10.92
Misc. Fee Income 413 761 558 2,128 2,314 -8.05 -45.70 -26.01
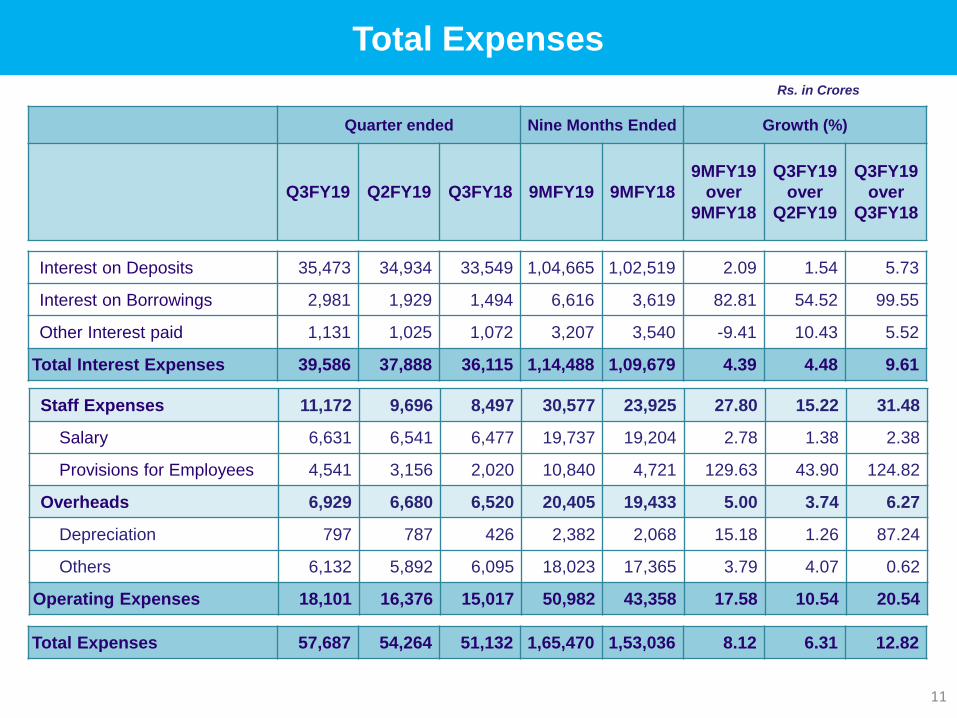
Total Expenses
Rs. in Crores
11
Quarter ended Nine Months Ended Growth (%)
Q3FY19 Q2FY19 Q3FY18 9MFY19 9MFY18
9MFY19
over
9MFY18
Q3FY19
over
Q2FY19
Q3FY19
over
Q3FY18
Interest on Deposits 35,473 34,934 33,549 1,04,665 1,02,519 2.09 1.54 5.73
Interest on Borrowings 2,981 1,929 1,494 6,616 3,619 82.81 54.52 99.55
Other Interest paid 1,131 1,025 1,072 3,207 3,540 -9.41 10.43 5.52
Total Interest Expenses 39,586 37,888 36,115 1,14,488 1,09,679 4.39 4.48 9.61
Total Expenses 57,687 54,264 51,132 1,65,470 1,53,036 8.12 6.31 12.82
Staff Expenses 11,172 9,696 8,497 30,577 23,925 27.80 15.22 31.48
Salary 6,631 6,541 6,477 19,737 19,204 2.78 1.38 2.38
Provisions for Employees 4,541 3,156 2,020 10,840 4,721 129.63 43.90 124.82
Overheads 6,929 6,680 6,520 20,405 19,433 5.00 3.74 6.27
Depreciation 797 787 426 2,382 2,068 15.18 1.26 87.24
Others 6,132 5,892 6,095 18,023 17,365 3.79 4.07 0.62
Operating Expenses 18,101 16,376 15,017 50,982 43,358 17.58 10.54 20.54
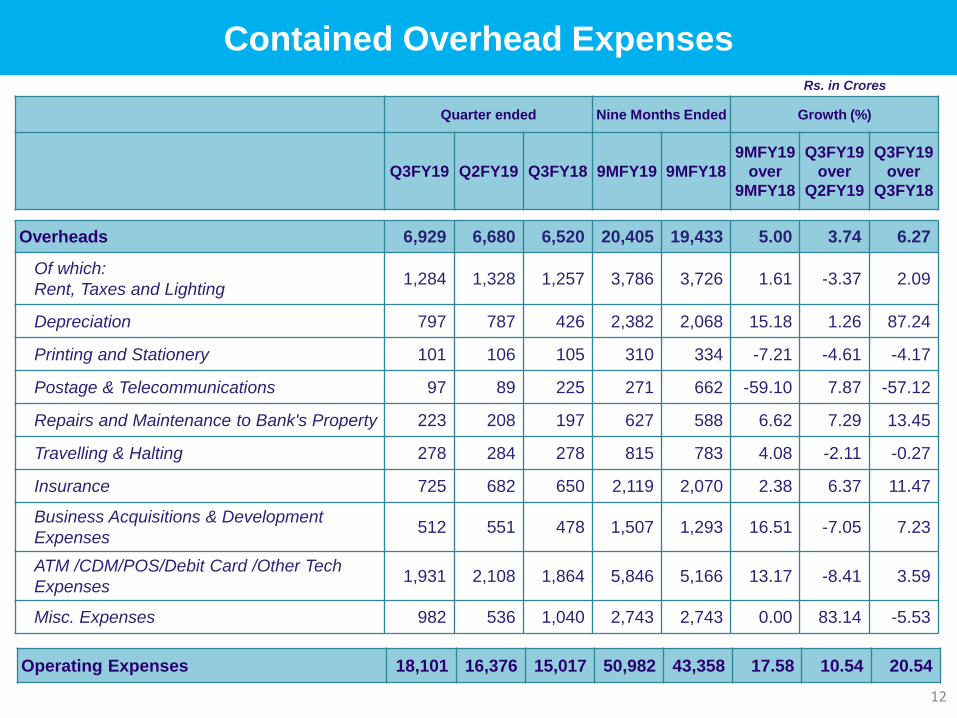
Contained Overhead Expenses Rs. in Crores
12
Quarter ended Nine Months Ended Growth (%)
Q3FY19 Q2FY19 Q3FY18 9MFY19 9MFY18
9MFY19
over
9MFY18
Q3FY19
over
Q2FY19
Q3FY19
over
Q3FY18
Overheads 6,929 6,680 6,520 20,405 19,433 5.00 3.74 6.27
Of which:
Rent, Taxes and Lighting1,284 1,328 1,257 3,786 3,726 1.61 -3.37 2.09
Depreciation 797 787 426 2,382 2,068 15.18 1.26 87.24
Printing and Stationery 101 106 105 310 334 -7.21 -4.61 -4.17
Postage & Telecommunications 97 89 225 271 662 -59.10 7.87 -57.12
Repairs and Maintenance to Bank's Property 223 208 197 627 588 6.62 7.29 13.45
Travelling & Halting 278 284 278 815 783 4.08 -2.11 -0.27
Insurance 725 682 650 2,119 2,070 2.38 6.37 11.47
Business Acquisitions & Development
Expenses512 551 478 1,507 1,293 16.51 -7.05 7.23
ATM /CDM/POS/Debit Card /Other Tech
Expenses1,931 2,108 1,864 5,846 5,166 13.17 -8.41 3.59
Misc. Expenses 982 536 1,040 2,743 2,743 0.00 83.14 -5.53
Operating Expenses 18,101 16,376 15,017 50,982 43,358 17.58 10.54 20.54
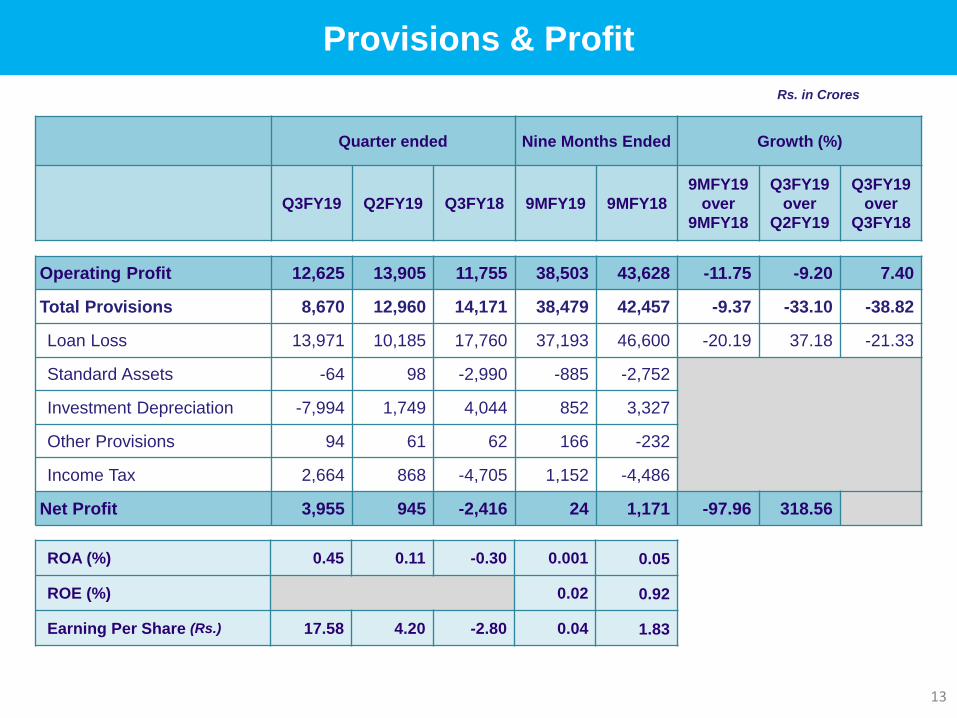
Provisions & Profit
Rs. in Crores
13
Quarter ended Nine Months Ended Growth (%)
Q3FY19 Q2FY19 Q3FY18 9MFY19 9MFY18
9MFY19
over
9MFY18
Q3FY19
over
Q2FY19
Q3FY19
over
Q3FY18
ROA (%) 0.45 0.11 -0.30 0.001 0.05
ROE (%) 0.02 0.92
Earning Per Share (Rs.) 17.58 4.20 -2.80 0.04 1.83
Operating Profit 12,625 13,905 11,755 38,503 43,628 -11.75 -9.20 7.40
Total Provisions 8,670 12,960 14,171 38,479 42,457 -9.37 -33.10 -38.82
Loan Loss 13,971 10,185 17,760 37,193 46,600 -20.19 37.18 -21.33
Standard Assets -64 98 -2,990 -885 -2,752
Investment Depreciation -7,994 1,749 4,044 852 3,327
Other Provisions 94 61 62 166 -232
Income Tax 2,664 868 -4,705 1,152 -4,486
Net Profit 3,955 945 -2,416 24 1,171 -97.96 318.56
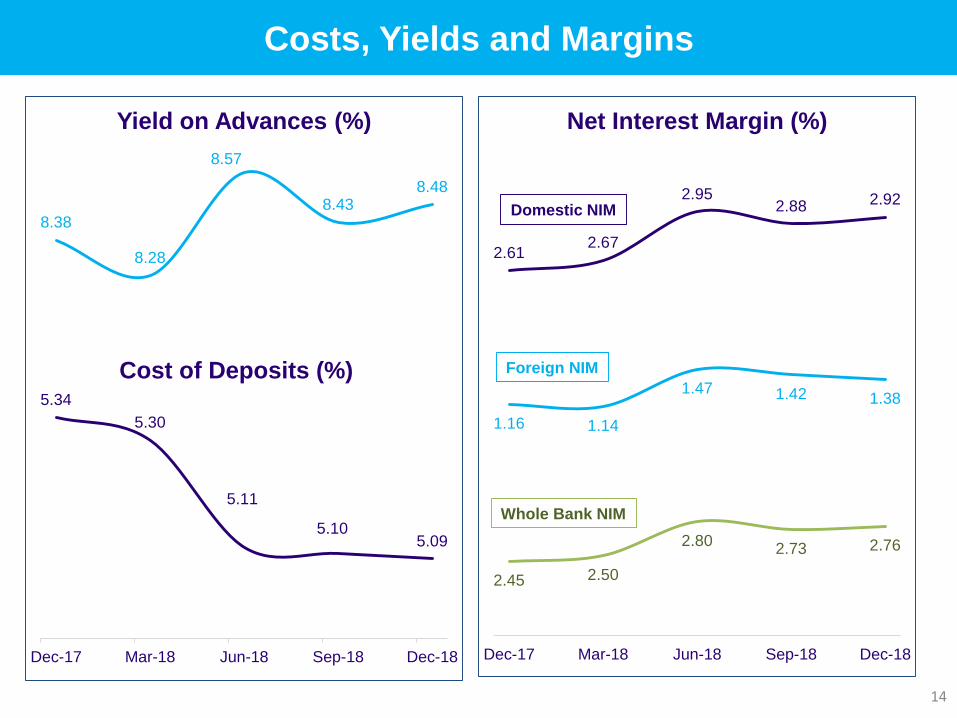
5.34
5.30
5.11
5.105.09
Dec-17 Mar-18 Jun-18 Sep-18 Dec-18
Cost of Deposits (%)
2.612.67
2.952.88 2.92
Dec-17 Mar-18 Jun-18 Sep-18 Dec-18
Net Interest Margin (%)
2.45 2.50
2.802.73 2.76
1.16 1.14
1.47 1.42 1.38
14
Costs, Yields and Margins
8.38
8.28
8.57
8.438.48
Yield on Advances (%)
Domestic NIM
Whole Bank NIM
Foreign NIM

15
Business
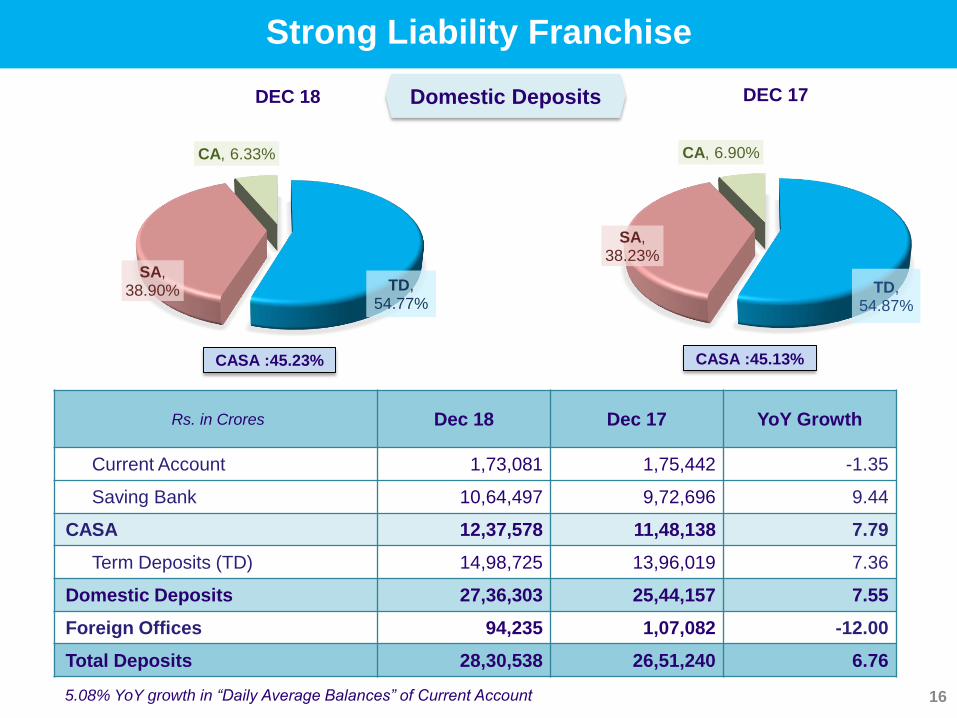
Rs. in Crores Dec 18 Dec 17 YoY Growth
Current Account 1,73,081 1,75,442 -1.35
Saving Bank 10,64,497 9,72,696 9.44
CASA 12,37,578 11,48,138 7.79
Term Deposits (TD) 14,98,725 13,96,019 7.36
Domestic Deposits 27,36,303 25,44,157 7.55
Foreign Offices 94,235 1,07,082 -12.00
Total Deposits 28,30,538 26,51,240 6.76
Strong Liability Franchise
16
TD, 54.77%
SA, 38.90%
CA, 6.33%
DEC 18
TD, 54.87%
SA, 38.23%
CA, 6.90%
DEC 17
CASA :45.23%
Domestic Deposits
CASA :45.13%
5.08% YoY growth in “Daily Average Balances” of Current Account
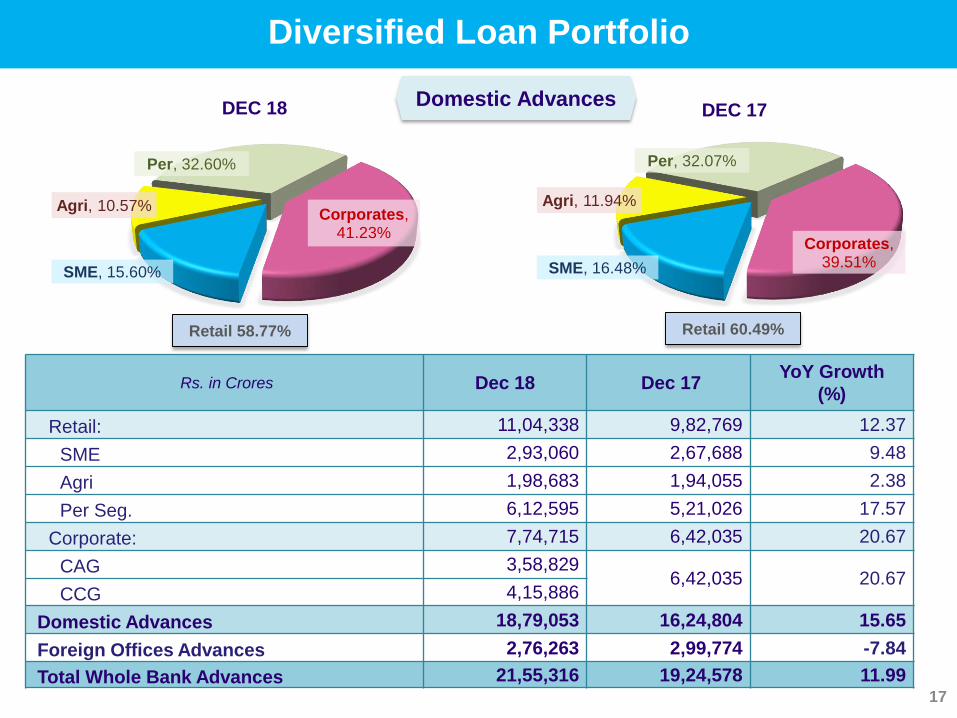
Diversified Loan Portfolio
17
SME, 15.60%
Agri, 10.57%
Per, 32.60%
Corporates, 41.23%
DEC 18
Retail 58.77%
Domestic Advances
SME, 16.48%
Agri, 11.94%
Per, 32.07%
Corporates, 39.51%
DEC 17
Rs. in Crores Dec 18 Dec 17YoY Growth
(%)
Retail: 11,04,338 9,82,769 12.37
SME 2,93,060 2,67,688 9.48
Agri 1,98,683 1,94,055 2.38
Per Seg. 6,12,595 5,21,026 17.57
Corporate: 7,74,715 6,42,035 20.67
CAG 3,58,8296,42,035 20.67
CCG 4,15,886
Domestic Advances 18,79,053 16,24,804 15.65
Foreign Offices Advances 2,76,263 2,99,774 -7.84
Total Whole Bank Advances 21,55,316 19,24,578 11.99
Retail 60.49%
18
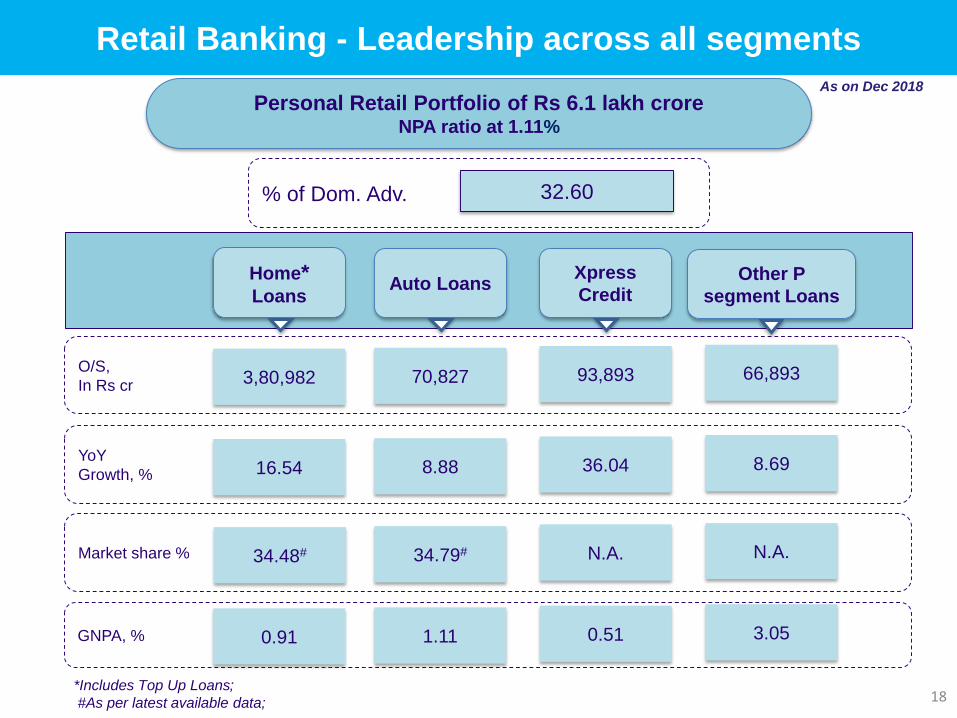
Retail Banking - Leadership across all segments
Home*Loans
Market share % 34.48# 34.79# N.A.
YoY
Growth, % 16.54 8.88 36.04
GNPA, % 0.91 1.11 0.51
O/S,
In Rs cr 3,80,982 70,827 93,893
Personal Retail Portfolio of Rs 6.1 lakh croreNPA ratio at 1.11%
% of Dom. Adv. 32.60
Other P
segment LoansAuto Loans
Xpress
Credit
N.A.
8.69
3.05
66,893
As on Dec 2018
*Includes Top Up Loans;
#As per latest available data;
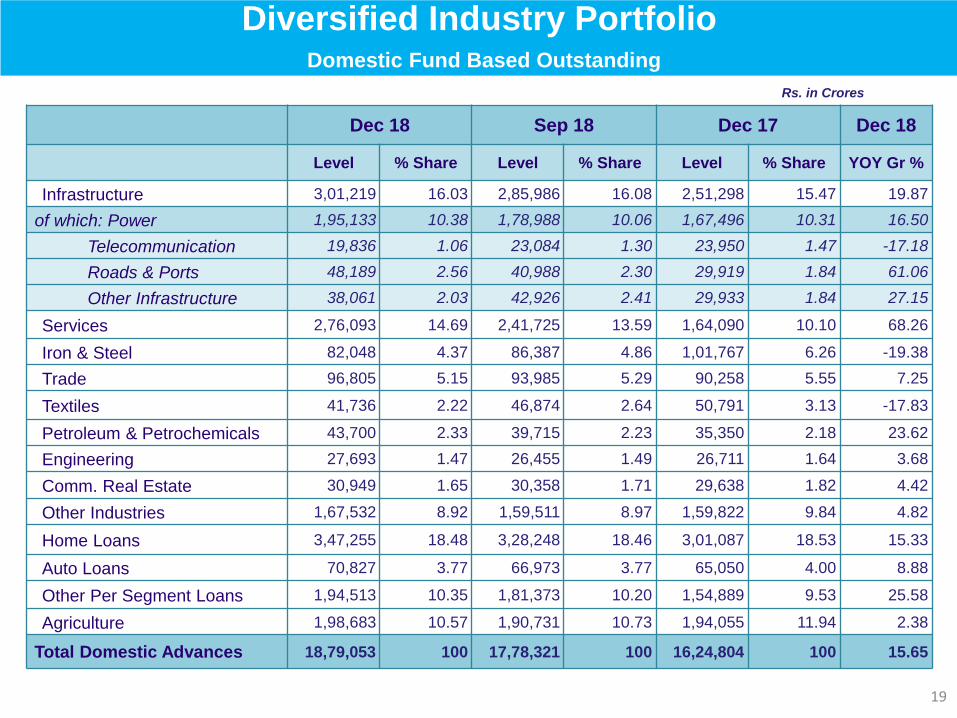
Diversified Industry PortfolioDomestic Fund Based Outstanding
Rs. in Crores
19
Dec 18 Sep 18 Dec 17 Dec 18
Level % Share Level % Share Level % Share YOY Gr %
Infrastructure 3,01,219 16.03 2,85,986 16.08 2,51,298 15.47 19.87
of which: Power 1,95,133 10.38 1,78,988 10.06 1,67,496 10.31 16.50
Telecommunication 19,836 1.06 23,084 1.30 23,950 1.47 -17.18
Roads & Ports 48,189 2.56 40,988 2.30 29,919 1.84 61.06
Other Infrastructure 38,061 2.03 42,926 2.41 29,933 1.84 27.15
Services 2,76,093 14.69 2,41,725 13.59 1,64,090 10.10 68.26
Iron & Steel 82,048 4.37 86,387 4.86 1,01,767 6.26 -19.38
Trade 96,805 5.15 93,985 5.29 90,258 5.55 7.25
Textiles 41,736 2.22 46,874 2.64 50,791 3.13 -17.83
Petroleum & Petrochemicals 43,700 2.33 39,715 2.23 35,350 2.18 23.62
Engineering 27,693 1.47 26,455 1.49 26,711 1.64 3.68
Comm. Real Estate 30,949 1.65 30,358 1.71 29,638 1.82 4.42
Other Industries 1,67,532 8.92 1,59,511 8.97 1,59,822 9.84 4.82
Home Loans 3,47,255 18.48 3,28,248 18.46 3,01,087 18.53 15.33
Auto Loans 70,827 3.77 66,973 3.77 65,050 4.00 8.88
Other Per Segment Loans 1,94,513 10.35 1,81,373 10.20 1,54,889 9.53 25.58
Agriculture 1,98,683 10.57 1,90,731 10.73 1,94,055 11.94 2.38
Total Domestic Advances 18,79,053 100 17,78,321 100 16,24,804 100 15.65

Drivers of Corporate Growth
20
Power
Roads &
Ports
YoY growth in advances
Dec 18 over Dec 17
Rs. 27,637 cr
Rs. 18,270 cr
Rs. 1,12,003 crServices
47.4%
31.4%21.2%
Growth driven by PSUs
Generation PSUs
Transmission PSUs
Other Accounts
93.7%
6.3%
Growth driven by GoI Undertaking
GoI undertaking
Other Accounts
41.9%
10.0%
25.4%
22.6%
NBFCs – key driver of growth in Services
NBFCs - Central Govt.
NBFCs - Backed by PSUs
NBFCs - Backed by largePvt. Sector institutionsOther Services

21
Treasury Operations
Rs. In crores
G-Sec and T Bill, 60.8%
CP, 9.5%
SDLs, 13.0%
Corporate Bonds, 11.6%
Others, 5.0%
DEC 17
G-Sec and T Bill, 53.5%
CP, 11.0%
SDLs, 14.4%
Corporate Bonds, 15.5%
Others, 5.6%
DEC 18
AFS Book
Modified Duration: 2.45 Modified Duration: 3.28
Total
Investments BookDec 18 Mar 18 Dec 17
Domestic
Investments9,93,472 10,26,438 10,04,601
- of which- SLR 8,21,729 8,54,476 8,48,011
Foreign Offices
Investments51,403 46,659 43,141
Whole Bank
Investments10,44,875 10,73,098 10,47,743
50.4 45.3 42.9
48.8 54.7 57.1
0.78 0.02
Dec 18 Mar 18 Dec 17
Break up of Domestic Investments (%)
HTM AFS HFT
22
Capital Adequacy & Asset Quality

9.60%
9.65%
9.57%
0.70%
0.71%
0.97%
2.38%
2.25%
2.23%
Dec 17
Sep 18
Dec 18 12.77%
12.61%
12.68%
10.36%
10.54%
10.30%
Capital Adequacy
23
• “CRWAs on Advances to Total Advances” Ratio improved to 59.73% as on Dec 18 from 63.09% as on Dec 17
• “TRWAs to Total Assets” Ratio improved to 54.41% as on Dec 18 from 58.71% as on Dec 17
CET I (7.825) AT I
Bank raised Additional Tier I Bonds of Rs. 6,066 Crs and Tier II Bonds of Rs. 4,116 Crs during Q3FY19
CAR (11.325)Tier II
Tier I (9.325%)
Min. Reg. Req.
Mar 19

24
Asset Quality (1/3)
Rs. in Crores
Dec 18 Sep 18 Mar 18 Dec 17
Gross NPA Ratio (%) 8.71 9.95 10.91 10.35
Net NPA Ratio (%) 3.95 4.84 5.73 5.61
Provision Coverage Ratio (%) 74.63 70.74 66.17 65.92
Provision Coverage Ratio (Excl. AUCA) (%) 56.89 53.95 50.38 48.59
Slippage Ratio (%) 1.64 2.02 4.85 4.17
Credit cost (%) 2.42 2.27 3.62 3.18
1,99,141
2,23,427
2,12,840
2,05,864
1,87,765
Dec-17 Mar-18 Jun-18 Sep-18 Dec 18
Gross NPA
1,02,3701,10,855
99,23694,810
80,944
Dec-17 Mar-18 Jun-18 Sep-18 Dec 18
Net NPA
25
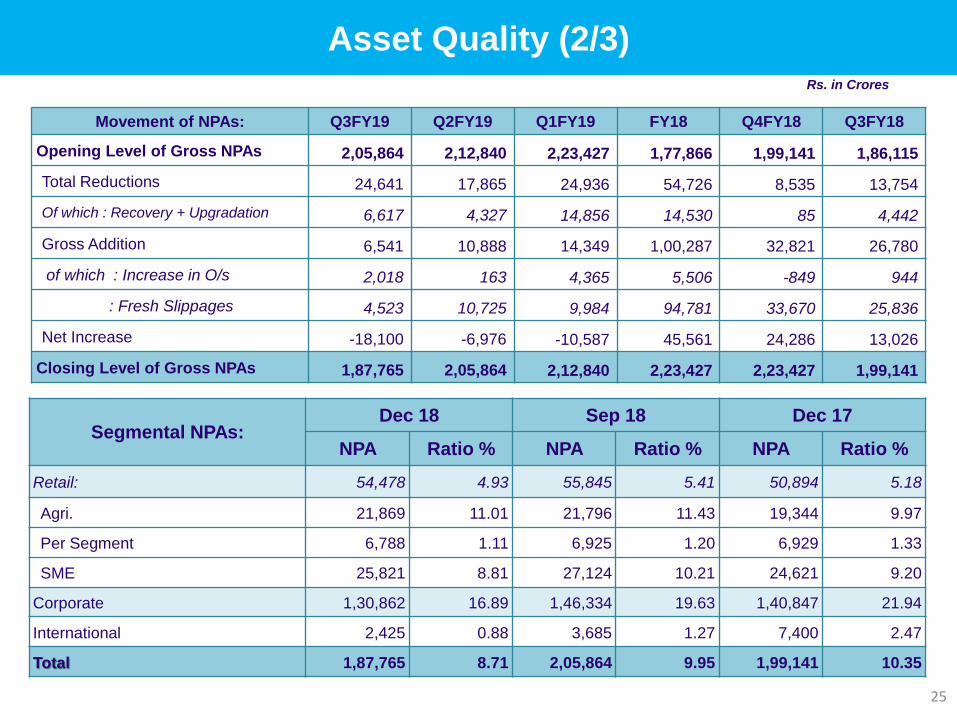
Asset Quality (2/3)
Movement of NPAs: Q3FY19 Q2FY19 Q1FY19 FY18 Q4FY18 Q3FY18
Opening Level of Gross NPAs 2,05,864 2,12,840 2,23,427 1,77,866 1,99,141 1,86,115
Total Reductions 24,641 17,865 24,936 54,726 8,535 13,754
Of which : Recovery + Upgradation 6,617 4,327 14,856 14,530 85 4,442
Gross Addition 6,541 10,888 14,349 1,00,287 32,821 26,780
of which : Increase in O/s 2,018 163 4,365 5,506 -849 944
: Fresh Slippages 4,523 10,725 9,984 94,781 33,670 25,836
Net Increase -18,100 -6,976 -10,587 45,561 24,286 13,026
Closing Level of Gross NPAs 1,87,765 2,05,864 2,12,840 2,23,427 2,23,427 1,99,141
Rs. in Crores
Segmental NPAs: Dec 18 Sep 18 Dec 17
NPA Ratio % NPA Ratio % NPA Ratio %
Retail: 54,478 4.93 55,845 5.41 50,894 5.18
Agri. 21,869 11.01 21,796 11.43 19,344 9.97
Per Segment 6,788 1.11 6,925 1.20 6,929 1.33
SME 25,821 8.81 27,124 10.21 24,621 9.20
Corporate 1,30,862 16.89 1,46,334 19.63 1,40,847 21.94
International 2,425 0.88 3,685 1.27 7,400 2.47
Total 1,87,765 8.71 2,05,864 9.95 1,99,141 10.35

Asset Quality- Whole Bank SMA 1 & SMA 2 (3/3)
26
Corporate
Watchlist
Corporate slippages continue to decline. Slippages from watchlist not significant any longer
SMA 1 & SMA 2 across all verticals, more representative of stress as compared to watchlist;
~ Rs 14,000 cr of erstwhile watchlist not in SMA 1 or SMA 2 category
13,440 3,619
SMA 1 & SMA 2 across all verticals*
SMA 1 SMA 2
561
565
130
2626
Sectorwise Corporate Slippages
Others Roads & EPC Iron & Steel Textile Power
*Only includes accounts with exposure of Rs. 5 cr and above. From data submitted to CRILC
Rs. in Crores
1
2
17,059
Total Corporate Slippages – 1,308 Total SMA 1 and SMA 2 – 17,059
1,308
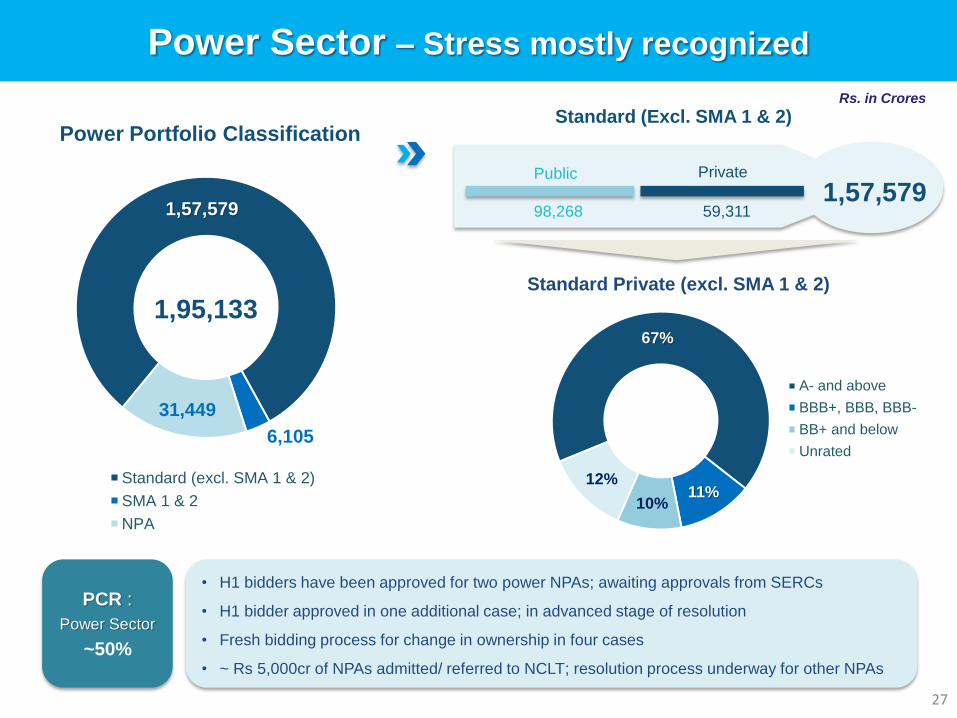
1,57,579
6,105
31,449
Power Portfolio Classification
Standard (excl. SMA 1 & 2)
SMA 1 & 2
NPA
1,95,133
Power Sector – Stress mostly recognized
27
67%
11%10%
12%
Standard Private (excl. SMA 1 & 2)
A- and above
BBB+, BBB, BBB-
BB+ and below
Unrated
• H1 bidders have been approved for two power NPAs; awaiting approvals from SERCs
• H1 bidder approved in one additional case; in advanced stage of resolution
• Fresh bidding process for change in ownership in four cases
• ~ Rs 5,000cr of NPAs admitted/ referred to NCLT; resolution process underway for other NPAs
PrivatePublic
59,31198,2681,57,579
PCR :
Power Sector
~50%
Rs. in Crores
Standard (Excl. SMA 1 & 2)
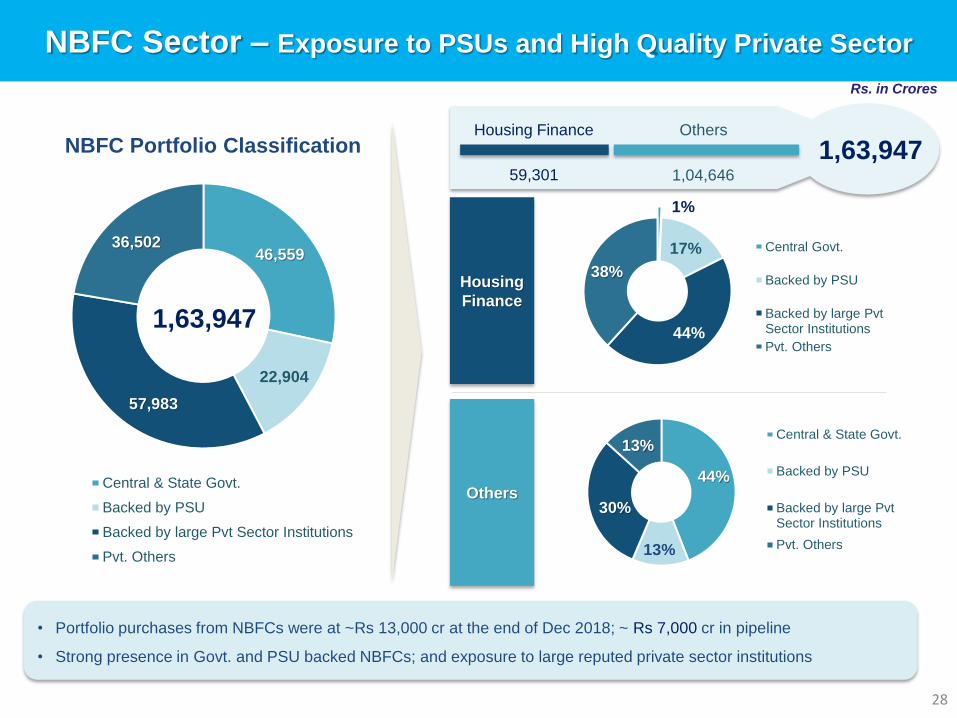
46,559
22,904
57,983
36,502
NBFC Portfolio Classification
Central & State Govt.
Backed by PSU
Backed by large Pvt Sector Institutions
Pvt. Others
1,63,947
NBFC Sector – Exposure to PSUs and High Quality Private Sector
28
Housing
Finance
1%
17%
44%
38%
Central Govt.
Backed by PSU
Backed by large Pvt Sector Institutions
Pvt. Others
Others 44%
13%
30%
13%Central & State Govt.
Backed by PSU
Backed by large PvtSector Institutions
Pvt. Others
Housing Finance Others
59,301 1,04,646
1,63,947
• Portfolio purchases from NBFCs were at ~Rs 13,000 cr at the end of Dec 2018; ~ Rs 7,000 cr in pipeline
• Strong presence in Govt. and PSU backed NBFCs; and exposure to large reputed private sector institutions
Rs. in Crores

Status of NCLT accounts
Rs. 25,681 cr
List 1 Fund Based o/s
Rs. 18,641 cr
List 2 Fund Based o/s 66%
86%
75%
NCLT 1 NCLT 2 Total
PCR on NCLT accounts
• Four accounts resolved from NCLT 1 & 2 List, with recovery > 67%;
• One account from NCLT 2 list sold to ARC with recovery of ~69% on 100% cash sale basis.
• Resolution of NCLT accounts to lead to lower GNPAs, in addition to better margins.
• 20 accounts having 100% PCR
Rs. 44,323 cr
Total
29
PCR without AUCA 57% 81% 67%Rs. 58,927 cr
Total (Incl.AUCA)
As on Dec 2018
30
Digital Banking / Financial Inclusion

Technology and Innovation
31
Share of Transactions through Alternate Channels (87.75%)
Transactions (87.75%)
20.8%
1.1%
13.0%
1.1%
36.4%
5.1%1.9%
16.2%
4.4%
Dec 17
Internet Banking Cash @ POS POS & e-Commerce Mobile Banking ATM/ CDM
BC Channel UPI & YONO Branch Green Channel
Share of Txns through
Alt. Channel
83.80%
17.0%
4.0%
13.4%
1.5%
31.9%
5.4%
11.3%
12.3%
3.2%
Dec 18
Share of Txns through
Alt. Channel
87.75%
58,350 58,210
22,090
No. of ATM/CDMs
No. of BCoutlets
No. ofBranches
Customer Touch Points
129564
378115
604403 577288
885314
BHIM Merchants Bharat QR BHIM-Aadhaar-SBI SBI PSPL BHIM SBI Pay
25.75 lakh Merchant Payment Acceptance Touch Points
57.3 mn
13.26 mn
No. of InternetBanking users
No. of MobileBanking users
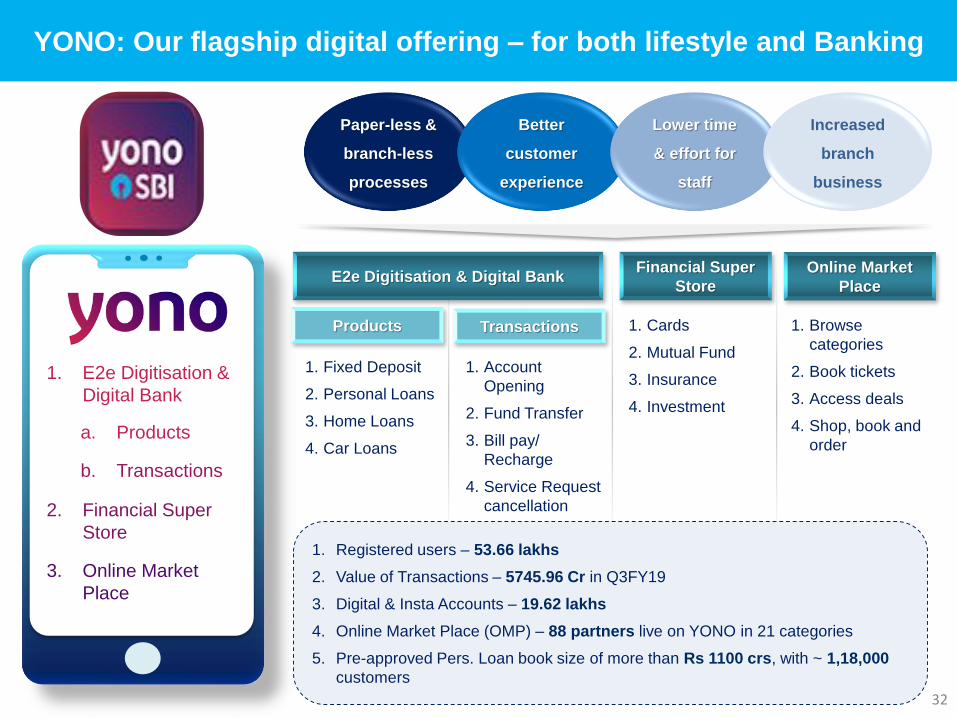
YONO: Our flagship digital offering – for both lifestyle and Banking
32
Paper-less &
branch-less
processes
Better
customer
experience
Lower time
& effort for
staff
Increased
branch
business
1. Account
Opening
2. Fund Transfer
3. Bill pay/
Recharge
4. Service Request
cancellation
Products 1. Cards
2. Mutual Fund
3. Insurance
4. Investment
Financial Super
Store
1. Browse
categories
2. Book tickets
3. Access deals
4. Shop, book and
order
Online Market
PlaceE2e Digitisation & Digital Bank
1. Fixed Deposit
2. Personal Loans
3. Home Loans
4. Car Loans
Transactions
1. Registered users – 53.66 lakhs
2. Value of Transactions – 5745.96 Cr in Q3FY19
3. Digital & Insta Accounts – 19.62 lakhs
4. Online Market Place (OMP) – 88 partners live on YONO in 21 categories
5. Pre-approved Pers. Loan book size of more than Rs 1100 crs, with ~ 1,18,000
customers
1. E2e Digitisation &
Digital Bank
2. Financial Super
Store
3. Online Market
Place
a. Products
b. Transactions
33
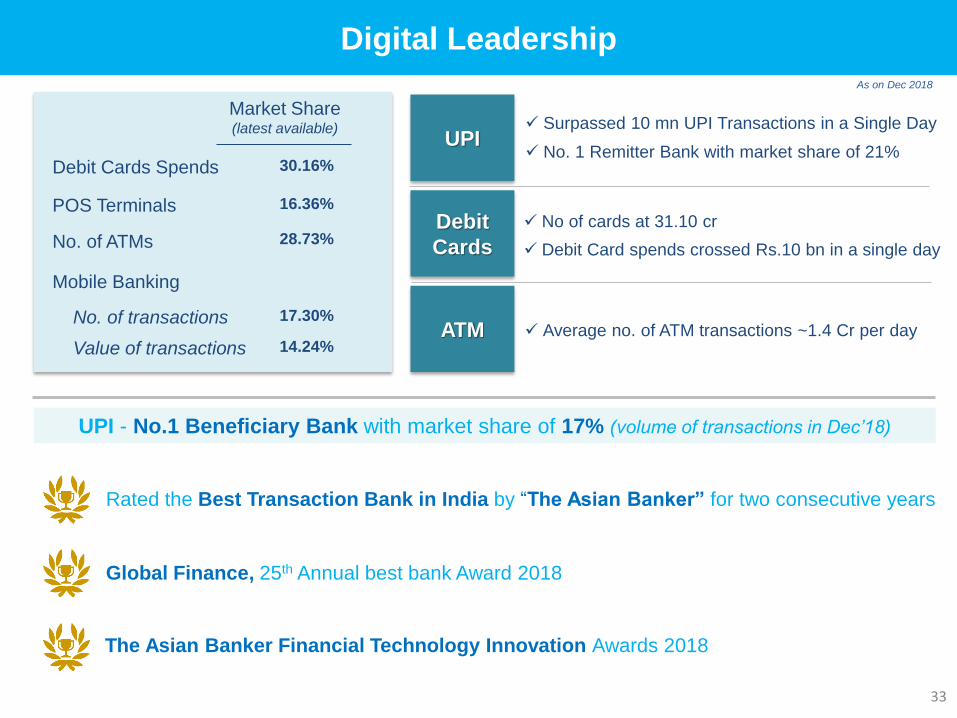
Digital Leadership
As on Dec 2018
Market Share(latest available)
Debit Cards Spends
POS Terminals
No. of ATMs
Mobile Banking
30.16%
16.36%
28.73%
17.30%No. of transactions
Value of transactions 14.24%
Debit
Cards
ATM
No of cards at 31.10 cr
Debit Card spends crossed Rs.10 bn in a single day
Average no. of ATM transactions ~1.4 Cr per day
UPI Surpassed 10 mn UPI Transactions in a Single Day
No. 1 Remitter Bank with market share of 21%
UPI - No.1 Beneficiary Bank with market share of 17% (volume of transactions in Dec’18)
The Asian Banker Financial Technology Innovation Awards 2018
Global Finance, 25th Annual best bank Award 2018
Rated the Best Transaction Bank in India by “The Asian Banker” for two consecutive years

Financial Inclusion
34
91,228
1,23,403
21,358
27,787
0
5,000
10,000
15,000
20,000
25,000
30,000
20,000
40,000
60,000
80,000
1,00,000
1,20,000
1,40,000
1,60,000
1,80,000
9MFY18 9MFY19
Transactions Amount Financial Inclusion Deposits
Transactions Amount and Deposits Level
(Rs. in Crores)
1594 1787 1988
OD facility for PMJDY accounts - Eligible accounts 20.46 lakh; Sanctioned 10.27 lakh accounts (50.17%)
No. of BCs: 58,210; Financial Literacy Centers (FLC) : 338
RSETI: Total Number:151; No. of Training Programmes held: 25,486, Youth Trained 6,81,029, Youths settled :4,60,505
PM Suraksha Bima Yojana: 220.27 Lakh; PM Jeevan Jyoti Bima Yojana: 59.21 Lakh; Atal Pension Yojana: 17.96 Lakh (In Nos.)
2.9 2.9 3.3
10.5 10.5 10.7
14.0 12.710.9
0.0
5.0
10.0
15.0
20.0
25.0
30.0
0.0
2.0
4.0
6.0
8.0
10.0
12.0
14.0
16.0
Dec 17 Mar 18 Dec 18
PMJDY Others Zero Bal A/cs (%)
7.4 7.4
Aadhar Seeded
A/cs (In crs)
Average Balance (Rs.)
Accounts
(No. in Crores)
7.9
13.40 13.42 13.98
35
Subsidiaries,
Group Financials &
Balance Sheet
36
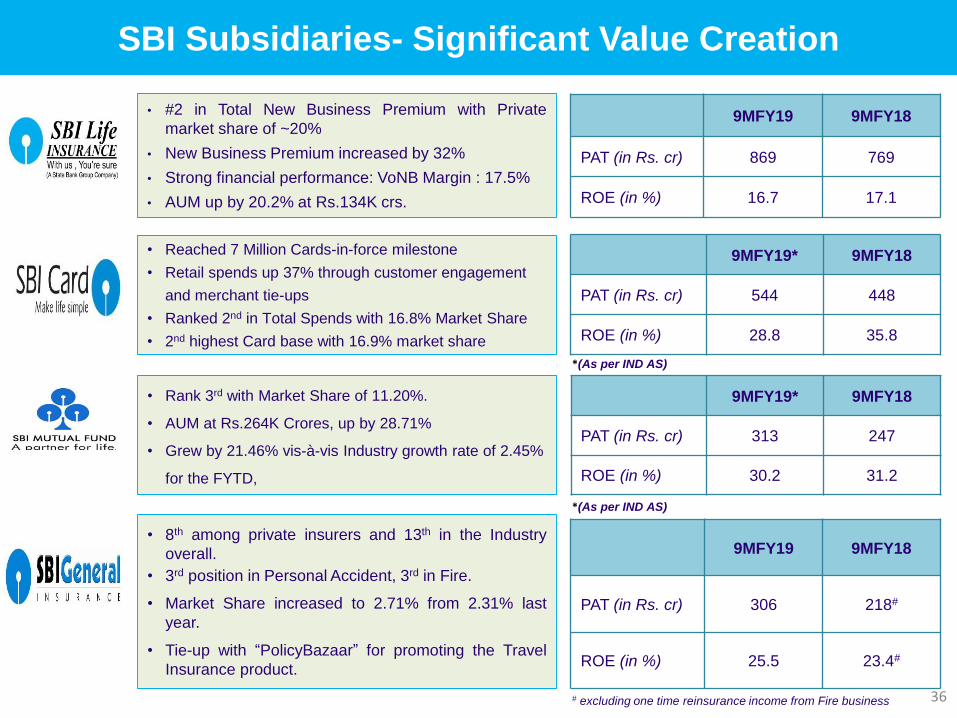
SBI Subsidiaries- Significant Value Creation
9MFY19 9MFY18
PAT (in Rs. cr) 869 769
ROE (in %) 16.7 17.1
9MFY19* 9MFY18
PAT (in Rs. cr) 544 448
ROE (in %) 28.8 35.8
• Reached 7 Million Cards-in-force milestone
• Retail spends up 37% through customer engagement
and merchant tie-ups
• Ranked 2nd in Total Spends with 16.8% Market Share
• 2nd highest Card base with 16.9% market share
9MFY19* 9MFY18
PAT (in Rs. cr) 313 247
ROE (in %) 30.2 31.2
• Rank 3rd with Market Share of 11.20%.
• AUM at Rs.264K Crores, up by 28.71%
• Grew by 21.46% vis-à-vis Industry growth rate of 2.45%
for the FYTD,
• #2 in Total New Business Premium with Private
market share of ~20%
• New Business Premium increased by 32%
• Strong financial performance: VoNB Margin : 17.5%
• AUM up by 20.2% at Rs.134K crs.
• 8th among private insurers and 13th in the Industry
overall.
• 3rd position in Personal Accident, 3rd in Fire.
• Market Share increased to 2.71% from 2.31% last
year.
• Tie-up with “PolicyBazaar” for promoting the Travel
Insurance product.
9MFY19 9MFY18
PAT (in Rs. cr) 306 218#
ROE (in %) 25.5 23.4#
*(As per IND AS)
*(As per IND AS)
# excluding one time reinsurance income from Fire business
37
Rs. In crores
Rs. In crores
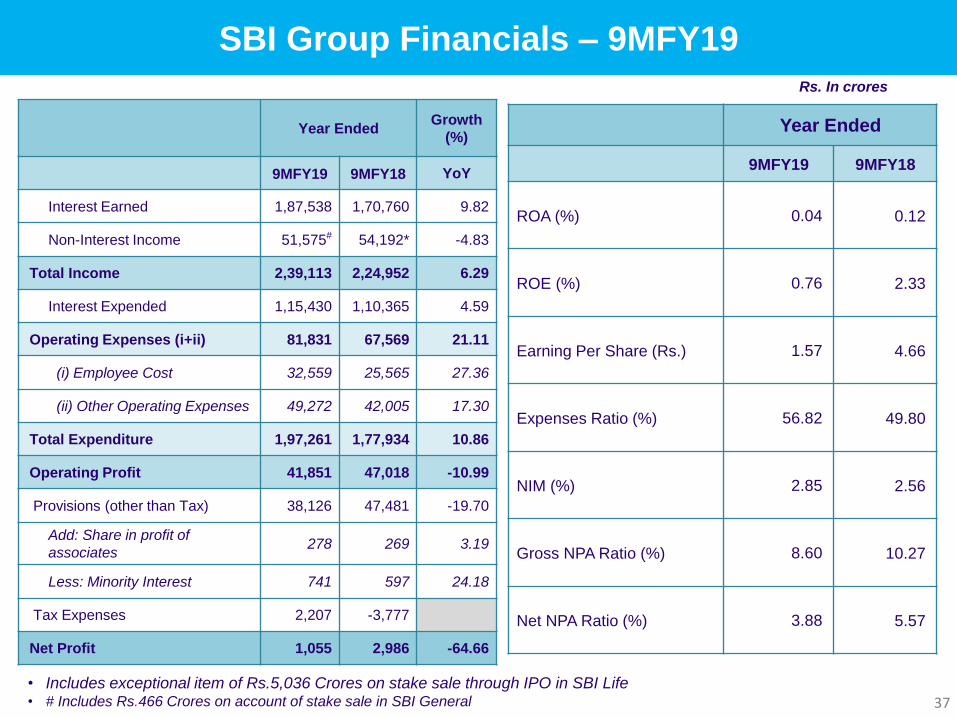
SBI Group Financials – 9MFY19
• Includes exceptional item of Rs.5,036 Crores on stake sale through IPO in SBI Life • # Includes Rs.466 Crores on account of stake sale in SBI General
Year Ended
9MFY19 9MFY18
ROA (%) 0.04 0.12
ROE (%) 0.76 2.33
Earning Per Share (Rs.) 1.57 4.66
Expenses Ratio (%) 56.82 49.80
NIM (%) 2.85 2.56
Gross NPA Ratio (%) 8.60 10.27
Net NPA Ratio (%) 3.88 5.57
Year EndedGrowth
(%)
9MFY19 9MFY18 YoY
Interest Earned 1,87,538 1,70,760 9.82
Non-Interest Income 51,575# 54,192* -4.83
Total Income 2,39,113 2,24,952 6.29
Interest Expended 1,15,430 1,10,365 4.59
Operating Expenses (i+ii) 81,831 67,569 21.11
(i) Employee Cost 32,559 25,565 27.36
(ii) Other Operating Expenses 49,272 42,005 17.30
Total Expenditure 1,97,261 1,77,934 10.86
Operating Profit 41,851 47,018 -10.99
Provisions (other than Tax) 38,126 47,481 -19.70
Add: Share in profit of
associates278 269 3.19
Less: Minority Interest 741 597 24.18
Tax Expenses 2,207 -3,777
Net Profit 1,055 2,986 -64.66
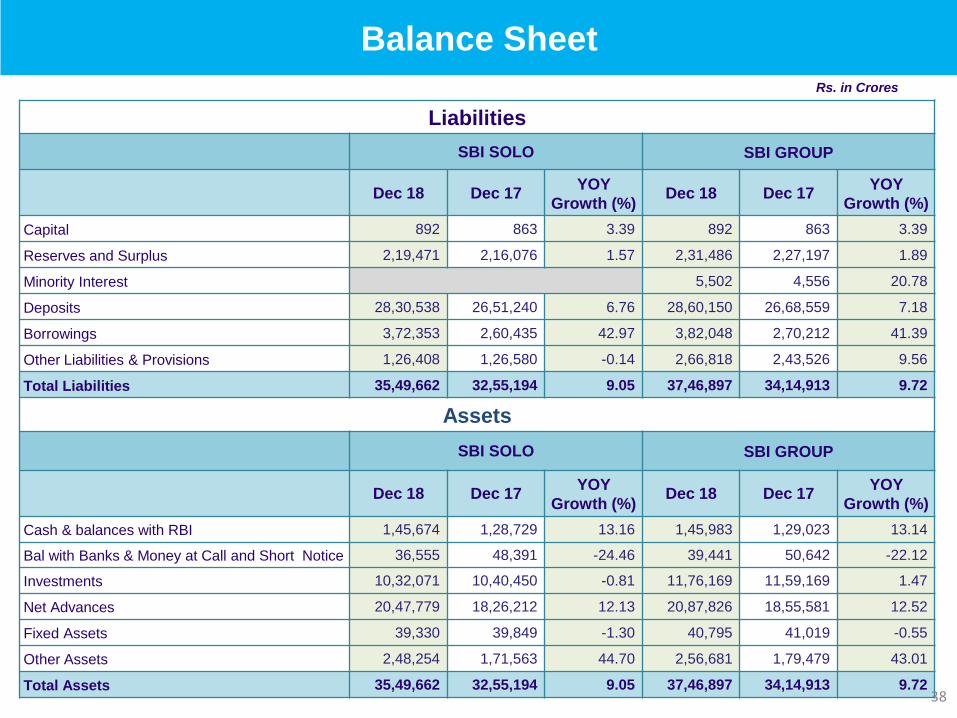
Balance Sheet
Liabilities
SBI SOLO SBI GROUP
Dec 18 Dec 17YOY
Growth (%) Dec 18 Dec 17
YOY
Growth (%)
Capital 892 863 3.39 892 863 3.39
Reserves and Surplus 2,19,471 2,16,076 1.57 2,31,486 2,27,197 1.89
Minority Interest 5,502 4,556 20.78
Deposits 28,30,538 26,51,240 6.76 28,60,150 26,68,559 7.18
Borrowings 3,72,353 2,60,435 42.97 3,82,048 2,70,212 41.39
Other Liabilities & Provisions 1,26,408 1,26,580 -0.14 2,66,818 2,43,526 9.56
Total Liabilities 35,49,662 32,55,194 9.05 37,46,897 34,14,913 9.72
Assets
SBI SOLO SBI GROUP
Dec 18 Dec 17YOY
Growth (%) Dec 18 Dec 17
YOY
Growth (%)
Cash & balances with RBI 1,45,674 1,28,729 13.16 1,45,983 1,29,023 13.14
Bal with Banks & Money at Call and Short Notice 36,555 48,391 -24.46 39,441 50,642 -22.12
Investments 10,32,071 10,40,450 -0.81 11,76,169 11,59,169 1.47
Net Advances 20,47,779 18,26,212 12.13 20,87,826 18,55,581 12.52
Fixed Assets 39,330 39,849 -1.30 40,795 41,019 -0.55
Other Assets 2,48,254 1,71,563 44.70 2,56,681 1,79,479 43.01
Total Assets 35,49,662 32,55,194 9.05 37,46,897 34,14,913 9.72
Rs. in Crores
38

Thank You