Analyst Meet November 15, 2016
19
Analyst Meet November 15, 2016
Transcript of Analyst Meet November 15, 2016

Analyst Meet November 15, 2016
Agenda
1. H1 FY2016-17 – BUSINESS PERFORMANCE
2. FINANCIAL OVERVIEW
2
3
H1 - Business Performance

4
Key Highlights
Second consecutive quarter of significant operating profit growth Top up by 1% – volume growth offset by price and adverse
currency translation impact.
Significant improvement in operating profits
Despite
Continuing competitive intensity in developed markets
Commodity costs Softness prevails in India and Kenya tea prices
Coffee Costs – lower than previous highs, but showing a hardening trend
Phasing of initiatives and good control on spends
Currency Markets No material impact on financials despite volatile currency
markets
Depreciation in GBP mainly due to Brexit
Financials reported under IND (AS)

2016 2015
259
166
2016 2015
3361 3339
2016 2015
364 264
5
Snapshot of financials
Total Operating Income
+38%
+ 56%
Total Operating Profits
Group Net Profits
Rs Crs
Rs Crs
Rs Crs
+1%
6
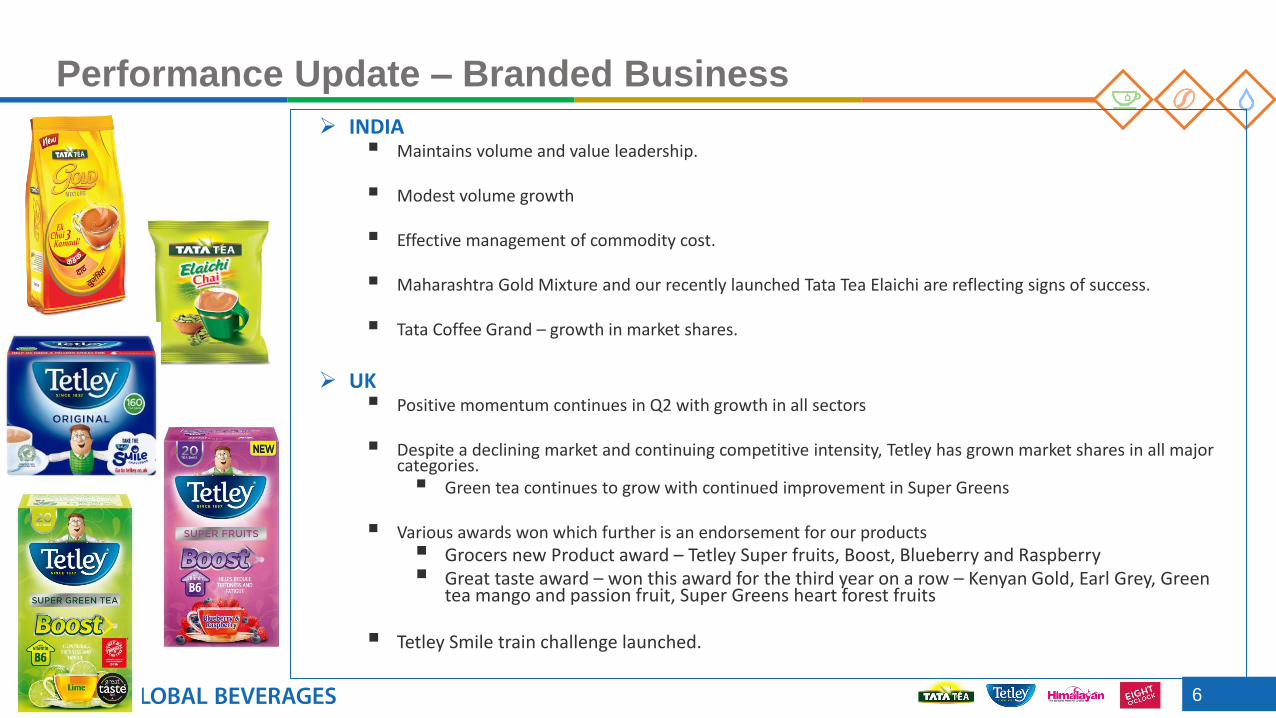
Performance Update – Branded Business
INDIA Maintains volume and value leadership. Modest volume growth
Effective management of commodity cost.
Maharashtra Gold Mixture and our recently launched Tata Tea Elaichi are reflecting signs of success.
Tata Coffee Grand – growth in market shares.
UK Positive momentum continues in Q2 with growth in all sectors
Despite a declining market and continuing competitive intensity, Tetley has grown market shares in all major
categories. Green tea continues to grow with continued improvement in Super Greens
Various awards won which further is an endorsement for our products
Grocers new Product award – Tetley Super fruits, Boost, Blueberry and Raspberry Great taste award – won this award for the third year on a row – Kenyan Gold, Earl Grey, Green
tea mango and passion fruit, Super Greens heart forest fruits
Tetley Smile train challenge launched.
7
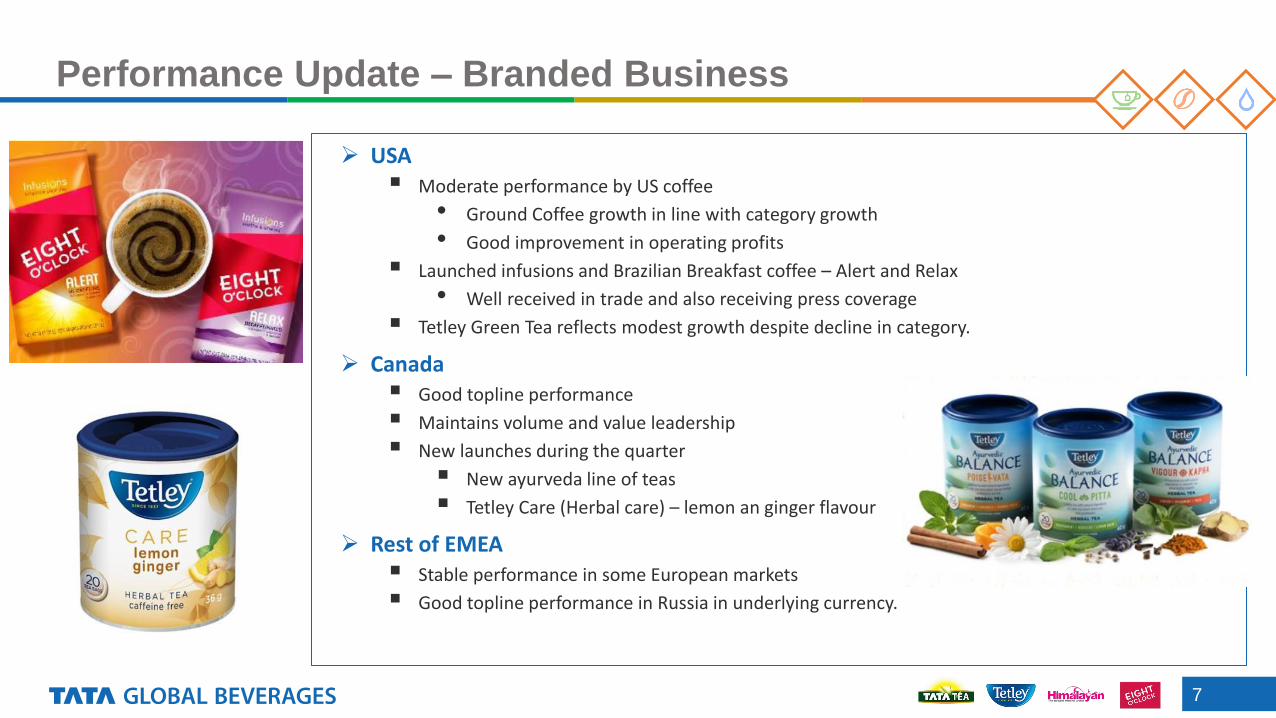
Performance Update – Branded Business
USA Moderate performance by US coffee
• Ground Coffee growth in line with category growth
• Good improvement in operating profits
Launched infusions and Brazilian Breakfast coffee – Alert and Relax
• Well received in trade and also receiving press coverage
Tetley Green Tea reflects modest growth despite decline in category.
Canada Good topline performance
Maintains volume and value leadership
New launches during the quarter
New ayurveda line of teas
Tetley Care (Herbal care) – lemon an ginger flavour
Rest of EMEA Stable performance in some European markets
Good topline performance in Russia in underlying currency.
8
Performance Update – Non Branded Business
Spectacular performance by Tata Coffee Ltd continues - reflecting increase in Operating Income as well as Operating Profit
Instant Coffee Improvement in coffee extraction business driven by volume improvement.
Instant Tea Instant tea business reflects a stable topline performance with good improvements in operating
profit.
China business yet to stabilize.
Plantations Improvements in tea plantation attributable to price increases and improved volume sales.
Stable performance in coffee plantations.

9
Performance Update – Incubatory businesses
Middle East ME - Strong quarter with healthy growth in all six markets
Fresh foil pack launched – positive response from consumers
Kanan Devan Loose tea doing well in the hot tea segment
Focus on drawstring bags with advertisement support in TV, outdoor and digital space
Starbucks JV Topline growth with good store-level profitability
Expansion to continue – new cities, new formats
Nourishco Double digit growth continues for Tata Gluco Plus / Himalayan
Himalayan demonstrated good growth in traditional trade, e commerce and key accounts

10
H1 - Financial Overview
11
Financial Overview - YTD
Operating income up by 1%
• Good volume growth in branded tea business
• Improvements in Branded Business –India, UK, Canada and Russia
• Improved non-branded business performance - Coffee extraction and tea plantation
Offset by
• Price decreases and adverse currency movements
Operating profits higher than prior year (+38%)
• Improved performance in Branded Business in some markets
• Lower commodity costs
• Phasing of initiatives and good control over spends
• Improved performance in Non Branded Business
Group net profit significantly improves over prior year (+56%)
• Improved operating performance
• Improved performance in JV’s and associates

12
Financial Highlights - PL
Quarter ending Sep’2016 Particulars Half year ending Sep’2016
Actual PY Variance (In Rs crores) Actual PY Variance
1626 1669 (43) Total Operating Income 3361 3339 22
162 111 51 EBIT 364 264 100
31 33 (2) Other Income 52 46 6
(23) (21) (2) Finance Cost (45) (42) (3)
170 123 47 Profit Before Exceptional Items 371 268 103
- (5) 5 Exceptional Items (2) (8) 6
170 118 52 Profit Before Tax 369 260 109
(62) (45) (17) Tax (135) (101) (34)
108 73 35 Profit After Tax 234 159 75
32 14 18 Share of Profit from JVs & Associates 25 7 18
140 87 53 Consolidated Group Net Profit 259 166 93
2.01 1.27 Earning Per Share (not annualised) (Rs) 3.65 2.42
13
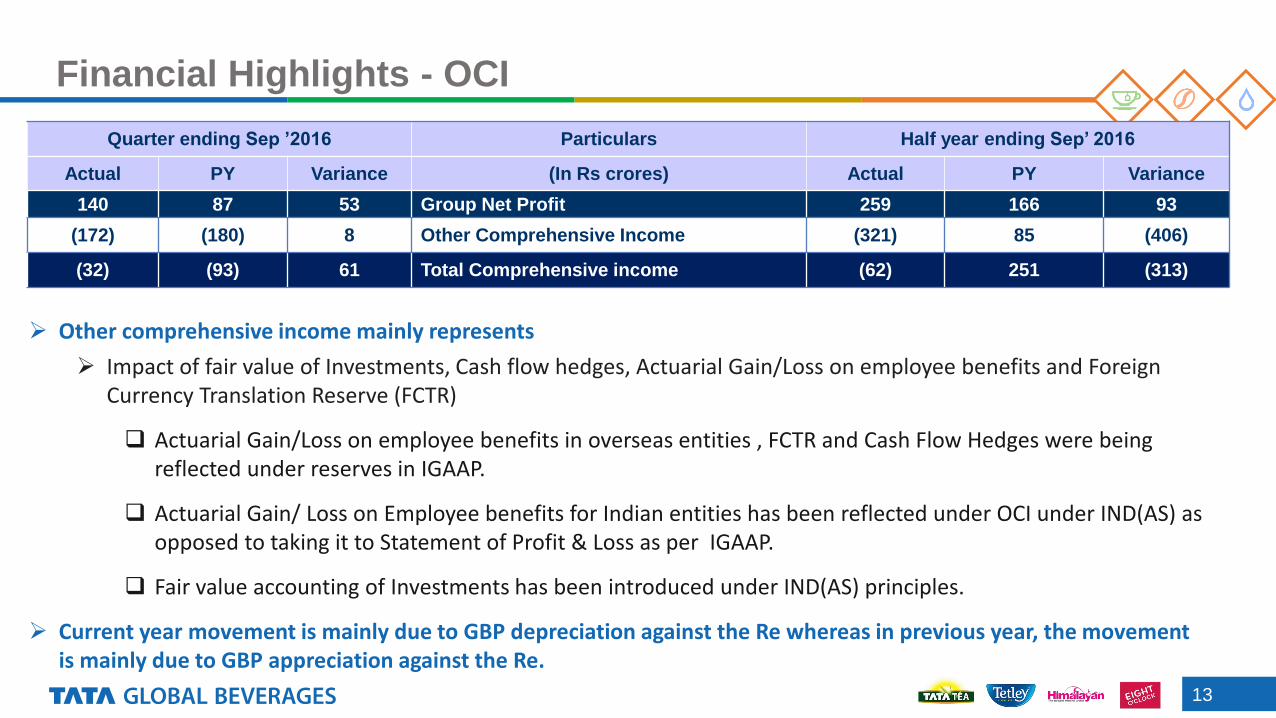
Financial Highlights - OCI
Quarter ending Sep ’2016 Particulars Half year ending Sep’ 2016
Actual PY Variance (In Rs crores) Actual PY Variance
140 87 53 Group Net Profit 259 166 93
(172) (180) 8 Other Comprehensive Income (321) 85 (406)
(32) (93) 61 Total Comprehensive income (62) 251 (313)
Other comprehensive income mainly represents
Impact of fair value of Investments, Cash flow hedges, Actuarial Gain/Loss on employee benefits and Foreign Currency Translation Reserve (FCTR)
Actuarial Gain/Loss on employee benefits in overseas entities , FCTR and Cash Flow Hedges were being reflected under reserves in IGAAP.
Actuarial Gain/ Loss on Employee benefits for Indian entities has been reflected under OCI under IND(AS) as opposed to taking it to Statement of Profit & Loss as per IGAAP.
Fair value accounting of Investments has been introduced under IND(AS) principles.
Current year movement is mainly due to GBP depreciation against the Re whereas in previous year, the movement is mainly due to GBP appreciation against the Re.
14
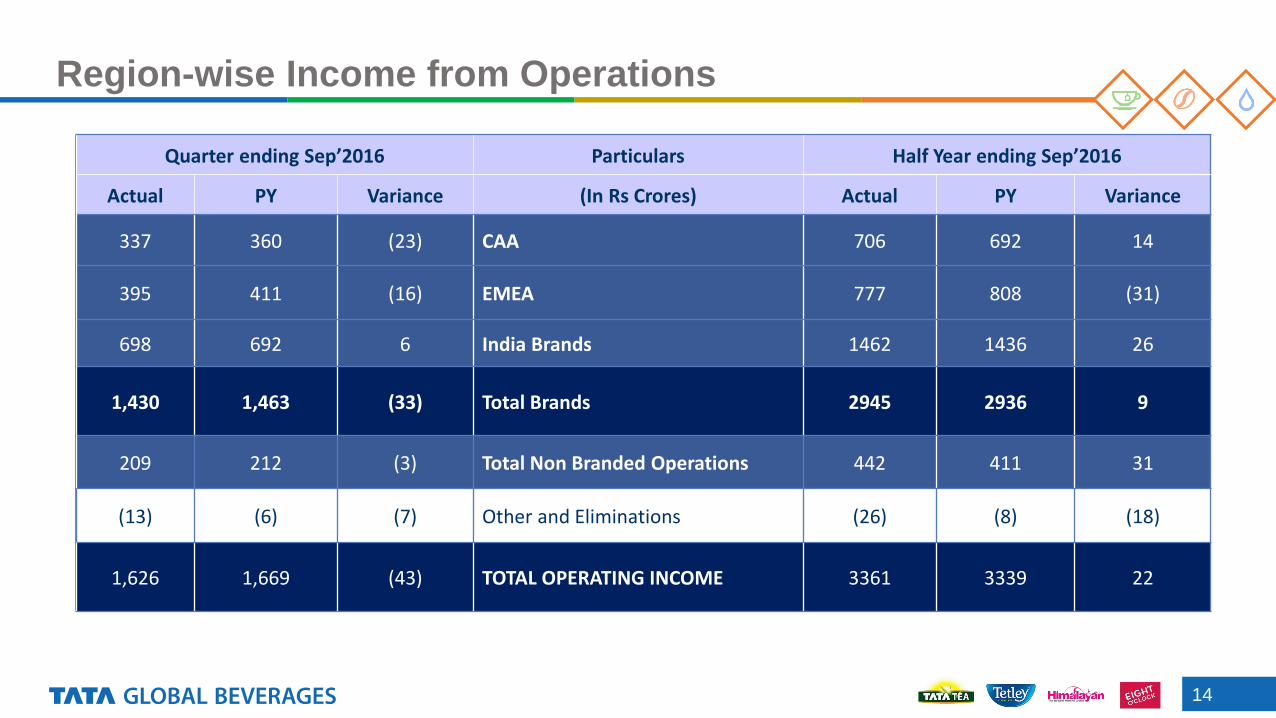
Region-wise Income from Operations
Quarter ending Sep’2016 Particulars Half Year ending Sep’2016
Actual PY Variance (In Rs Crores) Actual PY Variance
337 360 (23) CAA 706 692 14
395 411 (16) EMEA 777 808 (31)
698 692 6 India Brands 1462 1436 26
1,430 1,463 (33) Total Brands 2945 2936 9
209 212 (3) Total Non Branded Operations 442 411 31
(13) (6) (7) Other and Eliminations (26) (8) (18)
1,626 1,669 (43) TOTAL OPERATING INCOME 3361 3339 22

15
Segment - YTD
The group has organised it's business into Branded Segment and Non Branded Segment.
Branded Segment is further sub-categorised as Branded Tea, Branded Coffee and the
residual as Branded Others.
Accordingly, the group has reported its segment results for these segments. This complies with
Ind AS – 108 – Segment reporting principles, and is made effective from 1st April, 2016 and the
previous quarter numbers have been regrouped/reclassified.
Particulars Segment Revenue Segment Results Capital Employed
(In Rs Crores) Sep 16 Sep 15 Sep 16 Sep 15 Sep 16 Sep 15
Branded Business
Tea 2383 2397 321 297 3308 3989
Coffee 557 534 99 53 1693 1757
Others 13 11 (8) (11) 16 29
Total Branded Business 2953 2943 412 339 5018 5775
Non Branded Business 440 410 62 29 748 786
Less: Inter-segment Revenue (32) (14)
Un-allocable items (105) (108) 1123 906
Total 3361 3339 369 260 6889 7467
16
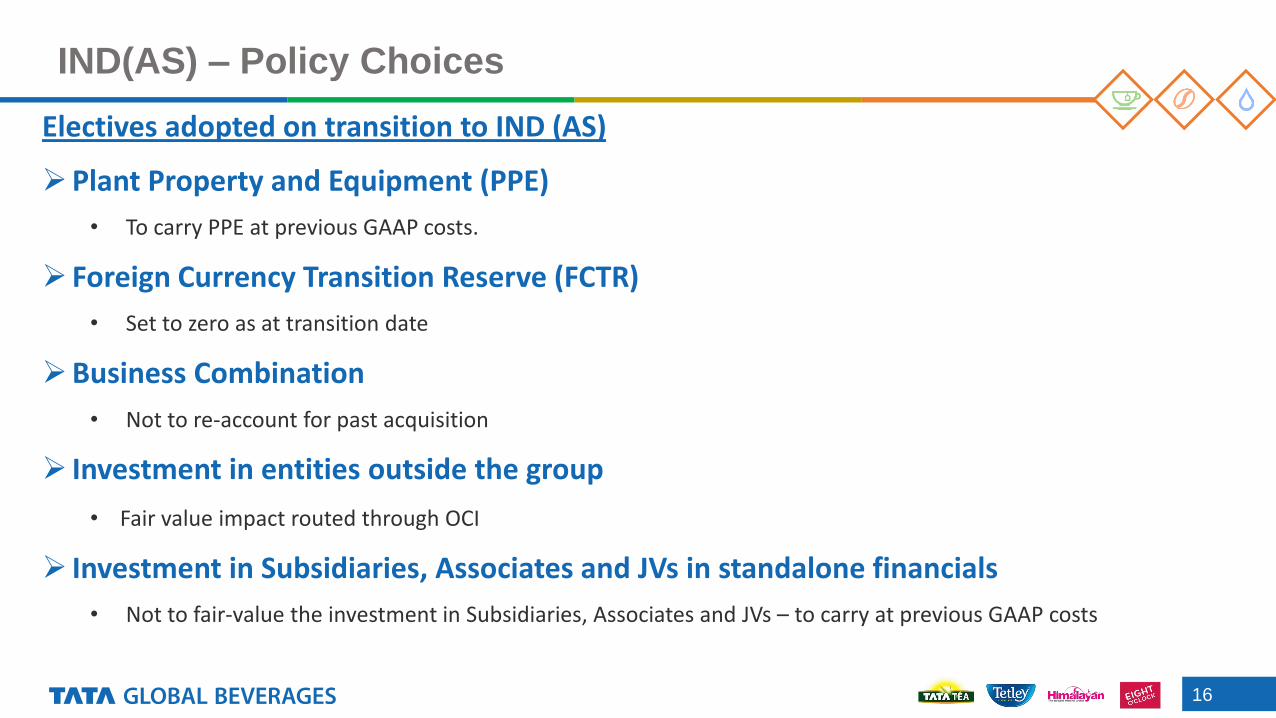
IND(AS) – Policy Choices
Electives adopted on transition to IND (AS)
Plant Property and Equipment (PPE)
• To carry PPE at previous GAAP costs.
Foreign Currency Transition Reserve (FCTR)
• Set to zero as at transition date
Business Combination
• Not to re-account for past acquisition
Investment in entities outside the group
• Fair value impact routed through OCI
Investment in Subsidiaries, Associates and JVs in standalone financials
• Not to fair-value the investment in Subsidiaries, Associates and JVs – to carry at previous GAAP costs

17
IND(AS) – Reconciliation between IGAAP and IND(AS) representation for Q2 Sep 2015
Expenditure adjusted with revenue based on the measurement principles of IND(AS), which were previously reflected as an
expense as per IGAAP.
Joint venture equity accounted as per IND(AS) as opposed to proportionate consolidation under IGAAP.
Fair valuation of agricultural produce as per IND(AS)
Recognition of finance cost under effective interest rate method for redemption premium on debentures, which was adjusted to
reserves under IGAAP.
Other adjustments :
• Actuarial gain/loss on employee benefits for Indian Companies accounted in Reserves
• Expenditure on Bearer plants, now capitalised
• IND(AS) transition adjustments of Associate entities
Corresponding tax impact on the above as applicable
QTD Sep - 2015 YTD Sep - 2015
Total Income
from Operations
Profit from
Operations
Group
Consolidated
Net Profit
Rs in Crs Total Income
from Operations
Profit from
Operations
Group
Consolidated
Net Profit
2034 112 89 IGAAP 4063 265 180
Adjustments:
(207) Revenue (409)
(158) 6 (1) Equity Accounting of JV results (316) 9 (1)
(15) (10) Agricultural Produce (23) (16)
(4) Amortised cost adjustment on Long term Borrowings (8)
7 13 Other Adjustments 12 11
1669 111 87 INDAS 3339 264 166

18
Balance Sheet
Main impact of INDAS on the balance sheet is as follows:
o Fair Valuation of Investments
o Capitalisation of Bearer assets
o Fair Valuation of biological produces (Inventory)
As at Sep’30
2016
(Rs in Crs)
ASSETS
Non- Current Assets 6070
Current Assets 3971
TOTAL ASSETS 10041
EQUITY
Shareholders Funds 6889
LIABILITIES
Non-Current Liabilities 983
Current Liabilities 2169
TOTAL LIABILITIES 10041
Thank you


![Analyst Meet presentation [Company Update]](https://static.fdocuments.us/doc/165x107/577c84071a28abe054b743ea/analyst-meet-presentation-company-update-5786f78d6ef8e.jpg)

![Analyst Meet [Company Update]](https://static.fdocuments.us/doc/165x107/577c7be11a28abe054988c95/analyst-meet-company-update.jpg)