Analyst & InvestorAnalyst & Investor Presentation · Transport, logistics and freight forwarding...
45
Analyst & Investor Analyst & Investor Presentation London London 4 th July 2013
Transcript of Analyst & InvestorAnalyst & Investor Presentation · Transport, logistics and freight forwarding...
Analyst & InvestorAnalyst & Investor Presentation
LondonLondon4th July 2013
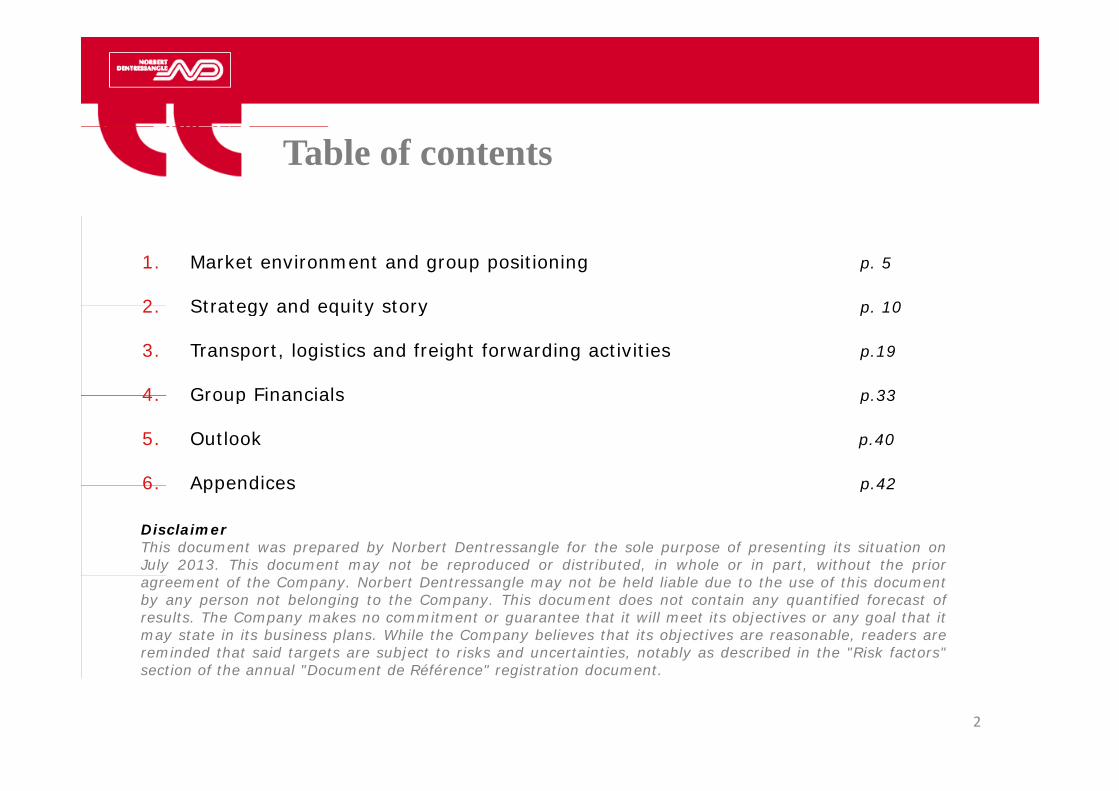
Table of contents
1. Market environment and group positioning p. 5
2 Strategy and equity story p 102. Strategy and equity story p. 10
3. Transport, logistics and freight forwarding activities p.19
4 Group Financials p 334. Group Financials p.33
5. Outlook p.40
6 Appendices p 426. Appendices p.42
DisclaimerThis document was prepared by Norbert Dentressangle for the sole purpose of presenting its situation onJuly 2013. This document may not be reproduced or distributed, in whole or in part, without the prioragreement of the Company. Norbert Dentressangle may not be held liable due to the use of this documentby any person not belonging to the Company. This document does not contain any quantified forecast ofresults. The Company makes no commitment or guarantee that it will meet its objectives or any goal that itmay state in its business plans. While the Company believes that its objectives are reasonable, readers arereminded that said targets are subject to risks and uncertainties, notably as described in the "Risk factors"
ti f th l "D t d Réfé " i t ti d t
2
section of the annual "Document de Référence" registration document.
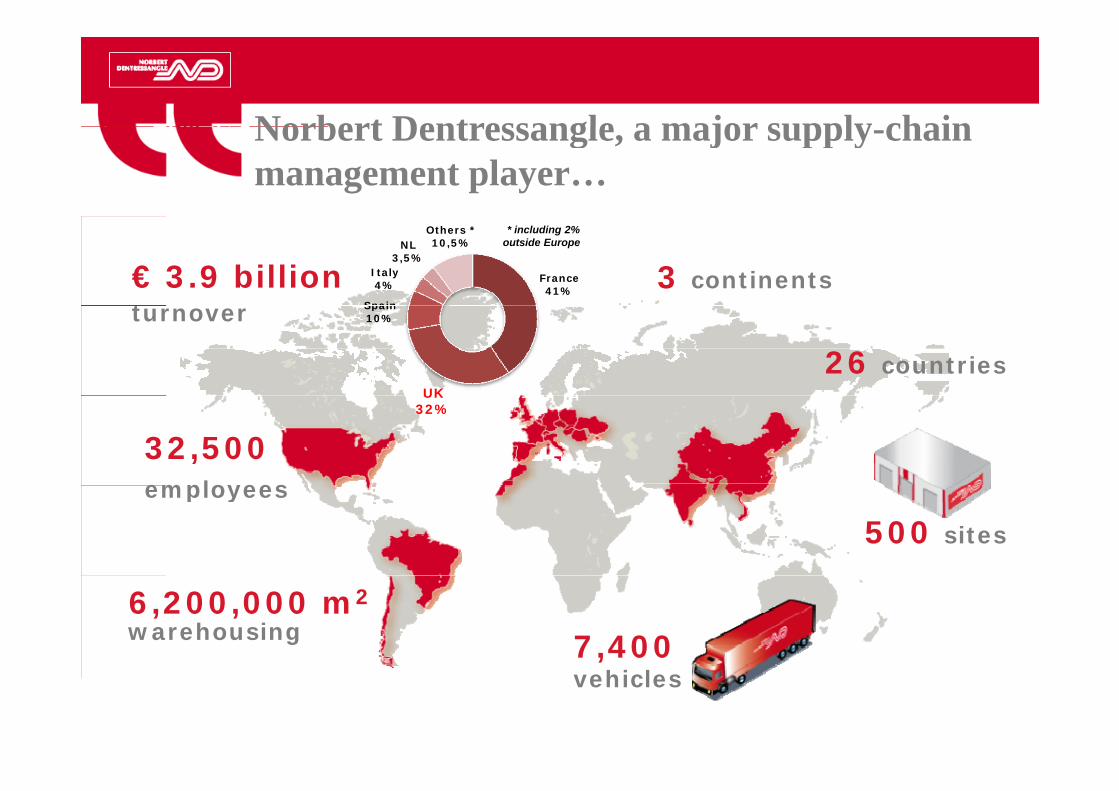
Norbert Dentressangle a major supply chainNorbert Dentressangle, a major supply-chainmanagement player…
€ 3.9 billiont
3 continentsFrance41%
Spain
Italy4%
NL3,5%
Others *10,5%
* including 2% outside Europe
turnover
26 countriesUK
Spain10%
32,500employees
UK32%
employees
500 sites
7,4006,200,000 m2warehousing
vehicles
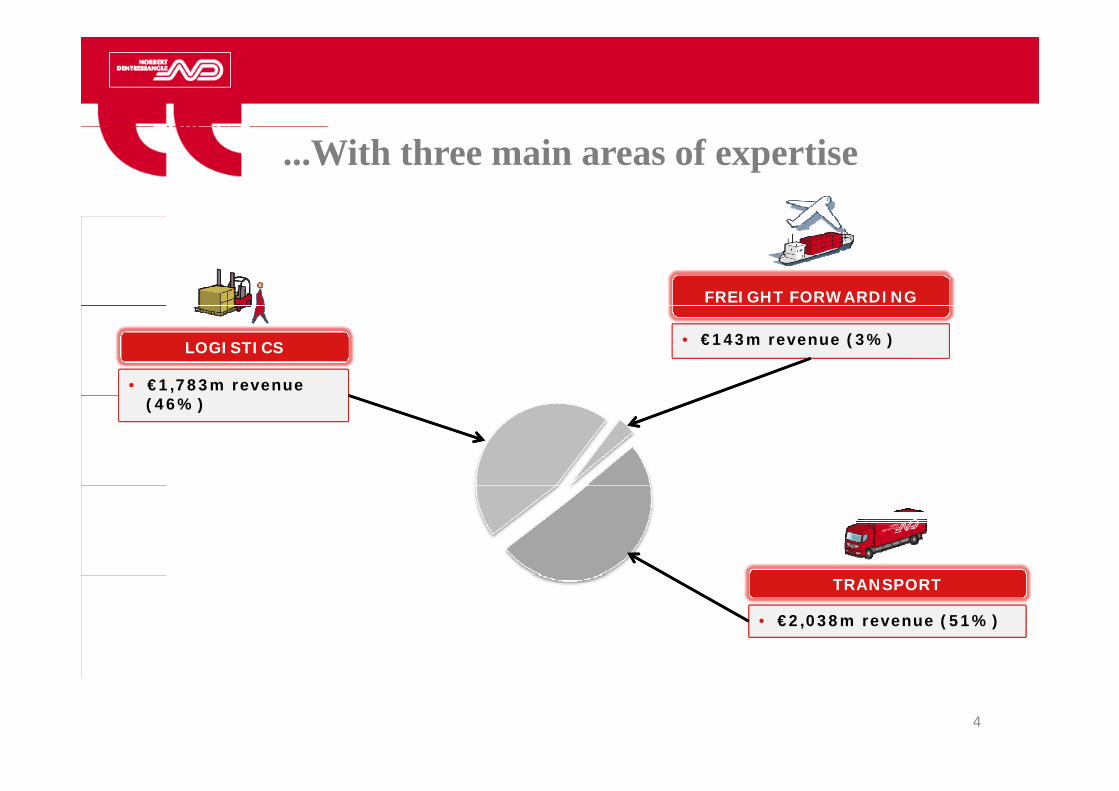
...With three main areas of expertise
FREIGHT FORWARDING
LOGISTICS
• €1,783m revenue
• €143m revenue (3%)
(46%)
TRANSPORT
• €2,038m revenue (51%)
4
1. Market Environment and Norbert Dentressangle Group PositioningDentressangle Group Positioning
5
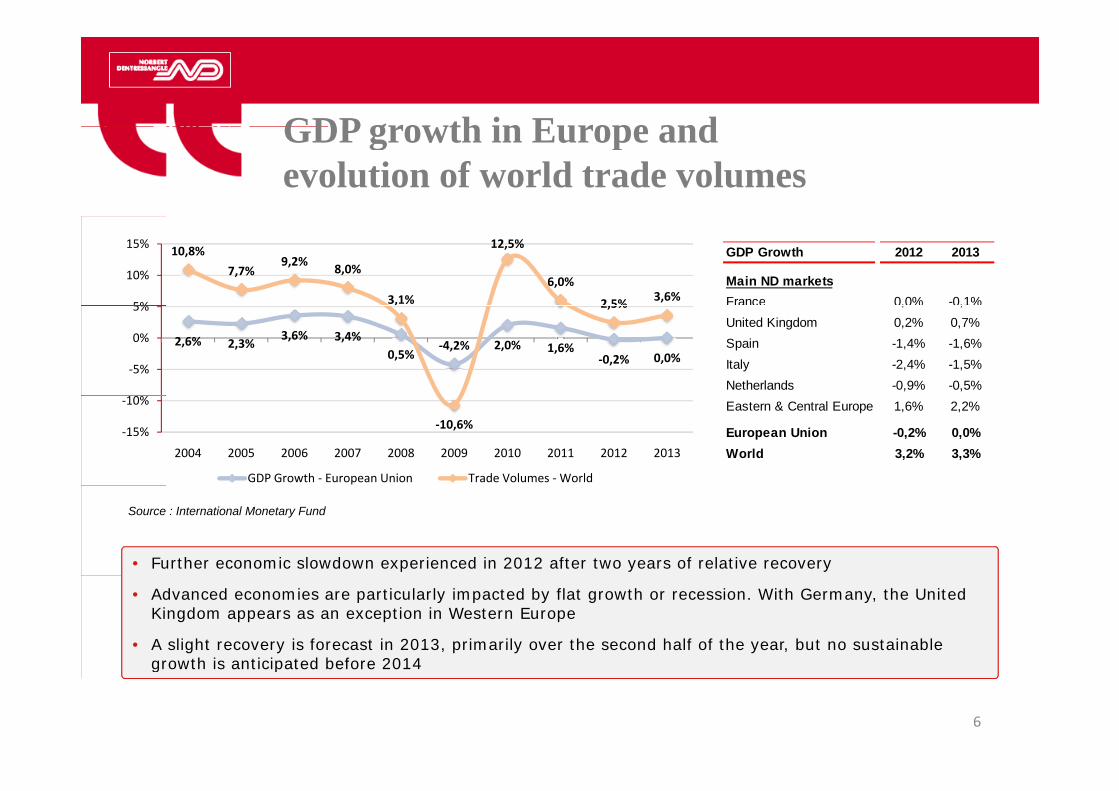
GDP growth in Europe andGDP growth in Europe and evolution of world trade volumes
GDP Growth 2012 2013
Main ND marketsFrance 0,0% -0,1%
10,8%7,7%
9,2% 8,0%
3,1%
12,5%
6,0%
2 5% 3,6%5%
10%
15%
France 0,0% 0,1%United Kingdom 0,2% 0,7%Spain -1,4% -1,6%Italy -2,4% -1,5%Netherlands -0,9% -0,5%
2,6% 2,3% 3,6% 3,4%0,5%
‐4,2% 2,0% 1,6%‐0,2% 0,0%
2,5%
‐5%
0%
5%
Eastern & Central Europe 1,6% 2,2%
European Union -0,2% 0,0%World 3,2% 3,3%
‐10,6%‐15%
‐10%
2004 2005 2006 2007 2008 2009 2010 2011 2012 2013
GDP Growth ‐ European Union Trade Volumes ‐World
• Further economic slowdown experienced in 2012 after two years of relative recovery
Source : International Monetary Fund
• Advanced economies are particularly impacted by flat growth or recession. With Germany, the United Kingdom appears as an exception in Western Europe
• A slight recovery is forecast in 2013, primarily over the second half of the year, but no sustainable growth is anticipated before 2014growth is anticipated before 2014
6
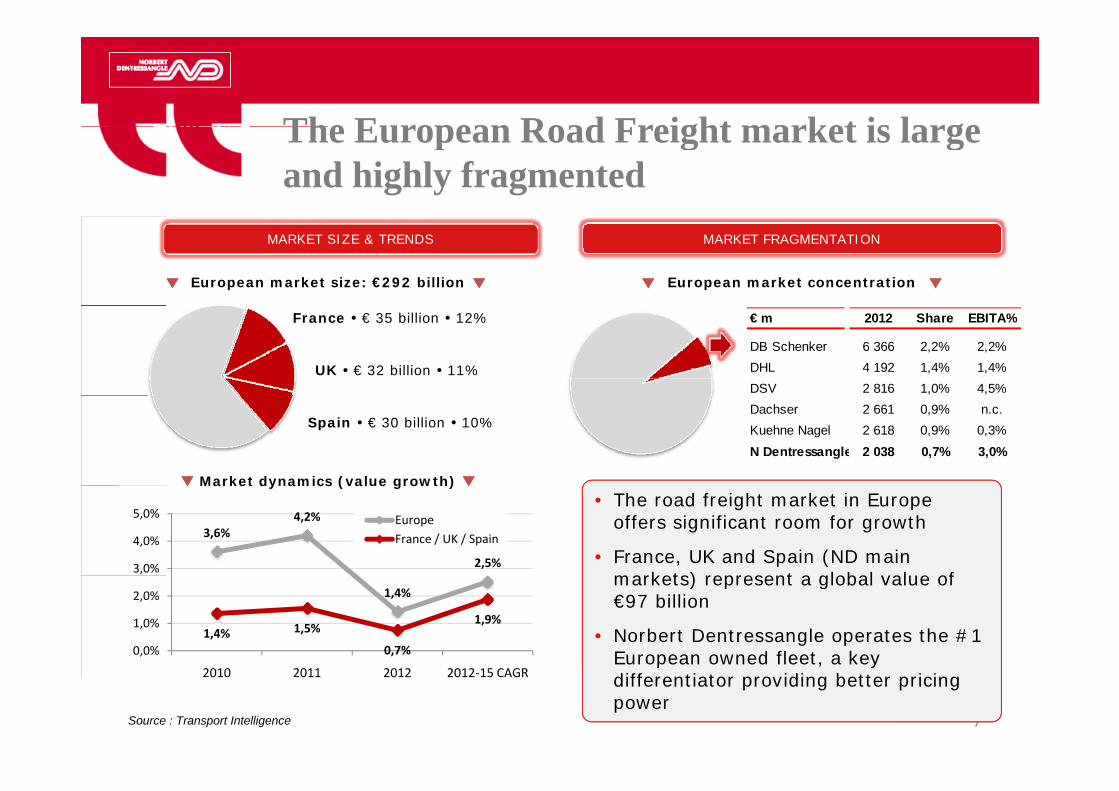
The European Road Freight market is largeThe European Road Freight market is large and highly fragmented
MARKET SIZE & TRENDS MARKET FRAGMENTATION
European market size: €292 billion European market concentration
France € 35 billion 12%
UK € 32 billion 11%
€ m 2012 Share EBITA%
DB Schenker 6 366 2,2% 2,2%DHL 4 192 1,4% 1,4%DSV 2 816 1,0% 4,5%
Spain € 30 billion 10%
Market dynamics (value growth)
Dachser 2 661 0,9% n.c.Kuehne Nagel 2 618 0,9% 0,3%N Dentressangle 2 038 0,7% 3,0%
3,6%4,2%
2,5%3,0%
4,0%
5,0% EuropeFrance / UK / Spain
Market dynamics (value growth)• The road freight market in Europe
offers significant room for growth
• France, UK and Spain (ND main markets) represent a global value of
1,4%
1,4% 1,5%
0,7%
1,9%
0,0%
1,0%
2,0%markets) represent a global value of €97 billion
• Norbert Dentressangle operates the #1 European owned fleet, a key
2010 2011 2012 2012‐15 CAGR
7Source : Transport Intelligence
p , ydifferentiator providing better pricing power
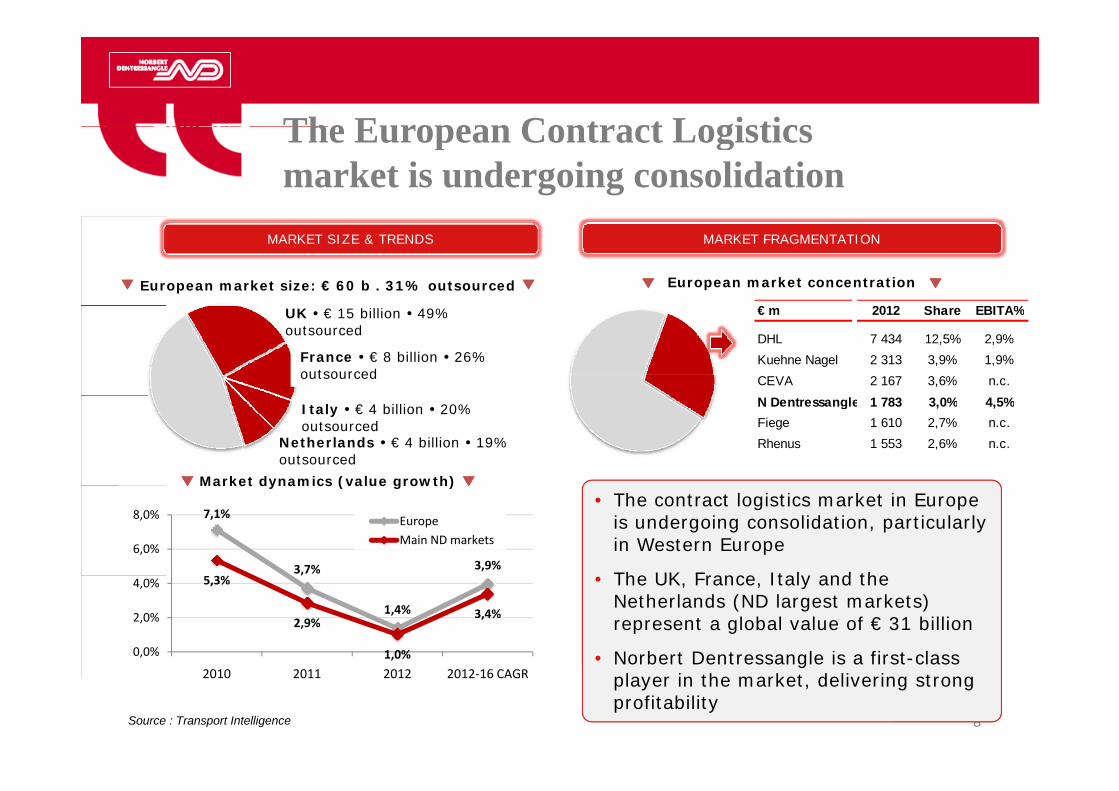
The European Contract LogisticsThe European Contract Logistics market is undergoing consolidation
MARKET SIZE & TRENDS
European market size: € 60 b . 31% outsourced
MARKET FRAGMENTATION
European market concentration
€ 2012 Sh EBITA%UK € 15 billion 49% outsourced
France € 8 billion 26% outsourced
€ m 2012 Share EBITA%
DHL 7 434 12,5% 2,9%Kuehne Nagel 2 313 3,9% 1,9%CEVA 2 167 3,6% n.c.
Market dynamics (value growth)
Italy € 4 billion 20% outsourced
Netherlands € 4 billion 19% outsourced
N Dentressangle 1 783 3,0% 4,5%Fiege 1 610 2,7% n.c.Rhenus 1 553 2,6% n.c.
Market dynamics (value growth)
7,1%
3,7% 3,9%6,0%
8,0% EuropeMain ND markets
• The contract logistics market in Europe is undergoing consolidation, particularly in Western Europe
The UK France Italy and the ,
1,4%
5,3%
2,9%
1,0%
3,4%
0,0%
2,0%
4,0% • The UK, France, Italy and the Netherlands (ND largest markets) represent a global value of € 31 billion
• Norbert Dentressangle is a first-class 2010 2011 2012 2012‐16 CAGR
8Source : Transport Intelligence
gplayer in the market, delivering strong profitability
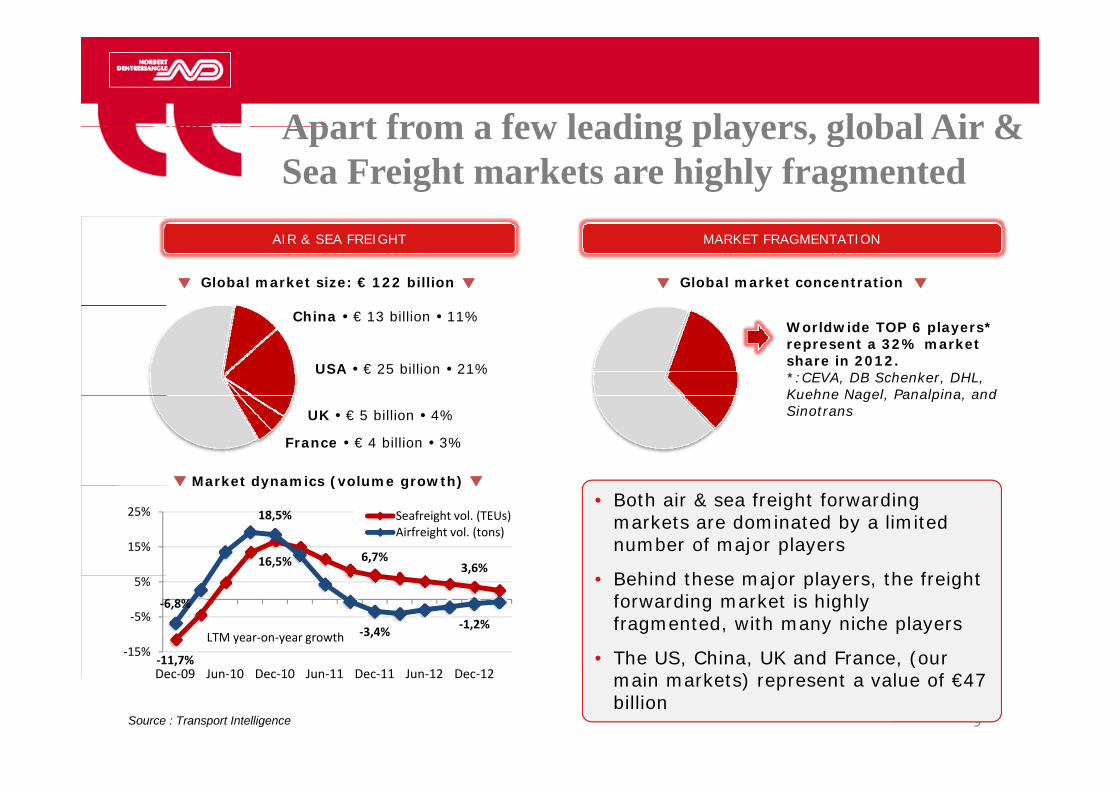
Apart from a few leading players global Air &Apart from a few leading players, global Air & Sea Freight markets are highly fragmented
AIR & SEA FREIGHT
Global market size: € 122 billion
MARKET FRAGMENTATION
Global market concentration
China € 13 billion 11%
USA € 25 billion 21%
Worldwide TOP 6 players* represent a 32% market share in 2012.*:CEVA, DB Schenker, DHL, Kuehne Nagel Panalpina and
UK € 5 billion 4%
Market dynamics (volume growth)
France € 4 billion 3%
Kuehne Nagel, Panalpina, and Sinotrans
Market dynamics (volume growth)• Both air & sea freight forwarding
markets are dominated by a limited number of major players
Behind these major players the freight 16,5% 6,7%
3,6%
18,5%
15%
25% Seafreight vol. (TEUs)Airfreight vol. (tons)
LTM year‐on‐year growth
• Behind these major players, the freight forwarding market is highly fragmented, with many niche players
• The US, China, UK and France, (our ‐11,7%
‐6,8%
‐3,4% ‐1,2%
‐15%
‐5%
5%
9Source : Transport Intelligence
, , , (main markets) represent a value of €47 billion
,Dec‐09 Jun‐10 Dec‐10 Jun‐11 Dec‐11 Jun‐12 Dec‐12

2. Strategy and Equity Story2. Strategy and Equity Story
10
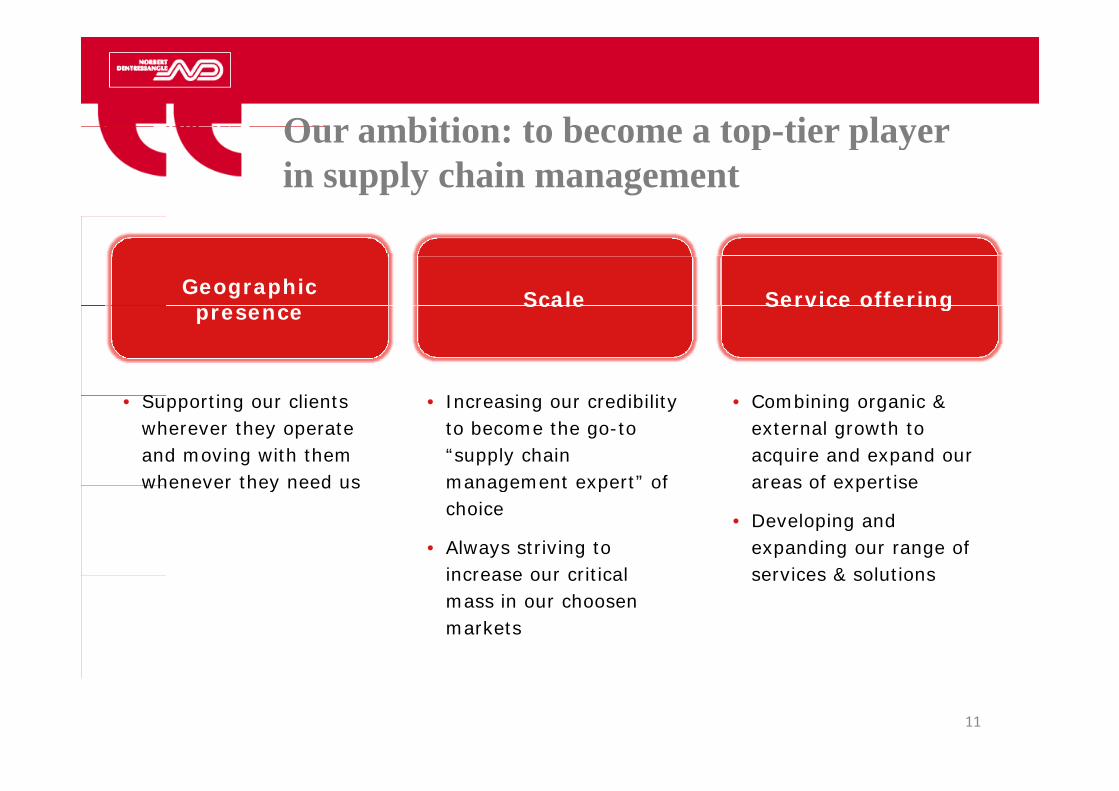
Our ambition: to become a top tier playerOur ambition: to become a top-tier player in supply chain management
Geographic Scale Service offeringpresence Scale Service offering
S ti li t I i dibilit C bi i i & • Supporting our clients wherever they operate and moving with them whenever they need us
• Increasing our credibility to become the go-to “supply chain management expert” of
• Combining organic & external growth to acquire and expand our areas of expertisewhenever they need us management expert of
choice
• Always striving to increase our critical
areas of expertise
• Developing and expanding our range of services & solutionsincrease our critical
mass in our choosenmarkets
services & solutions
11
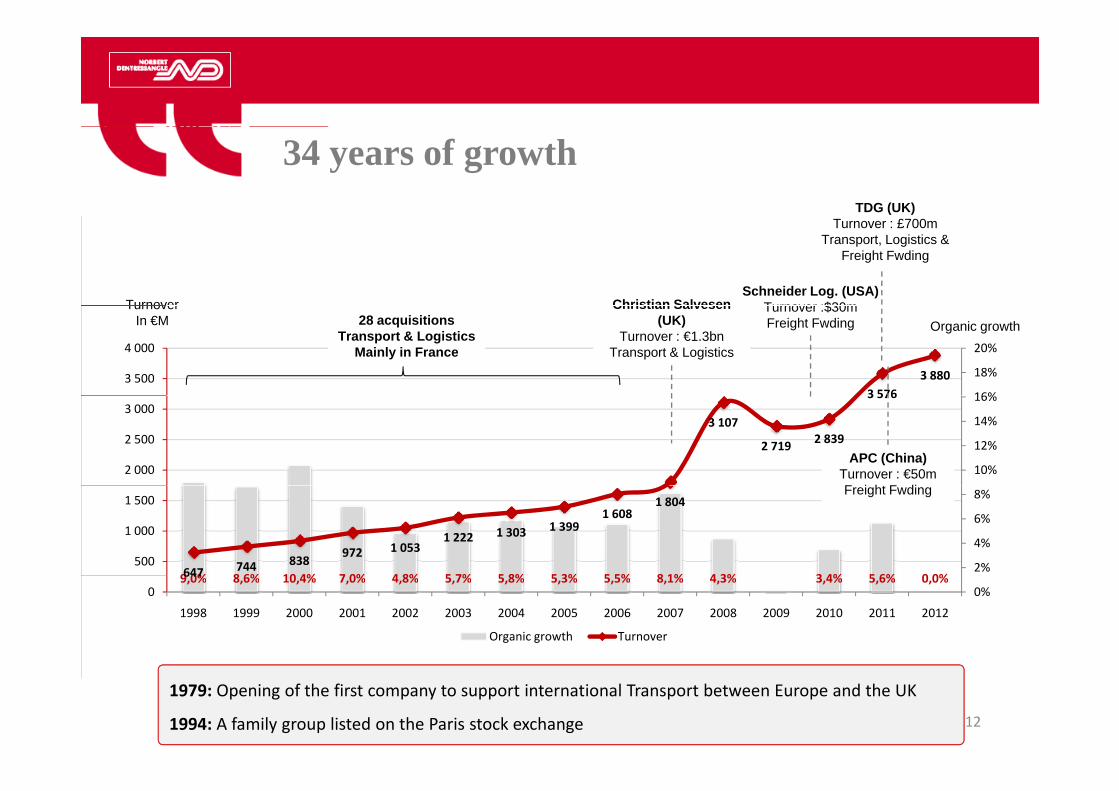
34 years of growthTDG (UK)
Christian SalvesenSchneider Log. (USA)
Turnover :$30m
Turnover : £700mTransport, Logistics &
Freight Fwding
Turnover
3 5763 880
16%
18%
20%
3 500
4 000
Christian Salvesen(UK)
Turnover : €1.3bnTransport & Logistics
Turnover :$30mFreight Fwding28 acquisitions
Transport & LogisticsMainly in France
TurnoverIn €M Organic growth
3 107
2 719 2 839
3 576
10%
12%
14%
16%
2 000
2 500
3 000
APC (China)Turnover : €50mF i ht F di
9 0% 8 6% 10 4% 7 0% 4 8% 5 7% 5 8% 5 3% 5 5% 8 1% 4 3% 3 4% 5 6% 0 0%647 744 838 972 1 0531 222 1 303 1 399
1 6081 804
2%
4%
6%
8%
500
1 000
1 500Freight Fwding
9,0% 8,6% 10,4% 7,0% 4,8% 5,7% 5,8% 5,3% 5,5% 8,1% 4,3% 3,4% 5,6% 0,0%6470%0
1998 1999 2000 2001 2002 2003 2004 2005 2006 2007 2008 2009 2010 2011 2012
Organic growth Turnover
12
1979: Opening of the first company to support international Transport between Europe and the UK
1994: A family group listed on the Paris stock exchange
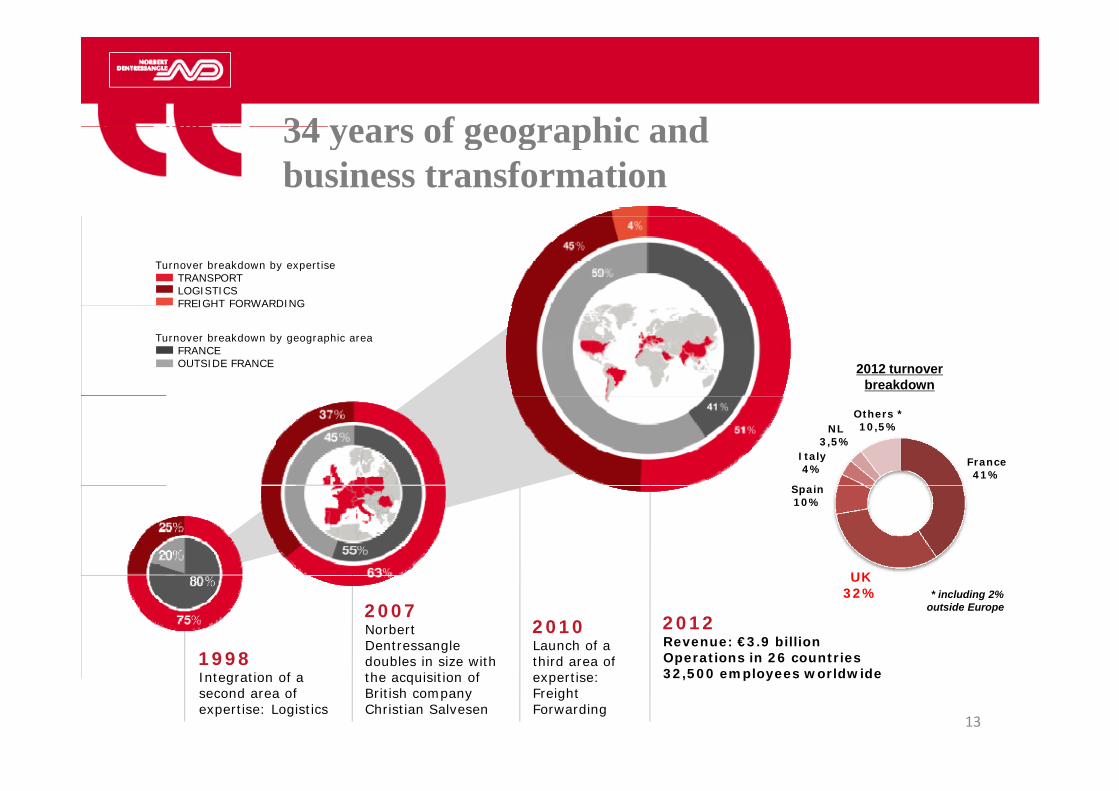
34 years of geographic and34 years of geographic and business transformation
Turnover breakdown by expertiseTRANSPORT LOGISTICS FREIGHT FORWARDING
2012 turnover breakdown
FREIGHT FORWARDING
Turnover breakdown by geographic areaFRANCEOUTSIDE FRANCE
France41%
S i
Italy4%
NL3,5%
Others *10,5%
UK
Spain10%
UK32%
19982010Launch of a third area of
2012Revenue: €3.9 billionOperations in 26 countries
2007Norbert Dentressangle doubles in size with
* including 2% outside Europe
998Integration of a second area of expertise: Logistics
third area of expertise: Freight Forwarding
32,500 employees worldwide doubles in size with the acquisition of British company Christian Salvesen
13
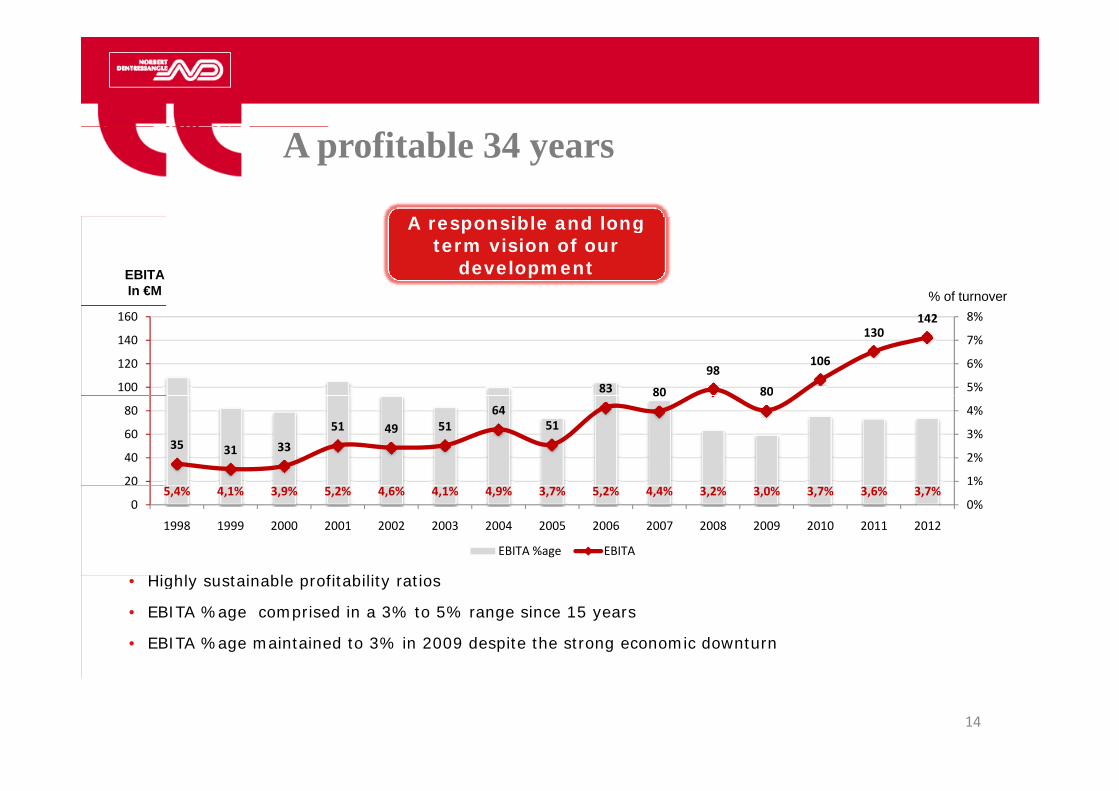
A profitable 34 years
A ibl d l A responsible and long term vision of our
developmentEBITAIn €M % of turnover
83 80
98
80
106
130142
5%
6%
7%
8%
100
120
140
160
35 31 3351 49 51
6451
80 80
1%
2%
3%
4%
20
40
60
80
5,4% 4,1% 3,9% 5,2% 4,6% 4,1% 4,9% 3,7% 5,2% 4,4% 3,2% 3,0% 3,7% 3,6% 3,7%0%0
1998 1999 2000 2001 2002 2003 2004 2005 2006 2007 2008 2009 2010 2011 2012
EBITA %age EBITA
Hi hl t i bl fit bilit ti• Highly sustainable profitability ratios
• EBITA %age comprised in a 3% to 5% range since 15 years
• EBITA %age maintained to 3% in 2009 despite the strong economic downturn
14
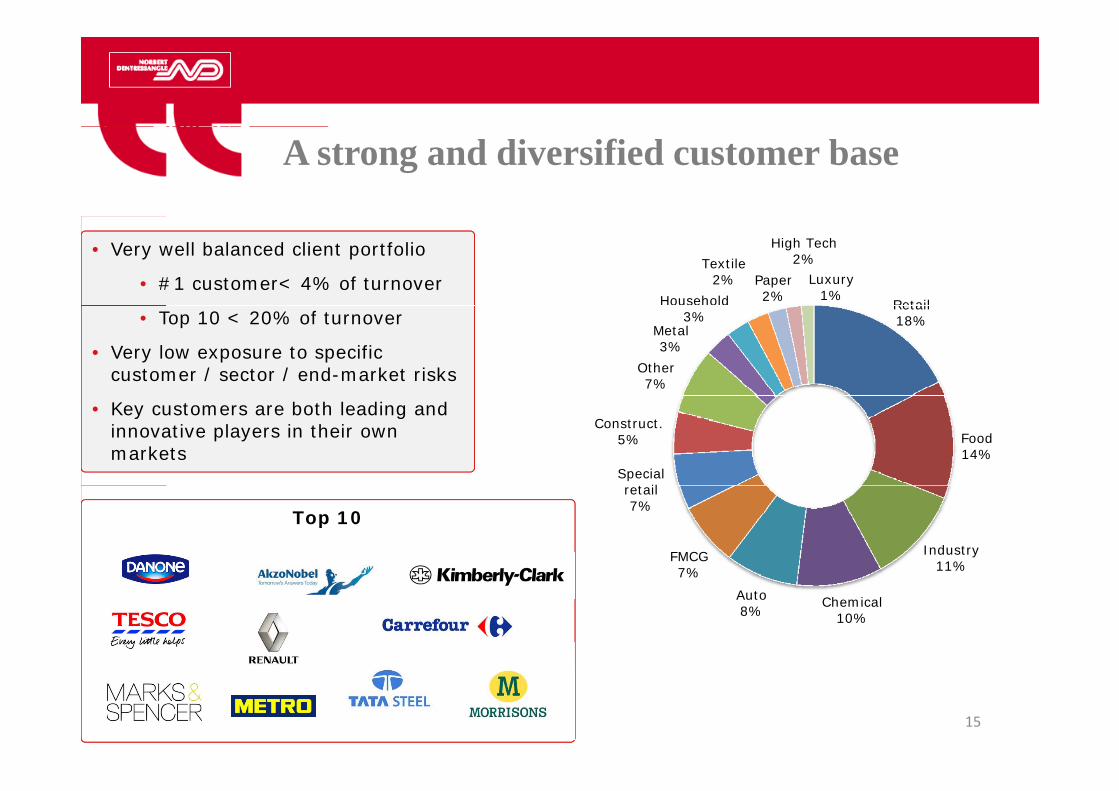
A strong and diversified customer base
RetailHousehold
Textile2% Paper
2%
High Tech2%
Luxury1%
• Very well balanced client portfolio
• #1 customer< 4% of turnoverRetail18%
Other7%
Metal3%
3%• Top 10 < 20% of turnover
• Very low exposure to specific customer / sector / end-market risks
Food14%
Special t il
Construct.5%
• Key customers are both leading and innovative players in their own markets
Industry11%
FMCG7%
retail7%
Top 10
Chemical10%
Auto8%
7%
15
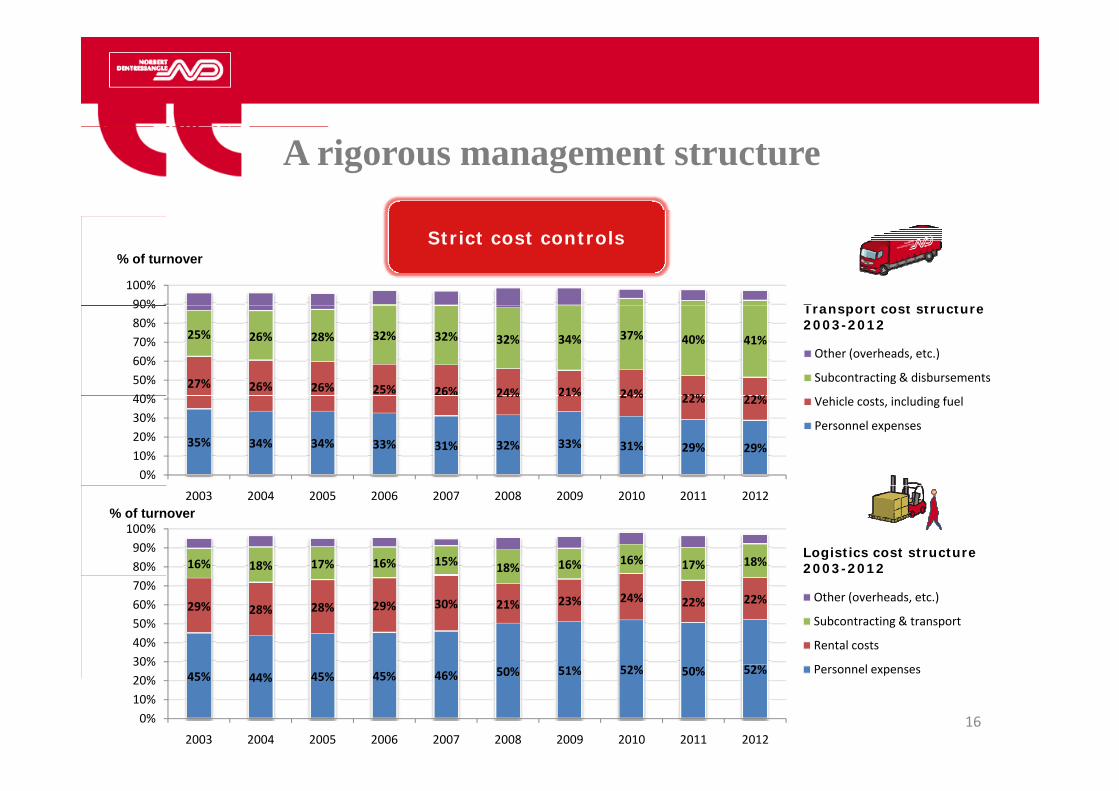
A rigorous management structure
90%100%
T t t t t
Strict cost controls% of turnover
27% 26% 26% 25% 26% 24% 21% 24% 22% 22%
25% 26% 28% 32% 32% 32% 34% 37% 40% 41%
40%50%60%70%80%90%
Other (overheads, etc.)
Subcontracting & disbursements
Transport cost structure 2003-2012
35% 34% 34% 33% 31% 32% 33% 31% 29% 29%
24% 21% 24% 22% 22%
0%10%20%30%40% Vehicle costs, including fuel
Personnel expenses
2003 2004 2005 2006 2007 2008 2009 2010 2011 2012
16% 18% 17% 16% 15% 18% 16% 16% 17% 18%80%90%
100%
Logistics cost structure 2003-2012
% of turnover
29% 28% 28% 29% 30% 21% 23% 24% 22% 22%
30%40%50%60%70%
Other (overheads, etc.)
Subcontracting & transport
Rental costs
l
16
45% 44% 45% 45% 46% 50% 51% 52% 50% 52%
0%10%20%30%
2003 2004 2005 2006 2007 2008 2009 2010 2011 2012
Personnel expenses
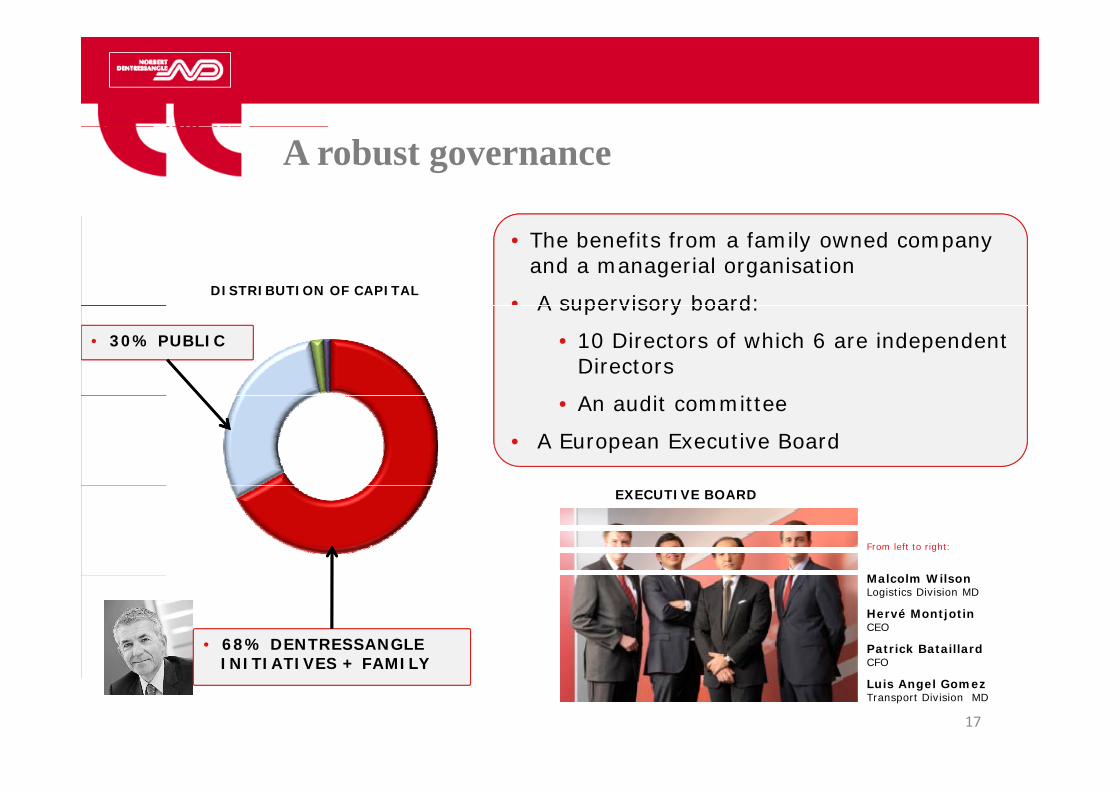
A robust governance
• The benefits from a family owned company and a managerial organisation
• A supervisory board:DISTRIBUTION OF CAPITAL
A supervisory board:
• 10 Directors of which 6 are independent Directors
A di i
• 30% PUBLIC
• An audit committee
• A European Executive Board
EXECUTIVE BOARD
From left to right:
M l l WilMalcolm WilsonLogistics Division MD
Hervé MontjotinCEO
Patrick BataillardCFO
• 68% DENTRESSANGLE INITIATIVES + FAMILY
17
CFO
Luis Angel GomezTransport Division MD
INITIATIVES + FAMILY
People engagement: developing the Norbert Dentressangle way
• A decentralised and flat organisation to keep our entrepreneurial spirit and business agilityp p g y
• A specific commitment towards people: “you grow, we grow”grow, we grow– Priority to internal promotion: 60% of managers are
promoted internally
• The benefits of a strong Franco-British culture and experience
• Expertise in integrating businesses and staff– Local HR expertise
Accumulated experience through acquisitions
18
– Accumulated experience through acquisitions
3. Transport, Logistics and Freight Forwarding activitiesForwarding activities
19
Transport businessMarket conditions and our response
• A highly fragmented market
• Important room for growth in Europe
• Network scale is key for sales development and competitiveness
E t ti f f i dl t t l ti• Expectations for eco-friendly transport solutions
• Develop value added transport service offerings• Develop value-added transport service offerings
• Grow in Europe
• Expand network to remain competitive
• Commit to reducing carbon footprint and road accidents through continuous improvement and innovation
20
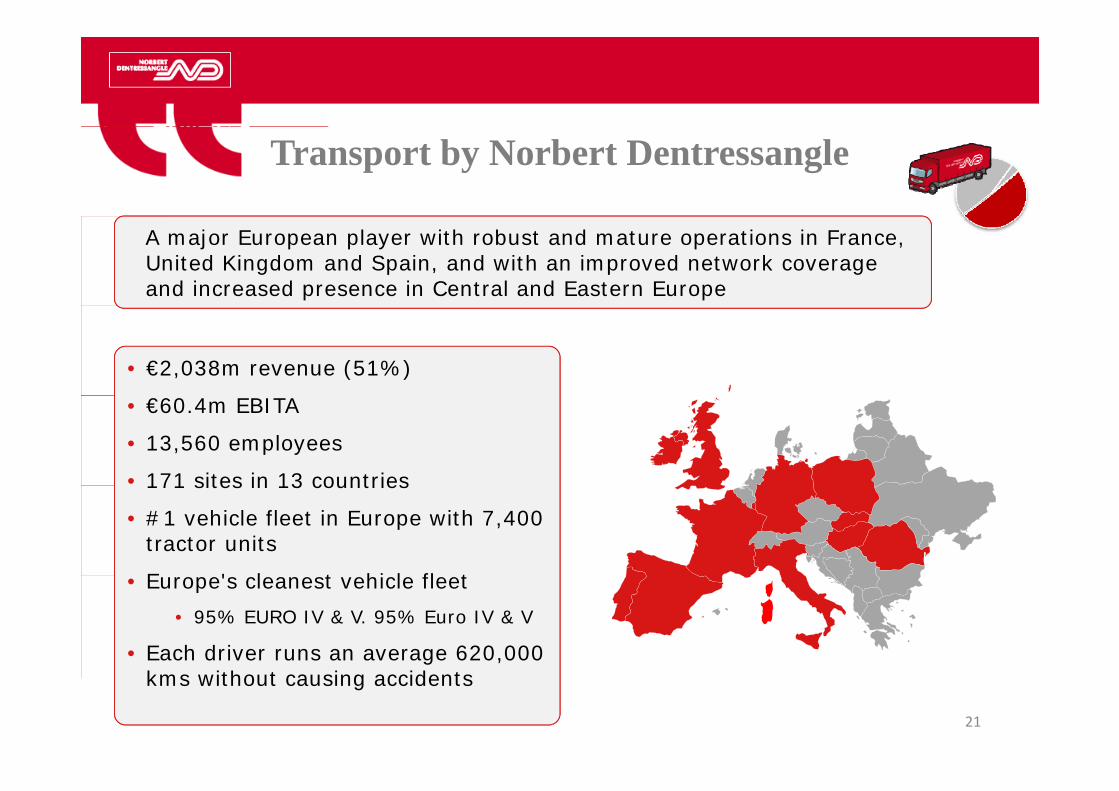
Transport by Norbert Dentressangle
A major European player with robust and mature operations in France, United Kingdom and Spain, and with an improved network coverage and increased presence in Central and Eastern Europe
• €2,038m revenue (51%)
• €60.4m EBITA
• 13,560 employees
• 171 sites in 13 countries171 sites in 13 countries
• #1 vehicle fleet in Europe with 7,400 tractor units
E ' l t hi l fl t• Europe's cleanest vehicle fleet• 95% EURO IV & V. 95% Euro IV & V
• Each driver runs an average 620,000
21
kms without causing accidents
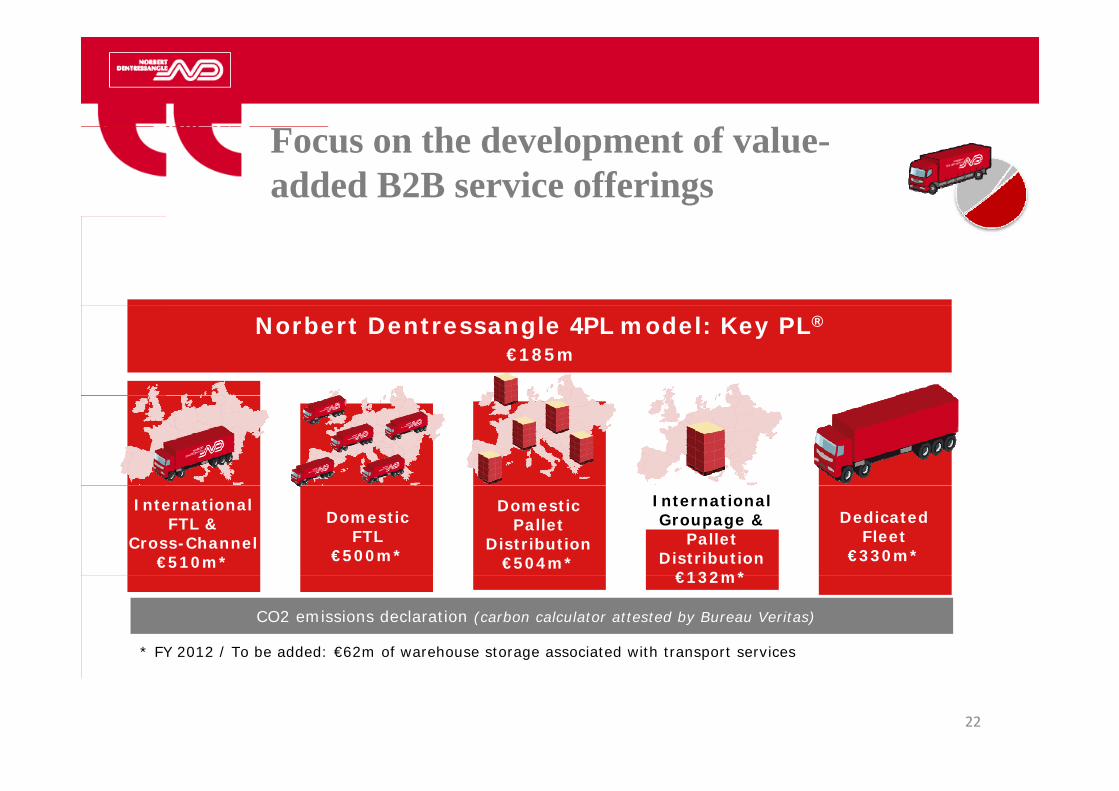
Focus on the development of value-added B2B service offerings
Norbert Dentressangle 4PL model: Key PL®
€185m
InternationalFTL &
Cross-Channel€510m*
DomesticPallet
Distribution€504m*
InternationalGroupage &
PalletDistribution
€132m*
DomesticFTL
€500m*
DedicatedFleet
€330m*€132m*
CO2 emissions declaration (carbon calculator attested by Bureau Veritas)
* FY 2012 / To be added: €62m of warehouse storage associated with transport services
22
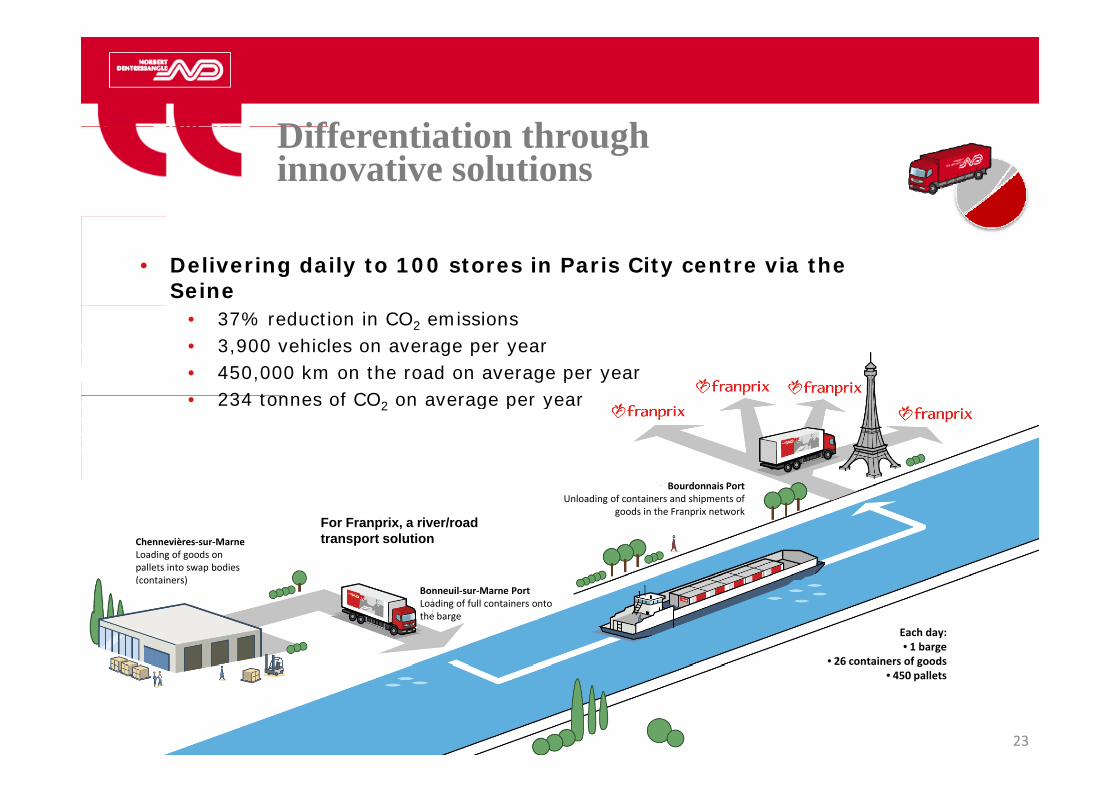
Diff ti ti th hDifferentiation through innovative solutions
• Delivering daily to 100 stores in Paris City centre via the Seine
• 37% reduction in CO2 emissions• 3,900 vehicles on average per year• 450,000 km on the road on average per year
234 tonnes of CO on average per year
Bourdonnais Port
• 234 tonnes of CO2 on average per year
Chennevières‐sur‐MarneLoading of goods on pallets into swap bodies
Bourdonnais PortUnloading of containers and shipments of
goods in the Franprix networkFor Franprix, a river/road transport solution
(containers)Bonneuil‐sur‐Marne PortLoading of full containers onto the barge
Each day:• 1 barge
• 26 containers of goodsg• 450 pallets
23
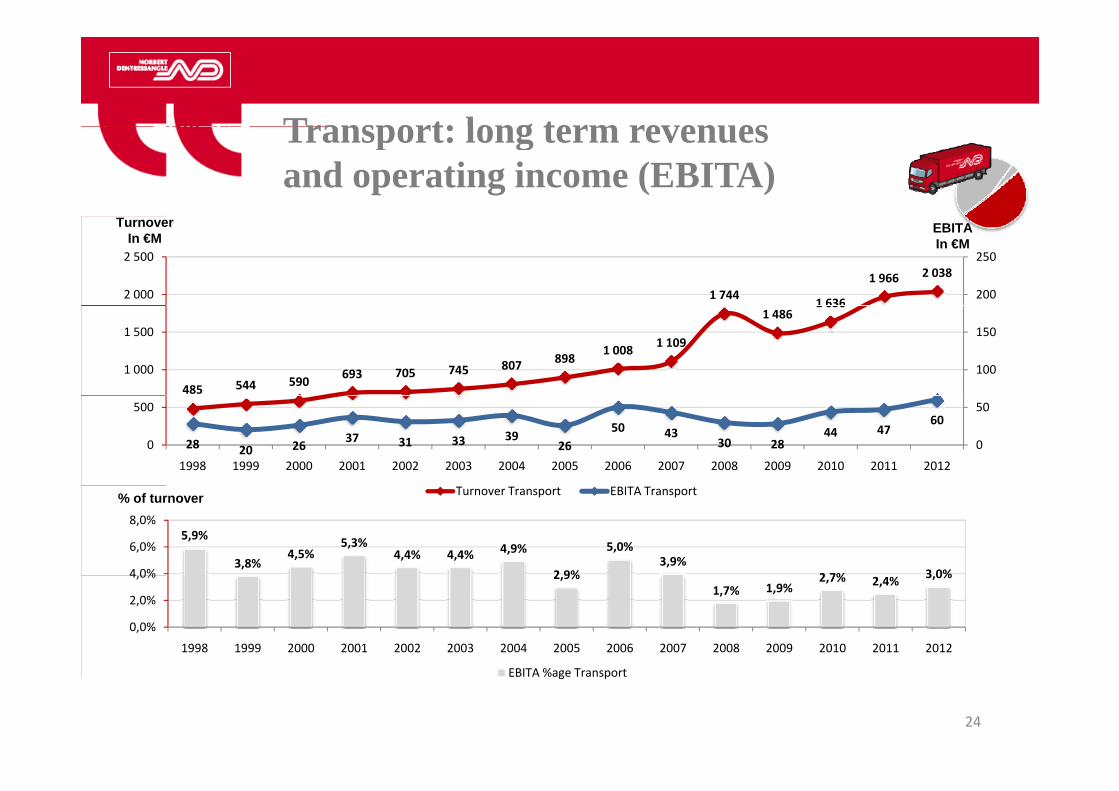
Transport: long term revenuesTransport: long term revenues and operating income (EBITA)
1 744 1 636
1 966 2 038
200
250
2 000
2 500
EBITAIn €M
TurnoverIn €M
485 544 590 693 705 745 807 898 1 008 1 109
1 4861 636
100
150
1 000
1 500
28 20 26 37 31 33 3926
50 4330 28
44 4760
0
50
0
500
1998 1999 2000 2001 2002 2003 2004 2005 2006 2007 2008 2009 2010 2011 2012
Turnover Transport EBITA Transport
5,9%
3,8%4,5%
5,3%4,4% 4,4% 4,9%
2 9%
5,0%3,9%
2 7% 3 0%4 0%
6,0%
8,0%
% of turnover
2,9%1,7% 1,9%
2,7% 2,4% 3,0%
0,0%
2,0%
4,0%
1998 1999 2000 2001 2002 2003 2004 2005 2006 2007 2008 2009 2010 2011 2012
24
EBITA %age Transport
Logistics businessMarket conditions and our response
• Few European players• Few European players
• Business is 100% contracted
• Retail and FMCG sectors are key commercial targets
• Profitability and international expansion make the difference
E l i i i b d E• Export logistics expertise beyond Europe
• Raise international profile
• Accompany blue-chip customers in their global developmentAccompany blue chip customers in their global development
• Strengthen expertise in Retail and FMCG sectors
• Ensure efficiency of the operations
25
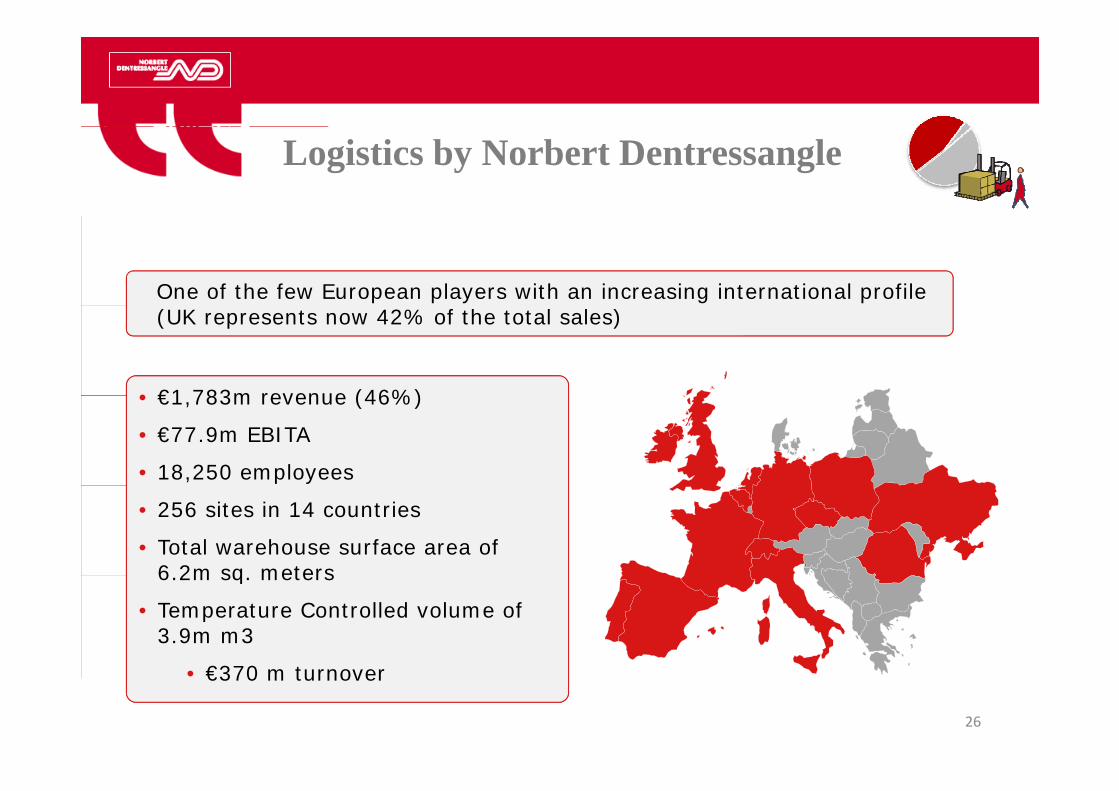
Logistics by Norbert Dentressangle
One of the few European players with an increasing international profile
• €1 783m revenue (46%)
(UK represents now 42% of the total sales)
• €1,783m revenue (46%)
• €77.9m EBITA
• 18,250 employees
• 256 sites in 14 countries
• Total warehouse surface area of 6 2m sq meters6.2m sq. meters
• Temperature Controlled volume of 3.9m m3
€3 0
26
• €370 m turnover
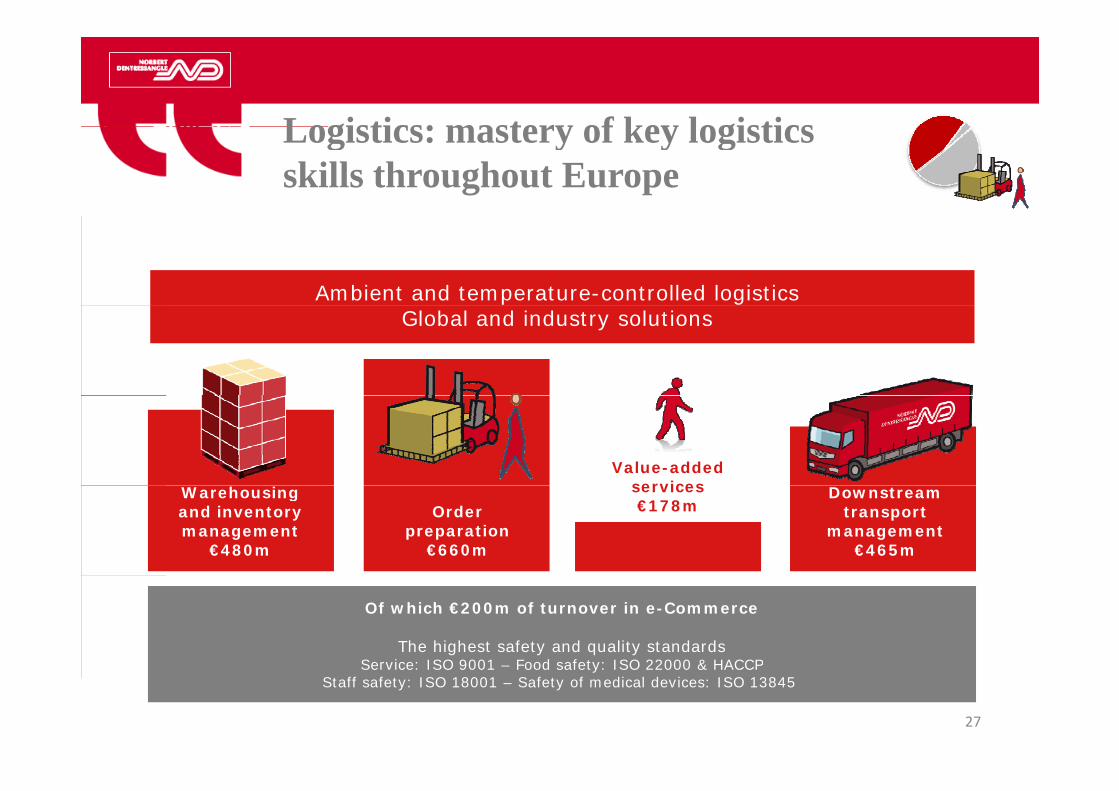
Logistics: mastery of key logisticsLogistics: mastery of key logistics skills throughout Europe
Ambient and temperature-controlled logisticsGlobal and industry solutions
Value-added servicesWarehousing
and inventory management
€480m
Downstream transport
management€465m
Order preparation
€660m
services€178m
Of which €200m of turnover in e-Commerce
The highest safety and quality standardsService: ISO 9001 – Food safety: ISO 22000 & HACCP
27
Service: ISO 9001 – Food safety: ISO 22000 & HACCPStaff safety: ISO 18001 – Safety of medical devices: ISO 13845
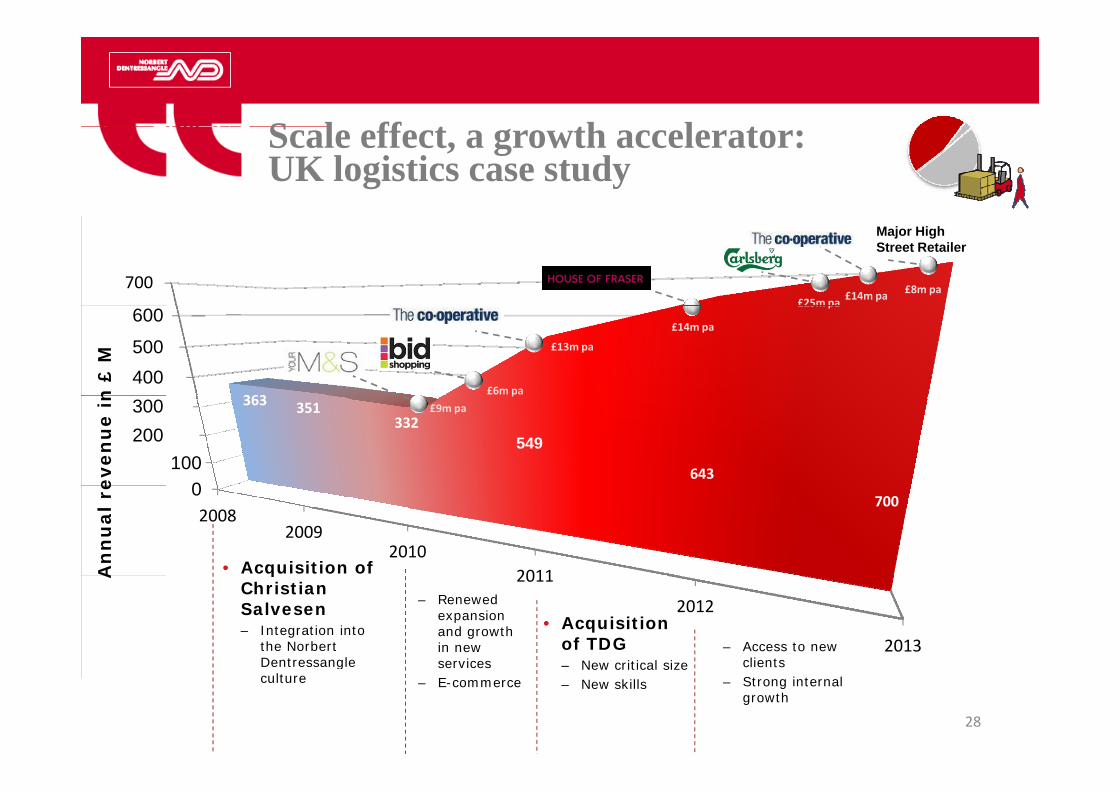
S l ff t th l tScale effect, a growth accelerator: UK logistics case study
700£14m pa £8m pa
£25m pa
Major High Street Retailer
600
500400
363£6m pan
£ M
£25m pa
£13m pa
£14m pa
300200
1000
363 351332
549
643
£9m pap
even
ue
in
02008
20092010
2011
700
An
nu
al r
e
• Acquisition of 2011
2012
2013
A qChristian Salvesen– Integration into
the Norbert Dentressangle
– Renewed expansion and growth in new services
• Acquisition of TDG
New critical size– Access to new
clientsDentressangle culture
services– E-commerce
– New critical size– New skills
clients– Strong internal
growth
28
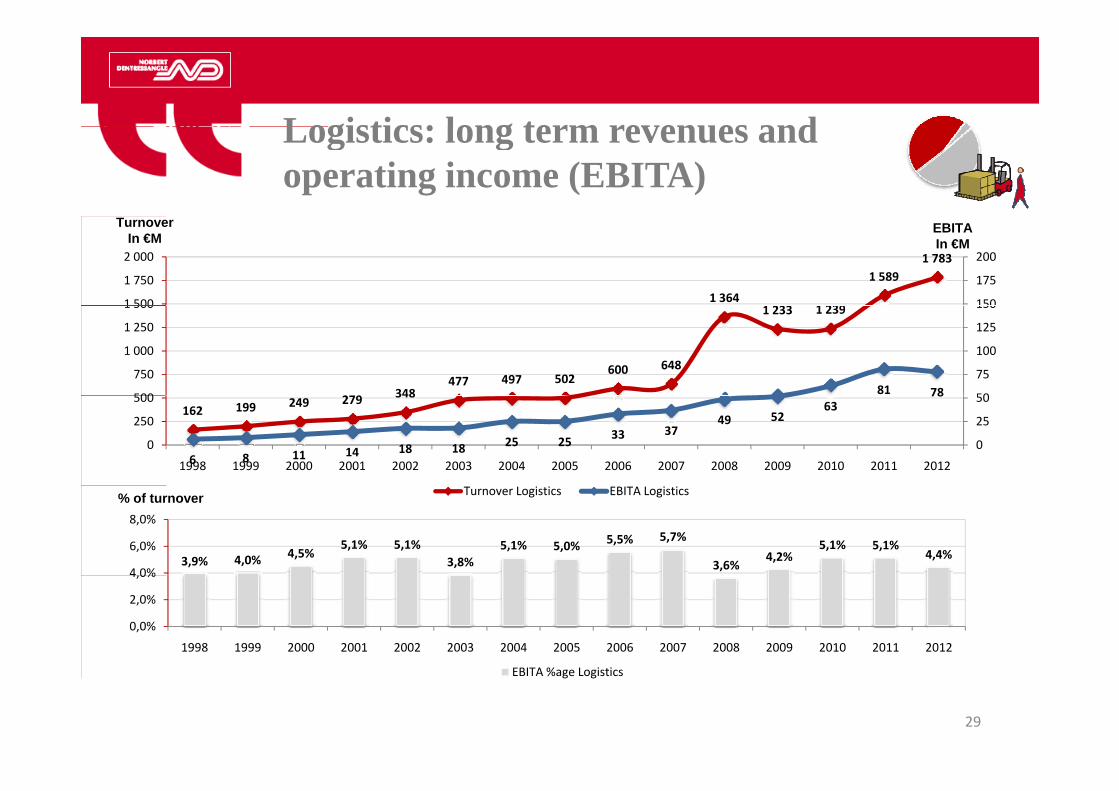
Logistics: long term revenues andLogistics: long term revenues and operating income (EBITA)
1 3641 233 1 239
1 5891 783
150
175
200
1 500
1 750
2 000
EBITAIn €M
TurnoverIn €M
279 348477 497 502
600 648
1 233 1 239
81 78 50
75
100
125
150
500
750
1 000
1 250
1 500
162 199 249 279 348
6 8 11 14 18 18 25 25 33 3749 52
6378
0
25
50
0
250
500
1998 1999 2000 2001 2002 2003 2004 2005 2006 2007 2008 2009 2010 2011 2012
Turnover Logistics EBITA Logistics
3,9% 4,0% 4,5%5,1% 5,1%
3,8%5,1% 5,0% 5,5% 5,7%
3,6%4,2%
5,1% 5,1%4,4%
4 0%
6,0%
8,0%% of turnover
0,0%
2,0%
4,0%
1998 1999 2000 2001 2002 2003 2004 2005 2006 2007 2008 2009 2010 2011 2012
EBITA %age Logistics
29
Freight forwarding businessMarket conditions and our response
• Few large players and many small ones• Few large players and many small ones
• Integrated global network / niche players
• Expand international freight forwarding network
G i i i l k d l• Gain critical mass on key trade lanes
• We walk the talk
• Scalable businessScalable business
• Break-even position
30
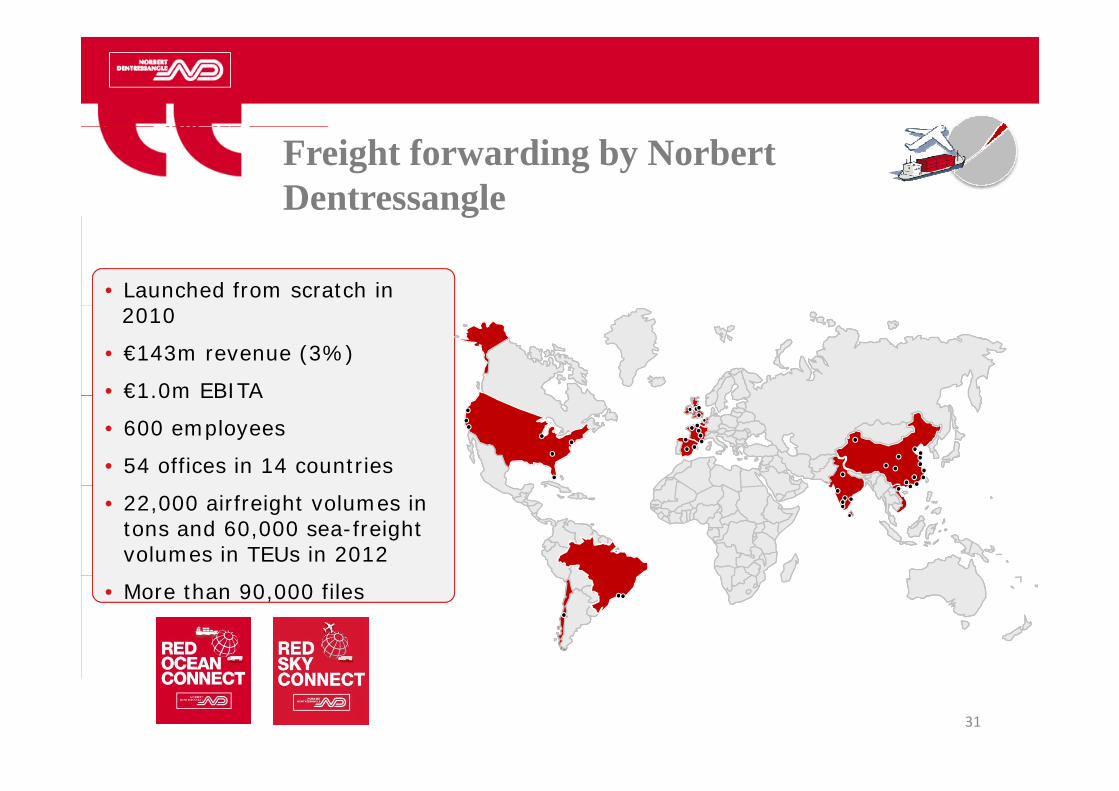
Freight forwarding by Norbert Dentressangleg
• Launched from scratch in 2010
• €143m revenue (3%)
• €1.0m EBITA€1.0m EBITA
• 600 employees
• 54 offices in 14 countries
• 22,000 airfreight volumes in tons and 60,000 sea-freight volumes in TEUs in 2012
,• More than 90,000 files
31
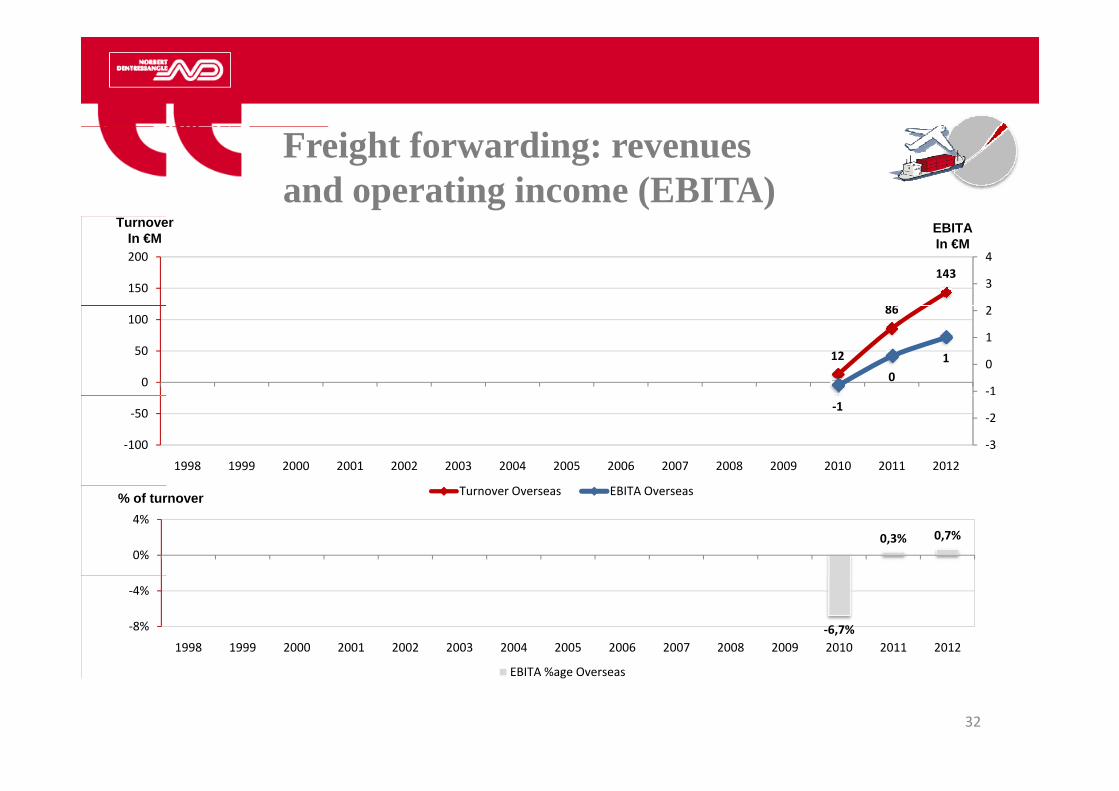
Freight forwarding: revenues and operating income (EBITA)
86
1433
4
150
200
EBITAIn €M
TurnoverIn €M
12
86
01
‐1
0
1
2
0
50
100
‐1
‐3
‐2
‐100
‐50
1998 1999 2000 2001 2002 2003 2004 2005 2006 2007 2008 2009 2010 2011 2012
0,3% 0,7%0%
4%
Turnover Overseas EBITA Overseas% of turnover
‐6,7%‐8%
‐4%
1998 1999 2000 2001 2002 2003 2004 2005 2006 2007 2008 2009 2010 2011 2012
32
EBITA %age Overseas
4. Group Financials4. Group Financials
33
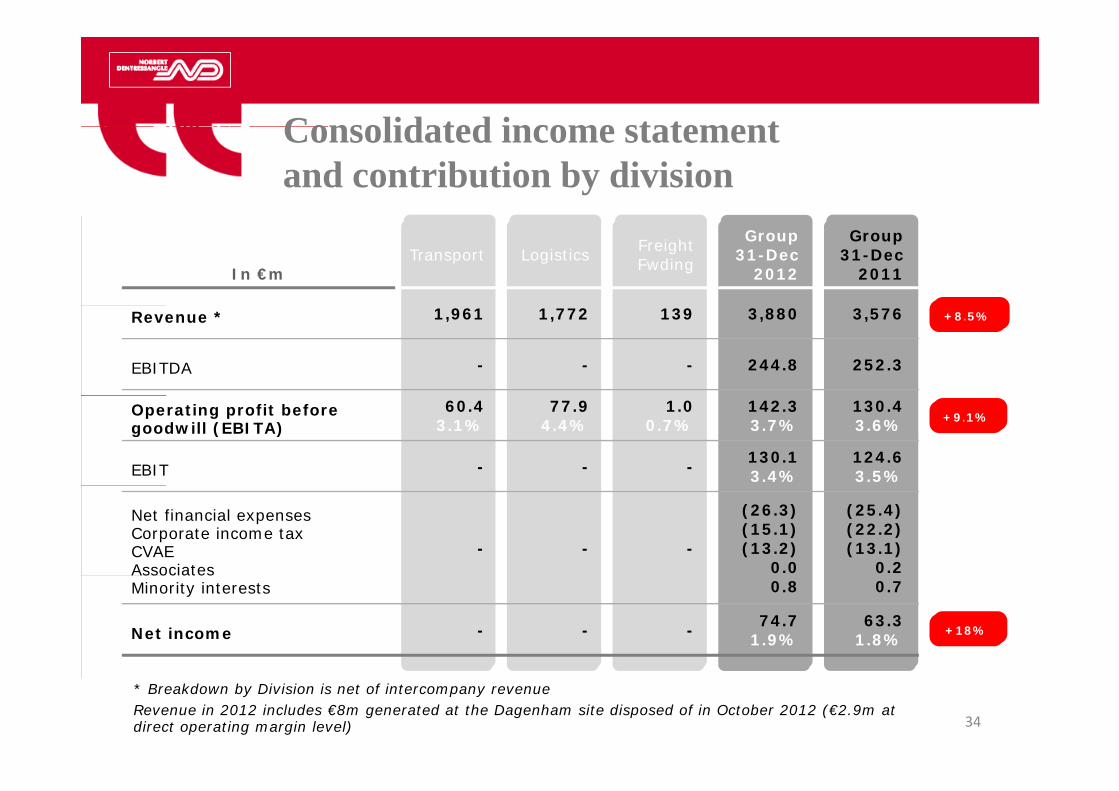
Consolidated income statementConsolidated income statement and contribution by division
In €mTransport Logistics Freight
Fwding
Group31-Dec
2012
Group31-Dec
2011
Revenue * 1,961 1,772 139 3,880 3,576
EBITDA - - - 244.8 252.3
+8.5%
Operating profit before goodwill (EBITA)
60.43.1%
77.94.4%
1.00.7%
142.33.7%
130.43.6%
EBIT - - - 130.13.4%
124.63.5%
+9.1%
Net financial expensesCorporate income taxCVAEAssociates
- - -
(26.3)(15.1)(13.2)
0.0
(25.4)(22.2)(13.1)
0.2AssociatesMinority interests 0.8 0.7
Net income - - - 74.71.9%
63.31.8% +18%
34
* Breakdown by Division is net of intercompany revenueRevenue in 2012 includes €8m generated at the Dagenham site disposed of in October 2012 (€2.9m at direct operating margin level)
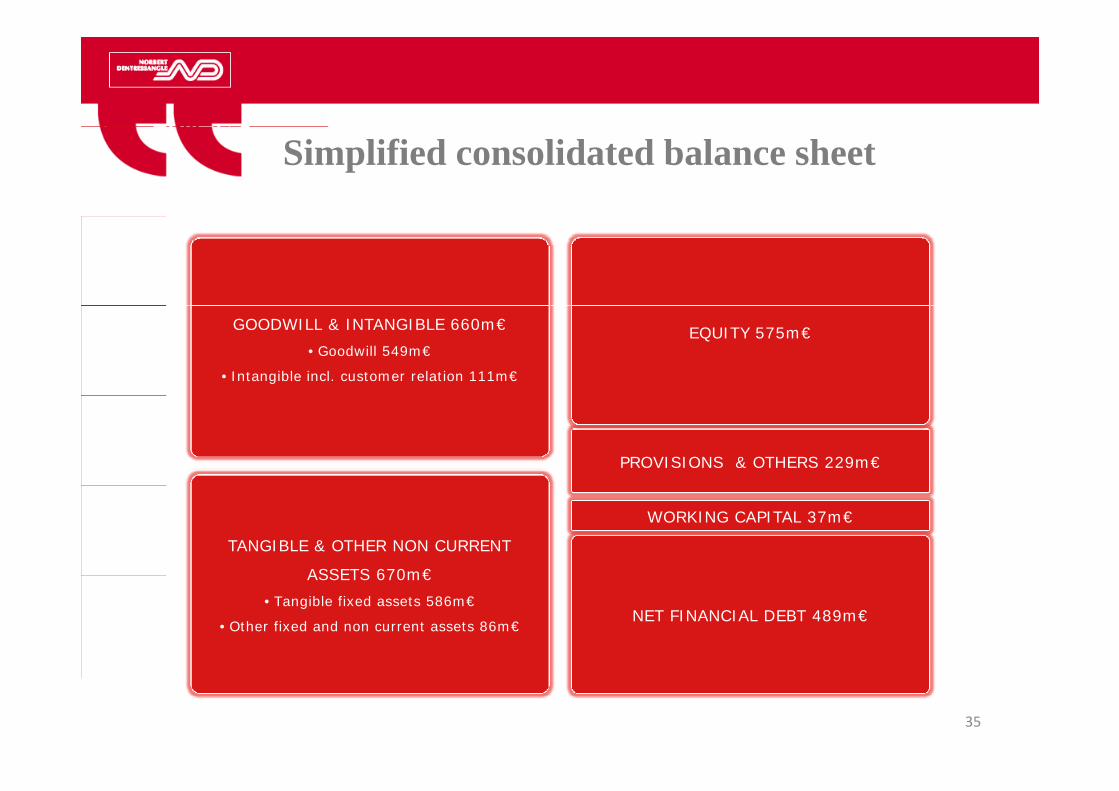
Simplified consolidated balance sheet
GOODWILL & INTANGIBLE 660m€• Goodwill 549m€
• Intangible incl. customer relation 111m€
EQUITY 575m€
PROVISIONS & OTHERS 229m€
TANGIBLE & OTHER NON CURRENT
ASSETS 670m€
WORKING CAPITAL 37m€
ASSETS 670m€• Tangible fixed assets 586m€
• Other fixed and non current assets 86m€NET FINANCIAL DEBT 489m€
35
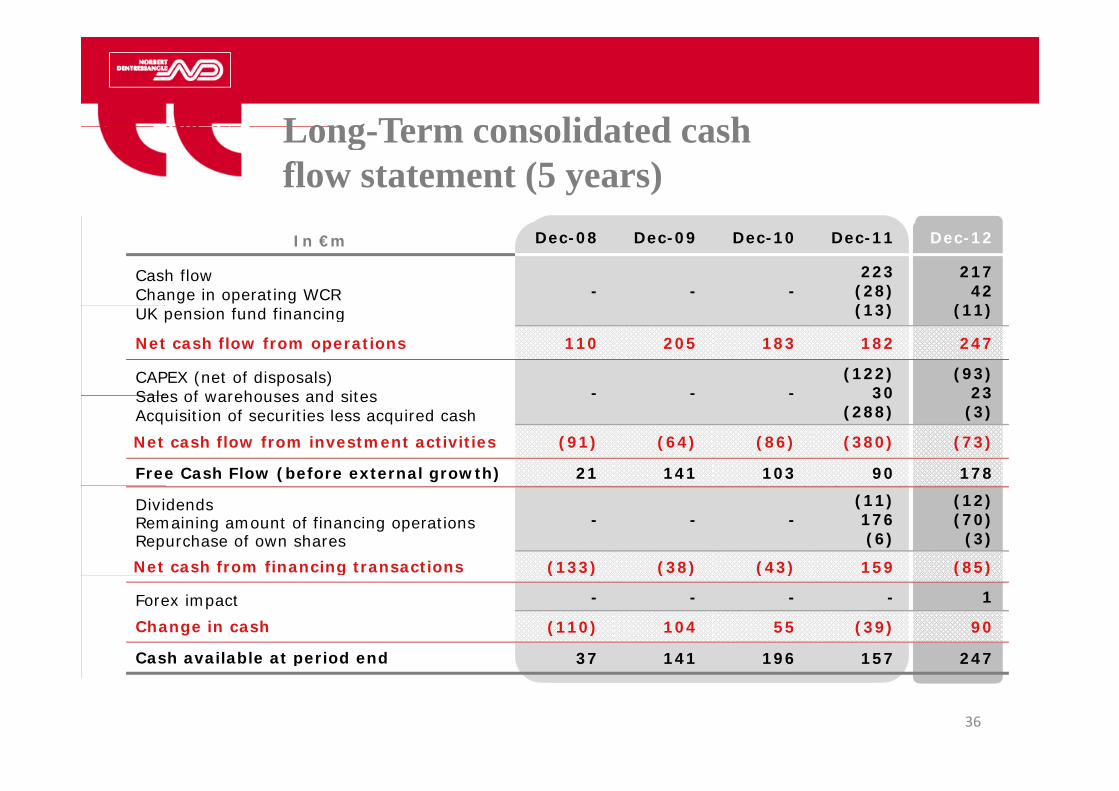
Long Term consolidated cashLong-Term consolidated cash flow statement (5 years)In €m Dec-08 Dec-09 Dec-10 Dec-11 Dec-12
Cash flowChange in operating WCR - - -
223(28)(13)
21742
(11)UK pension fund financing (13) (11)
Net cash flow from operations 110 205 183 182 247
CAPEX (net of disposals)Sales of warehouses and sites - - -
(122)30
(93)23Sales of warehouses and sites
Acquisition of securities less acquired cash30
(288)23
(3)
Net cash flow from investment activities (91) (64) (86) (380) (73)
Free Cash Flow (before external growth) 21 141 103 90 178
DividendsRemaining amount of financing operationsRepurchase of own shares
- - -(11)176(6)
(12)(70)
(3)
Net cash from financing transactions (133) (38) (43) 159 (85)g ( ) ( ) ( ) ( )
Forex impact - - - - 1
Change in cash (110) 104 55 (39) 90
Cash available at period end 37 141 196 157 247
36
p
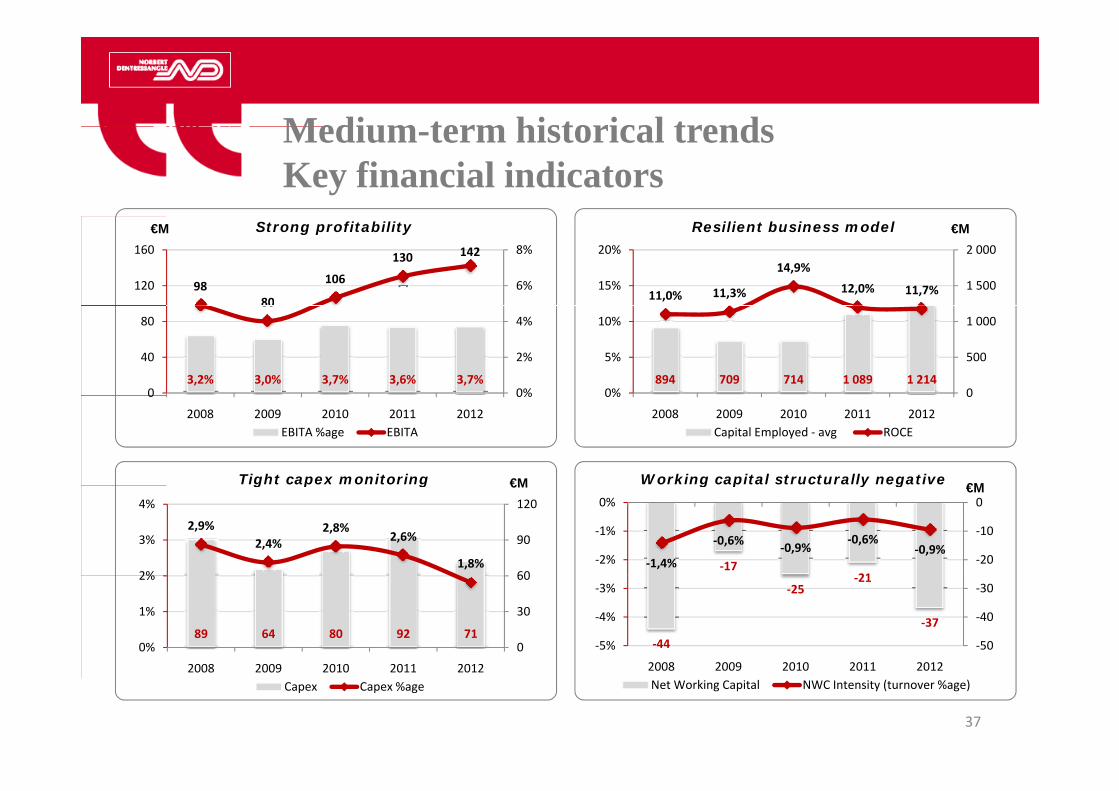
Medium term historical trendsMedium-term historical trendsKey financial indicators
11,0% 11,3%
14,9%
12,0% 11,7% 1 500
2 000
15%
20%
9880
106
130 142
6%
8%
120
160
Strong profitability Resilient business model€M €M
894 709 714 1 089 1 2140
500
1 000
0%
5%
10%
3,2% 3,0% 3,7% 3,6% 3,7%
80
0%
2%
4%
0
40
80
00%
2008 2009 2010 2011 2012Capital Employed ‐ avg ROCE
0%0
2008 2009 2010 2011 2012EBITA %age EBITA
Tight capex monitoring Working capital structurally negative €M€M
2,9%2,4%
2,8%2,6%
1,8%60
90
120
2%
3%
4%
‐1721
‐1,4%
‐0,6% ‐0,9%‐0,6%
‐0,9%‐20
‐10
0
‐2%
‐1%
0%
g p g g p y g €M€M
89 64 80 92 710
30
60
0%
1%
2%
2008 2009 2010 2011 2012
‐44
‐25‐21
‐37
‐50
‐40
‐30
‐5%
‐4%
‐3%
2008 2009 2010 2011 2012
37
2008 2009 2010 2011 2012Capex Capex %age
2008 2009 2010 2011 2012Net Working Capital NWC Intensity (turnover %age)
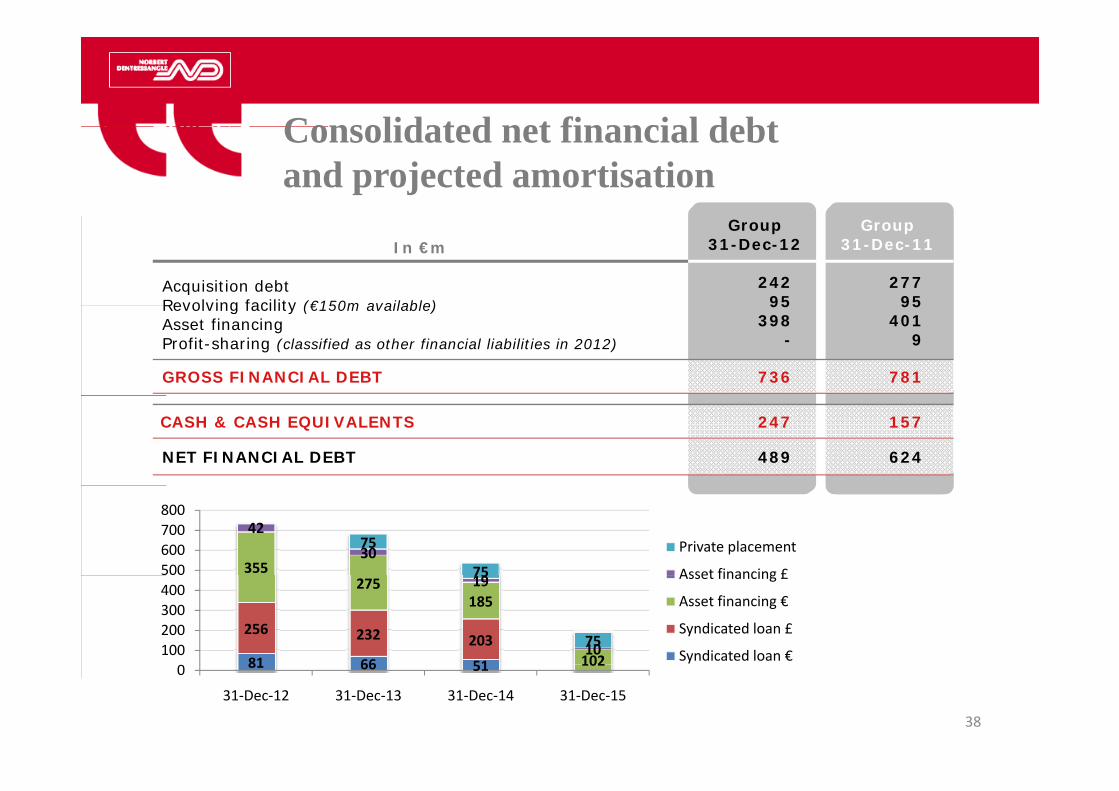
Consolidated net financial debtConsolidated net financial debt and projected amortisation
In €mGroup
31-Dec-12Group
31-Dec-11
Acquisition debtRevolving facility (€150m available)
24295
27795Revolving facility (€150m available)
Asset financingProfit-sharing (classified as other financial liabilities in 2012)
95398
-
95401
9
GROSS FINANCIAL DEBT 736 781
CASH & CASH EQUIVALENTS 247 157
NET FINANCIAL DEBT 489 624
355
42
3075
75500600700800
Private placement
Asset financing £
81 66 51
256 232 203
275185
102
19
10
75
75
0100200300400
Asset financing £
Asset financing €
Syndicated loan £
Syndicated loan €
38
81 66 51 1020
31‐Dec‐12 31‐Dec‐13 31‐Dec‐14 31‐Dec‐15
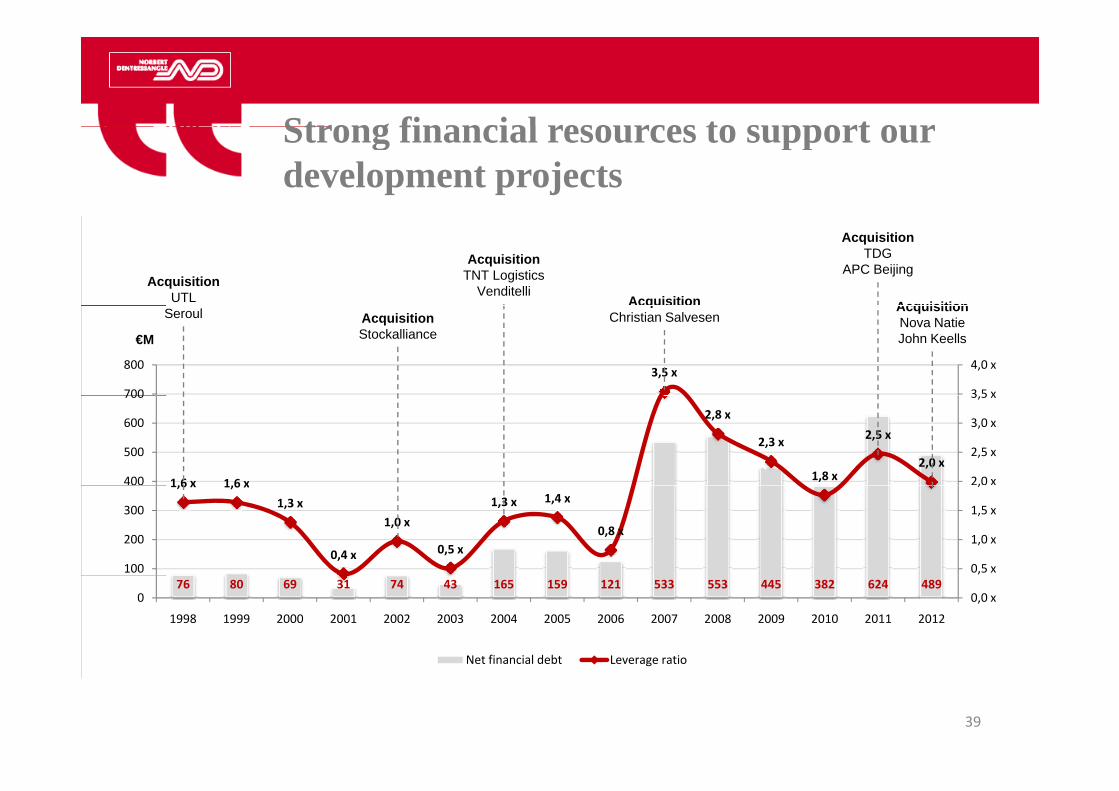
Strong financial resources to support ourStrong financial resources to support our development projects
Acquisition Acquisition
AcquisitionTDG
APC BeijingAcquisition
TNT LogisticsVenditelli
AcquisitionUTL
3,5 x
700
800
3 5 x
4,0 x
cqu s t oChristian Salvesen
AcquisitionNova NatieJohn Keells
AcquisitionStockalliance
Seroul
€M
1,6 x 1 6 x
2,8 x
2,3 x
1,8 x
2,5 x
2,0 x400
500
600
700
2,0 x
2,5 x
3,0 x
3,5 x
1,6 x 1,6 x1,3 x
0,4 x
1,0 x
0,5 x
1,3 x 1,4 x
0,8 x
100
200
300
0,5 x
1,0 x
1,5 x
,
76 80 69 31 74 43 165 159 121 533 553 445 382 624 4890
1998 1999 2000 2001 2002 2003 2004 2005 2006 2007 2008 2009 2010 2011 2012
0,0 x
Net financial debt Leverage ratio
39
g

5. Outlook5. Outlook
40
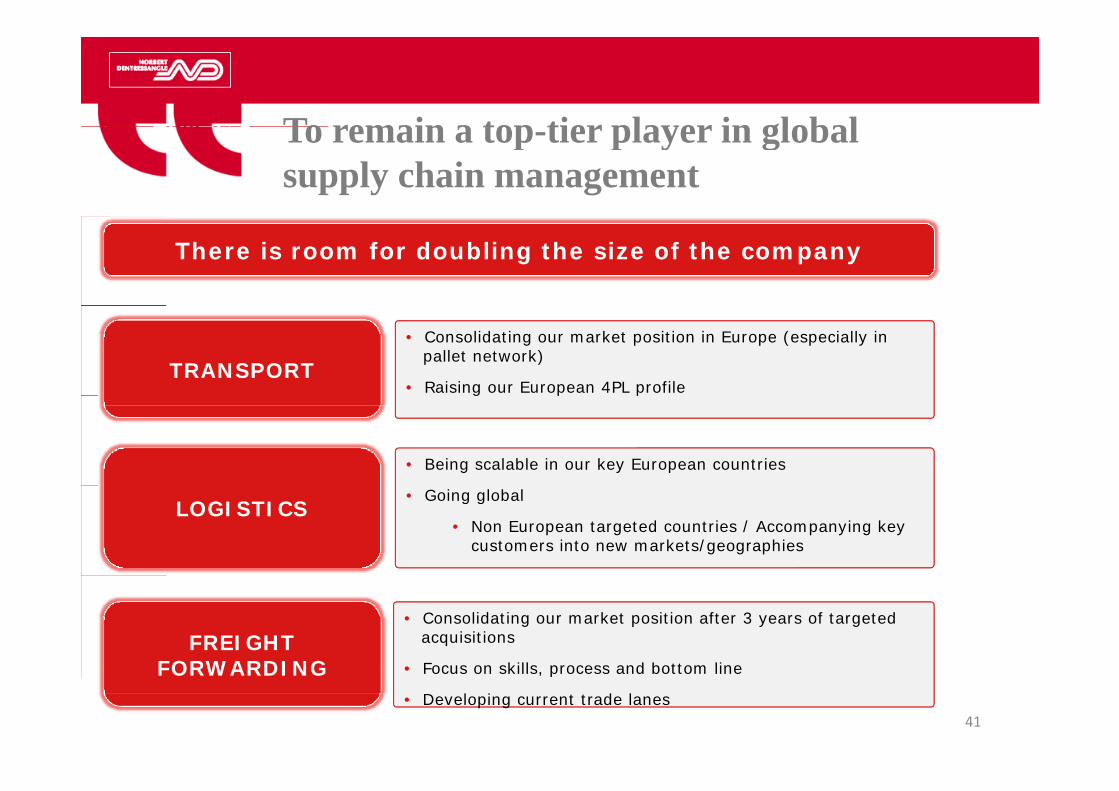
To remain a top tier player in globalTo remain a top-tier player in global supply chain management
There is room for doubling the size of the company
TRANSPORT• Consolidating our market position in Europe (especially in
pallet network)
• Raising our European 4PL profileg p p
• Being scalable in our key European countries
LOGISTICS• Going global
• Non European targeted countries / Accompanying key customers into new markets/geographies
FREIGHT FORWARDING
• Consolidating our market position after 3 years of targeted acquisitions
Fo on kill p o e nd bottom line
41
FORWARDING p g
• Focus on skills, process and bottom line
• Developing current trade lanes
6. Appendices6. Appendices
42
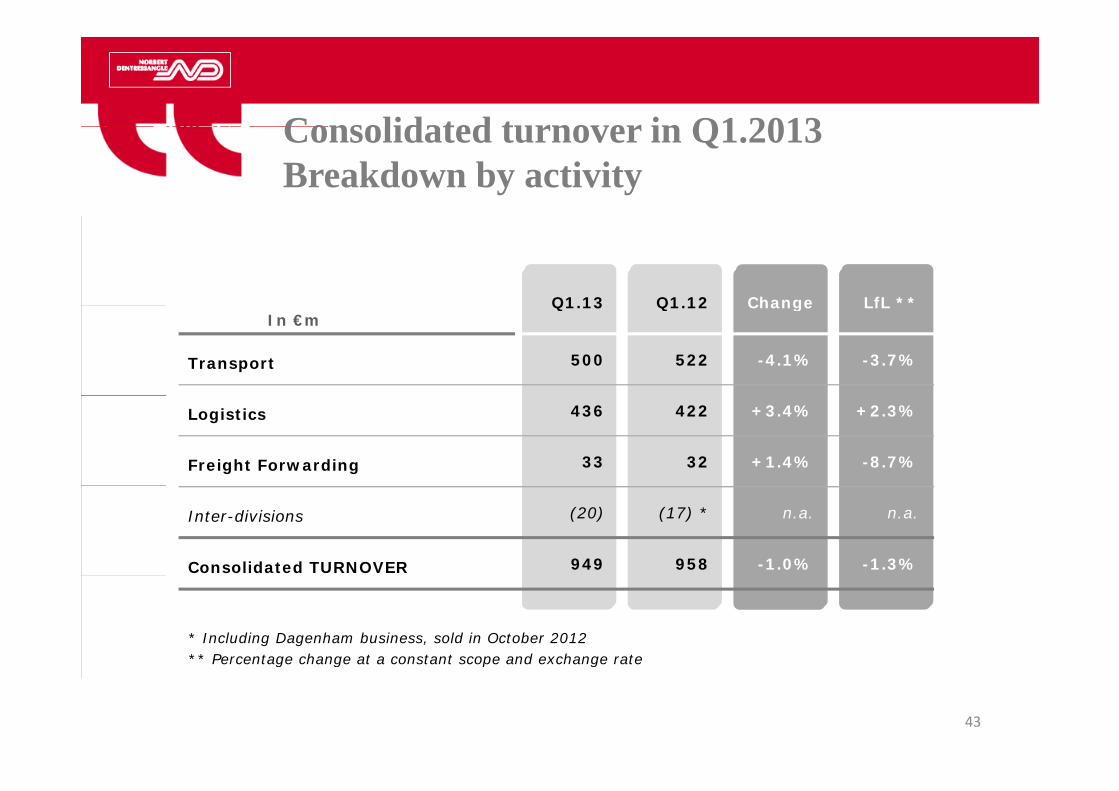
Consolidated turnover in Q1 2013Consolidated turnover in Q1.2013Breakdown by activity
Transport Q1.13 Q1.12 Change LfL **In €m
Transport Q1.13 Q1.12 Change LfL
Transport 500 522 -4.1% -3.7%
Logistics 436 422 +3.4% +2.3%
Freight Forwarding 33 32 +1.4% -8.7%
Inter-divisions (20) (17) * n.a. n.a.
Consolidated TURNOVER 949 958 -1.0% -1.3%
* Including Dagenham business, sold in October 2012** Percentage change at a constant scope and exchange rate
43
g g p g
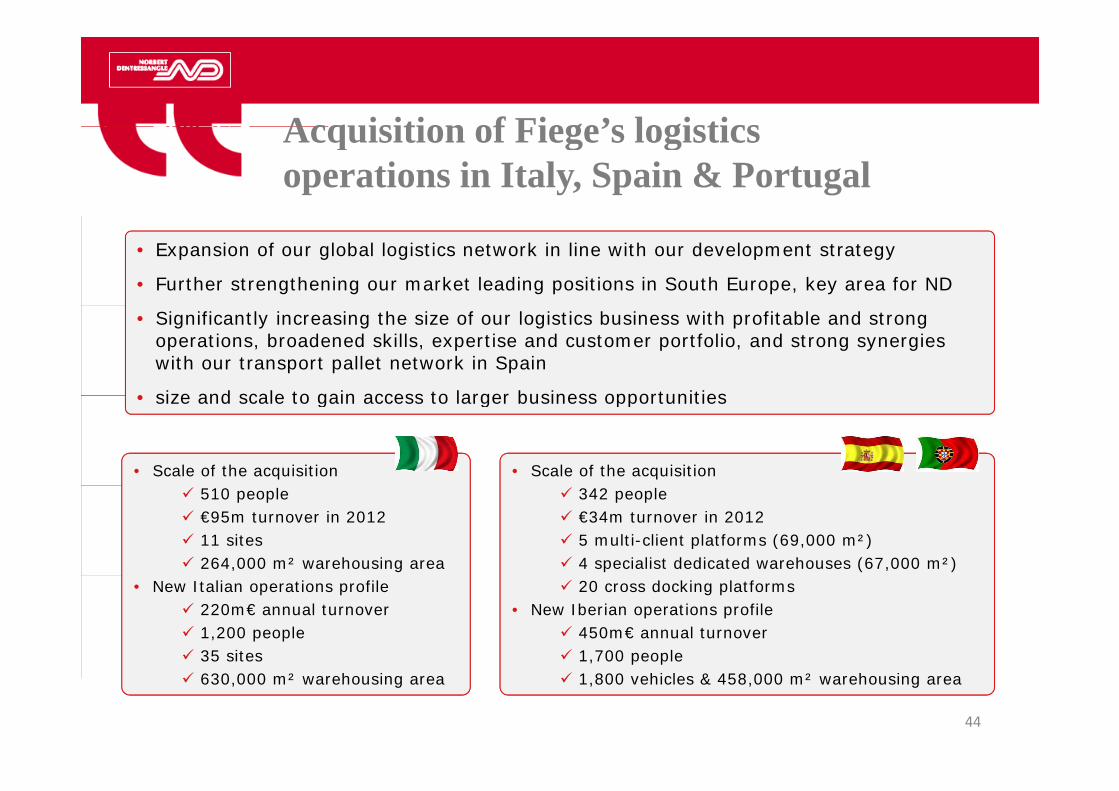
Acquisition of Fiege’s logisticsAcquisition of Fiege’s logistics operations in Italy, Spain & Portugal
• Expansion of our global logistics network in line with our development strategy
• Further strengthening our market leading positions in South Europe, key area for ND
• Significantly increasing the size of our logistics business with profitable and strong operations, broadened skills, expertise and customer portfolio, and strong synergies with our transport pallet network in Spain
• size and scale to gain access to larger business opportunities• size and scale to gain access to larger business opportunities
• Scale of the acquisition • Scale of the acquisition 510 people €95m turnover in 2012 11 sites 264,000 m² warehousing area
342 people €34m turnover in 2012 5 multi-client platforms (69,000 m²) 4 specialist dedicated warehouses (67,000 m²)
• New Italian operations profile 220m€ annual turnover 1,200 people 35 sites
20 cross docking platforms • New Iberian operations profile
450m€ annual turnover 1,700 people
44
630,000 m² warehousing area 1,800 vehicles & 458,000 m² warehousing area

Analyst & InvestorAnalyst & Investor Presentation
LondonLondon4th July 2013