Analyst conference - geberit.com · Marketing expenditure, in CHF million. SLIDE 7 Sales &...
59
Analyst conference Full year review 2017 Christian Buhl, CEO Roland Iff, CFO March 13, 2018
-
Upload
hoangthien -
Category
Documents
-
view
216 -
download
0
Transcript of Analyst conference - geberit.com · Marketing expenditure, in CHF million. SLIDE 7 Sales &...

Analyst conference
Full year review 2017
Christian Buhl, CEO
Roland Iff, CFO
March 13, 2018

SLIDE 2
Agenda
Review C. Buhl
Sales development C. Buhl
Financial Results R. Iff
Sanitec integration C. Buhl
Building construction outlook C. Buhl
Geberit outlook C. Buhl
Summary C. Buhl
MARCH 13, 2018
ANALYST CONFERENCE - FY 2017

SLIDE 3
Key figures 2017
MARCH 13, 2018
ANALYST CONFERENCE - FY 2017
Net sales growth
(in local currencies,
organic)
+3.5%
Adj. EBITDA margin
(-10 bp)
Adj. net income
growth
+3.5%
Adj. earning per share
growth
+3.7%28.2%
Free cashflow
developmentStart of share buy-back
program of maximum
CHF 450 million in June
2017
Dividend proposal
2017
Sanitec integration
-13.2%
(+4.0%)
CHF 10.40
• Major integration
tasks completed
• Synergies of EUR 45
million captured

SLIDE 4
Sales & marketing 2017 – 2nd year of integrated sales organisation
MARCH 13, 2018
ANALYST CONFERENCE - FY 2017
Market activities 2017 – Example Germany
• Customer visits
“Push”: 7’500
“Technical pull”: 53’700
“Showroom pull”: 6’100
• 317 events with 23’800 customers
• 10’300 internal customers at trainings
• 199’000 technical customer service calls and 70’000
customer service emails
Geberit sales force
Wholesalers
Geberit
Push
“T
ec
hn
ica
l” P
ull
Installers / Planners
Showrooms / Architects / DIY/ /
General contractors / Investors
End consumers
“S
ho
wro
om
” P
ull
“E
nd
co
nsu
me
r“ P
ull

SLIDE 5
Sales & marketing 2017 – Key events in Germany
MARCH 13, 2018
ANALYST CONFERENCE - FY 2017
“Geberit NeuheitenTreff”
• 30 "Geberit NeuheitenTreff" events with 7’400 customers in urban areas
• New concept for customers along entire value chain
• Presentation of new & combined product portfolio behind and in front of the
wall
“Geberit Drainage Competence”
• 68 "Geberit Drainage Competence" events with 2’200 customers in rural
areas
• Regional concept for installers & planers
• Focus on market launch Geberit Silent-Pro, wastewater competence &
system technology

SLIDE 6
Marketing 2017 – Expenditure
MARCH 13, 2018
ANALYST CONFERENCE - FY 2017
• Continuous investments in customer
relations and brand reputation
• Marketing spend of 3.7% of net sales 2017
• 25% of total marketing spend for digital
tools and digital channels
98
8484
105
25%
2017
108
75%
2015 201620142013
Others
Digital
In % of net sales
4.2% 4.0% 3.8% 3.7% 3.7%
Marketing expenditure,
in CHF million

SLIDE 7
Sales & marketing 2017 – Key digital activities for professionals and end
consumers
MARCH 13, 2018
ANALYST CONFERENCE - FY 2017
Building Information Modelling (BIM)
• Build-up of dedicated team responsible for completing and maintaining BIM data for
Geberit assortment
• Development of intelligent plug-ins for Autodesk BIM software, e.g., for planning of
Pluvia drainage system
Web-based inspiration tool for end consumers
• Support for inspiration phase
• Personal consulting via live-chat
• Lead generation and management
Web-based specification tool for planners, installers and architects
• Facilitation of specification process for small and large construction projects
• Selection, configuration and planning of country-specific and industry-specific
products

SLIDE 8
Innovation 2017 – R&D Expenditure
MARCH 13, 2018
ANALYST CONFERENCE - FY 2017
• Increasing investments in innovation
pipeline
• R&D expenditure of 2.7% of net sales in
2017
• 32 patents filed in 2017
7872
6356
51
20142013
+8%
2015 2016 2017
In % of net sales
2.5% 2.7% 2.4% 2.6% 2.7%
R&D expenditure,
in CHF million

SLIDE 9
Tuma Comfort
Innovations 2017 – Successful product introductions
MARCH 13, 2018
ANALYST CONFERENCE - FY 2017
Piave, Brenta Setaplano Volex Acanto
• Mid-level shower
toilet with comfort
functions
• Electronic tap
system with slim
& modern design
• Easy to clean
floor even
shower surface
“A compact all-
rounder”
“Easy installation
& maintenance"
“Safe & fast
installation"
• Supply piping
press system
“For European
expansion
markets"
• Versatile
bathroom series
“Innovative
technical
features"

SLIDE 10
CAPEX investments 2017
MARCH 13, 2018
ANALYST CONFERENCE - FY 2017
• 2017 capital expenditures 14.3%
above previous year
• Increased spend for capacity
expansion
• Investments 2017 correspond to
5.5% of net sales
CAPEX,
in CHF million
147
10598
2013 2014 2015
159
2016
57%
34%
9%139
2017
Capacity expansion
New products
Modernization & rationalization
4.9% 5.0% 5.7% 5.0% 5.5%
In % of net sales

SLIDE 11
Investments 2017 – Key projects
MARCH 13, 2018
ANALYST CONFERENCE - FY 2017
New logistics centre in Pfullendorf (DE)
• Finalisation of logistics capacity expansion
• New concept for long good storage
• Innovative technologies and further process innovations
• CAPEX: EUR 40 million (2015-2017)
Capacity expansion & efficiency increase of factory in Pfullendorf (DE)
• Additional new building for cistern production
• New blow moulding machines with payback of 3 years
• New further automated assembly line for concealed cisterns
• CAPEX: EUR 15 million (2017-2018)

SLIDE 12
“Lean processes” in Ekenäs (FI)
• Implementation of lean processes with various measures to optimise material flow from casting
to kiln
• 20% higher productivity
• CAPEX: EUR 1.7 million (2016, 2017)
Investments 2017 – Continuous improvement projects in our ceramics plants
MARCH 13, 2018
ANALYST CONFERENCE - FY 2017
Modernisation of kiln in Wloclawek (PL)
• Upgraded shuttle kiln and kiln cars to reduce energy consumption by 5%
• Payback of 3.7 years
• CAPEX: EUR 1 million (2017)
New glazing lines in Wloclawek (PL)
• New automated glazing lines to increase efficiency
• Payback of 4.6 years
• CAPEX: EUR 0.7 million (2017)

SLIDE 13
Employees 2017– Slight increase due to volume growth in Sanitary Systems
MARCH 13, 2018
ANALYST CONFERENCE - FY 2017
• 11’709 employees as of 2017
• Increase of 117 individuals, or 1.0% compared to the end of 2016
2%
4%8%
24%
62%
R&D
Apprentices
Administration
Sales &
Marketing
Production
Number of employees by business processes
2017
28%
39%
8%
2%
23%
America
Eastern Europe
Rest of
Western Europe
Germany
Asia / Africa
Number of employees by region
2017
SLIDE 14
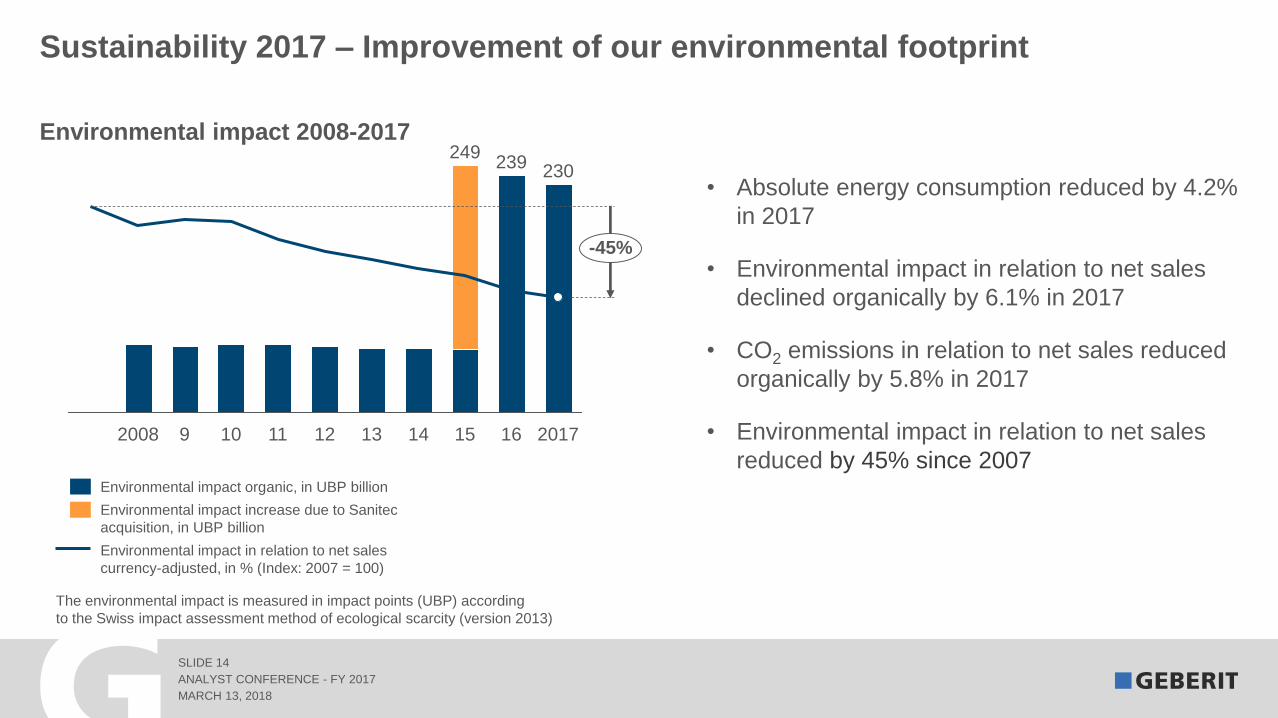
Sustainability 2017 – Improvement of our environmental footprint
MARCH 13, 2018
ANALYST CONFERENCE - FY 2017
The environmental impact is measured in impact points (UBP) according
to the Swiss impact assessment method of ecological scarcity (version 2013)
• Absolute energy consumption reduced by 4.2%
in 2017
• Environmental impact in relation to net sales
declined organically by 6.1% in 2017
• CO2 emissions in relation to net sales reduced
organically by 5.8% in 2017
• Environmental impact in relation to net sales
reduced by 45% since 2007
Environmental impact 2008-2017
-45%
1514
249
10 16
230
112008 13 201712
239
9
Environmental impact increase due to Sanitec
acquisition, in UBP billion
Environmental impact organic, in UBP billion
Environmental impact in relation to net sales
currency-adjusted, in % (Index: 2007 = 100)

SLIDE 15
Social responsibility 2017 – Social project with Geberit apprentices in Ukraine
MARCH 13, 2018
ANALYST CONFERENCE - FY 2017
• Vocational school with 500 students in Odessa, Ukraine
• Renovation of the sanitary facilities as well as other
common/recreation rooms
• Geberit apprentices from Germany, Austria and Switzerland
working on site

SLIDE 16
Agenda
Review C. Buhl
Sales development C. Buhl
Financial Results R. Iff
Sanitec integration C. Buhl
Building construction outlook C. Buhl
Geberit outlook C. Buhl
Summary C. Buhl
MARCH 13, 2018
ANALYST CONFERENCE - FY 2017

SLIDE 17
Sales 2017 – Organic growth in local currencies of 3.5%
MARCH 13, 2018
ANALYST CONFERENCE - FY 2017
Total variance: + CHF 99 million (+ 3.5%)
97
34 32
Net sales
FY 2017
Divestment
(Koralle / Varicor)
2′908
Net sales
FY 2016
Currency
effect
2′809
Organic growth
in local currency
+ 3.5% - 1.2%+ 1.2%
Net sales, in CHF million

SLIDE 18
Sales 2017 – Negative one-time effects in Q2 and Q3
MARCH 13, 2018
ANALYST CONFERENCE - FY 2017
Notes: Variance to prior year in % CHF includes 6 months of sales from Koralle and 12 months from Varicor – neither Koralle nor Varicor contributed to sales in 2017
QuarterNet sales Variance to prior year
CommentCHF million % CHF % c.a., org.
Q1 737.1 2.6% 6.7% • More working days
Q2 732.2 -3.8% -0.8%• 3 working days less
• Mera base effect of CHF 4 million
Q3 733.0 5.8% 3.3%• 1 working day less
• Mera base effect of CHF 8 million
Q4 706.0 10.9% 5.3% • Pre-buying effect in Switzerland
Full year 2'908.3 3.5% 3.5% • Mera base effect of CHF 12 million
+
–
–
–
–
–
+

SLIDE 19
Sales 2017 – Positive development in all regions
MARCH 13, 2018
ANALYST CONFERENCE - FY 2017
+2.9%
Europe
(90.9% of net sales)
+3.6%
America
(3.3% of net sales)
+13.3%
Far East / Pacific
(3.0% of net sales)
+16.8%
Middle East / Africa
(2.8% of net sales)
Net sales in CHF million and organic growth 2017 by region in % (c.a.)
+3.5%
Total

SLIDE 20
Nordic Region 313.7• Strong previous year growth
• Slowdown of market growth in Sweden and Norway
Sales 2017 – Development in European countries / regions (1/2)
MARCH 13, 2018
ANALYST CONFERENCE - FY 2017
Country / RegionNet sales
CHF million
Variance to prior
year
Germany 867.3 0.7%• Limited growth due to capacity constraints of sanitary
installers
Switzerland 278.6
• Slightly growing market environment
• Outperformance driven by upselling strategy and
innovations
Benelux 231.6• Ongoing market recovery in Netherlands
• Positive sales growth in Netherlands and Belgium
% CHF % c.a., org.
Central / Eastern
Europe280.1
• Mixed picture of market environments
• Sales growth in all key markets
• Double digit growth of Installation Systems
2.4% 1.2%
9.0% 6.7%
-0.8% 3.7%
5.8% 4.0%
Notes: Prior year comparison in CHF includes 6 months of sales from Koralle and 12 months from Varicor – neither Koralle nor Varicor contributed to sales in 2017
0.7%
Comment

SLIDE 21
MARCH 13, 2018
ANALYST CONFERENCE - FY 2017
270 284308
375343
215245 248
278310
2015 2016 2017120142013
382 404 445516
2014 20152013 2016
Construction backlog, in 1’000 dwellings
2016
13.4
2015
11.3
Construction time, in months
Single dwelling unit
20162015
16.512.4
Multiple dwelling unit
Market environment Germany – Demand higher than capacities
1 Planning permissions: Extrapolated 11 months numbers; Construction completions: Estimates Ifo Institute
Source: Statistisches Bundesamt
Construction completions, in 1’000 dwellings
Planning permissions, in 1’000 dwellings

SLIDE 22
Market environment Germany – Increased bottleneck of sanitary installers
MARCH 13, 2018
ANALYST CONFERENCE - FY 2017
Vacancy time of open installer1 jobs in Germany
Source: Bundesagentur für Arbeit
156 days
2015 2017
142 days
2016
129 days
• 54% of all sanitary
installer companies
with open positions
in 2017 (2016: 46%)
• New record level of
installer order book
of 10.6 weeks per
end of 2017 –
increase of 14% vs.
2016
1 Plumbing, Heating, Air Conditioning
Construction
Specialist 2017
(130 days)
All jobs in
Germany 2017
(100 days)

SLIDE 23
Nordic Region 313.7• Strong previous year growth
• Slowdown of market growth in Sweden and Norway
Sales 2017 – Development in European countries / regions (1/2)
MARCH 13, 2018
ANALYST CONFERENCE - FY 2017
Country / RegionNet sales
CHF million
Variance to prior
year
Germany 867.3 0.7%• Limited growth due to capacity constraints of sanitary
installers
Switzerland 278.6
• Slightly growing market environment
• Outperformance driven by upselling strategy, innovations
and pre-buying effects
Benelux 231.6• Ongoing market recovery in Netherlands
• Positive sales growth in Netherlands and Belgium
% CHF % c.a., org.
Central / Eastern
Europe280.1
• Mixed picture of market environments
• Sales growth in all key markets
• Double digit growth of Installation Systems
2.4% 1.2%
9.0% 6.7%
-0.8% 3.7%
5.8% 4.0%
Notes: Prior year comparison in CHF includes 6 months of sales from Koralle and 12 months from Varicor – neither Koralle nor Varicor contributed to sales in 2017
0.7%
Comment

SLIDE 24
Sales 2017 – Development in European countries / regions (2/2)
MARCH 13, 2018
ANALYST CONFERENCE - FY 2017
France 176.3• Recovering market environment
• Double digit growth of Installation Systems
UK / Ireland 110.5• Declining market due to weak non-residential sector
• Geberit with dis-proportional exposure to non-residential
Iberian Peninsula 21.4• Ongoing market recovery in Spain
• Double digit sales growth in Spain and Portugal
Italy 201.2• Strong market outperformance due to dedicated sales &
marketing initiative
Austria 161.2
• Strong market growth
• Market outperformance despite already high market
shares
8.3% 6.6%
3.3% 3.9%
9.4% 9.0%
-10.4% -5.6%
13.8% 11.9%
Country / RegionNet sales
CHF million
Variance to prior
year
% CHF % c.a., org.
Notes: Prior year comparison in CHF includes 6 months of sales from Koralle and 12 months from Varicor – neither Koralle nor Varicor contributed to sales in 2017
Comment

SLIDE 25
Sales 2017 – Development in international regions
MARCH 13, 2018
ANALYST CONFERENCE - FY 2017
America
Far East / Pacific
• Stagnation of the institutional market sector
• Further improved profitability of Chicago Faucet
Company
Middle East /
Africa
• Moderate growth of residential construction sector in
China in H2 2017
• Double digit sales growth in China, India and in Australia
• Stabilisation of overall construction market in the Gulf
region
• Double digit sales growth in all key markets of Geberit
3.4% 3.6%96.7
13.5% 13.3%87.8
20.6% 16.8%81.9
Country / RegionNet sales
CHF million
Variance to prior
year
% CHF % c.a., org.
Notes: Prior year comparison in CHF includes 6 months of sales from Koralle and 12 months from Varicor – neither Koralle nor Varicor contributed to sales in 2017
Comment

SLIDE 26
Sales 2017 – Development by product line
MARCH 13, 2018
ANALYST CONFERENCE - FY 2017
Product area / lineNet sales Variance to prior year
CommentCHF million % CHF % c.a., org.
TOTAL 2'908.3 3.5% 3.5%
Sanitary Systems 1'361.5 7.8% 6.6% • Strong growth of Installation Systems driven by
synergies with Sanitary Ceramics
• Negative base effect from Mera backlog elimination in
2016
• Double digit growth of Waste Fittings and Traps driven
by new product introductions
Installation Systems 871.3 10.3% 8.9%
Cisterns and Mechanisms 252.5 -0.9% -1.7%
Faucets and Flushing Systems 129.2 4.6% 4.3%
Waste Fittings and Traps 108.5 13.7% 12.4%
Piping Systems 865.5 5.1% 3.8%• Strong growth of drainage piping systems driven by
upselling and new product introductionsSupply Systems 535.6 2.4% 1.0%
Building Drainage Systems 329.9 9.8% 8.6%
Sanitary Ceramics 681.3 -5.6% -2.3% • Negatively affected by closure of two ceramic plants in
France
• Weaker market environment in Nordic RegionBathroom Ceramics 546.8 -3.2% -2.1%
Ceramics Complementary Products 134.5 -14.1% -3.2%
Notes: Prior year comparison in CHF includes 6 months of sales from Koralle and 12 months from Varicor – neither Koralle nor Varicor contributed to sales in 2017

SLIDE 27
Agenda
Review C. Buhl
Sales development C. Buhl
Financial Results R. Iff
Sanitec integration C. Buhl
Building construction outlook C. Buhl
Geberit outlook C. Buhl
Summary C. Buhl
MARCH 13, 2018
ANALYST CONFERENCE - FY 2017

SLIDE 28
Key figures 2017
MARCH 13, 2018
ANALYST CONFERENCE - FY 2017
• Currency adjusted organic net sales growth of
3.5%
• One-off adjustments mainly in restructuring cost
and amortisation of ceramics technology
• Synergies of EUR 45 million fully captured in 2017
CHF million 2017 2016 % YoY
Net sales 2'908.3 2'809.0 3.5%
Adj. EBITDA 820.7 794.9 3.2%
Margin 28.2% 28.3%
Adj. EBIT 706.1 686.5 2.9%
Margin 24.3% 24.4%
Adj. net income 604.2 584.0 3.5%
Margin 20.8% 20.8%
Adj. EPS (CHF) 16.43 15.85 3.7%
Free cashflow 483.4 556.6 -13.2%
Margin 16.6% 19.8%

SLIDE 29
Income statement 2017
MARCH 13, 2018
ANALYST CONFERENCE - FY 2017
CHF million 2017 % 2016 % % YoY
Net sales 2'908.3 100.0% 2'809.0 100.0% 3.5%
Cost of materials 829.8 28.5% 774.9 27.6% 7.1%
Personnel expenses 746.8 25.7% 702.0 25.0% 6.4%
Depreciation 105.7 3.6% 102.0 3.6% 3.6%
Amortisation 44.6 1.5% 43.1 1.5% 3.5%
Other operating expenses, net 559.7 19.3% 546.9 19.5% 2.3%
Total operating expenses, net 2'286.6 78.6% 2'168.9 77.2% 5.4%
Operating profit (EBIT) 621.7 21.4% 640.1 22.8% -2.9%
EBITDA 772.0 26.5% 785.2 28.0% -1.7%
Adj. EBITDA 820.7 28.2% 794.9 28.3% 3.2%
Adj. operating profit (adj. EBIT) 706.1 24.3% 686.5 24.4% 2.9%

SLIDE 30
FY 2017 – Solid results
MARCH 13, 2018
ANALYST CONFERENCE - FY 2017
• Positive impact from volume and product mix effect
• Higher raw-material prices leading to negative net price effect
• Tarif increases and higher expense for marketing lead to negative other cost effect
• CHF 45 million one-off restructuring cost from closure of two ceramic production plants in France
1.7%
0.3%
Other cost
effects
+ 1.3%
M&A net
(Koralle / Varicor)
Adj. EBITDA
margin FY 2016
28.2%+ 0.1%
Currency effectVolume and
product mix effect
26.5%
28.0%
-
- 0.9%
28.3% - 0.6%
Price effects,
net
Adj. EBITDA
margin FY 2017
Adjustments / one-off
Reported EBITDA margin

SLIDE 31
One-off cost related to Sanitec acquisition 2017
MARCH 13, 2018
ANALYST CONFERENCE - FY 2017
One off & recurring cost from acquisition /
deconsolidation
Integration cost
Restructuring costs1
One-off (gain) / loss from divestment2
Total cost on EBITDA level
Depreciation and amortisation
Total cost on EBIT level
Tax effect
Total cost on net income level
2017
CHF million
1 Costs related to closure of two French ceramics production plants
2 Varicor transaction
3
45
1
49
35
84
-7
77

SLIDE 32
Adj. net income and adj. EPS 2017 – Slightly above prior year’s level
MARCH 13, 2018
ANALYST CONFERENCE - FY 2017
CHF million 2017 % 2016 % % YoY
Operating profit (EBIT) 621.7 21.4% 640.1 22.8% -2.9%
Financial result, net -9.4 -0.3% -9.3 -0.3% -1.1%
Profit before income tax expenses 612.3 21.1% 630.8 22.5% -2.9%
Income tax expenses 84.9 2.9% 82.6 3.0% 2.8%
in % pre-tax profit 13.9% 13.1%
Net income 527.4 18.1% 548.2 19.5% -3.8%
EPS (CHF) 14.34 14.88 -3.6%
Adj. net income 604.2 20.8% 584.0 20.8% 3.5%
Adj. EPS (CHF) 16.43 15.85 3.7%

SLIDE 33
Free cashflow 2017 – Negative impact from investments and NWC
MARCH 13, 2018
ANALYST CONFERENCE - FY 2017
CHF million 2017 2016 % YoY
EBITDA 772.0 785.2 -1.7%
Financial result, net -9.4 -9.3
Income tax expenses -84.9 -82.6
Changes in deferred taxes1 and current income tax liabilities and provisions -41.2 -21.4
Changes in non-current provisions 71.5 33.2
Changes in other non-current assets and liabilities 0.0 -4.9
Net cashflow 708.0 700.2 1.1%
in % net sales 24.3% 24.9%
Purchase of PP&E and intangible assets, net -155.5 -132.9
Changes in net working capital -36.1 10.1
Payments charged to non-current provisions -33.0 -20.8
Free cashflow 483.4 556.6 -13.2%
in % net sales 16.6% 19.8%
1 Only portion booked to the income statement

SLIDE 34
Balance sheet 2017 – FX impact increased all balance sheet positions
MARCH 13, 2018
ANALYST CONFERENCE - FY 2017
CHF million 31.12.2017 31.12.2016
Cash and cash equivalents 412.7 509.7
Net working capital 173.0 147.3
Property, plant and equipment 812.8 726.5
Deferred tax assets 96.1 96.7
Other non-current assets and non-current financial assets 35.0 26.1
Goodwill and intangible assets 1'748.9 1'681.1
Total assets 3'742.8 3'601.1
Debt 895.2 970.9
Accrued pension obligations 309.2 325.8
Deferred tax liabilities 76.5 89.7
Tax liabilities and tax provisions 101.8 120.0
Other non-current provisions and nun-current liabilities 57.7 46.0
Equity 1'837.2 1'635.2
Equity ratio 49.1% 45.4%
Net debt 482.5 461.2
Gearing 26.3% 28.2%

SLIDE 35
Dividend – Proposed increase of 4.0%
MARCH 13, 2018
ANALYST CONFERENCE - FY 2017
CHF thousand 2017 2016
Net income Geberit AG 501'972 389'771
Balance brought forward 3'169 3'813
Withdrawal from free reserves - -
Total available earnings 505'141 393'584
Transfer to free reserves 120'000 20'000
Proposed / paid dividend 383'0961 370'4152
Balance to be carried forward 2'045 3'169
Total appropriation of available earnings 505'141 393'584
1 The Board of Directors proposes to the Geberit AG annual general meeting on April 4, 2018 a dividend of CHF 10.40 per share with dividend right. This corresponds to a payout ratio
of 63.4%. The actual amount of shares with dividend rights may change prior to the annual general meeting.
2 Dividend of CHF 10.00 per share

SLIDE 36
Agenda
Review C. Buhl
Sales development C. Buhl
Financial Results R. Iff
Sanitec integration C. Buhl
Building construction outlook C. Buhl
Geberit outlook C. Buhl
Summary C. Buhl
MARCH 13, 2018
ANALYST CONFERENCE - FY 2017

SLIDE 37
Sanitec integration – Integration roadmap successfully executed
MARCH 13, 2018
ANALYST CONFERENCE - FY 2017
2015
“Get the basics”
• Integration planning
• Organisational design
• Clarity for people
• Sales system integration
2016
“Go live as one company”
• One face to the customers
• Harmonize processes and tools
• Majority of synergies captured
2017-19
“Capture the strategic benefits”
• Capture remaining synergies
• Optimised business processes
• Combined product innovations
• Major integration tasks
completed as of 2017
• All synergies of EUR 45
million captured – ahead of
plan
• Total integration costs of
CHF 45 million
• Further solidification and
improvement of combined
business required, e.g.,
- ERP systems
- Combined products
- Cultural integration
Integration roadmap

SLIDE 38
Organisation
• One single company since 2016 with a functional organisation – no divisions and matrices
• Exit of 10 sales and corporate locations
• Alignment of legal structure and elimination of > 20 legal entities
Sanitec integration – Major integration tasks completed (1/2)
MARCH 13, 2018
ANALYST CONFERENCE - FY 2017
IT-Systems• Replacement of first ex-Sanitec ERP system as of January 1, 2017 – further roll-out plan defined
• IT infrastructure fully harmonized
Sales and
marketing
• One customer oriented sales organisation with new “showroom pull”
• CRM systems and sales processing fully integrated
• Evolutionary development and roll-out of CI/CD
Products
• Insourcing of products largely completed, e.g., ceramics for shower toilets and fill & flush valves
• Further streamlining of ceramics portfolio
• Geberit branded ceramics launched in selective markets

SLIDE 39
Operations
• Two ceramics production plants closed in France
• Roll-out of Geberit production system (GPS)
• First improvement projects implemented
Sanitec integration – Major integration tasks completed (2/2)
MARCH 13, 2018
ANALYST CONFERENCE - FY 2017
Business
portfolio• Divestment or closure of all non-core businesses with limited synergies due to different customer focus
and/or made to measure products (e.g., Koralle, Varicor)
Synergies• Total synergies of EUR 45 million captured as of 2017 – ahead of plan
• Total integration costs of CHF 45 million according to plan

SLIDE 40
Agenda
Review C. Buhl
Sales development C. Buhl
Financial Results R. Iff
Sanitec integration C. Buhl
Building construction outlook C. Buhl
Geberit outlook C. Buhl
Summary C. Buhl
MARCH 13, 2018
ANALYST CONFERENCE - FY 2017

SLIDE 41
Building construction outlook – Europe
MARCH 13, 2018
ANALYST CONFERENCE - FY 2017
Overall favourable but mixed construction market environment
• Confident about demand in Germany – bottleneck of qualified sanitary installers continues to limit growth
• Stable market on high level in Switzerland
• Growing market in Austria but at slower pace
• Mixed picture in Nordic Region – positive for Denmark and Finland, cool down in Sweden and Norway
• Positive outlook for Benelux – ongoing recovery in NL leads to shortages of sanitary installers
• Growing construction market in France
• Slightly improving environment in Italy
• Robust residential sector but declining non-residential sector in UK
• Mixed picture in Eastern Europe
• Recovery on Iberian Peninsula from low level
SLIDE 42
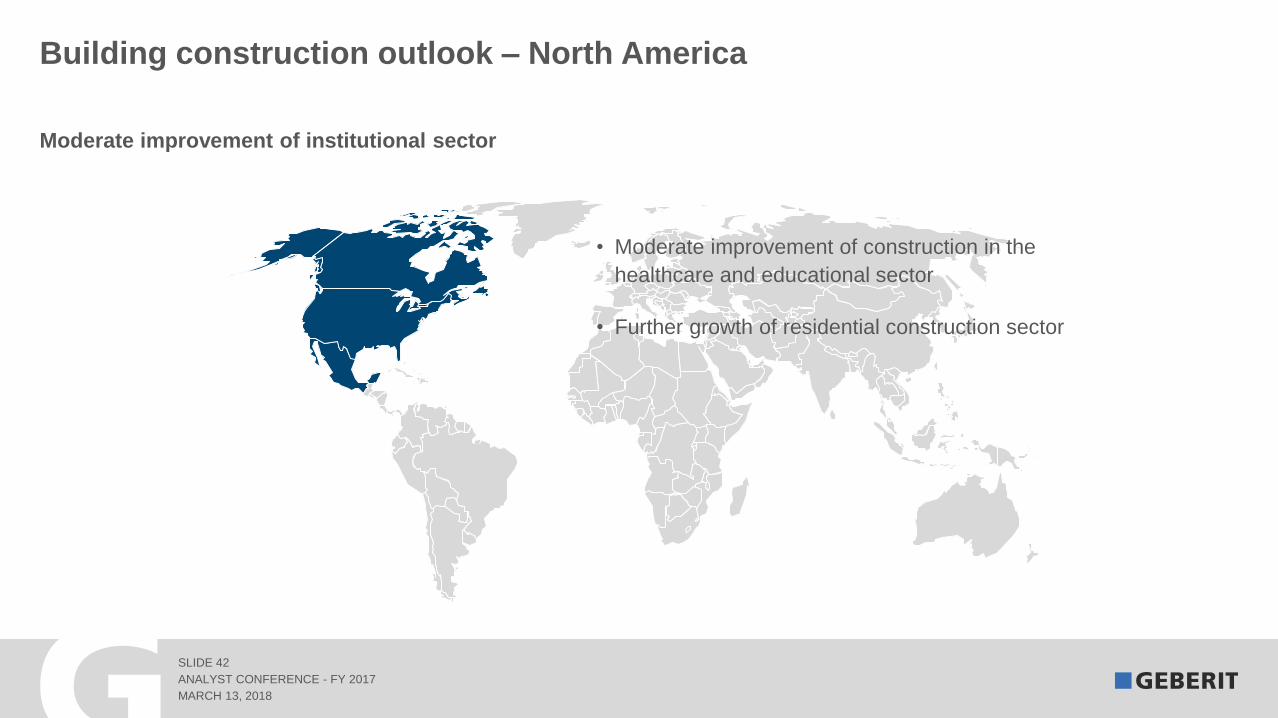
Building construction outlook – North America
MARCH 13, 2018
ANALYST CONFERENCE - FY 2017
• Moderate improvement of construction in the
healthcare and educational sector
• Further growth of residential construction sector
Moderate improvement of institutional sector

SLIDE 43
Building construction outlook – Asia Pacific
MARCH 13, 2018
ANALYST CONFERENCE - FY 2017
• Moderate increase of the residential construction market in China
• Cautious for the residential sector in India due to new regulations
and policies introduced last year
• Stagnation of the building construction market in Australia
• Mixed picture in South East Asia
Mixed picture across the region

SLIDE 44
Building construction outlook – Middle East / Africa
MARCH 13, 2018
ANALYST CONFERENCE - FY 2017
• Improving construction market in the Gulf
region
• Stagnating building construction market
environment in South Africa
• Mixed picture in Northern Africa / Near East
Improving construction market in Gulf region

SLIDE 45
Agenda
Review C. Buhl
Sales development C. Buhl
Financial Results R. Iff
Sanitec integration C. Buhl
Building construction outlook C. Buhl
Geberit outlook C. Buhl
Summary C. Buhl
MARCH 13, 2018
ANALYST CONFERENCE - FY 2017

SLIDE 46
New product introductions 2018 – Geberit AquaClean Tuma Classic
MARCH 13, 2018
ANALYST CONFERENCE - FY 2017
• Entry-level shower toilet with
Compact design
Rimfree ® WC ceramic – easy to clean
Unlimited warm water comfort
Established WhirlSpray shower technology
• Two variants: Complete solution (seat + ceramic) or seat only

SLIDE 47
New product introductions 2018 – Washbasins VariForm
MARCH 13, 2018
ANALYST CONFERENCE - FY 2017
• Comprehensive portfolio of countertop washbasins
• Four geometric shapes: round, oval, elliptic and square
• Universal and timeless design with particularly slim rims
• Replacement of many local ranges by one group range

SLIDE 48
New product introductions 2018 – New basic fill valve Type 333
MARCH 13, 2018
ANALYST CONFERENCE - FY 2017
• New basic fill valve for flushing cisterns
• Fits to Geberit and OEM flushing systems
• Low noise level
• Dirt and chemical substances resistant

SLIDE 49
New product introductions 2018 – Geberit sanitary flush Rapid
MARCH 13, 2018
ANALYST CONFERENCE - FY 2017
• Automated flushing system for supply piping systems
• Helps to avoid hygiene risks
• Compact design for pre-wall installation, battery-driven
• Fast installation when hygiene is acutely at risk

SLIDE 50
New product introductions 2018 – Geberit energy retaining valve ERV
MARCH 13, 2018
ANALYST CONFERENCE - FY 2017
• Energy saving valve on top of drainage stack
• Saves up to 50l of heating oil per year and drainage stack
• Maintenance-free with insect screen and frost resistance
• Odour stop on the roofs used as a terrace

SLIDE 51
Investments 2018 – Capacity expansion and renewals
MARCH 13, 2018
ANALYST CONFERENCE - FY 2017
Building extension in Ozorkow (PL)
• New factory building for metal fittings production
• Start of production in 2019
• CAPEX: EUR 9 million (2018-2019)
Complete renewal of production site in Langenfeld (DE)
• Complete renewal of the production site for metal piping systems
• 2 new buildings: Production hall (15’400m2) and admin building (5’500m2)
• Start of production as of 2019
• CAPEX: EUR 35 million (2017-2018)

SLIDE 52
Investments 2018 – Capacity expansion and renewals
MARCH 13, 2018
ANALYST CONFERENCE - FY 2017
Capacity and efficiency increase in
Lichtenstein (DE)
• Additional automated welding line for
Installation systems
• Optimisation of existing capacity by
improved processes
• Payback of 2 years
• CAPEX: EUR 5 million for capacity
and efficiency (2017-2018)

SLIDE 53
Marketing & Brands outlook 2018
MARCH 13, 2018
ANALYST CONFERENCE - FY 2017
New Geberit AquaClean shower toilet campaign
• New flexible B2C marketing campaign “my confidence”
• More focus on product and benefits
• Educative, provocative and lifestyle oriented
• Roll-out in all European campaign markets including Sweden
Brand portfolio simplification
• Phase-out of 4 ceramic brands (Keramag, Sphinx, Allia, Pozzi-
Ginori) and replacement with Geberit brand, starting in 2019
• Key benefits:
Improved customer support
Simplified cross- and upselling
Reduced complexity in operations and logistics
More capacity for development of new products

SLIDE 54
Reporting outlook 2018
• No more integration and restructuring cost on EBITDA level
• 2018 will be the last year with adjustments for amortisation charges for intangibles of about CHF 36 million
• Due to the completed Sanitec integration, sales reporting will be shown as of 2018 by three newly organised
product areas:
MARCH 13, 2018
ANALYST CONFERENCE - FY 2017
Installation Systems
Installation & Flushing Systems
Cisterns & Mechanisms Supply Systems
Building Drainage Systems
Piping Systems
Taps & ControlShowers & Bathtubs
Bathroom Ceramics &
Furniture
Bathroom Systems
Shower Toilets
SLIDE 55
Agenda
Review C. Buhl
Sales development C. Buhl
Financial Results R. Iff
Sanitec integration C. Buhl
Building construction outlook C. Buhl
Geberit outlook C. Buhl
Summary C. Buhl
MARCH 13, 2018
ANALYST CONFERENCE - FY 2017

SLIDE 56
Summary – Geberit with a successful year 2017
• Solid organic sales growth
• Strong sales growth of Installation Systems due to synergies with ceramics business
• Stable profitability despite substantially higher raw material prices
• Operating results on new record levels
• Sanitec integration completed – synergies captured earlier than initially planned
• Successful new product introductions proving our innovation leadership
• Increased investments in operations, product pipeline and customer relations for future value creation
MARCH 13, 2018
ANALYST CONFERENCE - FY 2017

SLIDE 57
Summary – Outlook
• Favourable but mixed construction market outlook
• Increasing raw material prices and personnel cost (labour tariffs)
• Fundamentals of Geberit remain very solid
• Uniquely positioned in Europe with sustainable organic growth perspectives
• Further solidification and improvement of combined business behind and in front of the wall
• Strong cash generation enabling attractive dividend pay-out combined with share buy-back programs
MARCH 13, 2018
ANALYST CONFERENCE - FY 2017

SLIDE 58
Important dates in 2018
MARCH 13, 2018
ANALYST CONFERENCE - FY 2017
• April 4, 2018 • Annual meeting
• May 3, 2018 • Interim report on the first quarter 2018
• Conference call
• August 14, 2018 • Interim report on the second quarter 2018
• Conference Call
• October 30, 2018 • Interim report on the third quarter 2018
• Conference call
• April 10, 2018 • Dividend payment

SLIDE 59
Disclaimer
MARCH 13, 2018
ANALYST CONFERENCE - FY 2017
While Geberit is making great efforts to include accurate and up-to-date information, we make no representations or warranties,
expressed or implied, as to the accuracy or completeness of the information provided in this handout and disclaim any liability
for the use of it.
The statements in this presentation relating to matters that are not historical facts are forward-looking statements that are not
guarantees of future performance and involve risks and uncertainties, including but not limited to: future global economic
conditions, foreign exchange rates, regulatory rules, market conditions, the actions of competitors and other factors beyond the
control of the company.
All financial information included is audited except quarterly sales, analyses to impact of currencies, non-organic impact, one-
off adjustments as well as the development of the EBITDA margin. Quarterly figures are prepared under the same recognition
and measurement principles applied for the audited annual financial statements.