Analyst Conference - Mahindra & Mahindra · ICICI Prudential Life Insurance Ltd ... Cash & Bank...
44
1 Analyst Conference May 30, 2013 V S Parthasarathy
Transcript of Analyst Conference - Mahindra & Mahindra · ICICI Prudential Life Insurance Ltd ... Cash & Bank...

1
Analyst Conference
May 30, 2013
V S Parthasarathy

2

3
“Three Speed Economies”
Phrase Courtesy : Christine Lagarde
4
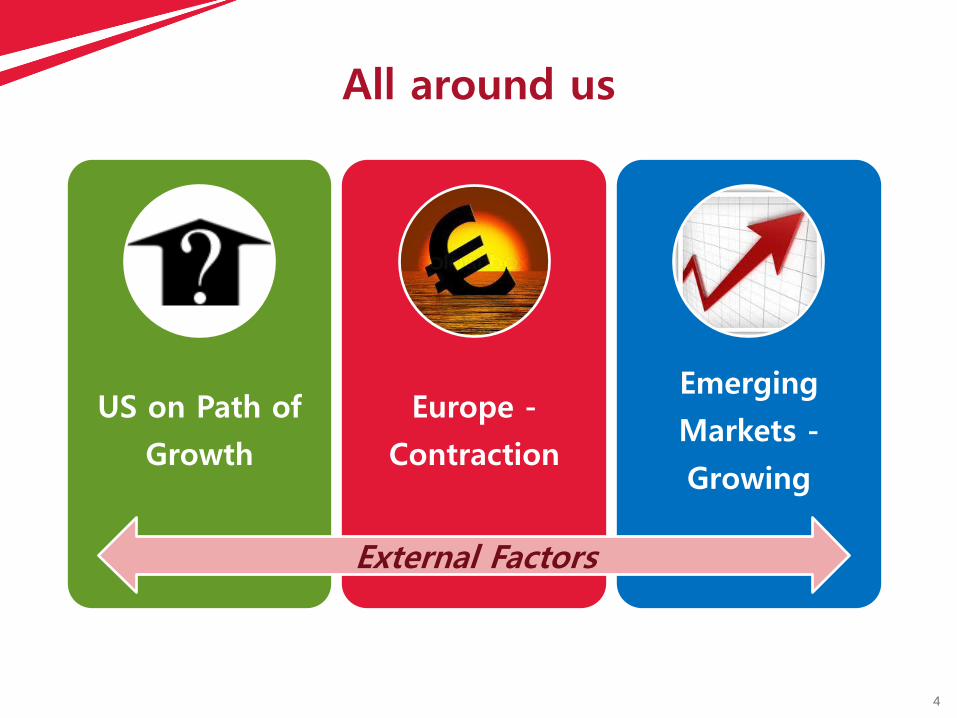
All around us
US on Path of
Growth
Europe -
Contraction
Emerging
Markets -
Growing
External Factors
5
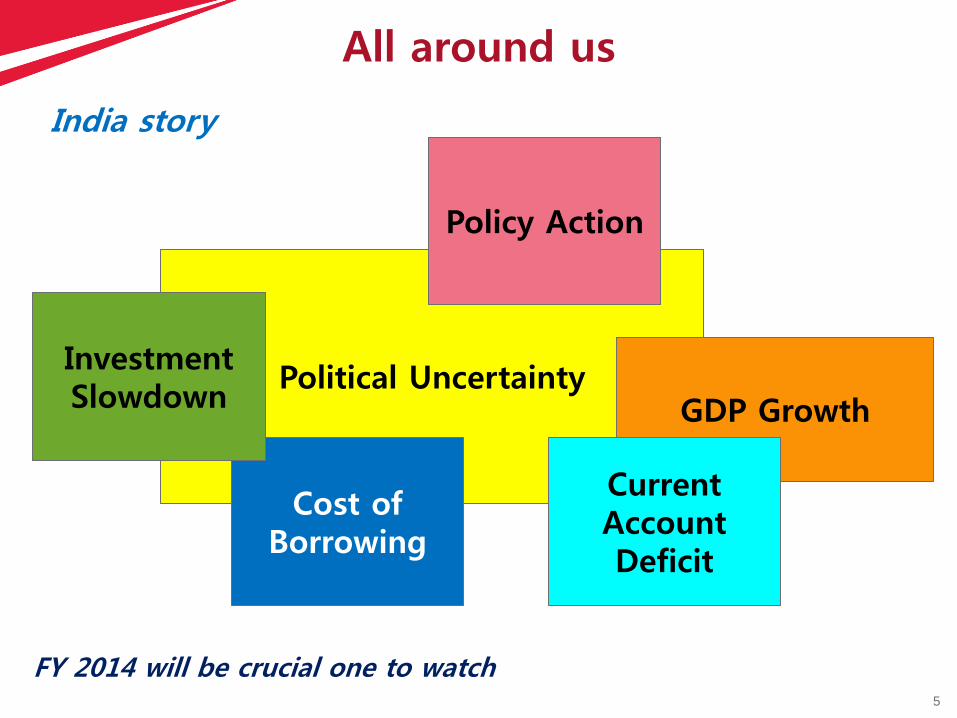
Political Uncertainty
Policy Action
GDP Growth
Current Account Deficit
Cost of Borrowing
Investment Slowdown
All around us
India story
FY 2014 will be crucial one to watch
6
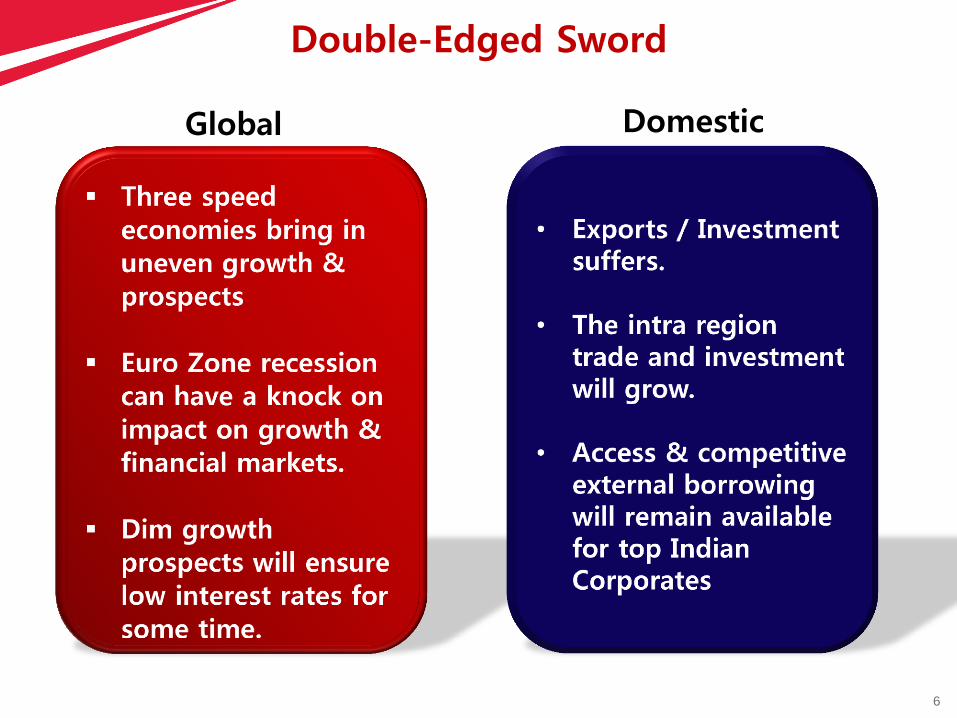
Double-Edged Sword
Global Domestic
7
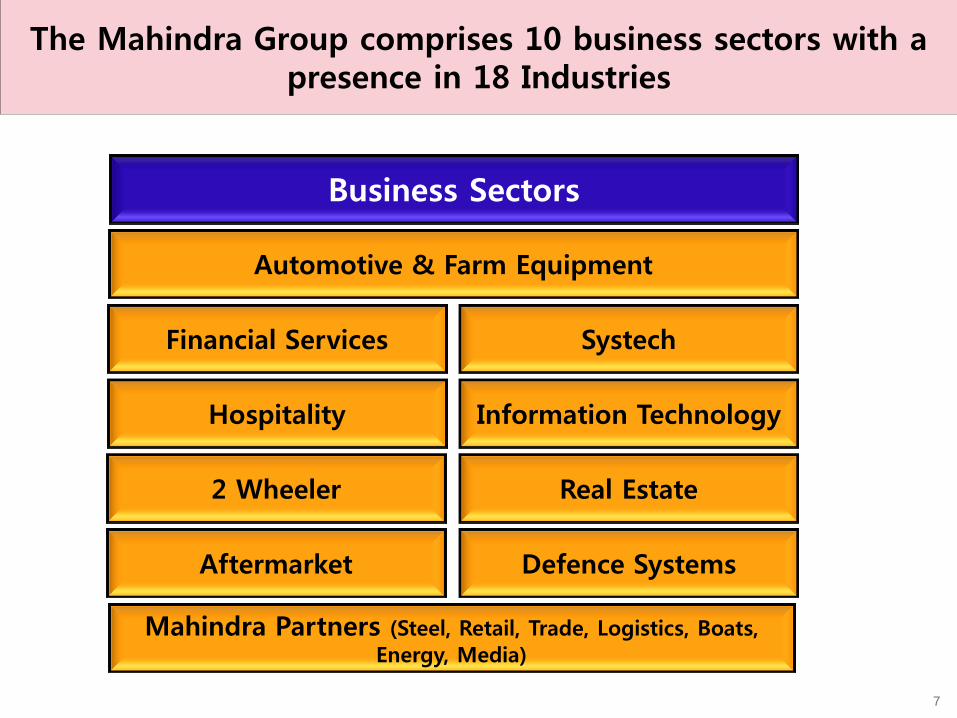
Business Sectors
Automotive & Farm Equipment
Aftermarket
Hospitality
Mahindra Partners (Steel, Retail, Trade, Logistics, Boats,
Energy, Media)
2 Wheeler
Systech
Information Technology
Real Estate
Defence Systems
Financial Services
The Mahindra Group comprises 10 business sectors with a presence in 18 Industries

8
Aerospace Aftermarket Agri
Business Automotive
Auto Components
Construction Equipment
Consulting Services
Defense Energy Farm
Equipment
Finance & Insurance Brokers
Industrial Equipment
Information Technology
Leisure & Hospitality
Logistics
Real Estate Retail Two
Wheelers
The Mahindra Group comprises 10 business sectors with a presence in 18 Industries

9
Set new standards for our vehicles
Helping farmers sow seeds for a better tomorrow
Providing IT solutions to fortune 100 companies

10
Help the world to soar greater heights
Innovate for green tomorrow - EV
Innovate for green tomorrow – Solar Energy

11
Green homes for better living
Create magical moments for the family
Redefine rural financing

12
Life Insurance Corporation of India
Goolboot Holdings Ltd (Goldman Sachs)
ICICI Prudential Life Insurance Ltd
First State Investments
Europacific Growth Fund
General Insurance Corporation of India
Government of Singapore
The New India Assurance Company Ltd
Vanguard Emerging Markets Stock Index
Fund
J P Morgan Group
Top 10 Shareholders with > 1%
Shareholding Pattern
Promoter and
Promoter Group 25.2%
FII / NRI / GDR
44.1%
Insurance Cos.
14.0%
FI / MF / Banks 1.4%
Individuals 15.2%

13
How we fared

14
Financial Highlights
Growth in Total income
Rs 11,342 crs
Rs 10,334 crs
10%
Q4- FY13 Vs Q4- FY12 (M&M + MVML)
Rs 1,435 crs
Rs 1,092 crs
31%
Rs 963 crs
Rs 911 crs
6%
Growth in EBIDTA Growth in PAT
Rs 872 crs
Rs 654 crs
33%
Growth in PAT *
* On like to like comparison, excluding one time benefit of Rs. 257
crores on account of MADPL merger from FY 2012 & 91 crs in FY 13 of
Exceptional Gain on sale of MHRIL shares
15
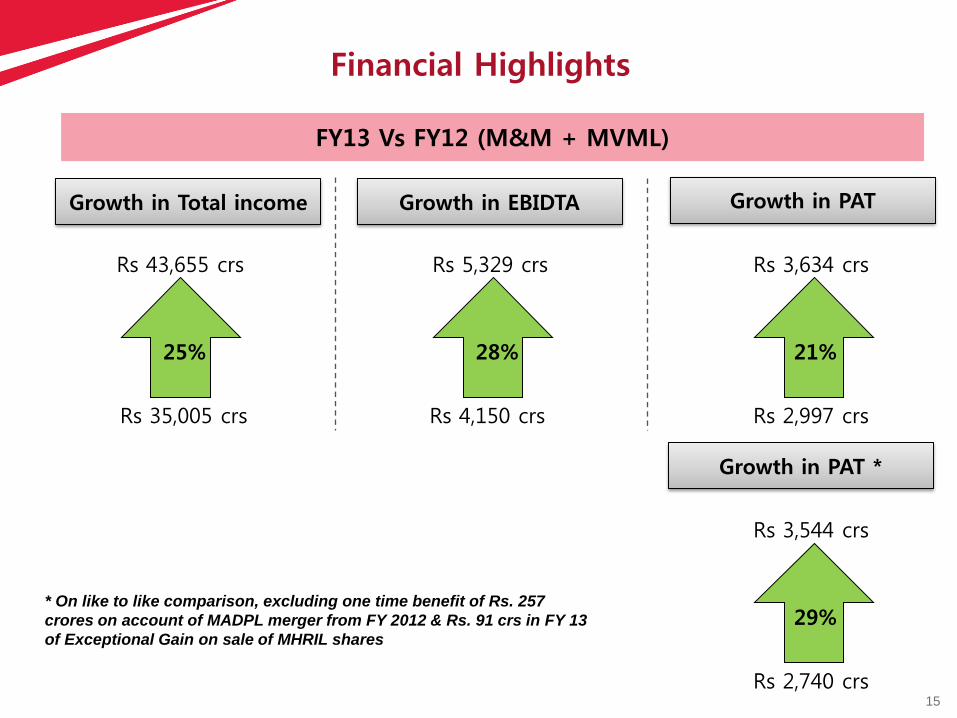
Financial Highlights
Growth in Total income
Rs 43,655 crs
Rs 35,005 crs
25%
FY13 Vs FY12 (M&M + MVML)
Rs 5,329 crs
Rs 4,150 crs
28%
Rs 3,634 crs
Rs 2,997 crs
21%
Growth in EBIDTA Growth in PAT
Rs 3,544 crs
Rs 2,740 crs
29%
Growth in PAT *
* On like to like comparison, excluding one time benefit of Rs. 257
crores on account of MADPL merger from FY 2012 & Rs. 91 crs in FY 13
of Exceptional Gain on sale of MHRIL shares

16
Strong Growth Trajectory
Gross Revenue & Other Income PAT
861
2,068
2,687 2,997
3,634
FY09 FY10 FY11 FY12 FY13
Figures on Standalone basis (M&M + MVML)
15,072
20,735
26,201
35,005
43,655
FY09 FY10 FY11 FY12 FY13
30% 43%
EBITDA
1,155
2,965
3,621 4,150
5,329
FY09 FY10 FY11 FY12 FY13
47%
8.8%
13.9%
17
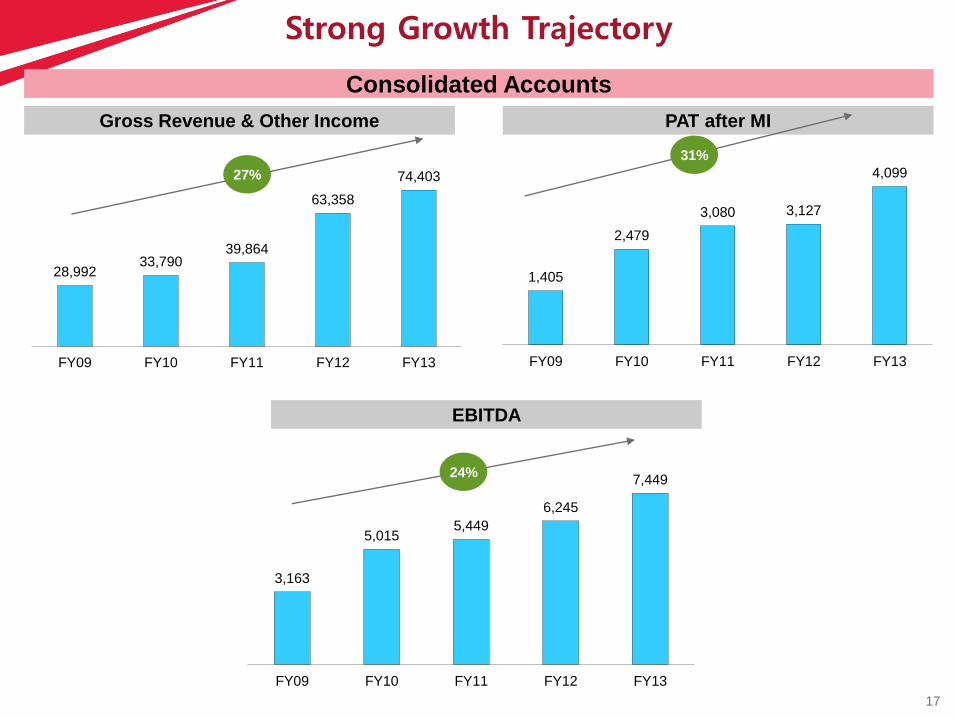
Strong Growth Trajectory
Gross Revenue & Other Income PAT after MI
1,405
2,479
3,080 3,127
4,099
FY09 FY10 FY11 FY12 FY13
Consolidated Accounts
28,992 33,790
39,864
63,358
74,403
FY09 FY10 FY11 FY12 FY13
27%
31%
EBITDA
3,163
5,015 5,449
6,245
7,449
FY09 FY10 FY11 FY12 FY13
24%

18
Generating robust EPS growth
2.7 2.2 3.1 7.5
11.5
19.0 22.6 23.1
15.9
38.0
46.6 51.0
61.6
2001 2004 2007 2010 2013
Note: Adjusted for Bonus & Stock-split

19
4.7
4.4
32.8
0.00 5.00 10.00 15.00 20.00 25.00 30.00 35.00
Gold
Sensex
M&M
Delivering consistent, very long term value – 21 years
Long term Performance - March’ 1992 to March ‘ 2013
CAGR 18.1%
CAGR @ 7.3%
CAGR @ 7.6%
Note: Adjusted for Bonus & Stock-split Ex Dividend price

20
5.3
5.4
30.2
0.00 5.00 10.00 15.00 20.00 25.00 30.00 35.00
Gold
Sensex
M&M
Delivering consistent, long term value – 11 years
Long term Performance - March’ 2002 to March ‘ 2013
CAGR 36.3%
CAGR @ 16.6%
CAGR @ 16.3%
Note: Adjusted for Bonus & Stock-split Ex Dividend price

21
1.7
1.2
2.5
0.00 0.50 1.00 1.50 2.00 2.50 3.00
Gold
Sensex
M&M
Delivering consistent, medium term value – 5 years
Long term Performance - March’ 2008 to March ‘ 2013
CAGR @ 20.0%
CAGR @ 3.8%
CAGR @ 11.7%
Note: Adjusted for Bonus & Stock-split Ex Dividend price

22
4.7
4.4
32.8
0.00 5.00 10.00 15.00 20.00 25.00 30.00 35.00 40.00 45.00
Gold
Sensex
M&M
Delivering consistent, long term value – 21 years
Last 5 years
2.5
1.2
1.7
Note: Adjusted for Bonus & Stock-split Ex Dividend price
Last 11 years
30.2
5.4
5.3

23
Original Investment Cost Vs. CMP
As on 31st, March 2013 Cost Market Value
Listed Companies
Subsidiaries 2994 11,090
Associates 649 6,592
Total 3,644 17,683
Rs. crores

24
Unlocking Shareholders Value – Since 2005
Corporate Actions
Bonus Issue – FY 2005 – 1:1
Stock Split – FY 2011 – 1:2
25
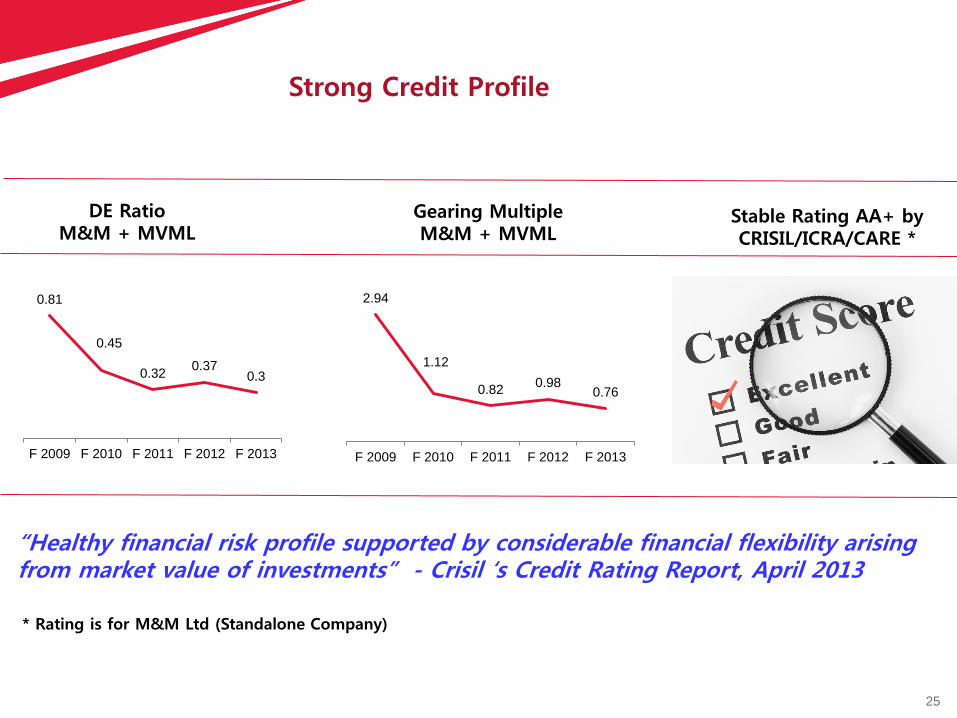
Strong Credit Profile
0.81
0.45
0.32 0.37
0.3
F 2009 F 2010 F 2011 F 2012 F 2013
2.94
1.12
0.82 0.98
0.76
F 2009 F 2010 F 2011 F 2012 F 2013
DE Ratio M&M + MVML
Gearing Multiple M&M + MVML
Stable Rating AA+ by CRISIL/ICRA/CARE *
* Rating is for M&M Ltd (Standalone Company)
“Healthy financial risk profile supported by considerable financial flexibility arising from market value of investments” - Crisil ‘s Credit Rating Report, April 2013
26
Marathon Runner
Prudent Capital Allocation Support growth with Strategic Acquisition Maintain strong Credit Rating
Deliver long term shareholder value

27
+
+
=
Good Strategy Execution / Belief in
strategy
Tenacity / Patience
Success / Long Term Returns
Execution / Belief in
strategy
Tenacity / Patience
What Drives us

28
Finance and Accounts Milestones
Leveraging group strength for benefit of ecosystem
Innovative Fund raising & debt restructuring for group companies
Harnessing latest technology in F&A function.
Several awards in recognition of contribution to Finance & Accounts
– Capital Raising – Cost Management – M&A – Best CFO of the Year

29
Financials
30
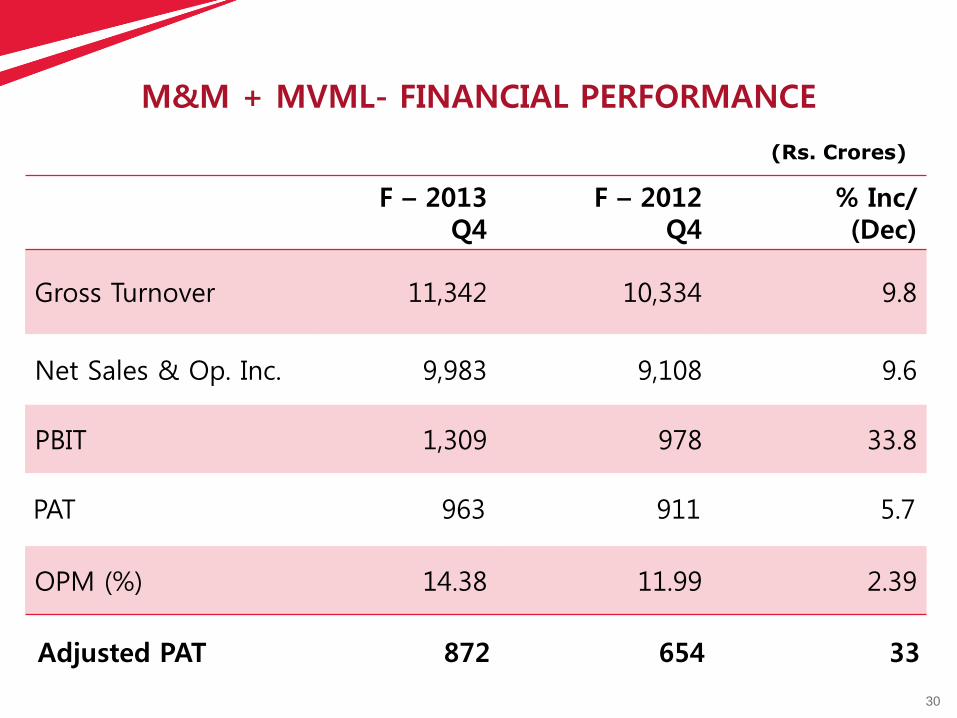
PAT 963 911 5.7
M&M + MVML- FINANCIAL PERFORMANCE
(Rs. Crores)
F – 2013 Q4
F – 2012 Q4
% Inc/ (Dec)
Gross Turnover 11,342 10,334 9.8
Net Sales & Op. Inc. 9,983 9,108 9.6
PBIT 1,309 978 33.8
OPM (%) 14.38 11.99 2.39
Adjusted PAT 872 654 33
31
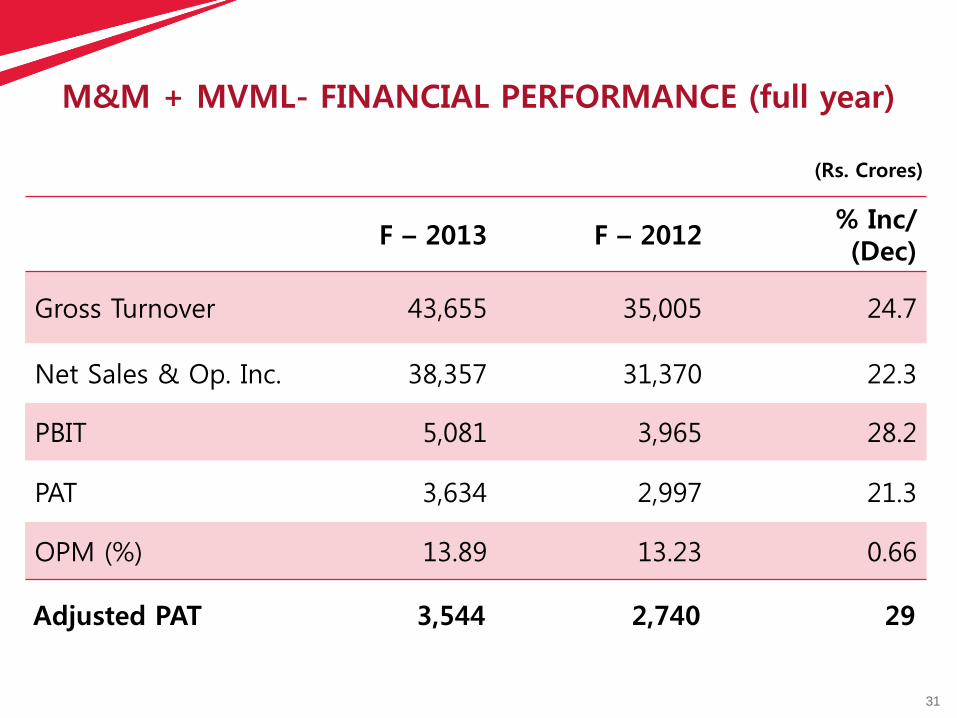
M&M + MVML- FINANCIAL PERFORMANCE (full year)
(Rs. Crores)
F – 2013 F – 2012 % Inc/ (Dec)
Gross Turnover 43,655 35,005 24.7
Net Sales & Op. Inc. 38,357 31,370 22.3
PBIT 5,081 3,965 28.2
OPM (%) 13.89 13.23 0.66
PAT 3,634 2,997 21.3
Adjusted PAT 3,544 2,740 29
32
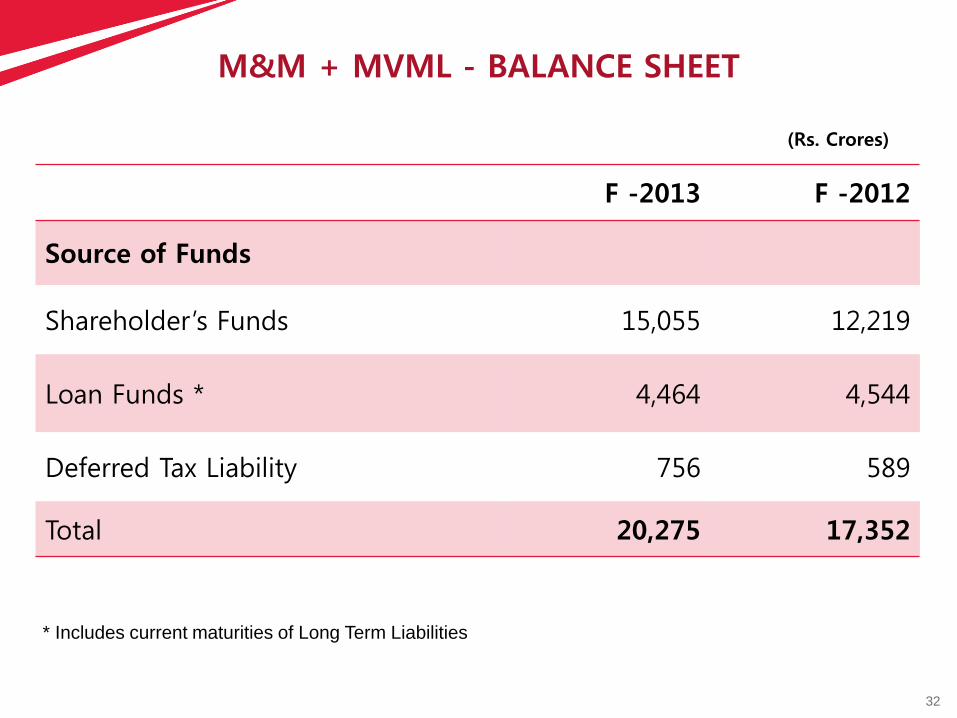
M&M + MVML - BALANCE SHEET
(Rs. Crores)
F -2013 F -2012
Source of Funds
Shareholder’s Funds 15,055 12,219
Loan Funds * 4,464 4,544
Deferred Tax Liability 756 589
Total 20,275 17,352
* Includes current maturities of Long Term Liabilities

33
M&M + MVML - BALANCE SHEET (Rs. Crores)
F -2013 F -2012
Application of Funds
Fixed Assets 7,747 6,889
Investments 10,894 9,474
Long Term Loans & Advances 2,562 1,734
Cash & Bank Balances 1,823 1,291
Proposed Dividend (891) (869)
Other Assets (Net) (1860) (1167)
Total 20,275 17,352

34
Key Ratios
Particulars F – 2013 F – 2012
OPM (%) 13.89 13.23
ROCE 26.79 24.95
Interest Coverage Ratio 16.08 14.11
Debt / Service Ratio 6.63 5.44
EPS (Basic) (Rs.) 61.63 50.98
Book Value (Rs.) 254.85 207.27

35

36
Rs. 4,099 crs
Rs. 3,127 crs
31%
Financial Highlights
Growth in Total income
Rs. 74,403 crs
Rs. 63,358 crs
17%
M&M Consolidated – FY 13 vs. FY 12
Rs. 7,449
Rs. 6,245
19%
Growth in EBIDTA Growth in PAT after MI
37
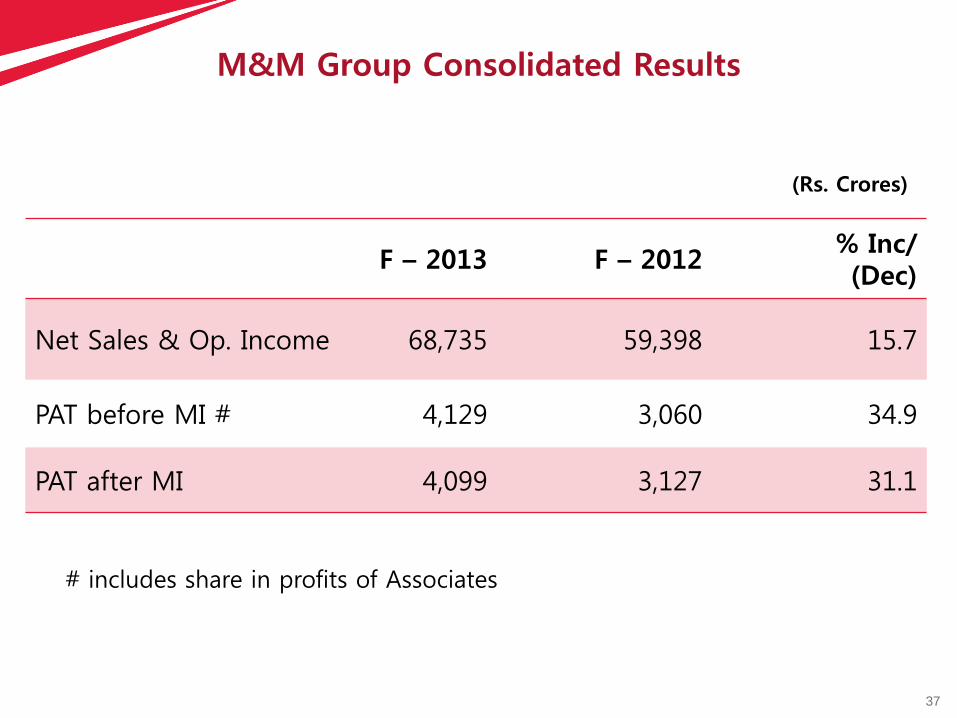
(Rs. Crores)
M&M Group Consolidated Results
# includes share in profits of Associates
F – 2013 F – 2012 % Inc/ (Dec)
Net Sales & Op. Income 68,735 59,398 15.7
PAT before MI # 4,129 3,060 34.9
PAT after MI 4,099 3,127 31.1

38
(Rs. Crores)
Subsidiary Company Results
# includes share in profits of Associates
F – 2013 F – 2012 % Inc/ (Dec)
Net Revenue 36,970 33,580 10%
PAT before MI # 389 132 195%
PAT after MI 359 199 80%

39
Group Companies – Top 4 PAT Earners
F13 – Rs.927 crs
F12 – Rs.644 crs
44%
MMFSL
F13 – Rs.91 crs
F12 – Rs. 102 crs
MHRIL
(11%)
F13 – Rs 141 crs
F12 –Rs 119 crs
18%
MLDL
F13 – Rs. 1,288 crs
F12 – Rs. 1,096 crs
18%
TML
On Consolidated basis.

40
Systech
Revenue
4,988
5%
5,249
FY 13
FY 12
Systech
Results
(44)
120%
226
FY 13
FY 12
STP *
Revenue
1,416
5%
1,486
STP *
Results
88
28%
123
IT Services
Revenue
1,464
50%
2,904
IT Services
Results
222
48%
425
Segment Details
* STP – Steel Trading & processing Segment Results is before Exceptional items
41
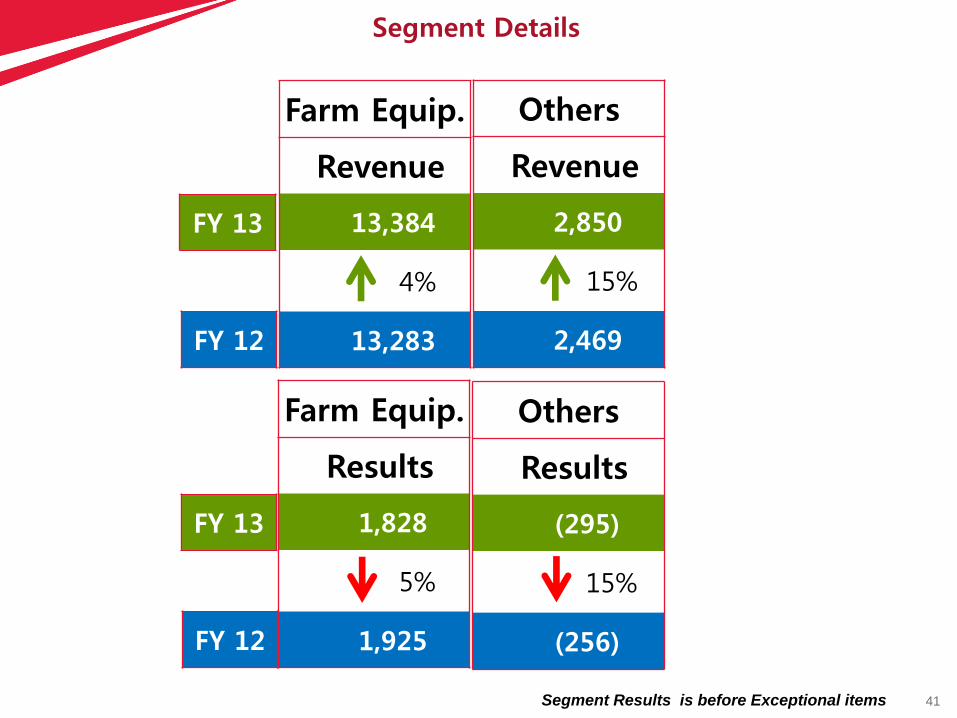
Farm Equip.
Revenue
13,384
4%
13,283
FY 13
FY 12
Farm Equip.
Results
1,828
5%
1,925
FY 13
FY 12
Others
Revenue
2,850
15%
2,469
Others
Results
(295)
15%
(256)
Segment Details
Segment Results is before Exceptional items

42
Automotive
Revenue
41,874
27%
32,838
FY 13
FY 12
Automotive
Results
2,330
101%
1,157
FY 13
FY 12
Fin. Services
Revenue
4,117
42%
2,901
Fin. Service
Results
1,284
35%
953
IDS
Revenue
754
5%
716
IDS
Results
243
23%
198
Hospitality
Revenue
727
13%
644
Hospitality
Results
141
7%
132
Segment Details
Segment Results is before Exceptional items

43
The woods are lovely, dark and deep, But I have promises to keep,
And miles to go before I sleep, And miles to go before I sleep
– Robert Frost
We’d love to have you with us on this exciting journey!

44
Disclaimer
Mahindra & Mahindra herein referred to as M&M, and its subsidiary companies provide a wide array of presentations and reports,
with the contributions of various professionals. These presentations and reports are for informational purposes and private circulation
only and do not constitute an offer to buy or sell any securities mentioned therein. They do not purport to be a complete description of
the markets conditions or developments referred to in the material. While utmost care has been taken in preparing the above, we
claim no responsibility for their accuracy. We shall not be liable for any direct or indirect losses arising from the use thereof and the
viewers are requested to use the information contained herein at their own risk. These presentations and reports should not be
reproduced, re-circulated, published in any media, website or otherwise, in any form or manner, in part or as a whole, without the
express consent in writing of M&M or its subsidiaries. Any unauthorized use, disclosure or public dissemination of information
contained herein is prohibited. Unless specifically noted, M&M or any of its subsidiary companies is not responsible for the content of
these presentations and/or the opinions of the presenters. Individual situations and local practices and standards may vary, so
viewers and others utilizing information contained within a presentation are free to adopt differing standards and approaches as they
see fit. You may not repackage or sell the presentation. Products and names mentioned in materials or presentations are the property
of their respective owners and the mention of them does not constitute an endorsement by M&M or its subsidiary companies.
Information contained in a presentation hosted or promoted by M&M is provided “as is” without warranty of any kind, either expressed
or implied, including any warranty of merchantability or fitness for a particular purpose. M&M or its subsidiary companies assume no
liability or responsibility for the contents of a presentation or the opinions expressed by the presenters. All expressions of opinion are
subject to change without notice.
Copyright © 2012 Mahindra & Mahindra Ltd. All rights reserved.
Thank you
Visit our website at www.mahindra.com