ANALYST BRIEFING 1Q18 PERFORMANCE RESULTS · Prof. Djoko Wintoro, PhD Commissioner (New Member)...
35
PT Indo Tambangraya Megah Tbk ANALYST BRIEFING 1Q18 PERFORMANCE RESULTS Jakarta, 16 May 2018
-
Upload
nguyenquynh -
Category
Documents
-
view
215 -
download
0
Transcript of ANALYST BRIEFING 1Q18 PERFORMANCE RESULTS · Prof. Djoko Wintoro, PhD Commissioner (New Member)...

PT Indo Tambangraya Megah Tbk
ANALYST BRIEFING 1Q18 PERFORMANCE RESULTS
Jakarta, 16 May 2018

2
1
2
3
4
INTRODUCTION
OPERATIONAL REVIEW
COMMERCIAL REVIEW
FINANCIAL REVIEW
5 QUESTION & ANSWERS
Agenda
3
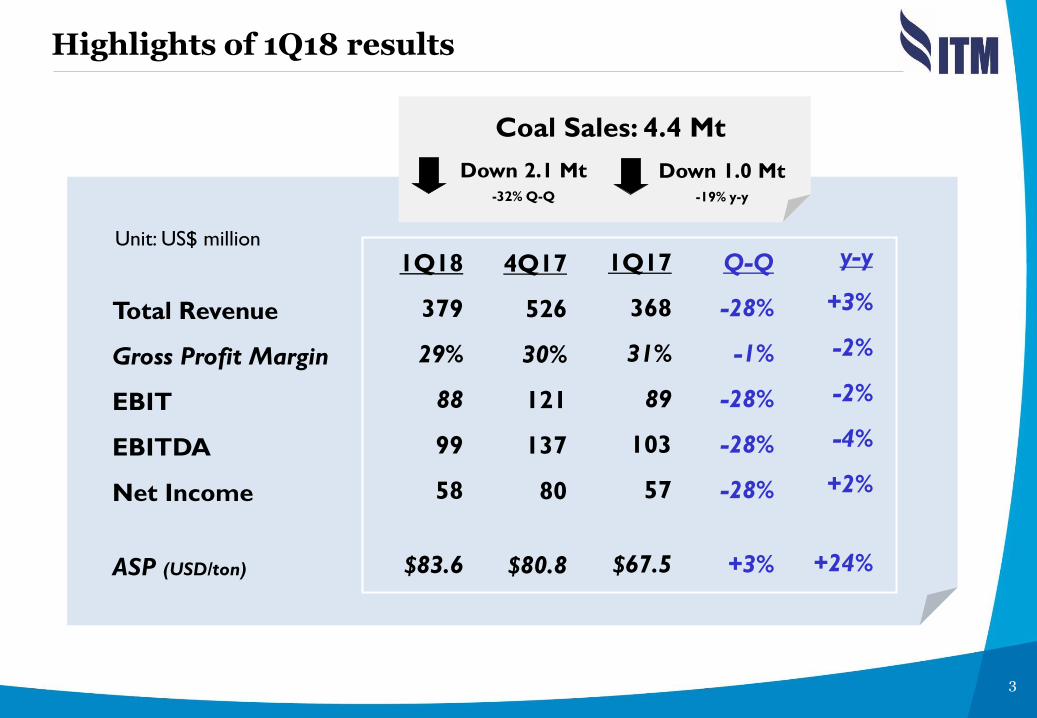
Highlights of 1Q18 results
Unit: US$ million
Total Revenue
Gross Profit Margin
EBIT
EBITDA
Net Income
ASP (USD/ton)
4Q17
526
30%
121
137
80
$80.8
Q-Q
-28%
-1%
-28%
-28%
-28%
+3%
y-y
+3%
-2%
-2%
-4%
+2%
+24%
1Q18
379
29%
88
99
58
$83.6
Coal Sales: 4.4 Mt
Down 2.1 Mt
-32% Q-Q
Down 1.0 Mt
-19% y-y
1Q17
368
31%
89
103
57
$67.5

4
Highlight of 1Q15
Annual General Meeting of Shareholders conducted on 23 Mar 2018 declared total final dividend of USD 252 Mln or 100% of the Company’s 2017 Net Profit after tax, which payment are as follows: In the amount of USD 105 Mln or
equal to IDR 1,300 per share has been distributed as interim dividend on 21 Nov 2017
The remaining amount of USD 147 Mln or equivalent to IDR 1,840 per share was paid on 20 Apr 2018
BOARD OF COMMISIONERS ANNUAL GENERAL MEETING OF SHAREHOLDERS
Highlights of 1Q18
BOARD OF DIRECTORS
Somruedee Chaimongkol
Commissioner Rudijanto Boentoro
Commissioner
Prof. Djisman Simandjuntak
President Commissioner &
Independent
Mahyudin Lubis
Commissioner
Fredi Chandra
Commissioner
Yulius K.Gozali
Director
Kirana Limpaphayom
President Director A.H Bramantya Putra
Director
Jusnan Ruslan
Director Stephanus Demo Wawin
Director
Mulianto
Director
Ignatius Wurwanto
Director
Padungsak Thanakij
Director (New Member)
Prof. Djoko Wintoro, PhD
Commissioner (New Member)
Somsak Sithinamsuwan
Commissioner (New Member)

Synergy: coal business focus
HARD SYNERGY (INPUTS) SOFT SYNERGY (SKILLS)
WIT
HIN
BU
SIN
ESS
UN
IT
AC
RO
SS B
USI
NESS
UN
IT
CONTRACT MINING
Supply diesel for ITM internal use
In-house contract mining at ITM
ESCM
Target 30% of ITM’s OB
removal volume
Target fuel cost reduction by $3/bbl
COAL MINING
Cross-fertilization of UG mining expertise
Development of UG mining at Indonesian
operations
ARBITRAGE
Sharing of market insights and mechanism
[Enhance competitiveness and
add value]
POWER
Sharing of coal mining expertise
Improve coal productivity
COAL MARKETING
Secure third party coal for blending and trading
Enable quality upgrade and enhance pricing
through blending
SY
NER
GY
R
ESU
LT
S
SY
NER
GY
R
ESU
LT
S
ITM-BPP
Sharing of power operational expertise
Develop renewable energy at several locations
COAL MINING
Additional margins from other business
Optionality for reserves optimization
OPERATIONAL DEVELOPMENT 5
6
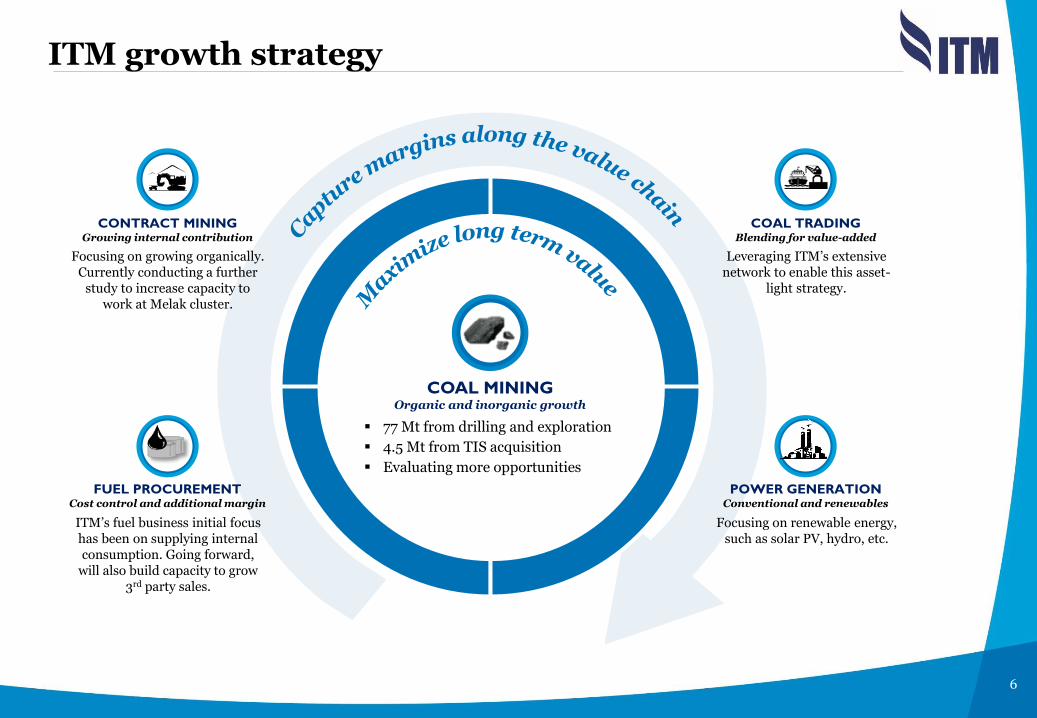
ITM growth strategy
COAL MINING Organic and inorganic growth
POWER GENERATION Conventional and renewables
FUEL PROCUREMENT Cost control and additional margin
CONTRACT MINING Growing internal contribution
COAL TRADING Blending for value-added
Focusing on growing organically. Currently conducting a further
study to increase capacity to work at Melak cluster.
Leveraging ITM’s extensive network to enable this asset-
light strategy.
Focusing on renewable energy, such as solar PV, hydro, etc.
ITM’s fuel business initial focus has been on supplying internal consumption. Going forward,
will also build capacity to grow 3rd party sales.
77 Mt from drilling and exploration
4.5 Mt from TIS acquisition
Evaluating more opportunities

7
Optimization
Organic growth provides additional reserves at a relatively attractive price
• Current reported reserves/resources are based on current exploration
• Does not include potential reserves, which could be proven by doing more exploration
• More exploration can confirm and identify more resources/reserves
• Also increases optionality to convert more resources into reserves
• $7-8 M p.a. drilling and exploration capex
• Options to increase reserves with updated economics, technology
• Productivity, efficiency, and additional margins along the value chain would also lead to better economics and in turn, more reserves
Drilling boundary
77 Mt additional reserves
OB
Optimization
Exploration
SIMPLIFIED AND ILLUSTRATIVE

8
1
2
3
4
INTRODUCTION
OPERATIONAL REVIEW
COMMERCIAL REVIEW
FINANCIAL REVIEW
5 QUESTION & ANSWERS
Agenda

9
East Kalimantan
Bunyut Port
Balikpapan
Palangkaraya
Banjarmasin
Central Kalimantan
South Kalimantan
Samarinda
Jorong Port
INDOMINCO 13.1 Mt
TD.MAYANG TRUBAINDO
4.6 Mt
BHARINTO 2.7 Mt
KITADIN EMBALUT 1.0 Mt
JORONG 1.1 Mt
Operational summary 2018
2018 TARGET : 22.5 Mt
2014 2015 2016 2017 2018e
Unit: Mt
Indominco
Trubaindo
Bharinto
Kitadin Jorong
2016 2014 2015
YEARLY OUTPUT TREND
2017
29.1 28.5 25.6
22.1
2018e
22.5
2Q17 3Q17 4Q17 1Q18 2Q18e
Unit: Mt
Indominco
Trubaindo
Bharinto
Kitadin Jorong
QUARTERLY OUTPUT TREND
3Q17 2Q17 4Q17 1Q18
5.0 5.7
6.0
4.4
5.1
2Q18e
10
East Block
Santan River
Port stock yard
Bontang City
Asphalt haul
road
2.5Km
35Km
Sea conveyor
Mine
stockyard
Inland
conveyor 4km
0 10 6 8 2 km 4
West Block
Operations
Stockpile
Ports
Hauling
Crusher ROM
stockpile
Post
Panamax
95,000
DWT
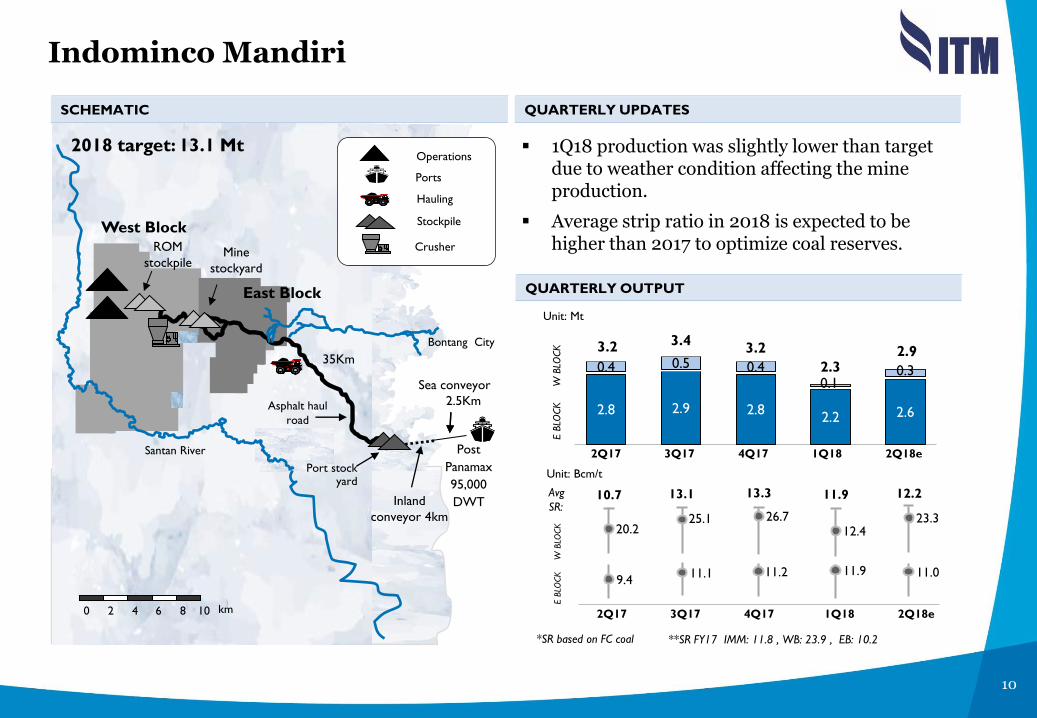
1Q18 production was slightly lower than target due to weather condition affecting the mine production.
Average strip ratio in 2018 is expected to be higher than 2017 to optimize coal reserves.
SCHEMATIC QUARTERLY UPDATES
QUARTERLY OUTPUT
2018 target: 13.1 Mt
E B
LOCK
W
BLO
CK
E B
LOCK
W
BLO
CK
Unit: Mt
Unit: Bcm/t
Avg
SR:
2Q17 3Q17 4Q17 1Q18 2Q18e
**SR FY17 IMM: 11.8 , WB: 23.9 , EB: 10.2
2.8 2.9 2.8 2.2 2.6
0.4 0.5 0.4 0.1
0.3
3.2 3.4 3.2
2.3 2.9
2Q17 3Q17 4Q17 1Q18 2Q18e
*SR based on FC coal
20.2
9.4
10.7
25.1
11.1
13.1
26.7
11.2
13.3
12.4
11.9
11.9
Indominco Mandiri
23.3
11.0
12.2

11
Mahakam
River
South Block 1
(Dayak Besar)
North
Block
40km
Mine to port
ROM
stockpile
Bunyut
Port
0 10 25 15 20 5 km
Product coal conveyor,
stacking,
stockpile
East Kalimantan
Bharinto 60km
south west of
Trubaindo North
Block
South Block 2
(Biangan)
PT. Bharinto
PT. Trubaindo
Operations
Stockpile
Hauling
Barge Port
Trubaindo:
1Q18 production output slightly above than target.
Continue hauling road improvement program from Trubaindo to Bharinto area, expected to be completed by mid of 2018.
Bharinto:
1Q18 production was close to target despite weather condition affecting mine production.
Melak group – Trubaindo and Bharinto
SCHEMATIC QUARTERLY UPDATES
2018 target: TCM 4.6 Mt
BEK 2.7 Mt
TRUBAINDO
TRUBAINDO
BHARINTO
Unit: Mt
Unit: Bcm/t
BHARINTO
2Q17 3Q17 4Q17 1Q18 2Q18e
**SR FY17 TCM: 10.9 , BEK: 8.6
2Q17 3Q17 4Q17 1Q18 2Q18e
*SR based on FC coal
1.0 1.3 1.5 1.0 1.0
0.5 0.6 0.6
0.5 0.7
1.5 1.9 2.1
1.5 1.7
QUARTERLY OUTPUT
Avg SR:
9.7
7.8
15.3
8.3
9.4
12.2
Kedangpahu
River
12.6
10.6
12.9
10.5

12
Balikpapan
Mahakam River
Samarinda to Muara
Berau
Bontang city
Embalut
Embalut Port
to Muara Jawa
ROM
stockpile
Operations
Stockpile
Ports
Hauling
Crusher 0 10 6 8 2 km 4
5km Mine to port
TD. Mayang
East Kalimantan
IMM EB IMM WB
Bontang Port
Kitadin Embalut and Tandung Mayang
SCHEMATIC
2018 target: EMB 1.0 Mt Kitadin Embalut:
1Q18 production achieved according to target
Further study to optimize coal reserves
Kitadin Td.Mayang:
Continue mine closure activities including mine rehabilitation.
0.2 0.3 0.3 0.2 0.2
TD
M
EM
B
Unit: Mt
Unit: Bcm/t
**SR FY17 EMB: 12.2
2Q17 3Q17 4Q17 1Q18 2Q18e
2Q17 3Q17 4Q17 1Q18 2Q18e
*SR based on FC coal
QUARTERLY UPDATES
QUARTERLY OUTPUT
EM
B
Avg SR:
16.5
11.3 10.4 11.9 13.0
13
0.2 0.2 0.3 0.3 0.3
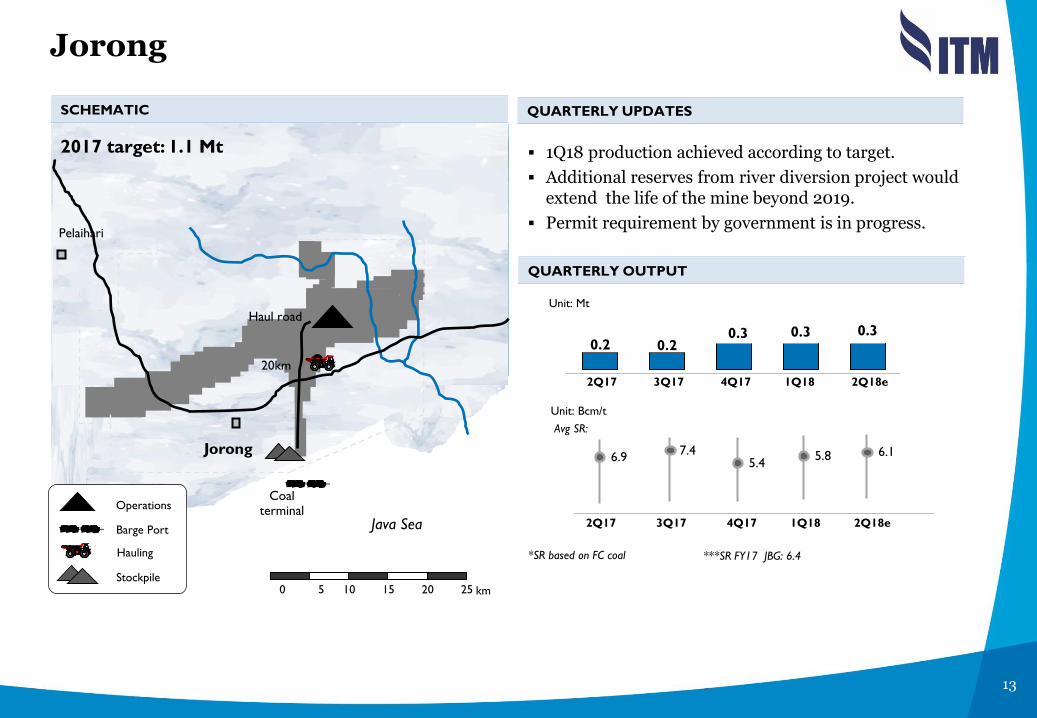
Coal terminal
Jorong
Java Sea
Haul road
0 10 25 15 20 5 km
20km
Operations
Stockpile
Hauling
Barge Port
Pelaihari
Jorong
SCHEMATIC
2017 target: 1.1 Mt
Unit: Mt
Unit: Bcm/t
2Q17 3Q17 4Q17 1Q18 2Q18e
2Q17 3Q17 4Q17 1Q18 2Q18e
***SR FY17 JBG: 6.4 *SR based on FC coal
QUARTERLY UPDATES
QUARTERLY OUTPUT
Avg SR:
6.9 7.4
5.4
1Q18 production achieved according to target.
Additional reserves from river diversion project would extend the life of the mine beyond 2019.
Permit requirement by government is in progress.
5.8 6.1

14
1
2
3
4
INTRODUCTION
OPERATIONAL REVIEW
COMMERCIAL REVIEW
FINANCIAL REVIEW
5 QUESTION & ANSWERS
Agenda

GEOGRAPHY CHANGE
2018-17 (Mt.) COMMENTS
OTHERS
CHINA
EUROPE
OTHER
N.ASIA
INDIA
Note: Includes lignite but excludes anthracite
Global demand trends: 2018 vs 2017
GLOBAL
Greater renewables output, low gas prices and higher nuclear availability are
expected to depress coal burn.
Turkey plans to commence 1.32GW coal-fired power plants this year
South East Asia and Pakistan drive demand growth on addition of new coal-
fired power plants
Although China is seeking to reduce thermal coal imports this year to meet 2020 goals,
based on year-to-date import rates, a year-on-year reduction will be difficult while trying to
keep price within a healthy range at the same time. While demand growth from other
developing economies will offset China declines.
South Korea shut down 2.32GW old coal units during Mar-Jun but coal burn is likely
to remain comparatively high following the addition of six coal-fired units last year.
Coal-fired capacity additions and nuclear restrictions helps to boost coal burn in
Taiwan
+17
-5
+3
+7
-10
+12
Winter demand and tight domestic supply boosted import in 1Q18
Domestic coal prices fell sharply after Chinese New Year after end winter season and
improving supply
Import restriction has been introduced in April to support domestic coal prices.
Strong demand due to improvement in domestic economy.
Domestic supply shortfall persist in 1Q18 resulted in stronger import
15

Domestic price cap at $70/t will encourage producers to export more coal
Slow global demand growth will limit Indonesian export
S.AFRICA
INDONESIA
RUSSIA
COLOMBIA
Bad weather and maintenance limited supply growth in Q1-2018
AUSTRALIA
Increasing competition from other suppliers
Increasing domestic demand
Weak domestic coal demand due to competition with natural gas
US producers will be forced to divert more coal to exports
GLOBAL
+1
+7
+2
+3
-1
+3
-1
+14
USA
OTHERS
Weak European demand will force Colombian producers to seek alternative
buyers.
Colombian coal is competitive for delivery to Asia
Russian coal still competitive in Asia
We expect sufficient near-term supply to meet 2018 demand. Suppliers in all
exporting countries are expecting to see their export rise this year but some
are going to be disappointed.
GEOGRAPHY CHANGE
2018-17(Mt.) COMMENTS
Global supply trends: 2018 vs 2017
Exports from Poland and other European countries are expected to decline
16

Note: * includes lignite but excludes anthracite imports/exports
Source: www.sxcoal.com/cn 10 April 2018
CHINA THERMAL COAL IMPORTS/EXPORTS*
Unit: Mt 1Q18
Supply tightness continued in Jan-Feb 2018 due to winter demand and slow supply recovery resulted in coal prices surged.
Chinese government capped QHD FOB 5500 NAR at RMB750/t from 5 Feb 2018.
Domestic coal prices fell sharply in March due to improving supply and weakening demand as winter ended.
In late March, China import curbs change price direction
Outlook
Domestic coal production is improving but demand also growing.
Further import restrictions will subject to coal price whether it’s within China’s preferred range (RMB500-570/t) or not.
We expect thermal coal import to remain relatively strong.
China also continues to cause significant regulatory uncertainty.
China: enter weak demand season
QUARTERLY (ANNUALIZED) ANNUAL
IMPO
RT
EX
PO
RT
132 139 122 123 153
194 210 172 189 196 189
245
2
4Q15
3 5
1Q16 2Q16
6
3Q16
0 2
133
3Q14
5 1
3Q15 2Q15 1Q15
1
4Q14
170 187 177
2016e
4
201
4
4
201
5
4
2016 2017 2018E 1Q15 2Q15 3Q15 4Q15 1Q16 2Q16 3Q16 4Q16 1Q17 2Q17 3Q17 4Q17 1Q18
2 3 1 3
Sources: Banpu MS&L
200
300
400
500
600
700
800
2014 2015 2016 2017
> 5,800 kcal/kg
> 5,500 kcal/kg
> 5,000 kcal/kg
636 612 545
CHINA DOMESTIC COAL PRICES
Unit: RMB/t
17

Note: * includes lignite grade imports Sources:: Commodity Insights, Banpu MS&L
INDIA THERMAL COAL IMPORTS*
Unit: Mt
1Q18
Coal demand is growing due to improvement in the domestic economy.
Domestic supply shortfall and rail capacity constraints led to Southern and Western power plants scouting out for imported thermal coal.
Some plants in Western India preferred shutting down as the costs of shutting down was lower than to continue to operate.
– 10.9 GW was idled at the end of March, out of which about 5.5 GW are designed to use imported coal.
Price volatility of imported coal in international market as well as the price differential between domestic coal, e-auction coal and imports is likely to govern the demand for coal imports.
Outlook
Domestic coal supplies are expected to fall short of production targets again in 2018 and there is potential to increase imports.
India: growing economy, increase electricity demand
QUARTERLY (ANNUALIZED) ANNUAL
171 180
142
161 149
171
128 131 122
151
123
149 145
2Q16 1Q16 2Q17 3Q16 4Q16 1Q18 1Q17 4Q15 3Q15 1Q15 2Q15
145 137
144
2018E 2017 2016 3Q17 4Q17
18

19
China
16%
Japan
20%
Philippines
12%
India
10%
Vietnam
Indonesia
11%
6%
4%
3%
3%
JAPAN
PHILIPPINES
THAILAND INDIA
KOREA
CHINA
TAIWAN
ITALY
1.5
INDONESIA
OTHERS*
Taiwan
Korea
6%
Italy
Others
ITM coal sales 1Q18
COAL SALES 1Q18 COAL SALES BREAKDOWN BY DESTINATION
Total Coal Sales 1Q18: 4.4 Mt
*) Note: Bangladesh, New Zealand
Hongkong
5%
HK
0.1 Mt
0.2 Mt
0.3 Mt 0.4 Mt
0.7 Mt
0.2 Mt
0.3 Mt
0.9 Mt
0.1 Mt
0.5 Mt
0.5 Mt
Thailand
3%
VIETNAM
0.2 Mt

20
30%
3%
36%
31%
TARGET SALES 2018: 25.0 Mt
Contract Status Price Status
Contracted
Indicative coal sales 2018
COAL SALES CONTRACT AND PRICING STATUS
69%
31% Fixed
Indexed
Unsold
Uncontracted
Contracted Unpriced

30
50
70
90
110
130
Note: * Included post shipment price adjustments as well as traded coal
** The Newcastle Export Index (previously known as the Barlow Jonker Index – BJI)
1Q18 ASP continued firm according to supply
tightness.
– ITM ASP: US$83.6/t* (+3% QoQ)
– NEX (Apr 27, 2018)**: US$95.1/t
Market remained strong in 1Q18 with a
bullish sentiment during Jan-Feb, then eased
to its fundamental level in late March.
Supply tightness expected to soften in 2Q18
as market is moving to low demand season.
Chinese policy remains a major influence.
Unit: US$/ton
ITM ASPs vs thermal coal benchmark prices
ITM ASP VS BENCHMARK PRICES COMMENTS
Monthly NEX
Quarterly ITM ASP
US$83.6/t
US$95.1/t
0
50
100
150
200
2007
2008
2009
2010
2011
2012
2013
2014
2015
2016
2017
Monthly NEX
21

22
1
2
3
4
INTRODUCTION
OPERATIONAL REVIEW
COMMERCIAL REVIEW
FINANCIAL REVIEW
5 QUESTION & ANSWERS
Agenda

23
Unit: US$ million
Sales revenue
237 267
221
123
210
117
48
90
61
11
23
16 11
13
15
1Q17 4Q17 1Q18
368
526
378
Jorong
Kitadin
Bharinto
Trubaindo
Indominco
Note : Total consolidated revenue after elimination
-28% QoQ
+3% YoY
Indominco
-17% (QoQ) ; -7%(YoY)
Trubaindo
-44% (QoQ) ; -5% (YoY)
Bharinto -32% (QoQ) ; +26% (YoY)
Kitadin -29% (QoQ) ; +50% (YoY)
Jorong
+18% (QoQ) ; +44% (YoY)

24
Average gross margin
1Q17 4Q17 1Q18
16
28% 44% 42%
Kitadin
11
23
1Q17 4Q17 1Q18
Bharinto
90
61
26% 31%
48
31%
1Q17 4Q17 1Q181Q17 4Q17 1Q18
Indominco
22% 27% 20%
221
267
237
1Q17 4Q17 1Q18
28%
25% 31%
117
Trubaindo
123
210
1Q17 4Q17 1Q18
29%
30%
31%
378
ITM Consolidated
368
526 Unit : US$ Million
GPM* (%)
Revenue
* Gross profit after royalty expense
Jorong
28% 18%
11 13 15
11%

25
1Q17 2Q17 3Q17 4Q17 1Q18
Unit: US$/Ltr
1Q17 2Q17 3Q17 4Q17 1Q18
Unit: Bcm/t
Avg. FY16: $0.42/ltr
Avg. FY17: $0.53/ltr
Unit: US$/t Avg. FY16: $43.8/t
Avg. FY17: $56.4/t
1Q17 2Q17 3Q17 4Q17 1Q18
Cost Analysis
WEIGHTED AVERAGE STRIP RATIO
FUEL PRICE TOTAL COST**
9.4
1Q17 2Q17 3Q17 4Q17 1Q18
Unit: US$/t Avg. FY16: $32.1/t
Avg. FY17: $41.6/t
COST OF GOODS SOLD*
* Excluding royalty and fuel business
** Cost of Goods Sold + Royalty + SG&A (Exc. Fuel business)
10.1
0.54
37.8
51.6
12.9
0.51
56.3
42.2
0.50
11.7
Avg. FY16 : 8.1
Avg. FY17 : 11.1
40.6
55.0
11.4 45.0
0.57
61.8 0.64
47.8
64.3

26
EBITDA
Unit: US$ million
1Q17 4Q17 1Q18
99
42
32
16
7
-28% QoQ
Jorong
Kitadin
Bharinto
Trubaindo
Indominco
-4% YoY
Indominco -23% (QoQ) ; -29%(YoY)
Trubaindo
-33% (QoQ) ; +21% (YoY)
1
Bharinto -16% (QoQ) ; +30% (YoY)
Kitadin -23% (QoQ) ; +200% (YoY)
Jorong -47% (QoQ) ; n.m (YoY)
137
55
48
19
9 2
103
60
27
12 2
0.2

27
Net income
Jorong
Kitadin
Bharinto
Trubaindo
Indominco
Indominco
-27% (QoQ) ; -26%(YoY)
Trubaindo
-34% (QoQ) ; +1% (YoY)
Bharinto
-15% (QoQ) ; +36% (YoY)
Kitadin
-28%(QoQ) ; -180% (YoY)
Jorong
-76% (QoQ) ; -226% (YoY)
1Q17 4Q17 1Q18
Unit: US$ million
58
27
19
11
-28% QoQ
+2% YoY
37
30
13
6 3
4
37
19
8
(5) (0.5)
81
1 57

28
Net Gearing (%)
Net D/E (times)
Unit: US$ million
2015 2014
226 268
Unit: US$ million
0
2014
0 0
2015 2016
0
2017
0
1Q18
2016
328
Balance sheet
KEY RATIOS CASH POSITION
DEBT POSITION
2015
(0.32)
(32%)
2014
(0.26)
(26%)
(0.36)
(36%)
2016
(0.39)
(39%)
2017 2017
374
(0.49)
(49%)
1Q18 1018
424

29
2018 capital expenditure plan
Note: Total capex plan including Jakarta office after elimination
Units: US$ million
1.1
Realized up to Mar 2018
2018 Capex plan
16.0
20.8
22.7
107.1
8.0
3.1
0.2
5.9
0.1
40.0
3.3
Indominco
Trubaindo
Bharinto
Jorong
TRUST
ITM Consolidated

30
1Q18 – key takeaways
6.3
4.4 Mt sales 1Q18 – in line with the target
Rainfalls still higher in 1Q18 in mine area
Financial performance in 1Q18 remain strong
Strip ratio in 2018 is expected to be higher due to optimized coal
reserve
Improved 1Q18 ASP $83.6/t, +3% (QoQ)
and +24% (YoY)
Dividend declaration – final dividend
IDR 1,840/share and full year 2017 IDR 3,140/share

31
Thank you Question & Answer

32
Appendices
33
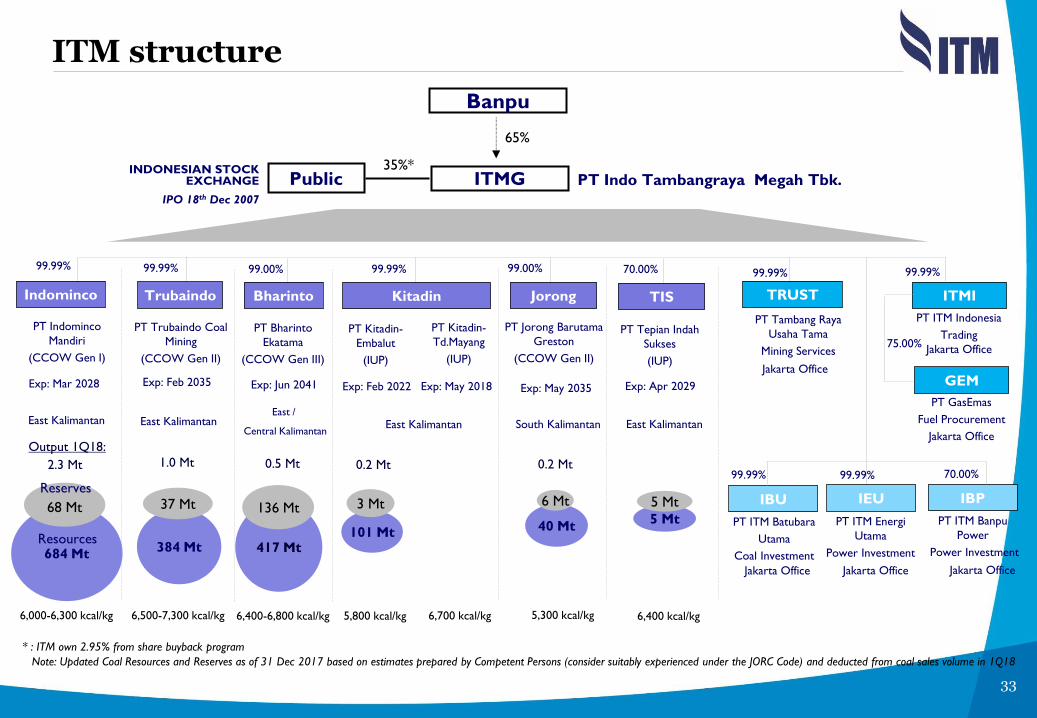
ITM structure
ITMG
65%
PT Indominco
Mandiri
(CCOW Gen I)
PT Trubaindo Coal
Mining
(CCOW Gen II)
PT Kitadin-
Embalut
(IUP)
PT Jorong Barutama
Greston
(CCOW Gen II)
PT Indo Tambangraya Megah Tbk.
99.99% 99.99% 99.99% 99.00%
Banpu
Public 35%*
PT Kitadin-
Td.Mayang
(IUP)
East Kalimantan East Kalimantan South Kalimantan
INDONESIAN STOCK EXCHANGE
IPO 18th Dec 2007
6,500-7,300 kcal/kg 6,000-6,300 kcal/kg 5,800 kcal/kg 6,700 kcal/kg 5,300 kcal/kg
1.0 Mt 0.2 Mt 0.2 Mt
PT Bharinto
Ekatama
(CCOW Gen III)
99.00%
East /
Central Kalimantan
6,400-6,800 kcal/kg
0.5 Mt
East Kalimantan
684 Mt
68 Mt
Resources
Reserves
384 Mt
37 Mt
101 Mt
3 Mt
417 Mt
136 Mt
40 Mt
99.99%
Jakarta Office
PT Tambang Raya
Usaha Tama
Mining Services
99.99%
Jakarta Office
PT ITM Indonesia
Trading
Exp: Mar 2028 Exp: Feb 2035 Exp: May 2035 Exp: May 2018 Exp: Jun 2041 Exp: Feb 2022
PT ITM Energi
Utama
Power Investment
PT ITM Batubara
Utama
Coal Investment
99.99% 99.99%
Jakarta Office Jakarta Office
6 Mt
TRUST Indominco Trubaindo Kitadin Bharinto Jorong
IEU IBU
Note: Updated Coal Resources and Reserves as of 31 Dec 2017 based on estimates prepared by Competent Persons (consider suitably experienced under the JORC Code) and deducted from coal sales volume in 1Q18
* : ITM own 2.95% from share buyback program
PT ITM Banpu
Power
Power Investment
70.00%
Jakarta Office
IBP
2.3 Mt
ITMI
GEM
PT GasEmas
Fuel Procurement
Jakarta Office
75.00%
Output 1Q18:
PT Tepian Indah
Sukses
(IUP)
70.00%
East Kalimantan
6,400 kcal/kg
5 Mt
Exp: Apr 2029
5 Mt
TIS

34
Income statement
Unit: US$ thousand 1Q18 4Q17 1Q17 QoQ% YoY%
Net Sales 378,247 525,712 367,874 -28% 3%
Gross Profit 111,053 158,567 114,945 -30% -3%
GPM 29% 30% 31%
SG&A (23,350) (37,580) (25,773)
EBIT 87,703 120,987 89,172 -28% -2%
EBIT Margin 23% 23% 24%
EBITDA 99,486 137,233 103,204 -28% -4%
EBITDA Margin 26% 26% 28%
Net Interest Income / (Expenses) 822 544 665
Derivative Gain / (Loss) (104) 2 4,033
Others (5,842) (9,669) (5,537)
Profit Before Tax 82,579 111,864 88,333 -26% -7%
Income Tax (24,482) (31,369) (31,158)
Net Income 58,097 80,495 57,175 -28% 2%
Net Income Margin 15% 15% 16%

35
Unit: Millimeter Unit: Millimeter
Unit: Millimeter Unit: Millimeter
2013-17 average rainfall 2018 rainfall 2013-17 rainfall range
Except for Melak cluster (i.e. Trubaindo and Bharinto), rainfall has been above 5-year average this year
Rainfall(s) in February 2018 were exceptionally high; At Indominco it was even the highest in 5 years
Rainfall 2013-2018
INDOMINCO TRUBAINDO & BHARINTO
EMBALUT JORONG
0
100
200
300
400
500
600
700
1 2 3 4 5 6 7 8 9 10 11 12
0
100
200
300
400
500
600
700
1 2 3 4 5 6 7 8 9 10 11 12
0
100
200
300
400
500
600
700
1 2 3 4 5 6 7 8 9 10 11 12
0
100
200
300
400
500
600
700
1 2 3 4 5 6 7 8 9 10 11 12