Analyst and Investor Briefing on - yamaha.com · -Guitar sales grew by double digits, and digital...
48
Yamaha Corporation Analyst and Investor Briefing on FY2018.3 (Fiscal year ended March 31,2018) May 2, 2018
Transcript of Analyst and Investor Briefing on - yamaha.com · -Guitar sales grew by double digits, and digital...

Yamaha Corporation
Analyst and Investor Briefing on
FY2018.3 (Fiscal year ended March 31,2018)
May 2, 2018

1
FY2018.3 Highlights
Overview
Updates on our Mid-term Plan
FY2018.3 Achievements • Sales and income both rose year-on-year. Operating income and net income
reached record levels. • Sales and income were higher than the previous year in all business segments.
FY2019.3 Outlook
・ Expect to achieve higher sales and income in the musical instrument and audio
equipment segments, and fulfill medium-term management plan targets of 12% operating income ratio and ¥55.0 billion in operating income.
• Achieved operating income ratio of 11.3% in the second year of our medium-term plan, and expected to exceed the final target of 12%.
• Achieved higher ROE and EPS (earnings per share) compared to our medium-term plan targets.
• Carried out strategic investment (Construction of Innovation Center and two new factories in India and Indonesia).

2
Contents
1. Performance Summary
2. Segment Overview & Updates
4. Other Financial Figures
3. ESG Topics
5. Return on Shareholders

1. Performance Summary
3

FY2019.3 Outlook FY2018.3 Performance Key Management Figures
4
FY2018.3 Summary
FY2017.3 FY2018.3 Change (YoY)
YoY(%)
Previous projections
for FY2018.3
Net Sales 408.2 433.0 +24.7 +6.1% 432.0
Operating Income
(Operating Income Ratio)
44.3 (10.9%)
48.8 (11.3%)
+4.5 +10.2% 50.0 (11.6%)
Ordinary Income
44.9 49.2 +4.3 +9.6% 50.0
Net Income*1 46.7 54.4 +7.7 +16.4% 57.0
Net Sales (Average rate
during the period)
US$ 108 111 110
EUR 119 130 129
Operating Income
(Settlement rate)
US$ 108 111 110
EUR 121 126 126
Exchange Rate (yen)
*1 Net income is presented as net income attributable to owners of parent on the consolidate financial statements
(billions of yen)
+2.4% (Excluding the impact of exchange rate)
*2
*2

FY2019.3 Outlook FY2018.3 Performance Key Management Figures
44.3
48.8
-1.3
-3.6 -1.5 4.0
4.9
2.0
FY2017.3 FY2018.3
Increase in labor cost at
overseas factories
Actual increase in
SG&A Others
Impact of exchange
rates
Actual increase in sales and
production, product mix,
etc.
Cost reduction
5
Operating Income Analysis (billions of yen)
Versus previous year
50.0
48.8
-0.1 -0.2
-1.0 0.1
FY2018.3
(previous projections)
FY2018.3
Increase in labor cost at
overseas factories
Actual increase in
SG&A
Others Impact of exchange
rates
Versus previous projections

FY2019.3 Outlook FY2018.3 Performance Key Management Figures
6
Performance by Business Segment (billions of yen)
FY2017.3 FY2018.3 Change (YoY)
Exchange rate
impact
Musical Instruments
Net Sales 257.7 274.5 +16.8 +9.7
Operating Income
32.1 34.6 +2.5 +2.8
Operating Income Ratio
12.5% 12.6% +0.1P
Audio Equipment
Net Sales 115.5 121.8 +6.3 +4.9
Operating Income
10.4 10.7 +0.3 +1.2
Operating Income Ratio
9.0% 8.8% -0.2P
Others
Net Sales 35.1 36.7 +1.6 +0.2
Operating Income
1.7 3.5 +1.8 0.0
Operating Income Ratio
4.9% 9.5% +4.6P

FY2019.3 Outlook Key Management
Figures FY2018.3 Performance
7
FY2019.3 Outlook
FY2018.3 FY2019.3 (projections)
Change (YoY)
YoY(%)
Net Sales 433.0 442.0 +9.0 +2.1%
Operating Income (Operating Income
Ratio)
48.8 (11.3%)
55.0 (12.4%)
+6.2 +12.6%
Ordinary Income 49.2 55.0 +5.8 +11.7%
Net Income*1 54.4 40.0 -14.4 -26.4%
Net Sales (Average rate during
the period)
US$ 111 105
EUR 130 125
Operating Income
(Settlement rate)
US$ 111 105
EUR 126 125
*1 Net income is presented as net income attributable to owners of parent on the consolidate financial statements
(billions of yen)
Exchange Rate (yen) +4.3% (Excluding the impact of exchange rate)
*2
*2

FY2019.3 Outlook Key Management
Figures FY2018.3 Performance
8
Outlook on Operating Income Analysis (billions of yen)
48.8
55.0
-1.2 -1.7
-5.3
9.2
3.7
1.5
FY2018.3 FY2019.3
(projections)
Versus previous year
Increase in labor cost at
overseas factories
Actual increase in SG&A
Others
Impact of
exchange rates
Actual increase in sales and
production, product mix, etc.
Cost reduction
FY2019.3 Outlook Key Management
Figures FY2018.3 Performance
FY2018.3 FY2019.3
(projections) Change (YoY)
Exchange rate
impact
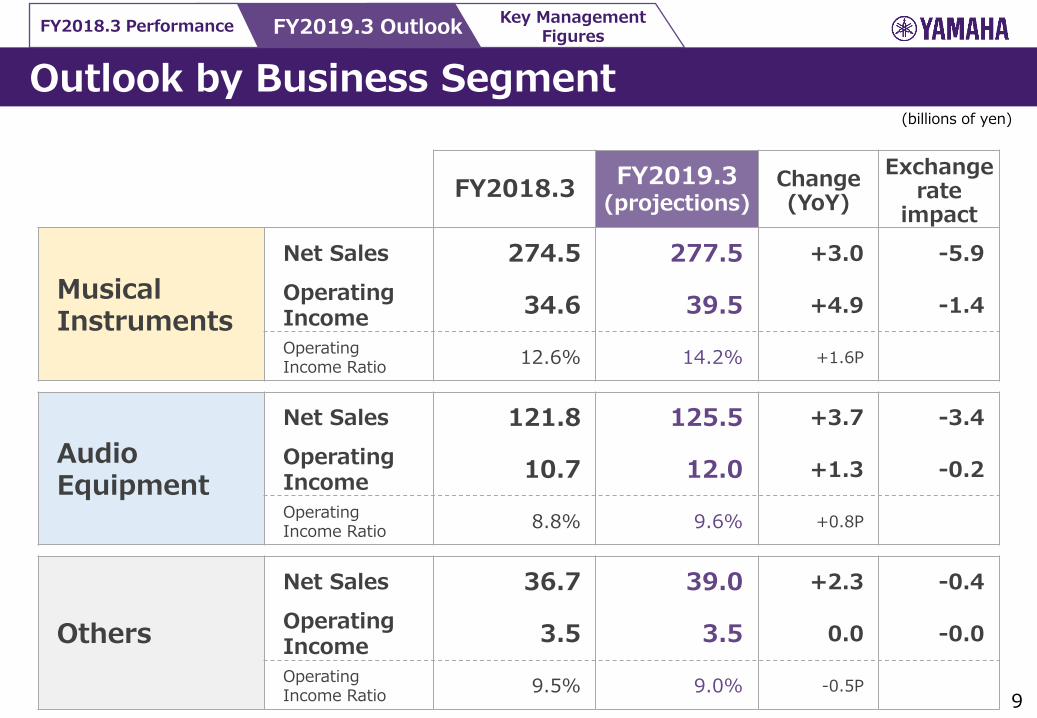
Musical Instruments
Net Sales 274.5 277.5 +3.0 -5.9
Operating Income
34.6 39.5 +4.9 -1.4
Operating Income Ratio
12.6% 14.2% +1.6P
Audio Equipment
Net Sales 121.8 125.5 +3.7 -3.4
Operating Income
10.7 12.0 +1.3 -0.2
Operating Income Ratio
8.8% 9.6% +0.8P
Others
Net Sales 36.7 39.0 +2.3 -0.4
Operating Income
3.5 3.5 0.0 -0.0
Operating Income Ratio
9.5% 9.0% -0.5P 9
Outlook by Business Segment (billions of yen)
Key Management Figures
FY2018.3 Performance FY2019.3 Outlook
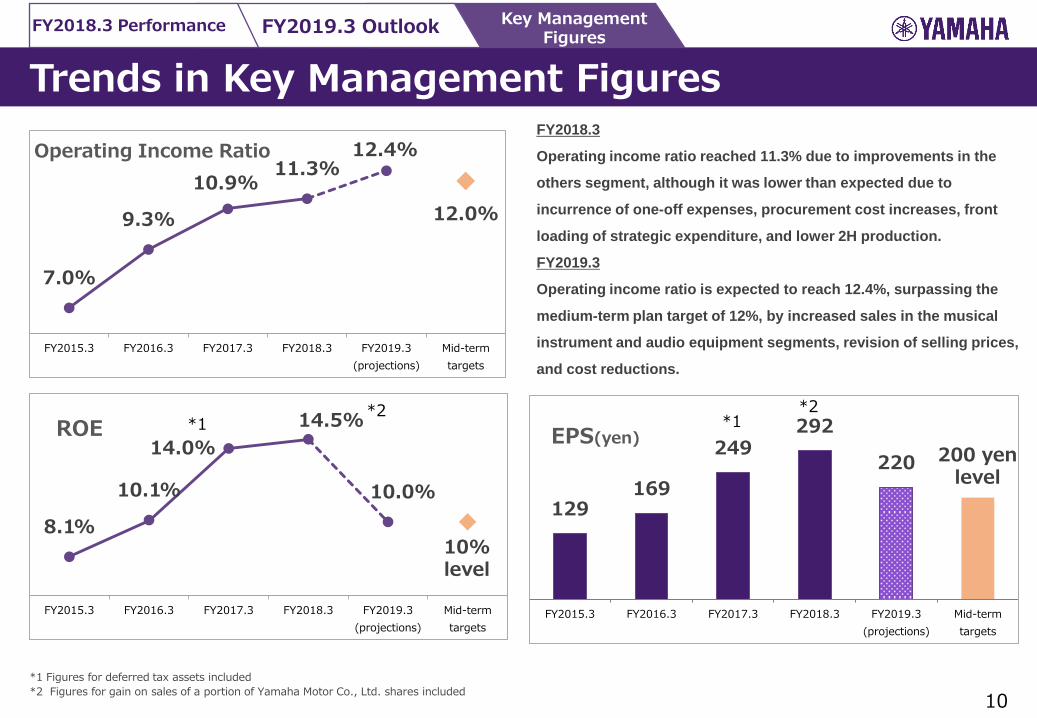
129 169
249 292
220
FY2015.3 FY2016.3 FY2017.3 FY2018.3 FY2019.3
(projections)
Mid-term
targets
EPS(yen)
10
Trends in Key Management Figures
8.1%
10.1%
14.0%
14.5%
10.0%
FY2015.3 FY2016.3 FY2017.3 FY2018.3 FY2019.3
(projections)
Mid-term
targets
ROE
*1 Figures for deferred tax assets included
*2 Figures for gain on sales of a portion of Yamaha Motor Co., Ltd. shares included
*1 *1 *2 *2
7.0%
9.3%
10.9% 11.3%
12.4%
12.0%
FY2015.3 FY2016.3 FY2017.3 FY2018.3 FY2019.3
(projections)
Mid-term
targets
Operating Income Ratio
10% level
200 yen level
FY2018.3
Operating income ratio reached 11.3% due to improvements in the
others segment, although it was lower than expected due to
incurrence of one-off expenses, procurement cost increases, front
loading of strategic expenditure, and lower 2H production.
FY2019.3
Operating income ratio is expected to reach 12.4%, surpassing the
medium-term plan target of 12%, by increased sales in the musical
instrument and audio equipment segments, revision of selling prices,
and cost reductions.

2. Segment Overview and Updates
11

Progress Audio Equipment Musical Instrument Others Segment
257.7 274.5 277.5
0
50
100
150
200
250
300
FY2017.3 FY2018.3 FY2019.3
(projections)
Net Sales
12.5% 12.6%
14.2%
12
Segment Sales and Operating Income
(billions of yen)
(billions of yen)
Red figures show actual YoY changes on constant currency basis
(103%) (103%)
FY2018.3 Results improved year-on-year in all product categories.
-Guitar sales grew by double digits, and digital musical instruments
showed strong sales due to the impact of new products
-Double-digit growth continued in China, and the growth rate in emerging
markets exceeded the previous year.
FY2019.3 Growth is projected to outpace the previous year in all product
categories.
-Guitars, pianos, and digital musical instruments, are expected to
continue showing strong growth.
-Double-digit growth is anticipated in China, and sales are likely to
remain robust in emerging markets.
32.1 34.6 39.5
0
10
20
30
40
50
FY2017.3 FY2018.3 FY2019.3
(projections)
Operating Income
Progress Audio Equipment Musical Instrument Others Segment
13
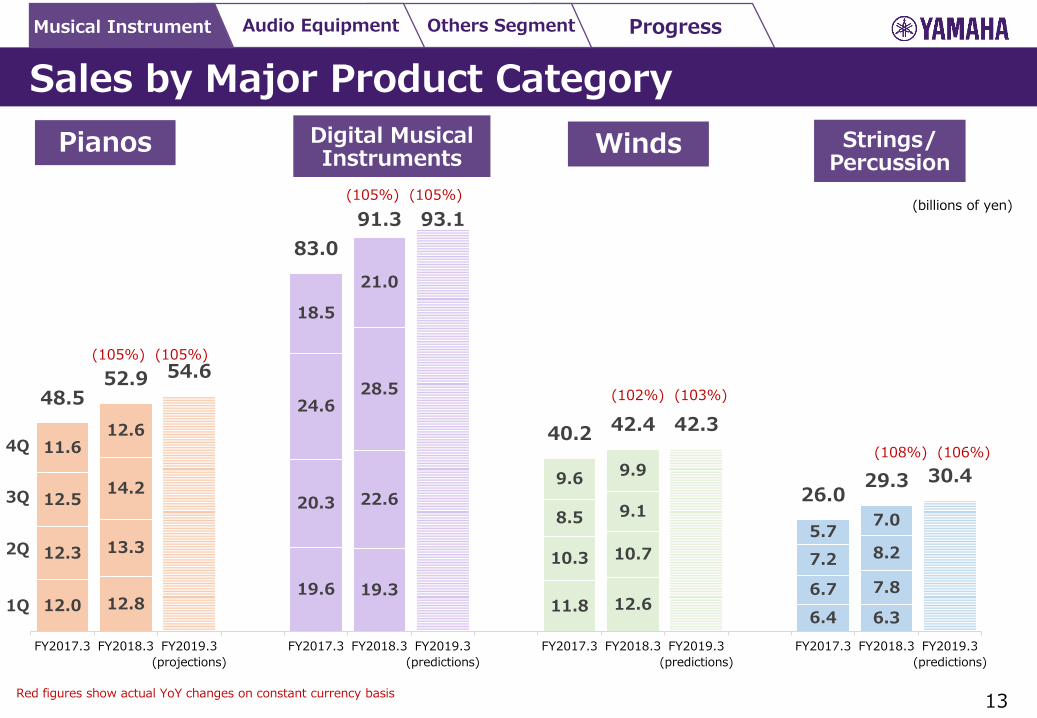
Sales by Major Product Category
(billions of yen)
Red figures show actual YoY changes on constant currency basis
Pianos Digital Musical Instruments
Winds Strings/ Percussion
12.0 12.8 19.6 19.3
11.8 12.6 6.4 6.3
12.3 13.3
20.3 22.6
10.3 10.7
6.7 7.8
12.5 14.2
24.6 28.5
8.5 9.1
7.2 8.2
11.6 12.6
18.5
21.0
9.6 9.9
5.7 7.0
48.5 52.9 54.6
83.0
91.3 93.1
40.2 42.4 42.3
26.0 29.3 30.4
FY2017.3 FY2018.3 FY2019.3
(projections)
FY2017.3 FY2018.3 FY2019.3
(predictions)
FY2017.3 FY2018.3 FY2019.3
(predictions)
FY2017.3 FY2018.3 FY2019.3
(predictions)
(105%) (105%)
(105%) (105%)
(102%) (103%)
(108%) (106%)
1Q
2Q
3Q
4Q

Progress Audio Equipment Musical Instrument Others Segment
21.7 21.5
12.5 12.0 11.9 11.4 8.4 10.0 10.2 10.7
18.9 17.5
13.4 13.8 11.4 12.5
9.3 11.2 10.8
13.5
19.3 18.5
13.1 14.2 14.9
17.3
8.6
11.0 12.2 13.6
20.0 19.5
13.7 14.2
9.1 11.0
7.2
8.7 11.0
12.3
79.8 77.0 75.6
52.7 54.2 52.9
47.3 52.1 51.5
33.6
41.0 45.1 44.2
50.1 52.4
FY2017.3 FY2018.3 FY2019.3
(projections)
FY2017.3 FY2018.3 FY2019.3
(projections)
FY2017.3 FY2018.3 FY2019.3
(projections)
FY2017.3 FY2018.3 FY2019.3
(projections)
FY2017.3 FY2018.3 FY2019.3
(projections)
14
Sales by Region (including software products and music schools)
North America
Europe China Other
Regions Japan
(billions of yen)
Red figures show actual YoY changes on constant currency basis
(97%) (98%)
(100%) (103%) (100%) (103%)
(117%) (110%)
(109%) (106%)
1Q
2Q
3Q
4Q

Progress Audio Equipment Musical Instrument Others Segment
15
Develop Products with Distinctive Individuality
Clavinova: CLP-600 series
Clavinova : CSP series
Introducing GrandTouch keys, new action mechanism developed first in 20 years
Enable you to play songs of your choice easily using smart devices
AvantGrand :NU1X
A hybrid piano renewed in 5 years
Constantly evolving new generation pianos
Integrating the real keyboard action of an acoustic piano and the latest digital
technology

Progress Audio Equipment Musical Instrument Others Segment
16
Develop Products with Distinctive Individuality
Unique products integrating various technologies
Venova Casual wind instrument
Following products received the highest awards in the 4 categories of “Musikmesse International Press Award 2018” during Musikmesse 2018,
international trade fair for musical instruments held in Europe
Genos Digital workstation
Electronic Drums
Yamaha EAD10 Electronic Acoustic Drum Module
Guitar Effects
Line 6 HX Effects
Electric Bass
Yamaha BB-series
Recording Software & Apps
Steinberg Cubase9.5

Progress Audio Equipment Musical Instrument Others Segment
17
Enhance Customer Interaction
Expanding sales channel
Enhancing marketing initiatives
Gradually shifting focus to sales promotion activities that prioritize end-customer interaction and sell-through.
Established new dedicated marketing division, forged ahead with digital marketing initiatives utilizing social networks, etc.
Increased the number of account in emerging countries by 16% (approximately 300 accounts additionally to handle our products)

Progress Audio Equipment Musical Instrument Others Segment
18
Strengthen Global Business Platforms
Yamaha Guitar Group Established
New organization established in the U.S. to expand our guitar business
New subsidiary name : Yamaha Guitar Group, Inc. Location: Calabasas City, California, U.S. Effective date of change: April 1, 2018 -Shifted the headquarter function of strategy formulation for guitar
businesses to the United State - The new guitar business structure to begin in the U.S. to take the
following positions: Guitar business strategy formulation and implementation for both the
Yamaha and Line 6 brands, planning/engineering/marketing of guitar and related products
Progress Audio Equipment Musical Instrument Others Segment
19
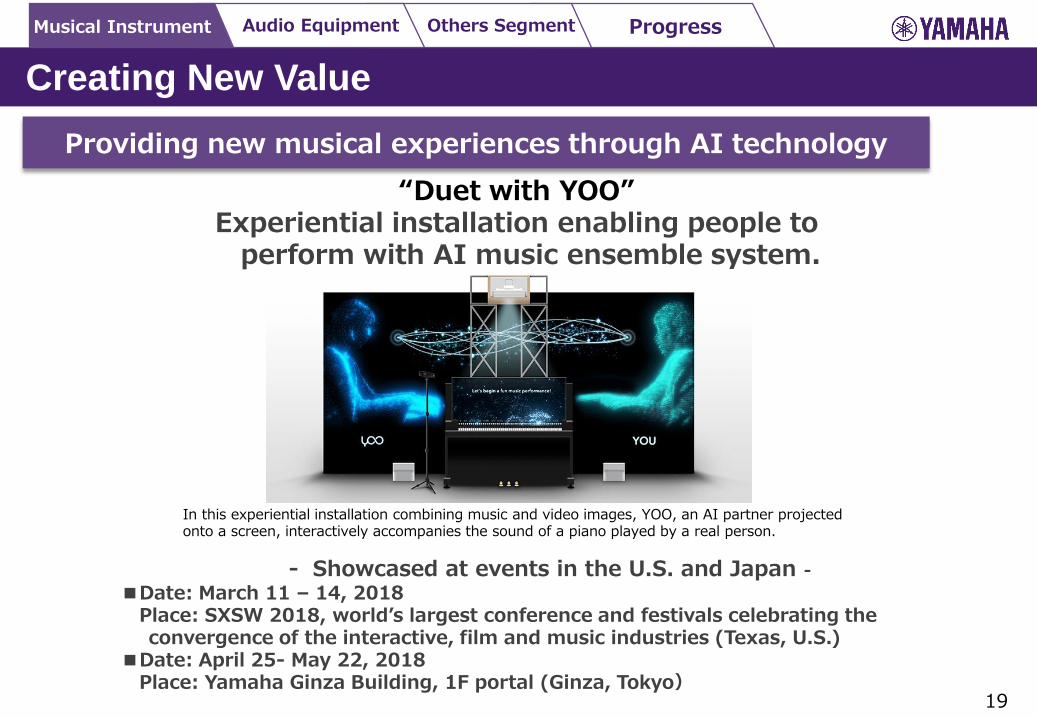
Creating New Value
“Duet with YOO” Experiential installation enabling people to
perform with AI music ensemble system.
Providing new musical experiences through AI technology
In this experiential installation combining music and video images, YOO, an AI partner projected onto a screen, interactively accompanies the sound of a piano played by a real person.
- Showcased at events in the U.S. and Japan - ■Date: March 11 – 14, 2018 Place: SXSW 2018, world’s largest conference and festivals celebrating the
convergence of the interactive, film and music industries (Texas, U.S.) ■Date: April 25- May 22, 2018 Place: Yamaha Ginza Building, 1F portal (Ginza, Tokyo)
Progress Audio Equipment Musical Instrument Others Segment
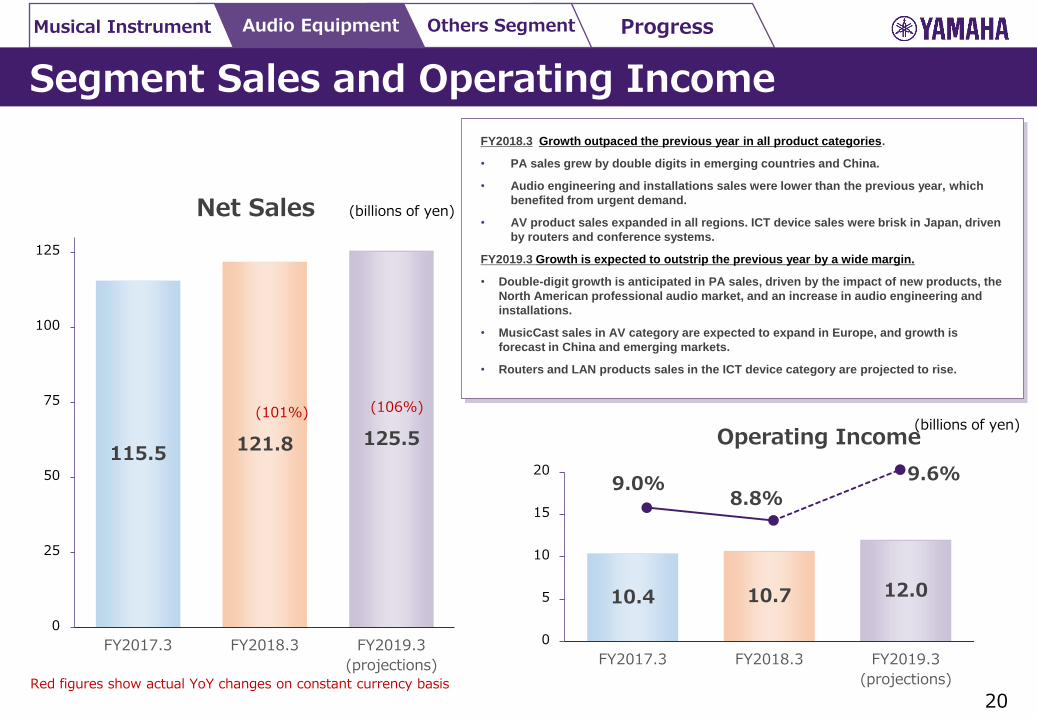
115.5 121.8 125.5
0
25
50
75
100
125
FY2017.3 FY2018.3 FY2019.3
(projections)
Net Sales
20
Segment Sales and Operating Income
(billions of yen)
Red figures show actual YoY changes on constant currency basis
9.0% 8.8%
9.6%
(billions of yen) (101%) (106%)
FY2018.3 Growth outpaced the previous year in all product categories.
• PA sales grew by double digits in emerging countries and China.
• Audio engineering and installations sales were lower than the previous year, which
benefited from urgent demand.
• AV product sales expanded in all regions. ICT device sales were brisk in Japan, driven
by routers and conference systems.
FY2019.3 Growth is expected to outstrip the previous year by a wide margin.
• Double-digit growth is anticipated in PA sales, driven by the impact of new products, the
North American professional audio market, and an increase in audio engineering and
installations.
• MusicCast sales in AV category are expected to expand in Europe, and growth is
forecast in China and emerging markets.
• Routers and LAN products sales in the ICT device category are projected to rise.
10.4 10.7 12.0
0
5
10
15
20
FY2017.3 FY2018.3 FY2019.3
(projections)
Operating Income

Progress Audio Equipment Musical Instrument Others Segment
21
Sales by Major Product Category
AV Products PA Equipment ICT Devices
(billions of yen)
Red figures show actual YoY changes on constant currency basis
3.6 3.9
3.4 3.9
3.6 3.6
3.8 3.7
14.4 15.2
14.1
FY2017.3 FY2018.3 FY2019.3
(projections)
8.6 9.2
11.3 12.6
15.0 16.3
10.1
10.2
44.9 48.4 47.8
FY2017.3 FY2018.3 FY2019.3
(projections)
10.9 11.6
10.6 11.8
11.4 12.6
10.9
12.0
43.8
48.0 51.4
FY2017.3 FY2018.3 FY2019.3
(projections)
(103%) (102%) (104%)
(110%)
(104%) (93%)
*Includes only hardware products for PA (excluding engineering and installation services)
1Q
2Q
3Q
4Q (111%)
Blue figures show actual YoY change excluding the sales of OEM products
(107%)
Progress Audio Equipment Musical Instrument Others Segment
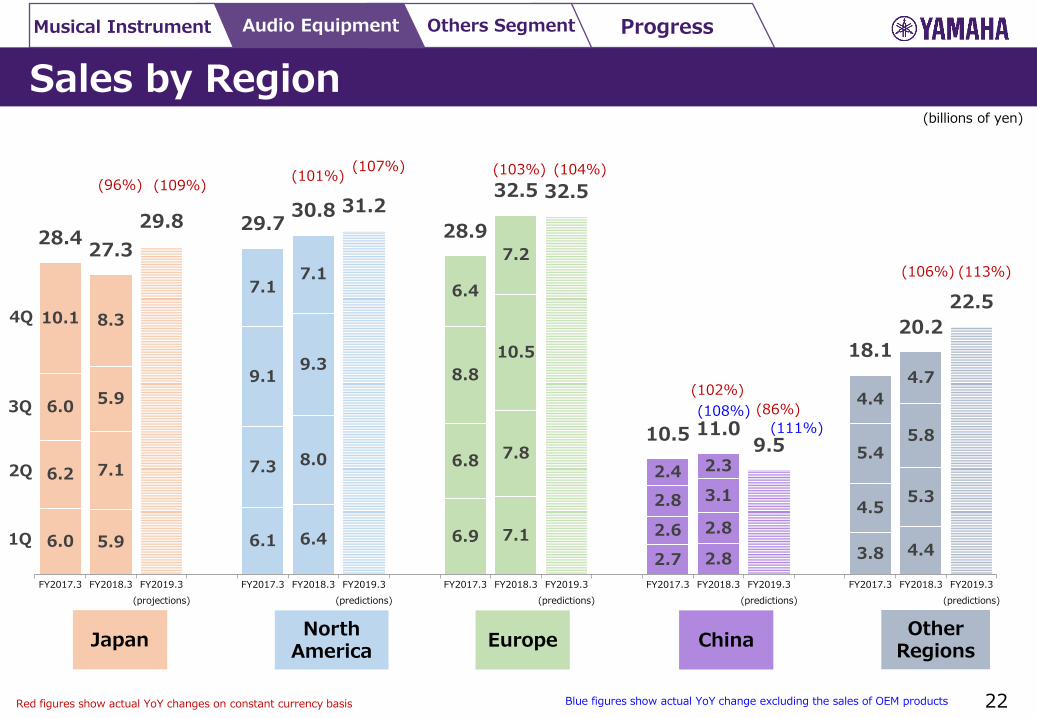
22
Sales by Region (billions of yen)
Red figures show actual YoY changes on constant currency basis
North America
Europe China Other
Regions Japan
6.0 5.9 6.1 6.4 6.9 7.1
2.7 2.8 3.8 4.4
6.2 7.1 7.3 8.0 6.8 7.8
2.6 2.8
4.5 5.3
6.0 5.9
9.1 9.3
8.8
10.5
2.8 3.1
5.4 5.8
10.1 8.3
7.1 7.1
6.4
7.2
2.4 2.3
4.4
4.7
28.4 27.3
29.8 29.7 30.8 31.2
28.9
32.5 32.5
10.5 11.0 9.5
18.1 20.2
22.5
FY2017.3 FY2018.3 FY2019.3
(projections)
FY2017.3 FY2018.3 FY2019.3
(predictions)
FY2017.3 FY2018.3 FY2019.3
(predictions)
FY2017.3 FY2018.3 FY2019.3
(predictions)
FY2017.3 FY2018.3 FY2019.3
(predictions)
(96%) (109%) (101%)
(107%) (103%) (104%)
(102%)
(86%)
(106%) (113%)
1Q
2Q
3Q
4Q
(111%)
Blue figures show actual YoY change excluding the sales of OEM products
(108%)

Progress Audio Equipment Musical Instrument Others Segment
23
Develop Products with Distinctive Individuality
Fresh product line-up integrates state-of-the-art technologies to create new value
RIVAGE PM7 digital mixing system
Fresh line-up offers the mixing quality of the flagship RIVAGE PM10 model at a reasonable price
WLX313 wireless LAN access point
Tri-band compatibility enables fresh line-
up of wireless LAN access points capable of connecting up to 150 devices
CS-700 video sound collaboration system for huddle rooms
Optimal all-in-one device for huddle rooms

Progress Audio Equipment Musical Instrument Others Segment
24
Enhance Customer Interaction
Increasing store displays with MusicCast network audio
Integrated marketing campaigns
to link online presence to store
displays
Raised profile with brand promotion at
IFA 2017 consumer electronics trade
show in Berlin and through social
networks
Established 78 Premium Y-island
outlets in European market as
key display centers
MusicCast products are focused to display in stores, especially in key European and U.S. markets. Improved in-store customer experience through consistent
approach to POP display design and demo quality, particularly in Europe.

Progress Audio Equipment Musical Instrument Others Segment
25
Enhance Customer Interaction
Increased system engineering and sales staff mainly in Europe, U.S.,
Japan and ASEAN countries.
Strengthening personnel and service bases to improve support to corporate and B2B customers
The number of audio facility operator accounts has grown by 37% over two years. (Mid-tem target: 50% in 3 years)
Over 20 equipment-related personnel are increased from last year (mainly in Europe, U.S., and emerging countries) . Support for audio contractors are enhanced, including expansion of contents such as web seminars.

Progress Audio Equipment Musical Instrument Others Segment
35.1 36.7 39.0
0
10
20
30
40
FY2017.3 FY2018.3 FY2019.3
(projections)
Net Sales
4.9%
9.5% 9.0%
26
Segment Sales and Operating Income
(billions of yen)
Red figures show actual YoY changes on constant currency basis
(104%) 108(%)
FY2018.3
• Ongoing strength in sales of factory automation equipment and
automobile interior wood components drove double-digit growth in the
industrial machinery and components category.
• Golf product sales also grew by double digits supported by new
products.
FY2019.3
• Electronic devices is expected to see double-digit growth spurred by on-
board communication modules.
• The impact of new products and branding initiatives are anticipated to
maintain double-digit growth in golf product sales.
(billions of yen)
1.7 3.5 3.5
0
2
4
6
8
FY2017.3 FY2018.3 FY2019.3
(projections)
Operating Income

Progress Audio Equipment Musical Instrument Others Segment
27
Sales by Major Product Category (billions of yen)
Industrial machinery and components
Others
Red figures show actual YoY changes on constant currency basis
5.4 6.4
6.1 6.9
6.0
6.7
5.9
7.2
23.5
27.2 28.8
FY2017.3 FY2018.3 FY2019.3
(projections)
2.8 2.8
3.4 2.0
3.0
2.9
2.4
1.7
11.6
9.4 10.2
FY2017.3 FY2018.3 FY2019.3
(projections)
(115%) (107%)
1Q
2Q
3Q
4Q

Progress Audio Equipment Musical Instrument Others Segment
28
Develop Products with Distinctive Individuality/ Enhance Customer Interaction
Speaker Mic Mic
On-board communication modules for emergency call systems
On-board emergency call systems has became mandatory in Russia and Europe. Such systems demand clear communication quality required in emergencies, and
have been adopted by several manufacturers. Yamaha will start mass production and sales in 1Q of FY2019.3.
Emergency call system Emergency calls are automated from airbag
sensors, etc. Emergency services are dispatched by connecting
to operators.
On-board communication modules Internal microphones and speakers are included,
which eliminate need for vehicle-specific tuning. Triple functionality loaded in a single unit (emergency
call, hands-free communications, and voice recognition).

Progress Audio Equipment Musical Instrument Others Segment
29
Continually reduce costs
Progress in cost reduction (two years total)
Increase in labor cost costs at overseas
plants
Cost as of
FY2016.3
+3.3
-1.2
-1.9
3.6 (net)
Reduction in purchasing
cost
Improve productivity of
indirect operations
-3.8
More efficient production
8.0
(net)
By 2019.3 (Mid-term plan)
(3 yr plan)
By 2018.3 (2 yr plan)
Costs as of FY2018.3
5.2 (net)
Optimized procurement systems globally. Cost reduction targets for the second year of the medium-term plan
were not met due to rising raw material prices and procurement costs
(billions of yen)

Progress Audio Equipment Musical Instrument Others Segment
30
Implementing strategic investment for further growth
蕭山ヤマハ管楽器生産100万本
Construction of Innovation Center (R&D center) (scheduled to complete in June 2018)
Assembled development staff in pursuit of technical synergy
It includes open, flexible office spaces to encourage employee interaction and
energize the workplace.
Equipped with global cutting-edge development and lab facilities relating
to sound as followings:
Largest anechoic chamber in Japan, 360-degree 3D sound lab, and echo
chamber.
Innovative labs including sensory lab and human engineering lab.

Progress Audio Equipment Musical Instrument Others Segment
31
Implementing strategic investment for further growth
蕭山ヤマハ管楽器生産100万本
Yamaha Music India Pvt. Ltd.
PT. Yamaha Musical Products Asia (YMPA)
Constructing two new factories to meet expanding demand in emerging countries
■ India (Chennai) :Yamaha Music India Pvt. Ltd
-Scheduled to start operations in January, 2019
Supply optimal products locally for the huge Indian market comprising 1.3 billion people A compound factory integrating manufacturing, sales and techniques. It aims to provide cost competitive products in affordable price ranges by introducing "Indian optimized" planning, procurement, production, and logistics.
■ Indonesia (near Jakarta):Yamaha Musical
Products Asia (YMPA)
-Scheduled to start operations in March, 2019
Produce digital musical instruments and piano
components for the global market A musical instrument factory, which aims to produce the world’s top cost competitive wood finishes by sharing the productive resources used for acoustic and digital pianos.

3. ESG Topics
32

Segment Overview & Updates
Performance Summary
Other Financial Figures ESG Return to
Shareholders
33
Environment
Implemented a project in Tanzania to construct a business model to sustainably use “African blackwood,” which is the raw materials for making winds instruments
Actions for obtaining sustainable timber resources

Segment Overview & Updates
Performance Summary
Other Financial Figures ESG Return to
Shareholders
34
Environment
Yamaha Group has set product environmental quality goals based on factors including environmental preservation, resource sustainability, and customer utility, in order to manufacture eco-friendly products. Products that meet the standards we have set for items making a major contribution to achieving these goals are specially certified as Yamaha Eco-Products.
In FY2018.3, 16 models were certified as Eco-Products, making a total of 320 certified models
Developing Eco-friendly products
Example of a certified product
RX-V583 AV receiver Reason for certification: reduced electricity consumption on network standby

Segment Overview & Updates
Performance Summary
Other Financial Figures ESG Return to
Shareholders
35
Social
211 schools (portable keyboard/guitar)
630 schools (portable keyboard/recorder/Pianica keyboard )
Malaysia
Indonesia
Russia 17 schools (portable keyboard/recorder )
75 schools (portable keyboard/recorder/pianica)
Vietnam Example of Malaysia project
Making steady progress with music promotion activities in emerging countries
- Expansion of School Project aimed at increasing player numbers
Musical instruments, teaching materials, and instruction guidance are provided as a package to public elementary schools in emerging countries in order to create an environment conducive to musical instrument education in extracurricular activities.
■ 2015: Project started
■ 2016: Efforts started aimed at introduction of instrumental music lessons to the Course of Study
The medium-term plan sets a target of 1,000 schools with a total of 100,000 students, and 933 schools with 124,000 students have already been established in these four
countries. The project is also expanding in other countries.
Yamaha
Ministry of Education
Cooperation
Dispatch of trainers
Instructor training
Organization
Pro
vis
ion
of m
usic
al
instru
men
ts a
nd
te
ach
ing
mate
rials
Atte
nd
an
ce
School teachers
Public elementary schools
Pupils
Instruction

Segment Overview & Updates
Performance Summary
Other Financial Figures ESG Return to
Shareholders
Social
36 * Design facilitating access by all people regardless of disability, age, gender, ethnicity, etc.
Creating a society free from language and hearing barriers
Established Sound UD Consortium in the aim of encouraging universal design* in the sound field
Official launch at Ryogoku Kokugikan
Attended by 167 Japanese companies and organizations
2015: “Omotenashi Guide” trial began in approximately 60 locations,
including airports, railways, and tourist facilities
Open access to some technology
Promote it as “Sound UD” facilitating external
collaboration
October 25, 2017: Launched officially at Ryogoku Kokugikan May 2018: Starts providing services and opens access to technology

Segment Overview & Updates
Performance Summary
Other Financial Figures ESG Return to
Shareholders
37
Governance
■Purpose of a transition
Board of Directors structure: 6 out of 9 members are outside directors (including 1 female director)
■Enhancing the overall management oversight function
Transition to a Company with Three Committees
Review of Executive Compensation
■ Introduction of restricted stock compensation plan The plan comprises fixed compensation, performance-linked bonuses, and
restricted stock compensation at a ratio of around 5:3:2. ■ Adoption of “Clawback” clause In the event that a major accounting fraud is discovered or a large loss is
reported, executives will return all or a portion of restricted stocks without payment.
Transition to a Company with Three Committees and Review of Executive Compensation
To further clarify the oversight and execution roles in management To enhance the overall management oversight function by the Board
of Directors, and speed up the execution of management.
(June, 2017)
4. Other Financial Figures
38

ESG Segment Overview
& Updates Performance
Summary Other
Financial Figures
Return to Shareholders
39
Balance Sheet Summary
Cash and deposits
Notes and accounts receivable
Inventories
Other current assets
Fixed assets
Total assets
Notes and accounts payable
Short- and long-term loans
Other liabilities
Total net assets
Total liabilities and net assets
As of March 31, 2017
105.9
49.8
93.1
23.9
249.7
522.4
17.8
11.2
126.0
367.4
522.4
As of March 31, 2018
122.7
55.3
94.1
27.7
260.4
560.2
19.9
11.1
140.9
388.3
560.2
As of March 31, 2019
(projections)
119.9
58.5
91.0
18.3
275.7
563.4
20.4
9.9
116.8
416.3
563.4
(billions of yen)

ESG Segment Overview
& Updates Performance
Summary Other
Financial Figures
Return to Shareholders
43.9 42.2 40.1
18.9 18.1 18.5
4.2 5.7 6.2
26.1 28.2 26.2
93.1 94.1 91.0
FY2017.3 FY2018.3 FY2019.3
(projections)
Goods in
process/material
Other products
Audio Equipment
Musical
Instruments
40
Inventories
Impact of exchange rate
(billions of yen)
Versus previous
projections +0.5
(billions of yen)
Impact of exchange rate
(billions of yen)
Versus previous
projections -1.0

ESG Segment Overview
& Updates Performance
Summary Other
Financial Figures
Return to Shareholders
41
Capital Expenditure/Depreciation, R&D Expenses
Capital Expenditure/ Depreciation
R&D Expenses
(billions of yen)
Capital expenditure in FY2018.3 increased by ¥7.1 billion above the previous year to reach ¥24.6 billion, due to projects including investment in new Innovation Center at headquarters and two new overseas factories
8.7 8.9 9.6
11.4 11.4 12.9
4.2 4.5 4.5
24.4 24.8 27.1
FY2017.3 FY2018.3 FY2019.3 (projections)
11.2 18.6 19.5
4.0
4.2 4.0 2.4
1.8 1.9 17.5
24.6 25.4
11.1 10.8 11.6
Others
Audio
Equipment
Music
Instruments
FY2017.3 FY2019.3 (projections)
FY2018.3

ESG Segment Overview
& Updates Performance
Summary Other
Financial Figures
Return to Shareholders
42
Adoption of IFRS
Adoption of International Financial Reporting Standards (IFRS)
Purpose of adoption Further improve the level of management control by standardizing Group
accounting standards.
Enhance global investor convenience and ensure appropriate evaluation.
Schedule
FY2020.3: Report in accordance with IFRS from FY2020.3 1Q.

5. Return to Shareholders
43
Return to Shareholders ESG
Segment Overview & Updates
Performance Summary
Other Financial Figures
44
Acquisition of Treasury Stock and Dividends
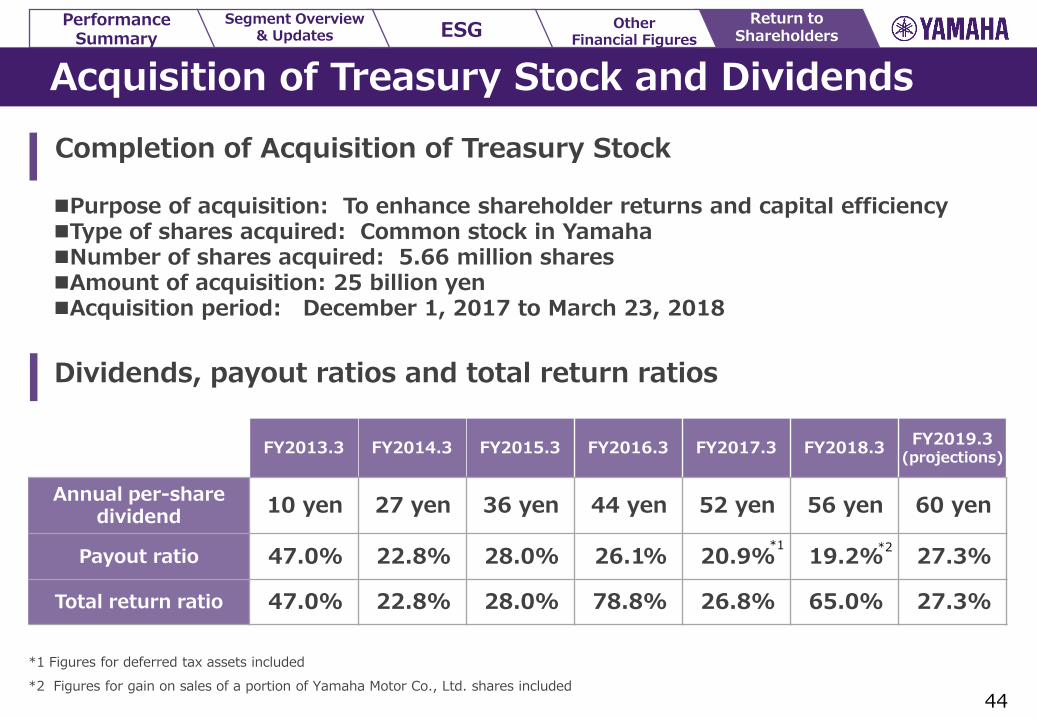
Completion of Acquisition of Treasury Stock
Purpose of acquisition: To enhance shareholder returns and capital efficiency Type of shares acquired: Common stock in Yamaha Number of shares acquired: 5.66 million shares Amount of acquisition: 25 billion yen Acquisition period: December 1, 2017 to March 23, 2018
Dividends, payout ratios and total return ratios
FY2013.3 FY2014.3 FY2015.3 FY2016.3 FY2017.3 FY2018.3 FY2019.3
(projections)
Annual per-share dividend
10 yen 27 yen 36 yen 44 yen 52 yen 56 yen 60 yen
Payout ratio 47.0% 22.8% 28.0% 26.1% 20.9%
19.2% 27.3%
Total return ratio 47.0% 22.8% 28.0% 78.8% 26.8% 65.0% 27.3%
*1 *2
*1 Figures for deferred tax assets included
*2 Figures for gain on sales of a portion of Yamaha Motor Co., Ltd. shares included

Appendix
45

46
Full Year Non-Operating Income/Loss, Extraordinary Income/Loss
Net financial income
Other
Total
Income from (loss on) disposal of fixed assets
Others
Total
Income taxes –current
Income taxes -deferred
Net income attributable to non-controlling interests
Total
FY2017.3 Full year
3.5
-2.9
0.6
3.5
-5.5
-2.0
8.7
-12.7
0.2
-3.8
FY2018.3 Full year
4.3
-3.9
0.4
-0.2
25.5
25.2
21.4
-1.3
0
20.1
FY2019.3 Full year
(projections)
3.5
-3.5
0
0
0
0
13.7
1.2
0.1
15.0
Non-Operating Income /Loss
Extraordinary Income /Loss
Income Taxes a n d O t h e r E x p e n s e s
* In conjunction with the recent improvement in profitability, deferred tax assets of ¥13.5 billion were posted in FY2017.3.
(billions of yen)
-Structural reform expenses -¥3.0 -Impairment loss -¥0.6 -Transfer of defined contribution pension plan for retirement benefits -¥0.9 -Immediate amortization of goodwill of Revolabs -¥1.5
-Gain on sales of Yamaha Motor Co., Ltd. shares +¥25.8

In this report, the figures forecast for the Company’s future performance have been
calculated on the basis of information currently available to Yamaha and the
Yamaha Group. Forecasts are, therefore, subject to risks and uncertainties.
Accordingly, actual performance may differ greatly from our projections depending
on changes in the economic conditions surrounding our business, demand trends,
and the value of key currencies, such as the U.S. dollar and the euro.
47