Persian Badger (Meles meles canescens Blanford, 1875) in Palestine and the Arabian Peninsula
Upload
beryl-merrittCategory
view
216download
1
Analysis Results Of Business Data Request 04-45
Presented to: Governmentwide Relocation Advisory BoardBy: Runzheimer InternationalSpeakers: Julie Blanford (Travel & Relocation Mgmt Solutions), Dr. Adlore Chaudier (Mercury Associates)When: February 16, 2005
February 16, 2005 Analysis of OMB BDR 04-45 Preliminary Findings
2
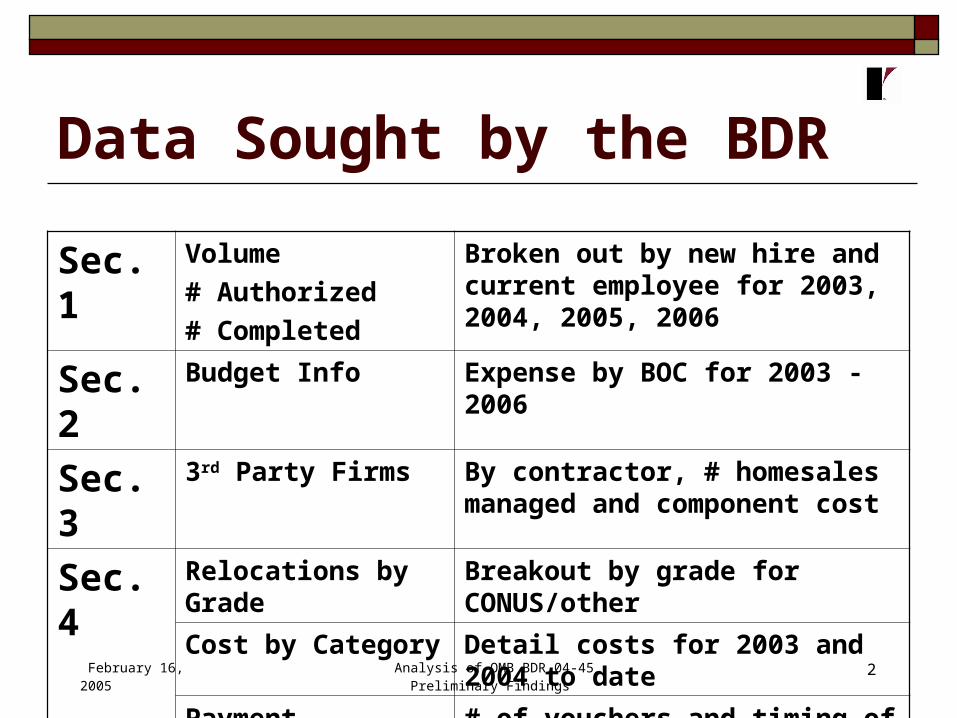
Data Sought by the BDR
Sec. 1 Volume
# Authorized
# Completed
Broken out by new hire and current employee for 2003, 2004, 2005, 2006
Sec. 2 Budget Info Expense by BOC for 2003 - 2006
Sec. 3 3rd Party Firms By contractor, # homesales managed and component cost
Sec. 4 Relocations by Grade Breakout by grade for CONUS/other
Cost by Category Detail costs for 2003 and 2004 to date
Payment Statistics # of vouchers and timing of payments

February 16, 2005 Analysis of OMB BDR 04-45 Preliminary Findings
3
Basis for Data Analysis 162 BDR submissions from Federal departments,
agencies and bureaus in Excel format Respondents “customized” many submissions to add
or omit data fields; Runzheimer manually re-entered the data into a Microsoft Access database
Consultants reviewed data to identify outliers resulting from data entry errors and/or incongruent reporting of dollar amounts (e.g., reporting in “actual” dollars rather than thousands)
For drill-down analysis of expenses and activities, we focus primarily on FY 2003 data because it offers the most complete and reliable information

February 16, 2005 Analysis of OMB BDR 04-45 Preliminary Findings
4
BDR Analysis At-a-Glance Number of Agencies/Bureaus Responding: 160 Number of Agencies/Bureaus Included in Analysis
(omitting blanks and summaries): 154 Aggregate Relocation Authorizations for 2003 (New Hire +
Transfers): 22,334 Percentages of New-Hire and Current-Employee
Authorized Transfers: 27% New Hires, 73% Current Employees
Aggregate Completed Relocations for 2003: 18,968 (85% of authorizations)
Trend in Average Number of Authorizations (2005 and 2006): 5% increase per year
Aggregate Actual Relocation Budget for 2003: $655M

February 16, 2005 Analysis of OMB BDR 04-45 Preliminary Findings
5
BDR Analysis At-a-Glance Aggregate Est. Relocation Budget for 2004: $737M Average Budget/Authorized Move for 2003: $29,735 Average Budget/Authorized Move for 2004: $37,394 Trend in Average Estimated Budget/Move (2005 and
2006): 5% increase Number of RMC Managed Moves for 2003: 7,378 Aggregate Payment to RMCs for 2003: $177M Average Payment for RMC Assistance for 2003: $23,990 Employment Grades with Highest Proportions of
Transfers: GS-12, GS-13, FP-04 (a State Department classification)

February 16, 2005 Analysis of OMB BDR 04-45 Preliminary Findings
6
Respondent Groupings All Respondents (154, but reported
statistics reflect only those that responded to specific data fields)
Case Study Group (13) Department of State Department of Defense (25) Agency Detail and Departmental
Comparisons
February 16, 2005 Analysis of OMB BDR 04-45 Preliminary Findings
7
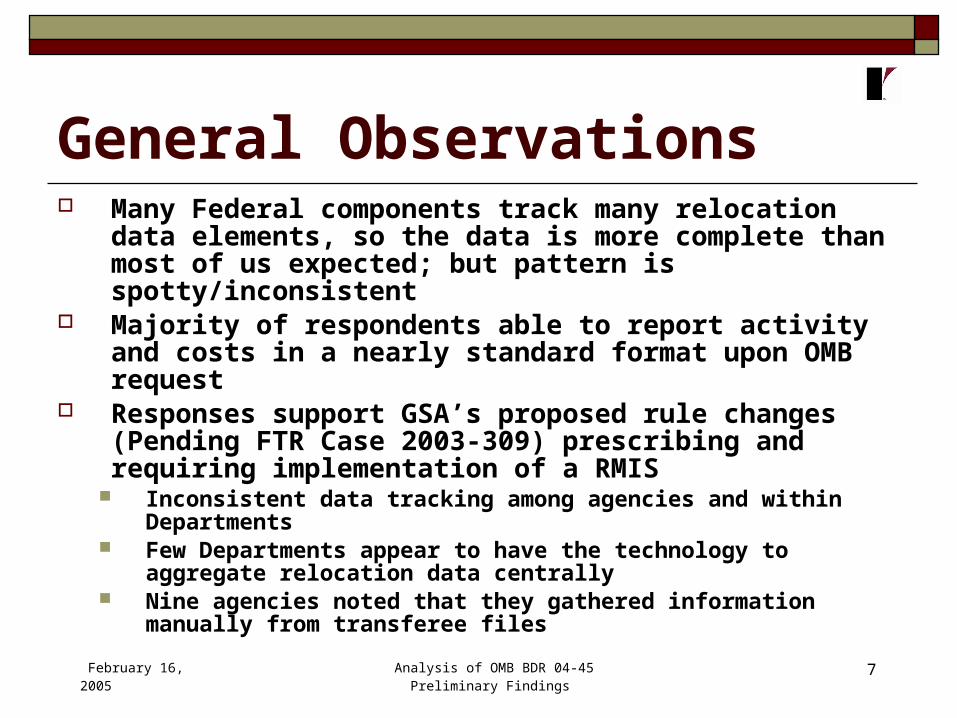
General Observations Many Federal components track many relocation data
elements, so the data is more complete than most of us expected; but pattern is spotty/inconsistent
Majority of respondents able to report activity and costs in a nearly standard format upon OMB request
Responses support GSA’s proposed rule changes (Pending FTR Case 2003-309) prescribing and requiring implementation of a RMIS
Inconsistent data tracking among agencies and within Departments
Few Departments appear to have the technology to aggregate relocation data centrally
Nine agencies noted that they gathered information manually from transferee files

February 16, 2005 Analysis of OMB BDR 04-45 Preliminary Findings
8
General Observations Most agencies identified payment types by
Budget Object Class (BOC) subclasses that align with Circular A-11
BOC subclass designations varied significantly among Agencies, in general, and within Departments, specifically
Disparate Budget Object Class sub-classification approaches among components of the same Departments points to decentralization of financial management as well as relocation administration
February 16, 2005 Analysis of OMB BDR 04-45 Preliminary Findings
9
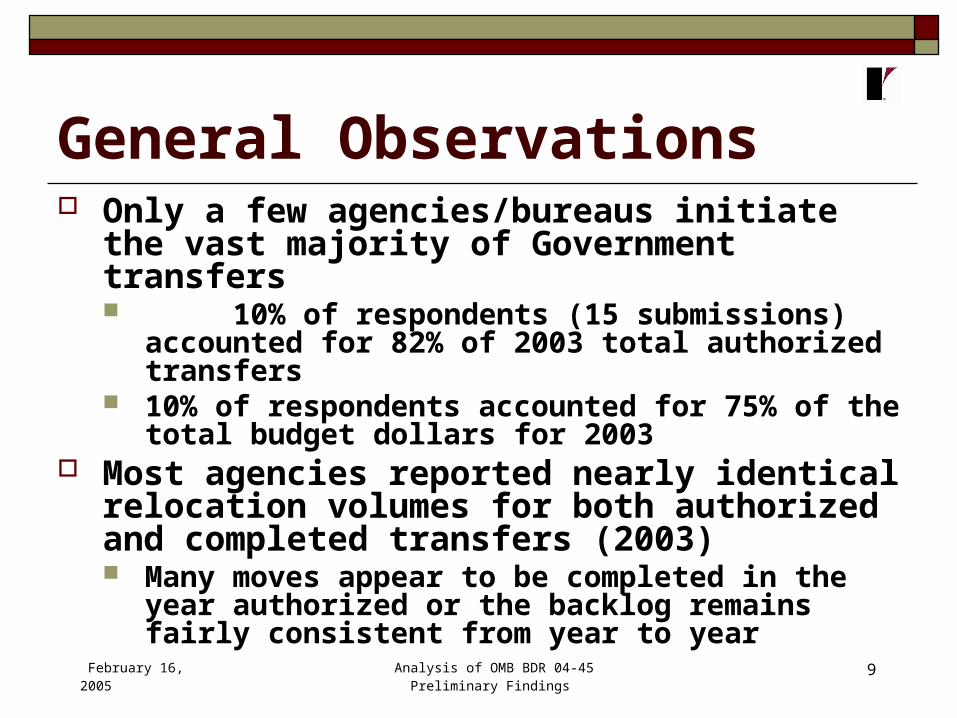
General Observations Only a few agencies/bureaus initiate the vast
majority of Government transfers 10% of respondents (15 submissions) accounted
for 82% of 2003 total authorized transfers 10% of respondents accounted for 75% of the total
budget dollars for 2003 Most agencies reported nearly identical
relocation volumes for both authorized and completed transfers (2003) Many moves appear to be completed in the year
authorized or the backlog remains fairly consistent from year to year

February 16, 2005 Analysis of OMB BDR 04-45 Preliminary Findings
10
Number of Relocations (BDR Sec. 1)
Relocation Activity 2003 – 2006 (Table 1.1) Distribution of Authorized Relocations
2003 (Table 1.2, All Respondents) Distribution Completed 2003 (Table 1.3,
All Respondents) Respondents with Highest Transfer
Volumes (Tables 1.5 and 1.6)
February 16, 2005 Analysis of OMB BDR 04-45 Preliminary Findings
11
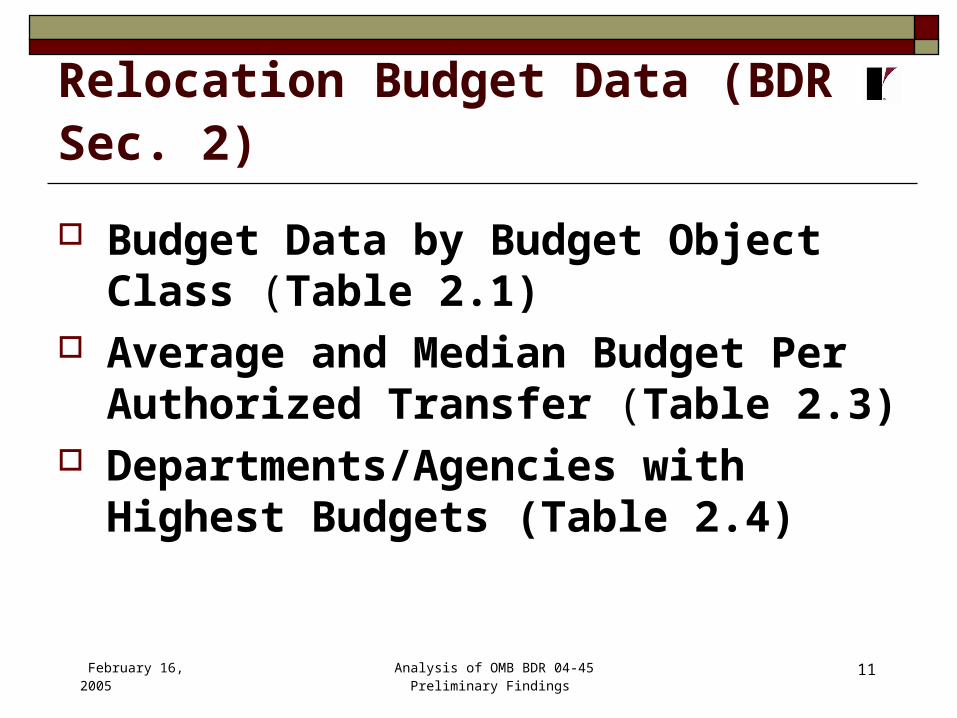
Relocation Budget Data (BDR Sec. 2)
Budget Data by Budget Object Class (Table 2.1)
Average and Median Budget Per Authorized Transfer (Table 2.3)
Departments/Agencies with Highest Budgets (Table 2.4)
February 16, 2005 Analysis of OMB BDR 04-45 Preliminary Findings
12
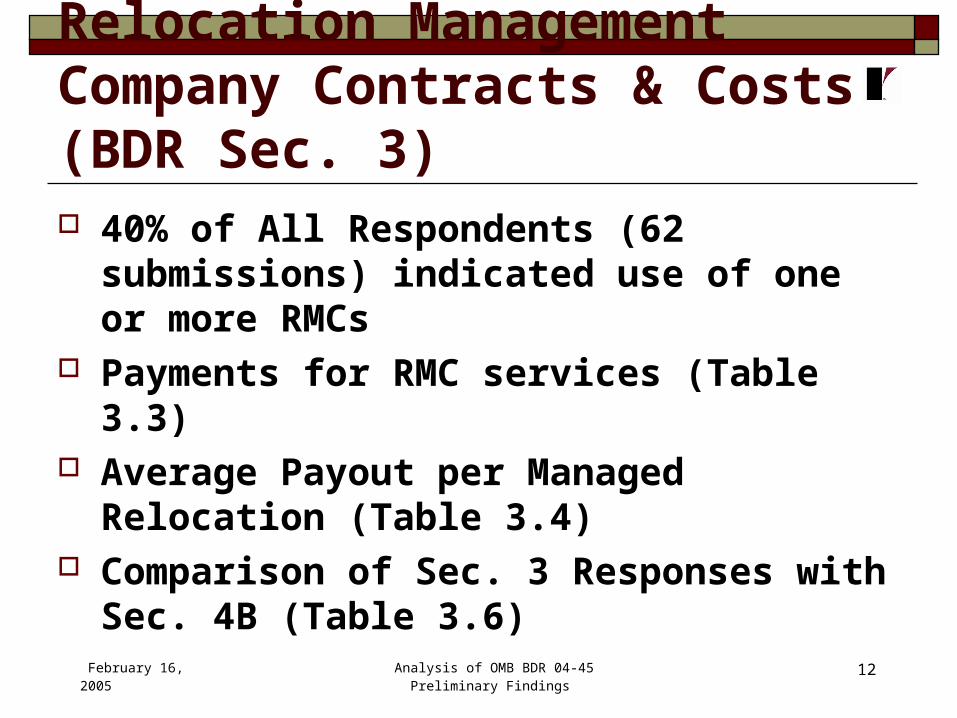
Relocation Management Company Contracts & Costs (BDR Sec. 3) 40% of All Respondents (62 submissions)
indicated use of one or more RMCs Payments for RMC services (Table 3.3) Average Payout per Managed Relocation
(Table 3.4) Comparison of Sec. 3 Responses with Sec.
4B (Table 3.6)

February 16, 2005 Analysis of OMB BDR 04-45 Preliminary Findings
13
Relocation Management Information (BDR Sect. 4) Systems for tracking relocation costs/data Top Ten Grades for Relocation 2003 and 2004
(Table 4.1.2) Relocation Costs by Category (Table 4.2.1, 2003
Actual Expenses) Comparison of 2003 Budget Data with Actual
Expenses (Table 4.2.3) Relocation Payment Processing Statistics (Table
4.3.1, All Respondents)
February 16, 2005 Analysis of OMB BDR 04-45 Preliminary Findings
14
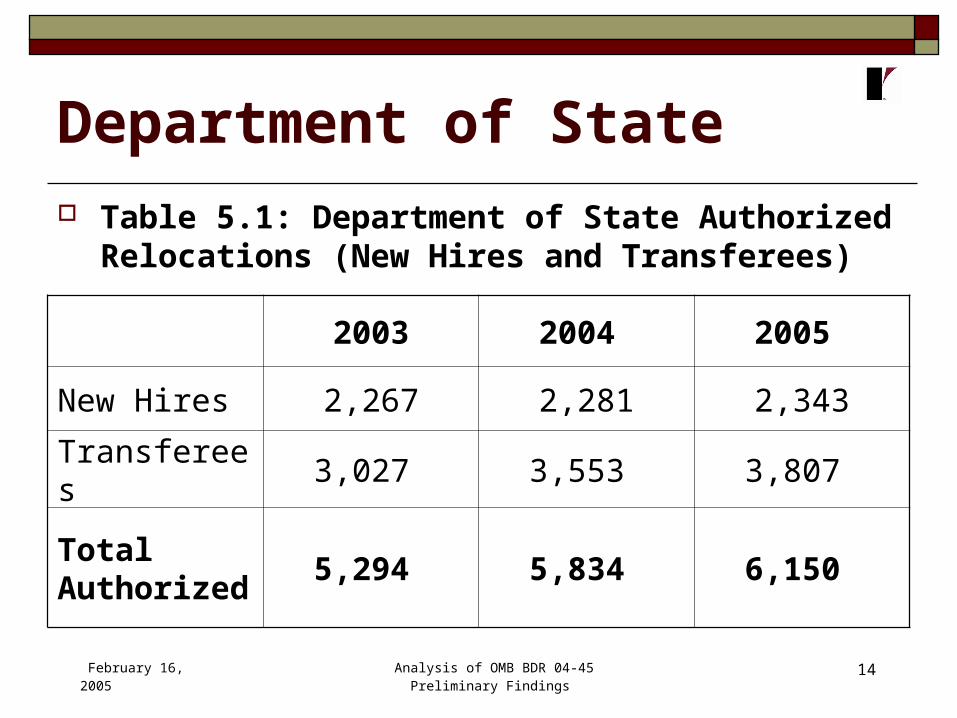
Department of State
Table 5.1: Department of State Authorized Relocations (New Hires and Transferees)
2003 2004 2005
New Hires 2,267 2,281 2,343
Transferees 3,027 3,553 3,807
Total Authorized
5,294 5,834 6,150
February 16, 2005 Analysis of OMB BDR 04-45 Preliminary Findings
15
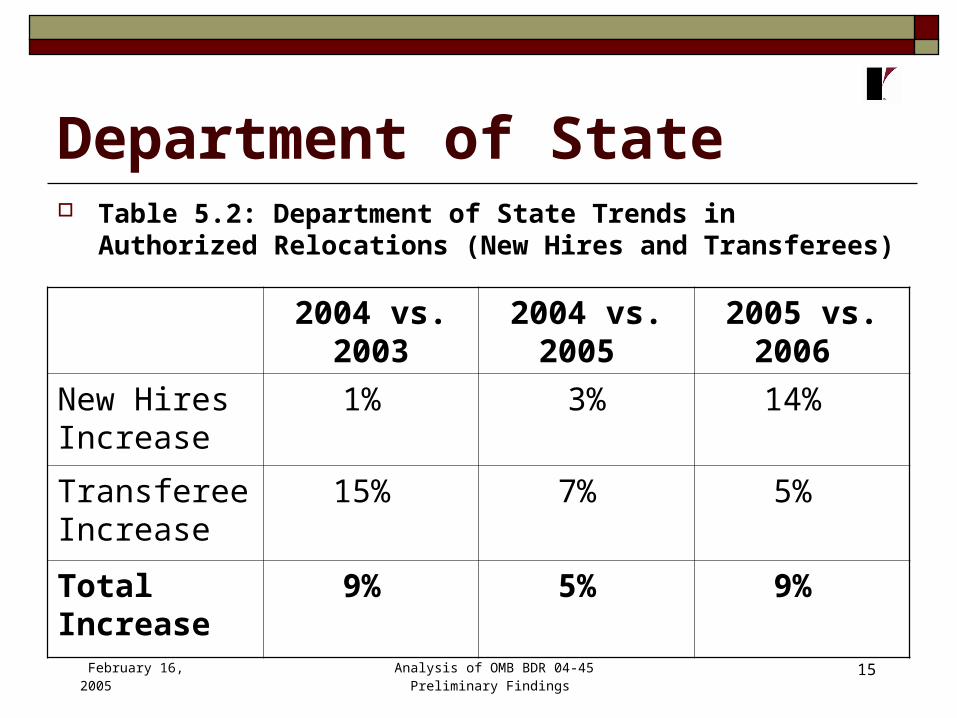
Department of State Table 5.2: Department of State Trends in Authorized
Relocations (New Hires and Transferees)
2004 vs. 2003 2004 vs. 2005 2005 vs. 2006
New Hires Increase
1% 3% 14%
Transferee Increase
15% 7% 5%
Total Increase 9% 5% 9%
February 16, 2005 Analysis of OMB BDR 04-45 Preliminary Findings
16
Department of State Relocation Budget
Department of State Budget Information (Table 5.4) Estimated budget increase from FY 2003 to
FY 2004 is 27%, with year-over-year increases for FY 2005 and FY 2006 being 3% each year

February 16, 2005 Analysis of OMB BDR 04-45 Preliminary Findings
17
Figure 5.5: State Dept. Average Budget Per Authorized Relocation
Average Payment Per Authorized Relocation
$22,569
$26,004$25,408
$23,865
$20,000
$21,000
$22,000
$23,000
$24,000
$25,000
$26,000
$27,000
2003 2004 2005 2006

February 16, 2005 Analysis of OMB BDR 04-45 Preliminary Findings
18
Department of State No information on use of relocation management
companies Responses regarding payments by category
suggest lack of a system for tracking and aggregating actual expenses associated with transfers Only expenses for house hunting trips in the
continental United States are available CONUS vs. “Other” Transfers State Dept. Employment Grades

February 16, 2005 Analysis of OMB BDR 04-45 Preliminary Findings
19
DoD: What We Know
BDR responses were limited to civilian moves only
Generalizations should not be made in haste
Few DoD respondents report data in the same way
Many respondents have only scant data

February 16, 2005 Analysis of OMB BDR 04-45 Preliminary Findings
20
DoD Total Average 2003 Budget Per Completed Relocation
Air Force Civilians $29,052Army Corps of Engineers $9,584 Defense Contract Audit Agency $23,483 Office of Inspector General $49,441
American Forces Information Service $11,707
Defense Security Service $32,080
Defense Threat Reduction Agency $55,175
Navy Bureau of Medicine & Surgery $29,067
Army Corps of Engineers $20,417 Defense Contract Audit Agency $29,052

February 16, 2005 Analysis of OMB BDR 04-45 Preliminary Findings
21
Some Reasons For Large Deviations in Averages DoDEA
All but 13 were OCONUS transfers Did not provide expense data:
“Entitlements authorized on PCS orders are obligated in two object classes and are not broken out individually. All disbursements are paid by either DFAS [Defense Finance Accounting Service] or military disbursing functions both in CONUS and overseas. The DoD disbursing system is electronic and vouchers are not provided to show the individual entitlement payments. CONUS returns are generally separations/retirements.”

February 16, 2005 Analysis of OMB BDR 04-45 Preliminary Findings
22
Air Force
Completed relocations = 1,783 (350 new hires and 1,433 current employees)
Budget Payment Categories
FY 2003 Actual Budget
Average Budget Per Completed Relo
Payment to 3rd Party Relocation Company
$11,000,000 $6,169
Other Payments (all authorized PCS & HHGs
$40,800,000 $22,883
Totals $51,800,000 $29,052

February 16, 2005 Analysis of OMB BDR 04-45 Preliminary Findings
23
Air Force Air Force only authorizes relocation services for
GS 12 through SES (Senior Executive Service) 3rd party relocation company moved only 370 If all other payments totaled $22,883 for this
group of 370, then the total average budget per completed relocation for this segment was $52,613
Average relocation budget per completed relocation for all others was, then, $18,051

February 16, 2005 Analysis of OMB BDR 04-45 Preliminary Findings
24
Air Force Specified Relocation Expense Total (Sec. 4) =
$51.8M Actual Relocation Expense Total = $25,867,000
Average cost per completed relocation = $14,508 Perhaps add in $11M for 3rd Party? Now total is $36,867,000
Average cost per completed relocation = $20,678 We do not find RITA included in the reported
totals
February 16, 2005 Analysis of OMB BDR 04-45 Preliminary Findings
25
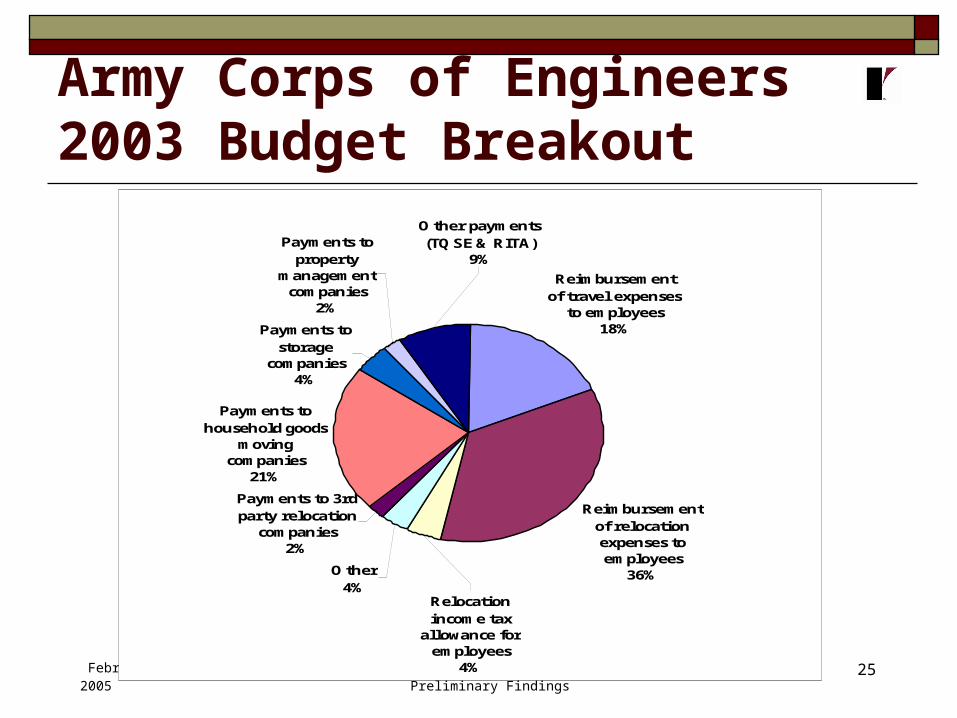
Army Corps of Engineers 2003 Budget Breakout
Reimbursement of travel expenses
to employees18%
Reimbursement of relocation expenses to employees
36%Other4%
Payments to household goods
moving companies
21%
Payments to storage
companies4%
Payments to property
management companies
2%
Relocation income tax
allowance for employees
4%
Other payments (TQSE & RITA)
9%
Payments to 3rd party relocation
companies2%
February 16, 2005 Analysis of OMB BDR 04-45 Preliminary Findings
26
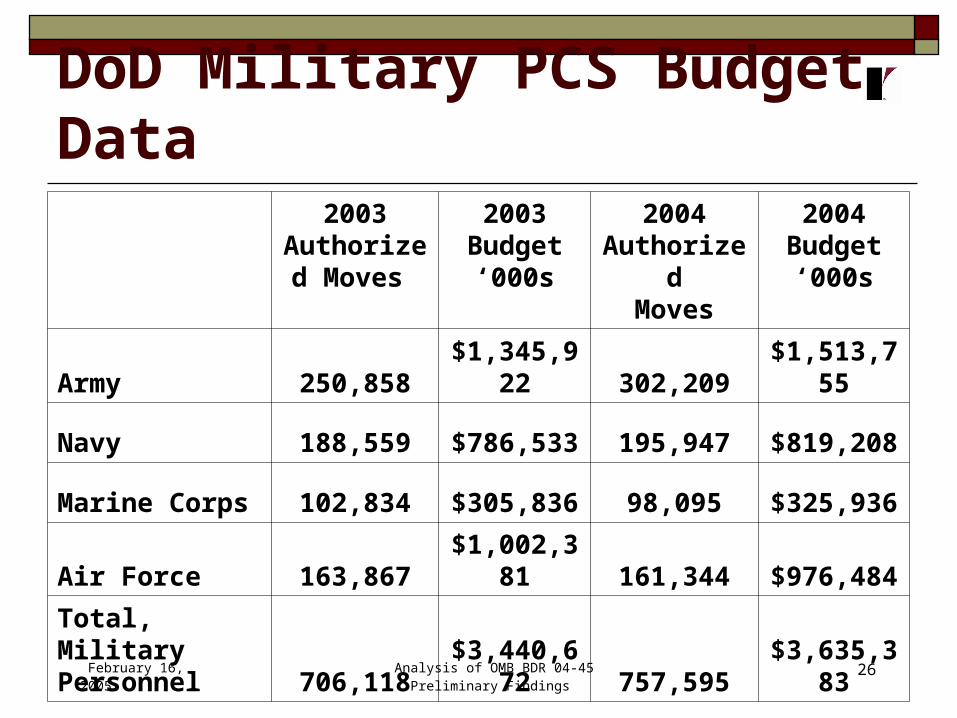
DoD Military PCS Budget Data 2003
Authorized Moves
2003 Budget‘000s
2004 Authorized
Moves
2004 Budget‘000s
Army 250,858 $1,345,922 302,209 $1,513,755
Navy 188,559 $786,533 195,947 $819,208
Marine Corps 102,834 $305,836 98,095 $325,936
Air Force 163,867 $1,002,381 161,344 $976,484
Total, Military Personnel 706,118 $3,440,672 757,595 $3,635,383

February 16, 2005 Analysis of OMB BDR 04-45 Preliminary Findings
27
DoD: What We Don’t Know Several DoD entities did not respond; most
notably, we lack data on civilian moves for US Navy (other than 3 medical facilities), USMC, NSA, and others
Some DoD responses were substantially incomplete; i.e., no Army volume or budget data, no DLA volume or budget data, etc.
No military relocation data
February 16, 2005 Analysis of OMB BDR 04-45 Preliminary Findings
28
Conclusions Changes in Federal relocation management and monitoring policy should
recognize that most Federal entities relocate few employees and only a few Federal entities relocate most employees.
10% of Respondents = 82% of 2003 Transfer Volume 10% of Respondents = 75% of 2003 Budget
Departments cannot easily aggregate relocation costs and measures of activity to leverage volume and expenditures in contracting for relocation services. Data gaps hinder comparisons among Departments. (USDA example)
Departments and agencies could benefit from implementation of
standardized BOC sub-classifications for line-item budget expenditures.

February 16, 2005 Analysis of OMB BDR 04-45 Preliminary Findings
29
Conclusions Little consistency in relocation data tracking among
agencies or within Departments. Most transferees are at the mid-to-upper
management level (comparable to “typical” transferees in the private sector).
Governmentwide, average relocation costs ($29,735 and $37,394 for 2003 and 2004, respectively) are significantly lower than the average private-sector relocation cost of $44,143.

February 16, 2005 Analysis of OMB BDR 04-45 Preliminary Findings
30
Recommendations Develop a criteria for identifying an
Extrapolation Profile Group and create model to project transfer volume and cost trends as well as costs of line-item expenses across the Federal Government.
Identify critical cost drivers that affect increases or decreases in Government relocation expenses.
Create a model that incorporates those drivers for use across the Federal Government to improve relocation budgeting and management to those budgets.

February 16, 2005 Analysis of OMB BDR 04-45 Preliminary Findings
31
Recommendations Select Departments or bureaus for follow-
up and: validate BDR responses, fill in data gaps as necessary, map relocation management processes,
particularly for departing and receiving locations, financial and reimbursement steps, and the inter-relationship of Departmental oversight and bureau policy compliance, and
identify best practices.

February 16, 2005 Analysis of OMB BDR 04-45 Preliminary Findings
32
Recommendations Separate analysis of OCONUS relocation from
CONUS relocation. Study the Department of Defense separately
from the civilian agencies. GSA should require implementation of a RMIS
through the FTR. Develop policies and management
recommendations that recognize that most Federal entities relocate fewer than 10 employees and, conversely, that a handful of agencies initiate the vast majority of relocations.

February 16, 2005 Analysis of OMB BDR 04-45 Preliminary Findings
33
Recommendations Supplement BDR data through targeted follow-on data-
gathering to identify: Number of transferees that received each type of payment noted
in BDR Sections 2 and 4 to enable estimation of the costs of revising current entitlements and benefits.
Non-cost metrics specific to the homesale program (e.g., % of inventoried homesales and employee-assisted sales); other benefit areas, such as TQSE (e.g. number of days of temporary living and whether accompanied or unaccompanied); and transferee demographics.
Qualitative assessment to determine the degree to which current relocation entitlements/benefits assist departments and agencies in meeting strategic staffing, recruitment and retention goals.