Analysis Results Concerning (i) Gamma-emitting Nuclides...
24
September 12, 2012 Analysis Results Concerning (i) Gamma-emitting Nuclides and (ii) Sr-89 and Sr-90 (Second Distribution Survey) by MEXT Since December 6, 2011, MEXT has conducted an analysis of gamma-emitting nuclides, as well as Sr-89 and Sr-90, in its Second Distribution Survey of radioactive materials discharged due to the accident at TEPCO’s Fukushima Dai-ichi NPS. The results of the analysis have been compiled below. 1. Objective of this survey MEXT carried out a radiation survey in June 2011 (hereinafter referred to as the “First Distribution Survey”), collecting soil samples at about 2,200 locations (Note 1) within an area approximately 100km from TEPCO’s Fukushima Dai-ichi NPS (hereinafter referred to as “Fukushima Dai-ichi NPS”) and in the western part of Fukushima prefecture beyond this range. MEXT analyzed the amounts of gamma-emitting nuclides (radioactive cesium, I-131, Te-129m, and Ag-110m) in all soil samples, and of Sr-89 and Sr-90 in some soil samples, collected at 100 locations within 80km from Fukushima Dai-ichi NPS. The results were compiled into distribution maps of radioactivity concentration in the soil that plot out deposition amounts of gamma-emitting nuclides (radioactive cesium, I-131, Te-129m, and Ag-110m) within an area approximately 100km from Fukushima Dai-ichi NPS and in the western part of Fukushima prefecture beyond this range (for details, see “Preparation of Distribution Map of Radiation Doses, etc. (Map of Radioactive Cesium Concentration in Soil) by MEXT” dated August 30, 2011, and other publications (Note 2) ). Regarding Sr-89 and Sr-90, maps showing the concentrations of Sr-89 and Sr-90 in soil within 80km of Fukushima Dai-ichi NPS were prepared (for details, see “Results of the Nuclide Analysis of Plutonium and Strontium by MEXT” dated September 30, 2011). In the meantime, airborne monitoring of all areas in eastern Japan (Note 3) revealed spots more than 100km from Fukushima Dai-ichi NPS in which relatively large amounts of radioactive cesium were detected. Furthermore, the First Distribution Survey revealed that Te-129m and A-110m were detected at some survey points within 100km of Fukushima Dai-ichi NPS, which suggests that these radioactive nuclides may have also been deposited more than 100km from Fukushima Dai-ichi NPS. Through the First Distribution Survey, it was further confirmed that deposition of Sr-89 and Sr-90 was not limited to 80km from Fukushima Dai-ichi NPS and that deposition amounts of Sr-89 and Sr-90 are rather large compared with Cs-137 at some of the survey points.
-
Upload
vuonghuong -
Category
Documents
-
view
213 -
download
0
Transcript of Analysis Results Concerning (i) Gamma-emitting Nuclides...

September 12, 2012
Analysis Results Concerning (i) Gamma-emitting Nuclides and (ii) Sr-89 and Sr-90 (Second Distribution Survey)
by MEXT
Since December 6, 2011, MEXT has conducted an analysis of gamma-emitting nuclides, as well as Sr-89 and Sr-90, in its Second Distribution Survey of radioactive materials discharged due to the accident at TEPCO’s Fukushima Dai-ichi NPS. The results of the analysis have been compiled below.
1. Objective of this survey
MEXT carried out a radiation survey in June 2011 (hereinafter referred to as the “First Distribution Survey”), collecting soil samples at about 2,200 locations(Note 1) within an area approximately 100km from TEPCO’s Fukushima Dai-ichi NPS (hereinafter referred to as “Fukushima Dai-ichi NPS”) and in the western part of Fukushima prefecture beyond this range. MEXT analyzed the amounts of gamma-emitting nuclides (radioactive cesium, I-131, Te-129m, and Ag-110m) in all soil samples, and of Sr-89 and Sr-90 in some soil samples, collected at 100 locations within 80km from Fukushima Dai-ichi NPS.
The results were compiled into distribution maps of radioactivity concentration in the soil that plot out deposition amounts of gamma-emitting nuclides (radioactive cesium, I-131, Te-129m, and Ag-110m) within an area approximately 100km from Fukushima Dai-ichi NPS and in the western part of Fukushima prefecture beyond this range (for details, see “Preparation of Distribution Map of Radiation Doses, etc. (Map of Radioactive Cesium Concentration in Soil) by MEXT” dated August 30, 2011, and other publications(Note 2)). Regarding Sr-89 and Sr-90, maps showing the concentrations of Sr-89 and Sr-90 in soil within 80km of Fukushima Dai-ichi NPS were prepared (for details, see “Results of the Nuclide Analysis of Plutonium and Strontium by MEXT” dated September 30, 2011).
In the meantime, airborne monitoring of all areas in eastern Japan(Note 3) revealed spots more than 100km from Fukushima Dai-ichi NPS in which relatively large amounts of radioactive cesium were detected. Furthermore, the First Distribution Survey revealed that Te-129m and A-110m were detected at some survey points within 100km of Fukushima Dai-ichi NPS, which suggests that these radioactive nuclides may have also been deposited more than 100km from Fukushima Dai-ichi NPS. Through the First Distribution Survey, it was further confirmed that deposition of Sr-89 and Sr-90 was not limited to 80km from Fukushima Dai-ichi NPS and that deposition amounts of Sr-89 and Sr-90 are rather large compared with Cs-137 at some of the survey points.

This suggested the possibility that similar trends could be found in the surrounding areas. Therefore, in order to more widely ascertain the deposition of gamma-emitting nuclides, this
survey (hereinafter referred to as the “Second Distribution Survey”) targeted wider areas than the First Distribution Survey and measured deposition amounts of gamma-emitting nuclides mainly in areas of eastern Japan in which high air dose rates were detected. Furthermore, in order to ascertain a wider range of deposition amounts of Sr-89 and Sr-90 discharged due to the accident at Fukushima Dai-ichi NPS, MEXT collected new soil samples mainly in areas of eastern Japan in which high air dose rates were detected, and analyzed the amount of Sr-89 and Sr-90 in the soil samples. At the same time, MEXT measured deposition amounts of Sr-89 and Sr-90 in soil samples collected in areas surrounding survey points measured in the First Distribution Survey which had shown large deposition amounts of Sr-89 and Sr-90 compared with Cs-137 in order to ascertain whether similar trends applied in such surrounding areas.
The results of the Second Distribution Survey were compiled after verification of their validity by experts in the relevant fields, as was the case with the First Distribution Survey.
Note 1: In the First Distribution Survey, one survey point was selected in each 2km×2km area in a grid placed on
habitable areas within 80km of Fukushima Dai-ichi NPS, and one in each 10km×10km area in a grid placed on the area from 80 to 100km of Fukushima Dai-ichi NPS and in the western part of Fukushima prefecture beyond this range. At each survey point, soil samples were collected in U-8 containers to a depth of 5cm from the surface at five different spots in a three meters square.
Note 2: “Preparation of Distribution Map of Radiation Doses, etc. (Map of Radioactive Cesium Concentration in Soil) by MEXT” (August 30, 2011), “Preparation of Distribution Map of Radiation Doses, etc. (Map of Iodine 131 Concentration in Soil) by MEXT” (September 21, 2011), and “Preparation of Distribution Map of Radiation Doses, etc. (Maps of Concentration of Tellurium 129m and Silver 110m in Soil) by MEXT (October 31, 2011)
Note 3: “Results of the Fourth Airborne Monitoring Survey by MEXT” (dated December 16, 2011), Reference 1 “Air dose rates at 1m above the ground surface throughout all of East Japan, reflecting the results of the fourth airborne monitoring (Converted into the value as of November 5, 2011)”
2. Details of this survey (i) Measurement of deposition amounts of gamma-emitting nuclides ○ Survey points (1,016 locations)
Deposition amounts of gamma-emitting nuclides were measured mainly in areas where the results of the airborne monitoring of all of eastern Japan showed relatively high air dose rates (0.2μSv/h or higher), equivalent to an annual dose of 1mSv.(Note 4) One survey point was selected in each 5km×5km area in a grid placed on areas in which air dose rates of 0.2μSv/h or higher had been measured, and one in each 10km×10km area in a grid placed on areas in which air dose rates of 0.2μSv/h or lower had been measured. Note 4: Measurements were made in some areas of Tokyo and ten other prefectures (Fukushima, Ibaraki, Iwate,
Kanagawa, Gunma, Saitama, Chiba, Tochigi, Miyagi, and Yamanashi). Areas in which air dose rates are high due to the influence of natural radionuclides were excluded.
○ Measuring organizations: Japan Atomic Energy Agency, RIKEN, L'Institut de Radioprotection et
de Sûreté Nucléaire (IRSN), Tsukuba University, Japan Chemical Analysis Center, Institute of Radiation Measurements, and Nuclear Safety Technology Center

○ Items covered: Deposition amounts of gamma-emitting nuclides on the ground surface per unit area [Bq/m2]
○ Survey period: December 13, 2011 – May 29, 2012 ○ Survey method:
Through the First Distribution Survey, it was confirmed that deposition amounts of radioactive nuclides on the ground surface vary even within small areas (3 meters square). Therefore, in the Second Distribution Survey, we carried out in-situ measurements using germanium semiconductor detectors.(Note 5) Using this method, which enables the evaluation of average deposition amounts at the measuring points, we measured the deposition amounts of gamma-emitting nuclides at as many points as possible.
At survey points which had shown very high air dose rates or where it was otherwise found that proper in-situ measurement would be difficult, we carried out the measurements in the manner used in the First Distribution Survey: collecting soil samples to a depth of 5cm from the surface at five different spots surrounding each survey point, stirring the collected soil samples well, and conducting nuclide analysis using fixed germanium semiconductor detectors (measurement time was around one hour). Note 5: These measurements were conducted by analyzing the average concentration of radioactive materials
accumulated in soil by installing portable germanium semiconductor detectors in the environment (at flat places without any buildings, etc. nearby), carrying out measurements of the overall soil surface, and measuring the gamma rays emitted by radiation sources distributed in the soil. This survey was conducted based on MEXT's Radiation Measurement Method Series, “In-situ Measurement Using Germanium Semiconductor Detectors” and by referring to ICRU report 53 as a parameter to show the vertical distribution of radionuclides in soil. 0 to 1 year was to have elapsed since deposition and 3mm or more in precipitation was to have fallen. The measurement time was to be one hour in principle, but for some measuring points, the measurement time was shortened after confirming the measurement’s statistical accuracy.
○ Correction of the gamma-emitting nuclide measurement results:
Considering the physical half-lives of radionuclides (Cs-134: 2.0648 years; Cs-137: 30.1671 years; Ag-110m: 249.95 days), the obtained values were corrected for their decay as of March 1, 2012, the midpoint of the survey period (December 13, 2011 – May 29, 2012).
(ii) Measurement of Sr-89 and Sr-90 deposition amounts ○ Survey points (63 samples from 60 locations)
This survey targeted the following two areas. 1) Areas more than 80km from Fukushima Dai-ichi NPS (50 samples from 50 locations)
Excluding areas 80km from Fukushima Dai-ichi NPS covered by the First Distribution Survey, we collected new soil samples in areas where airborne monitoring of all of eastern Japan had shown relatively high air dose rates (0.2μSv/h or higher),(Note 6) and measured the deposition amounts of Sr-89 and Sr-90. Survey points were determined by apportioning areas showing air dose rates of 0.2μSv/h or higher into 5km×5km grids and selecting points evenly from these grid areas (50 locations: 50 samples).

Note 6: Measurements were carried out for some areas in Tokyo and nine other prefectures (Fukushima, Ibaraki, Iwate, Gunma, Saitama, Chiba, Tochigi, Miyagi, and Yamanashi). Areas in which air dose rates are high due to the influence of natural radionuclides were excluded.
2) Soma City and surrounding areas (13 samples from 10 locations)
The First Distribution Survey ascertained that a sample collected at one point in Soma City showed very large ratios of deposition amounts of Sr-89 and Sr-90 against those of Cs-137 (hereinafter referred to as “ratios of Sr-89 and Sr-90 against Cs-137”), compared with samples collected at other points.
This time, we analyzed the other four samples collected at this point (hereinafter referred to as “Soma City Point 1”) during the First Distribution Survey, and also conducted an analysis of Sr-89 and Sr-90 with regard to one sample each selected from those collected from nine points surrounding Soma City Point 1 in the First Distribution Survey that contained the largest amount of Cs-137.
(Reference 1) Results of the First Distribution Survey (deposition amounts of Sr-89 and Sr-90 contained in soil samples collected at Soma City Point 1)
○ Measuring organization: Japan Chemical Analysis Center ○ Items covered: Deposition amounts of Sr-89 and Sr-90 on the ground surface per unit area
[Bq/m2] ○ Sampling period: December 17, 2011 – February 9, 2012 (period for collecting soil samples at
survey points in areas more than 80km from Fukushima Dai-ichi NPS showing air dose rates of 0.2μSv/h or higher)
○ Survey method: We conducted radiochemical analysis of the following soil samples using low background
beta-ray counters for around 60 minutes. The amounts sampled and the detection limits were as follows. 1) Soil samples collected in areas more than 80km from Fukushima Dai-ichi NPS
We used sample amounts approximately three times larger than those used in the First Distribution Survey (100g compared with 30g in the First Distribution Survey) and also lowered the detection limits for Sr-89 and Sr-90. The detection limits adopted were around 100Bq/m2 for Sr-89 and around 15Bq/m2 for Sr-90.
Measurement results of the First Distribution Survey (deposition amounts of Sr-89 and Sr-90 in soil samples collected at Soma City Point 1)
Measurement results of the First Distribution Survey (ratios of Sr-89 and Sr-90 against Cs-137 in soil samples collected at Soma City Point 1)
(Reference) Measurement Results of the First Distribution Survey (average ratios of Sr-89 and Sr-90 against Cs-137 contained in soil samples, out of the 100 samples for which measurements were carried out in the First Distribution Survey)
Sr-89 7,800 (Bq/m2) 1.9×10⁻¹ 9.8×10⁻³ Sr-90 2,400 (Bq/m2) 5.8×10⁻² 2.6×10⁻³

2) Soil samples collected at Soma City Point 1 and the surrounding areas We used 30g samples collected at the relevant points as we did at the time of the First
Distribution Survey, and measured the deposition amounts of Sr-89 and Sr-90. The detection limits adopted were around 300Bq/m2 for Sr-89 and around 40Bq/m2 for Sr-90.
○ Correction of the Sr-89 and Sr-90 measurement results:
Considering the physical half-lives of Sr-89 and Sr-90 (Sr-89: 50.53 days; Sr-90: 28.79 years), the obtained values were corrected for their decay as of January 13, 2012, the midpoint of the survey period (December 17, 2011 – February 9, 2012).
3. Results of this survey 3.1 Results of measurement of deposition amounts of gamma-emitting nuclides ○ See the following URL for the gamma-emitting nuclide (Cs-134, Cs-137, and Ag-110(Note7))
measurement results obtained in this survey. URL: http://radioactivity.mext.go.jp/en/list/269/list-1.html
In this survey, radioactive cesium was detected at all survey points, but Ag-110m was detected only at some points in Fukushima, Iwate, Ibaraki, Gunma, Tochigi, and Miyagi prefectures (detection limits were around 20 to 200Bq/m2). The First Distribution Survey showed that Te-129m(Note 7) had been deposited on the soil surface over a relatively wide area, but it was not detected at all in this survey as its physical half-life is 33.6 days. Note 7: Ag-110m and Te-129m have the same atomic number and mass as Ag-110 and Te-129. However, as there
are multiple nuclides with different energy levels, the letter “m,” indicating that the substance is in a metastable state, is added to distinguish radioactive nuclides with higher relative energy levels.
○ The results of the Cs-134, Cs-137, and Ag-110m measurements obtained in this survey were compiled into distribution maps of radioactivity concentration in the soil (Note 8) showing their deposition levels in different colors, as shown in Attachments 1, 2, and 3. In preparing these maps, we used the results of the in-situ measurements for survey points where we carried out such measurements using germanium semiconductor detectors, and for other survey points where we newly collected and analyzed samples, we used arithmetic mean values for the measurement results for samples collected at five different spots at each survey point in the same manner as in the First Distribution Survey. With regard to Ag-110m, the measurement results from the samples collected at the five different spots at each survey point sometimes contained values below detection limits. For such survey points, the deposition amounts of Ag-110m were determined as follows, in the same manner as in the First Distribution Survey: ・Where one or more of the five samples collected at the same point showed values above the
detection limit, the arithmetic mean value of the measured values above the detection limit and the reference values for those below the detection limit shall be used.
・Where all samples collected at the same point showed values below the detection limit, the measurement results for said point were deemed not detectable.

Note 8: These maps show the distribution of radioactivity remaining near the soil surface per unit area, and the term “distribution maps of radioactivity concentration in the soil” is used for convenience.
○ Additionally, in order to capture details of the distribution of Cs-134, Cs-137, and Ag-110m, we
prepared distribution maps adding decay-compensated values for the results of the First Distribution Survey (see Attachment 1 (Reference), Attachment 2 (Reference), and Attachment 3 (Reference)). With the assumption that changes in the deposition amounts since the time of the First Distribution Survey (June 14, 2011) would only result from decay, the deposition amounts of Cs-134, Cs-137, and Ag-110m obtained at each survey point from the First Distribution Survey were corrected for their decay as of March 1, 2012, considering their physical half-lives.
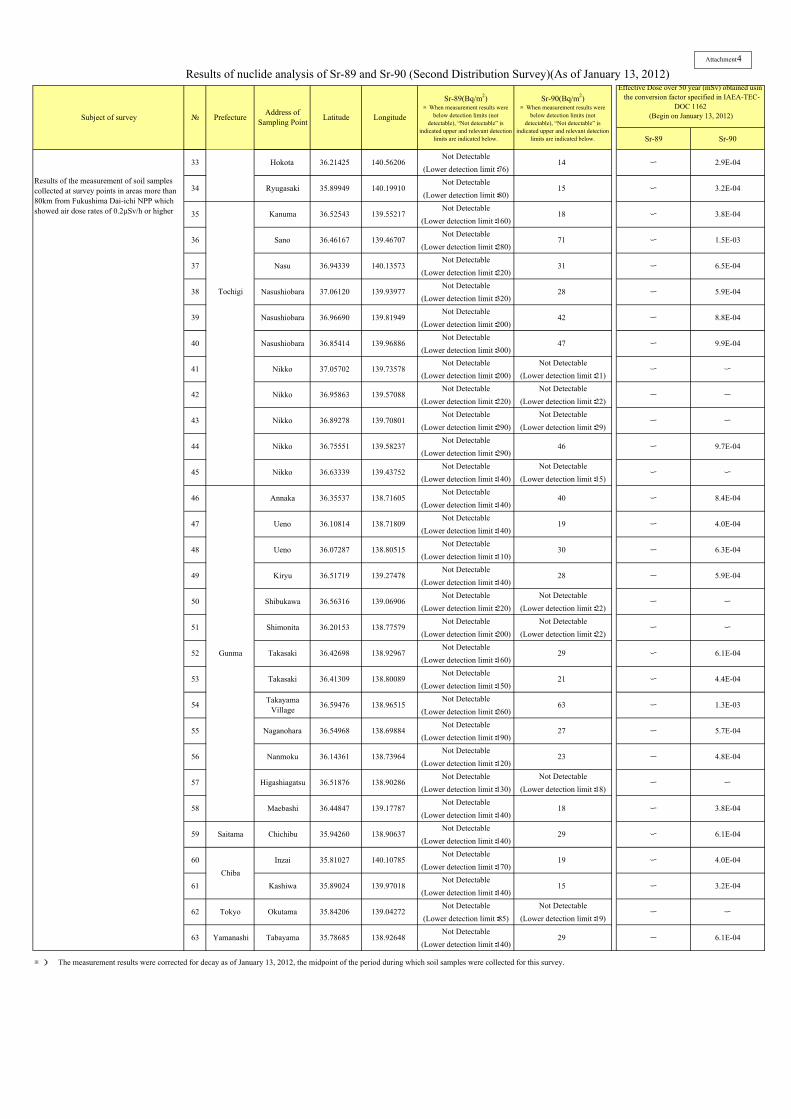
3.2 Results of the measurement of deposition amounts of Sr-89 and Sr-90 ○ The results of the Sr-89 and Sr-90 nuclide analysis in this survey are provided in Attachment 4.
In the First Distribution Survey, Sr-89 was detected as far as the border of the targeted 80km radius from Fukushima Dai-ichi NPS, but Sr-89 was not detected at all in this survey as its physical half-life is short (50.53 days).
○ The results of the Sr-89 and Sr-90 measurements in this survey were compiled into a distribution map as shown in Attachment 5.
○ Although Sr-89 was not detected at all survey points in this survey, in order to capture details of the distribution of Sr-90, we also prepared a distribution map adding decay-compensated values for the results of the First Distribution Survey (see Attachment 5 (Reference)). With the assumption that changes in the deposition amounts since the time of the First Distribution Survey (June 14, 2011) would only result from decay, the Sr-90 deposition amounts obtained at each survey point through the First Distribution Survey were corrected for its decay as of January 13, 2012, considering its physical half-life (28.79 years).
○ This time, we collected 13 new samples at 10 locations near Soma City Point 1, where the ratios of Sr-89 and Sr-90 against Cs-137 were the largest in the First Distribution Survey, so as to ascertain the deposition of radioactive strontium around these areas. Sr-89 was not detected in any of these 13 samples. Sr-90 was detected in some of them, but in very small amounts (around 1/50 to 1/25 of the amounts detected in the samples collected at Soma City Point 1 in the First Distribution Survey).
4. Considerations 4.1 Overall considerations ○ Through the First and Second Distribution Surveys, the distribution of Cs-134, Cs-137, and
Ag-110m over wide areas was ascertained in detail. These results are expected to be utilized for the assessment of exposure doses, examination of the status of the radioactive plume discharged by Fukushima Dai-ichi NPS, and clarification of the route through which these radioactive materials came to be deposited on the ground surface.
○ With the assumption that a person would remain for fifty years at the points where the largest deposition amounts of Cs-134, Cs-137, Ag-110m, and radioactive strontium were detected in the

Second Distribution Survey, we calculated the estimated effective dose of inhalation exposure that would be caused by breathing airborne soil and of the external exposure from the soil (hereinafter such effective dose shall be referred to as the “effective dose over 50 years”) based on the procedures for dose evaluation during a radiological emergency proposed by the IAEA.(Note 9) As a result, it was confirmed that the effective doses over 50 years at the points where the largest deposition amounts of Cs-134 and Cs-137 were detected this time were considerably larger than the doses at points where the largest deposition amounts of Ag-110m and radioactive strontium were detected. These results were the same as those obtained through the First Distribution Survey. Note 9: Method to assess exposure levels described in IAEA-TECDOC-955, 1162
Presuming that a radioactive nuclide deposited on the ground stays on that spot, this method defines the procedures to evaluate effective doses for a certain period of time after the nuclide is deposited on the ground surface (for the first month, for the second month, and for 50 years). The effective doses thus obtained include external exposure doses and committed doses caused by the inhalation of resuspended radioactive nuclides. In the calculation of effective doses, consideration was given to the effects of radionuclide decay, nuclear transmutation, and weathering. Furthermore, in order to assess inhalation exposure caused by resuspended radioactive nuclides on the safer side, 10-6/m was adopted as the resuspension factor, which is larger than the value actually measured at the time of the nuclear accident.
(Reference 2) Effective doses over 50 years at points where the largest deposition amounts of Cs-134,
Cs-137, Ag-110m, and Sr-90 were detected in this survey (i) Cs-134 (6.5×10⁶Bq/m2): 33mSv (ii) Cs-137 (9.1×10⁶Bq/m2): 1.2×10³mSv (iii) Ag-110m (1.3×10⁴Bq/m2): 0.50mSv (iv) Sr-90 (130Bq/m2): 0.0027mSv
○ The effective doses over 50 years of Cs-134 and Cs-137 are very large compared with those of
Ag-110m and radioactive strontium. Therefore, when assessing exposure doses or implementing decontamination in the future, we should continue to focus attention on the deposition amounts of Cs-134 and Cs-137.
4.2 Considerations related to the gamma-emitting nuclide measurement results ○ In the First Distribution Survey, it was confirmed that the ratios of deposition amounts of I-131
and Te-129m against those of radioactive cesium showed certain characteristics by region, while the deposition amounts of I-131 and Te-129m were consistent. However, there was no clear regional trend in the ratios of deposition amounts of Ag-110m against those of radioactive cesium.
○ The Second Distribution Survey, which broadened the targeted areas, revealed survey points showing similar ratios of deposition amounts of Ag-110m against those of Cs-137 from Nakadori district in Fukushima prefecture to Gunma prefecture, as indicated in Attachment 6. It was also confirmed that at some points in the coastal areas of Fukushima prefecture, located on the south and north sides of Fukushima Dai-ichi NPS, the ratios of deposition amounts of Ag-110m against those of Cs-137 were higher than in areas from Nakadori district in Fukushima prefecture to Gunma prefecture.

○ In order to verify the validity of the gamma-emitting nuclide measurement results, we checked for correlations between deposition amounts of Cs-134 and Cs-137 as measured in this survey. As a result, it was confirmed that they showed very clear correlations, irrespective of the measuring point, and that the air dose rates obtained based on in-situ measurement results coincided with air dose rates measured using NaI survey meters at points where in-situ measurement was carried out. Given these facts, it was verified that gamma-emitting nuclides were properly measured in this survey (for details, see Attachment 7).
○ As shown in Attachment 8, we indicated the Cs-137 deposition amounts obtained through this survey on a map showing the results of nationwide airborne monitoring (Cs-137 deposition amounts),(Note 10) and confirmed that the results of the measurement of Cs-137 in this survey generally indicates trends similar to those indicated by the results of the airborne monitoring, although with some locally observed differences due to differences in the measurement methods. Note 10: The results shown in “(i) Results of Airborne Monitoring Survey in Hokkaido and (ii) Revision to the
Results of Airborne Monitoring Survey over the Eastern Part of Japan with Detailed Consideration of the Influence of Natural Radionuclides” (dated July 27, 2012), Reference 4, “Measurement Results of the Airborne Monitoring Surveys Conducted by MEXT Nationwide (Deposition of Cs-137 on the ground surface nationwide)”
4.3 Considerations related to the Sr-89 and Sr-90 measurement results (i) Consideration of the range of deposition of radioactive strontium discharged due to the
accident at Fukushima Dai-ichi NPS ○ In this survey, detection limits were lowered to about one-third of those adopted in the First
Distribution Survey to measure the deposition amounts of Sr-89 and Sr-90. Even so, Sr-89 was not detected at all in areas outside the 80km-range from Fukushima Dai-ichi NPS as its physical half-life is short. Sr-90 was detected, but the values obtained were all within the range caused by past nuclear testing in the atmosphere(Note 11) when compared with the results of the nationwide survey conducted from FY1999 to FY2009, prior to the accident at Fukushima Dai-ichi NPS. Given these facts, it can be said that radioactive strontium discharged due to the accident at Fukushima Dai-ichi NPS was not detected in areas more than 80km from the NPS in this survey. Note 11: Sr-90 – Detection limit to 950Bq/m2 (average of detected values: 79Bq/m2)
○ However, “Sr-90 Analysis Results from the Monitoring of Environmental Radioactivity Levels
by Prefecture (Fallout)” (dated July 24, 2012) revealed that Sr-90(Note 12) radiation levels in fallout samples collected in March or April 2011 in Tokyo and in 9 other prefectures(Note 13) exceeded the maximum Sr-90(Note 14) radiation levels measured nationwide before the accident during the 11 years from FY1999 to FY2009. In light of this, it is believed Sr-90 may have fallen in Tokyo and in these 9 other prefectures due to the accident at Fukushima Dai-ichi NPS but in amounts not large enough to affect the depositions amounts of Sr-90 in soil measured before the accident. Note 12: Airborne material, such as dust, which falls from the air due to rain and wind, is collected each month in
large basins installed by prefectures, and beta rays from Sr-90 are measured for these collected samples.

Note 13: Akita, Iwate, Ibaraki, Kanagawa, Gunma, Saitama, Tochigi, Chiba, and Yamagata prefectures Note 14: The results of the Monitoring of Environmental Radioactivity Levels in fallout from April 2000 to
February 2011. Sr-90 detected during this period originated from past nuclear tests, etc. and a maximum value of 0.30MBq/km2 (0.30Bq/m2) was measured in Hokkaido in February 2006.
(ii) Considerations related to measurement results concerning soil samples collected around
Soma City Point 1 ○ In this survey, in order to ascertain the deposition of radioactive strontium in areas around Soma
City Point 1, where the ratios of Sr-89 and Sr-90 against Cs-137 were the largest in the First Distribution Survey, we performed new measurements of the deposition amounts of Sr-89 and Sr-90 with regard to 13 soil samples collected in June 2011. As a result, Sr-89 was not detected at all, and the amounts of Sr-90 detected were very small at around 1/50 to 1/25 of the amounts detected in samples collected at Soma City Point 1 in the First Distribution Survey. Accordingly, it was confirmed that the ratios of deposition amounts of radioactive strontium against those of radioactive cesium are not especially large characteristically around these areas around Soma City Point 1, but the deposition of radioactive strontium on soil varies more significantly than that of radioactive cesium.
○ Furthermore, we newly measured the deposition amounts of Sr-89 and Sr-90 in the 30g soil samples used to measure the deposition amounts of Sr-89 and Sr-90 at Soma City Point 1 in the First Distribution Survey, but neither Sr-89 nor Sr-90 was detected this time. We also confirmed that the deposition amounts of radioactive strontium vary even among the 100g soil samples collected at the same survey point (Soma City Point 1).
○ In order to ascertain the factors influencing the deposition amounts of Sr-90, we checked for changes in the ratios of deposition amounts of Sr-90 against those of Cs-137 in the results of the First Distribution Survey. As indicated in Attachment 9, the deposition amounts of Sr-90 were around 1/1000 of those of Cs-137 at many survey points. However, as can be seen in the measurement results for Soma City Point 1 (measured in the First Distribution Survey), deposition amounts of Sr-90 only occasionally vary up to around one-tenth of those of Cs-137.
<Contact point> Emergency Operation Center, MEXT Kato (Extension 4604、4605) TEL:03-5253-4111(Representative)

(Attachment 1)Results of nuclide analysis of Cs-134 (Results of the Second Distribution Survey)
LegendDeposition amounts of Cs-134 (Bq/m2)
(As of March 1, 2012)
Points where values were belowdetection limits
Mesh 5km 10kmHabitable area
Non-habitable area
※ ”×” in the map indicates points where measurement results were below detection limits in the Second Distribution Survey.
Fukushima Dai-ichi NPS
Background image: Denshi Kokudo

(Attachment 2)
Results of nuclide analysis of Cs-137 (Results of the Second Distribution Survey)
Fukushima Dai-ichi NPS
LegendDeposition amounts of Cs-137 (Bq/m2)
(As of March 1, 2012)
Mesh 5km 10kmHabitable area
Non-habitable area
Background image: Denshi Kokudo

(Attachment 3)
Results of nuclide analysis of Ag-110m (Results of the Second Distribution Survey)
Fukushima Dai-ichi NPS
LegendDeposition amounts of Ag-110m (Bq/m2)
(As of March 1, 2012)
Points where values were belowdetection limits
Mesh 5km 10kmHabitable area
Non-habitable area
※ ”×” in the map indicates points where measurement results were below detection limits in the Second Distribution Survey.Background image: Denshi Kokudo
Results of nuclide analysis of Cs-134 (Results of the First Distribution Survey( 1) were added to those of the Second Distribution Survey)
(Attachment 1 Reference)
Fukushima Dai-ichi NPS
LegendDeposition amounts of Cs-134 (Bq/m2)
(As of March 1, 2012)First Distribution Survey(decay correction as of March 1, 2012)
Second DistributionSurvey
Points where values were belowdetection limits
Mesh 5km 10kmHabitable area
Non-habitable area
※1 Considering the physical half-life of Cs-134 (2.0648 years), the results of the first distribution survey were corrected for its decay as of March 1, 2012. ※2 ”×” in the map indicates points where measurement results were below detection limits in the Second Distribution Survey.
Background image: Denshi Kokudo

(Attachment 2 Reference)Results of nuclide analysis of Cs-137
(Results of the First Distribution Survey( 1) were added to those of the Second Distribution Survey)
Fukushima Dai-ichi NPS
LegendDeposition amounts of Cs-137 (Bq/m2)
(As of March 1, 2012)First Distribution Survey(decay correction as of March 1, 2012)
Second DistributionSurvey
Mesh 5km 10kmHabitable area
Non-habitable area
※ Considering the physical half-life of Cs-137 (30.1671 years), the results of the first distribution survey were corrected for its decay as of March 1, 2012.
Background image: Denshi Kokudo

(Attachment 3 Reference)
Results of nuclide analysis of Ag-110m (Results of the First Distribution Survey( 1) were added to those of the Second Distribution Survey)
Fukushima Dai-ichi NPS
LegendDeposition amounts of Ag-110m (Bq/m2)
(As of March 1, 2012)First Distribution Survey(decay correction as of March 1, 2012)
Second DistributionSurvey
Points where values were belowdetection limits
Mesh 5km 10kmHabitable area
Non-habitable area
※1 Considering the physical half-life of Ag-110m (249.95 days), the results of the first distribution survey were corrected for its decay as of March 1, 2012. ※2 ”×” in the map indicates points where measurement results were below detection limits in the Second Distribution Survey.
Background image: Denshi Kokudo

Sr-89 Sr-90
Not Detectable Not Detectable
(Lower detection limit:800) (Lower detection limit:62)Not Detectable Not Detectable
(Lower detection limit:850) (Lower detection limit:75)Not Detectable
(Lower detection limit:750)Not Detectable
(Lower detection limit:680)Not Detectable ー
(Lower detection limit:260)Not Detectable Not Detectable
(Lower detection limit:200) (Lower detection limit:56)Not Detectable
(Lower detection limit:300)Not Detectable
(Lower detection limit:710)Not Detectable
(Lower detection limit:190)Not Detectable Not Detectable
(Lower detection limit:670) (Lower detection limit:59)Not Detectable
(Lower detection limit:700)Not Detectable
(Lower detection limit:220)Not Detectable
(Lower detection limit:510)
Not Detectable Not Detectable(Lower detection limit:250) (Lower detection limit:25)
Not Detectable Not Detectable
(Lower detection limit:250) (Lower detection limit:25)
Not Detectable Not Detectable(Lower detection limit:190) (Lower detection limit:19)
Not Detectable(Lower detection limit:320)
Not Detectable(Lower detection limit:160)
Not Detectable(Lower detection limit:220)
Not Detectable(Lower detection limit:610)
Not Detectable(Lower detection limit:250)
Not Detectable Not Detectable(Lower detection limit:140) (Lower detection limit:16)
Not Detectable Not Detectable(Lower detection limit:130) (Lower detection limit:13)
Not Detectable(Lower detection limit:200)
Not Detectable Not Detectable(Lower detection limit:220) (Lower detection limit:22)
Not Detectable(Lower detection limit:150)
Not Detectable(Lower detection limit:170)
Not Detectable Not Detectable(Lower detection limit:130) (Lower detection limit:18)
Not Detectable Not Detectable(Lower detection limit:100) (Lower detection limit:21)
Not Detectable(Lower detection limit:170)
Not Detectable Not Detectable(Lower detection limit:91) (Lower detection limit:21)
Not Detectable(Lower detection limit:160)
Subject of survey
37.78872
Inashiki
Results of the measurement of soil samplescollected at survey points in areas more than80km from Fukushima Dai-ichi NPS whichshowed air dose rates of 0.2μSv/h or higher
28
Results of themeasurement of foursamples out of the fivecollected at Soma CityPoint 1, which were leftunanalyzed in the firstdistribution survey
Results of themeasurement of ninesamples collected atsurvey points in gridareas near Soma CityPoint 1
26
20
19
23
Nishigo 37.20567
Nishigo
ー ー
ー 4.4E-04
ー
140.33894
ー ー
1.1E-03
ー 6.1E-0429
ー52
32
Omitama
30
27
29
31 36.03006 140.16188
140.33113
36.86988 140.30412
140.64966
35.94495
14
ー
21
140.70723Hitachi 36.69354
140.90665
35.94371
Ibaraki 140.0445935.97949
Tsuchiura
Tsukubamirai
Daigo
ー
2.9E-04
ー
ー
130
6.1E-04
ー
36.15421
Kashima
25 Kurihara 38.80324Miyagi
24 38.35123Ishinomaki 8.4E-04
ー
ー 1.7E-03
ー
Fukushima
37.11828
141.42111
ー141.09741
ー
39.00941
Iwate
Ichinoseki
Ichinoseki
141.07870
ー140.11592
139.77026
140.11722
21
22
2.7E-03
ー
ー
ー
Oshu
141.1730338.96920 ー
38.89489
ー
ー
ー
9.7E-04
3.6E-04
ー
1.1E-03
9.9E-04
1.9E-03
1.1E-03ー
ー
ー
16 Kitakata 37.64364
37.80517
Aizumisato
37.82283
37.80664 140.91836
140.89547
11 37.82450 140.94047
10
ー
1.9E-03
65 1.4E-03
ー
1.3E-03
ー
61
53
ー
52
91
46
17
47
ー
ー
ー
ー
18 Sukagawa 37.31635
ー
1.1E-03
ー
ー57 1.2E-03
ー140.91464
140.91464
140.91464
ー
Results of nuclide analysis of Sr-89 and Sr-90 (Second Distribution Survey)(As of January 13, 2012)
Address ofSampling PointPrefecture
Fukushima
89
Latitude Longitude
Sr-89(Bq/m2)※When measurement results were
below detection limits (notdetectable), “Not detectable” is
indicated upper and relevant detectionlimits are indicated below.
Sr-90(Bq/m2)※When measurement results were
below detection limits (notdetectable), “Not detectable” is
indicated upper and relevant detectionlimits are indicated below.
Effective Dose over 50 year (mSv) obtained usingthe conversion factor specified in IAEA-TEC-
DOC 1162(Begin on January 13, 2012)
140.91464 ー37.79617
37.79617
Soma
37.79617
37.79617
53
140.89053
140.94442
37.78739
7 37.7971
37.81253
140.87977
4
140.934948
6
140.89531
139.95890
139.81851
37.82344
Sirakawa 37.10048
5
140.13693
140.22464
37.52814
140.91789
17
Aizu Wakamatsu
37.47514
12
Measurement resultsfor survey points nearSoma City Point 1,where the ratios ofdeposition amounts ofSr-89 and Sr-90against those of Cs-137 were larger thanat other survey pointsin the first distributionsurvey
13
3
2
1
№
15
14
9
29
82
40
Attachment4
Sr-89 Sr-90
Subject of survey
Results of nuclide analysis of Sr-89 and Sr-90 (Second Distribution Survey)(As of January 13, 2012)
Address ofSampling PointPrefecture Latitude Longitude
Sr-89(Bq/m2)※When measurement results were
below detection limits (notdetectable), “Not detectable” is
indicated upper and relevant detectionlimits are indicated below.
Sr-90(Bq/m2)※When measurement results were
below detection limits (notdetectable), “Not detectable” is
indicated upper and relevant detectionlimits are indicated below.
Effective Dose over 50 year (mSv) obtained usingthe conversion factor specified in IAEA-TEC-
DOC 1162(Begin on January 13, 2012)№
Attachment4
Not Detectable(Lower detection limit:76)
Not Detectable(Lower detection limit:80)
Not Detectable(Lower detection limit:160)
Not Detectable(Lower detection limit:280)
Not Detectable(Lower detection limit:220)
Not Detectable(Lower detection limit:320)
Not Detectable(Lower detection limit:200)
Not Detectable(Lower detection limit:300)
Not Detectable Not Detectable(Lower detection limit:200) (Lower detection limit:21)
Not Detectable Not Detectable(Lower detection limit:220) (Lower detection limit:22)
Not Detectable Not Detectable(Lower detection limit:290) (Lower detection limit:29)
Not Detectable(Lower detection limit:290)
Not Detectable Not Detectable(Lower detection limit:140) (Lower detection limit:15)
Not Detectable(Lower detection limit:140)
Not Detectable(Lower detection limit:140)
Not Detectable(Lower detection limit:110)
Not Detectable(Lower detection limit:140)
Not Detectable Not Detectable(Lower detection limit:220) (Lower detection limit:22)
Not Detectable Not Detectable(Lower detection limit:200) (Lower detection limit:22)
Not Detectable(Lower detection limit:160)
Not Detectable(Lower detection limit:150)
Not Detectable(Lower detection limit:260)
Not Detectable(Lower detection limit:190)
Not Detectable(Lower detection limit:120)
Not Detectable Not Detectable(Lower detection limit:130) (Lower detection limit:18)
Not Detectable(Lower detection limit:140)
Not Detectable(Lower detection limit:140)
Not Detectable(Lower detection limit:170)
Not Detectable(Lower detection limit:140)
Not Detectable Not Detectable(Lower detection limit:85) (Lower detection limit:19)
Not Detectable(Lower detection limit:140)
※) The measurement results were corrected for decay as of January 13, 2012, the midpoint of the period during which soil samples were collected for this survey.
Gunma
37.05702
36.85414
Results of the measurement of soil samplescollected at survey points in areas more than80km from Fukushima Dai-ichi NPP whichshowed air dose rates of 0.2μSv/h or higher
23
40
19
28
21
27
63
29
31
ー 2.9E-0433
34
36
35
37
18
63
48
51
56
55
54
57
14
59
62
61
Tokyo
Saitama
49
50
60
52
53
58
ー 6.1E-04
ー 3.2E-04
ー ー
ー
ー
3.8E-04
47
45
38
39
40
43
44
41
ー 4.0E-04
42
ー
6.1E-04
ー ー
ー 4.8E-04
46
ー
5.7E-04
ー
ー 6.3E-04
5.9E-04
ー ー
1.3E-03
140.13573 6.5E-04
ー
ー 8.4E-04
ー
71
4.4E-04
4.0E-04ー
5.9E-04
47
ー ー
ー 9.9E-04
ー
ー
ー ー
ー 6.1E-04
ー
ー
ー 9.7E-04
1.5E-03
3.8E-04
ー
8.8E-04
ー
15
46
3.2E-04
ー
ー ー
ー
ー
30
139.04272
36.51719 139.27478
138.96515
35.89024
35.81027 140.10785
138.80515
36.10814 138.71809
36.95863
139.4375236.63339
36.07287
36.41309
36.54968
36.59476TakayamaVillage
Ueno
Maebashi
Nikko
Tabayama 35.78685 138.92648Yamanashi
35.84206
Kashiwa
Okutama
Chichibu 35.94260 138.90637
Inzai
139.97018Chiba
Higashiagatsu 36.51876 138.90286
Nanmoku
Naganohara
36.14361 138.73964
138.69884
Shimonita 36.20153 138.77579
Kiryu
Ueno
36.35537 138.71605Annaka
Shibukawa 36.56316 139.06906
Takasaki
36.42698 138.92967
138.80089
36.44847 139.17787
Takasaki
Nasushiobara 139.96886
Nikko
Nikko
Nikko
139.57088
139.73578
Nasushiobara 37.06120 139.93977
Nikko
Nasu
36.46167 139.46707
139.81949Nasushiobara
36.94339
36.96690
Tochigi
Kanuma
Sano
139.58237
36.89278 139.70801
36.75551
139.5521736.52543
Ryugasaki
Hokota
35.89949 140.19910
36.21425 140.56206
29
29
15
18
28
42
19

Results of the measurement of Sr-89 and Sr-90(Results of the Second Distribution Survey)
(Attachment 5)
Not detected
Not detected
Not detectedNot detected
Not detected
Not detected
Not detectedNot detected
Not detectedNot detected
Not detected
Not detected
Not detected
Not detected
Not detectedNot detected
Not detectedNot detected
Not detected
Not detected
Not detected
Not detected
Not detected
Not detected
Not detected
Not detectedNot detected
Not detectedNot detected
Not detected
Not detected
Not detectedNot detected
Not detected
Not detected
Not detected
Not detected
Not detectedNot detected
Not detected Not detected
Not detected
Deposition amounts of Sr-89
and Sr-90 (Bq/m2) (As of January 13, 2012)
Upper: Measured value of Sr-89Lower: Measured value of Sr-90
Monitoring locationsDetected Not Detected
Mesh 5km x 5km
Mesh 10km x 10km
Habitable area
Non-habitable area
Habitable area
Non-habitable area
Fukushima Dai-ichi NPS
※ ”×” in the map indicates points where the results of the measurement of Sr-89 and Sr-90 were below detection limits in the Second Distribution Survey.
Background image: Denshi Kokudo
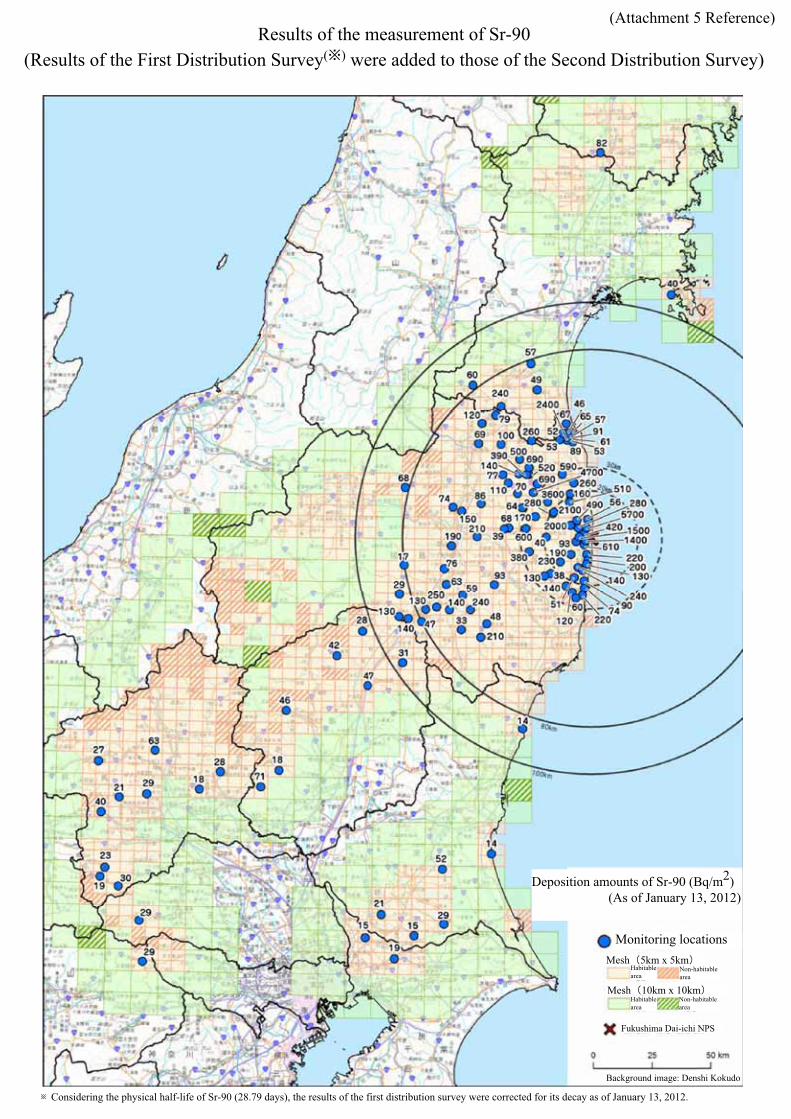
(Attachment 5 Reference)Results of the measurement of Sr-90
(Results of the First Distribution Survey( ) were added to those of the Second Distribution Survey)
Deposition amounts of Sr-90 (Bq/m2) (As of January 13, 2012)
Monitoring locationsMesh 5km x 5km
Habitable area
Non-habitable area
Habitable area
Non-habitable area
Fukushima Dai-ichi NPS
※Considering the physical half-life of Sr-90 (28.79 days), the results of the first distribution survey were corrected for its decay as of January 13, 2012.
Mesh 10km x 10km
Background image: Denshi Kokudo

(Attachment 6)Map showing the ratios of deposition amounts of Ag-110m against those of Cs-137
Results of the Second Distribution Survey
Fukushima Dai-ichi NPS
LegendRatios of deposition amounts of Ag-110m against those of Cs-137
(As of March 1, 2012)Ag-110m / Cs-137
Mesh 5km 10kmHabitable area
Non-habitable area
Background image: Denshi Kokudo

Attachment 7
Validity of Measurement Method for Gamma-emitting Nuclides Used in the Second Distribution Survey
Deposition amounts of Cs-137
Deposition amounts of Cs-134 and Cs-137 show very clear correlations, irrespective of the measuring point, and the air dose rates obtained based on in-situ measurement results coincide with air dose rates measured using NaI survey meters at points where in-situ measurement was carried out. Given these facts, it was verified that gamma-emitting nuclides were properly measured in this survey.
y = 1.0438x
R2 = 0.9912
0.00
1.00
2.00
3.00
4.00
5.00
6.00
0.00 0.50 1.00 1.50 2.00 2.50 3.00 3.50 4.00 4.50 5.00
NaIサーベイメータによる空間線量率(μGy/h)
in-situ測定により評価された空間線量率(μGy/h)
Fig. Relation of deposition amounts of Cs-134 and Cs-137 in this survey
Fig. Relation of air dose rates measured using NaI survey meters at points where in-situ measurement was carried out and air dose rates obtained based on in-situ measurement results
Air dose rates measured using NaI survey meters(μGy/h)

��8(Attachment 8)
Comparison between the results of airborne monitoring and the distribution map of Cs-137 in soil (the second distribution map)
Fukushima Dai-ichi NPS
LegendDeposition amounts of Cs-137 (Bq/m2)
Airborne monitoring (As of May 31, 2012)
Second Distribution Survey (As of March 1, 2012)
Range with no measurement results
Mesh 5km 10kmHabitable area
Non-habitable area
The background map is the distribution map of Cs-137 in Soil shown in “(i) Results of Airborne Monitoring Survey in Hokkaido and (ii) Revision to the Results of Airborne Monitoring Survey over the Eastern Part of Japan with Detailed Consideration of the Influence of Natural Radionuclides” (dated on July 24, 2012), Reference 4, “Measurement Results of the Airborne Monitoring Surveys Conducted by MEXT Nationwide (Deposition of Cs-137 on the ground surface nationwide).” ”○” on the map indicates the results of the measurement of Cs-137 in this survey.
Background image: Denshi Kokudo

Ratios of Deposition Amounts of Sr-90 against Those of Cs-137 in the First Disposition Survey
Points where the ratio of deposition amounts of Sr-90 against those of Cs-137 was much larger than at other points (measurement results at Soma City Point 1)→Deposition amounts of Sr-90 were about one-tenth of those of Cs-137, and
the ratio of deposition amounts of Sr-90 against those of Cs-137 was vary large.
Results of the measurement of four samples out of the five collected at Soma City Point 1, which were left unanalyzed in the First Distribution Survey (the results of the Second Distribution Survey)
*The results for the two samples showing values above the detection limit are indicated.→Deposition amounts of Sr-90 were around 1/1000 of those of Cs-137, showing similar
ratios as in many other survey points.
At many survey points, depositionamounts of Sr-90 were around 1/1000of those of Cs-137.
第1次調査の結果(平成23年6月14日時点)第2次調査の結果(平成24年1月13日時点)
第1次調査の結果(平成23年6月14日時点)第2次調査の結果(平成24年1月13日時点)
Attachment 9
Deposition amounts of Cs-137 (Bq/m2)
Results of the first survey(As of Jun. 14, 2011)Results of the second survey(As of Jan. 13, 2012)
[6,900μSv/each time]
[1,000μSv/year]
[600μSv/each time]
[50μSv/each time]
[50μSv/year]
[~10,000μSv/year]
[~2,400μSv/year]
[~400μSv/year]
[~200μSv/round trip]
[22μSv/year]
[10μSv/year]
Radiation dose(microsievert:μSv)
10,000
1,000
100
10
250,000
[50,000μSv/year]
Upper limit of radiation dose permitted for people who engage in emergency work.
Upper limit of radiation dose permitted for radiation workers, police , and firefighters who engage in disaster prevention.
[250,000μSv/year]
50,000
Radiation in Daily-life
Radiation dose in Guarapari(Brazil) per year.
Natural radiation dose per year.
Global average
Maximum difference of the average of natural radiation dose in each prefecture.
Gifu Kanagawa
An air travel between Tokyo and New York (RT).
(Increased cosmic radiation at high altitude.)
Evaluated dose of radiation from radioactive substance emitted from the nuclear fuel reprocessing plant per year.
Standard radiation dose from Clearance level.
Space 390 ingestion 290
Earth
480
Radon absorbed
in air 1260
Standard dose of radiation around a nuclear plant (light water reactor).
(Actual result is far below the value.)
Chest X-ray examination.
gastrointestinal X-ray examination.
Dose limit for public per year (except for medical care).
Chest CT scan
※Unit : μSv
MEXT makes this, based on "Nuclear power 2002" made by Agency of Natural Resources and Energy.
※ Sv 【Sievert】=Constant of organism effect by kind of radiation(※) × Gy 【gray】※ It is 1 in case of X ray and γ ray.