Analysis on IR
17
1 1.0 Introduction: Capital is the keynote of economic development. In this modern age, the level of economic development is determined by the proportion of capital available. 1.1 Meaning of Capital: In the ordinary sense of the word Capital means initial investment invested by businessman or owner at the time of commencing the business. Capital (economics) , a factor of production that is not wanted for itself but for its ability to help in producing other goods. Definition: Capital is a factor of production with a specific, changeable value attached to it that could, potentially, provide its owner with more wealth. It is an abstract economic concept, and, as such, has many different definitions and classifications, but the unifying feature of capital is that it has a certain value, so it in itself is a type of wealth, and it has the potential of generating more wealth. 1.2 Features of Capital: Capital has the following features. 1. Capital is a man made. 2. Capital is a perishable. 3. Capital is a human control possible. 4. Capital is a mobile. 5. Capital is a human sacrifice.
-
Upload
zeman-adnan -
Category
Documents
-
view
7 -
download
1
description
analysis on an Internship Report
Transcript of Analysis on IR

1
1.0 Introduction:
Capital is the keynote of economic development. In this modern age,
the level of economic development is determined by the proportion of capital
available.
1.1 Meaning of Capital:
In the ordinary sense of the word Capital means initial investment invested
by businessman or owner at the time of commencing the business.
Capital (economics), a factor of production that is not wanted for itself but for
its ability to help in producing other goods.
Definition:
Capital is a factor of production with a specific, changeable value attached to
it that could, potentially, provide its owner with more wealth. It is an abstract
economic concept, and, as such, has many different definitions and
classifications, but the unifying feature of capital is that it has a certain value, so
it in itself is a type of wealth, and it has the potential of generating more wealth.
1.2 Features of Capital:
Capital has the following features.
1. Capital is a man made.
2. Capital is a perishable.
3. Capital is a human control possible.
4. Capital is a mobile.
5. Capital is a human sacrifice.

2
6. Capital is a scarce.
7. Capital is a passive factor.
1.3 INTRODUCTION OF WORKING CAPITAL:
Working capital is the life blood and nerve centre of a business. Just as
circulation of blood is essential in the human body for maintaining life, working
capital is very essential to maintain the smooth running of a business. No business
can run successfully without an adequate amount of working capital.
There is operative aspects of working capital i.e. current assets which is known as
funds also employed to the business process from the gross working capital
Current asset comprises cash receivables, inventories, marketable securities held
as short term investment and other items nearer to cash or equivalent to cash.
Working capital comes into business operation when actual operation takes
place generally the requirement of quantum of working capital is determined
by the level of production which depends upon the management attitude
towards risk and the factors which influence the amount of cash, inventories,
receivables and other current assets required to support given volume of
production.
Working capital management as usually concerned with administration of the
current assets as well as current liabilities. The area includes the requirement of
funds from various resources and to utilize them in all result oriented manner. It
can be stated without exaggeration that effective working capital
management is the short requirement of long term success.

3
The importance of working capital management is indisputable; Business liability
relies on its ability to effective management of receivables, inventory, and
payables. By minimizing the amount of funds tied up in current assets. Firms are
able to reduce financing costs or increase the funds available for expansion.
Many managerial efforts are put into bringing non-optimal level of current assets
and liabilities back towards their optimal levels.
1.4 MEANING OF WORKING CAPITAL
Working capital means the funds (i.e.; capital) available and used for day
to day operations (i.e.; working) of an enterprise. It consists broadly of that
portion of assets of a business which are used in or related to its current
operations. It refers to funds which are used during an accounting period to
generate a current income of a type which is consistent with major purpose of a
firm existence.
In Accounting:

4
2.0 About Company:
Fine Foods Limited started as a Public limited company in
2002 aiming to contribute to the local development through
meeting the nutrition demand. It started its business activity
by a Fish project in the village Mondolbhog of Manikkhali UP
under PS Kotiadi, District: Kishorgoanj. Alongside its
abundant production of common water fish in the said
project it gradually bloomed through production and
marketing of fish feed, greens, cow, milk and trees of
different species. Fine Foods Limited now has launched its
another fish project by purchasing lands in village Masera of
Chandpur Union under PS Tarakanda, District: Mymensing.
The important persons and board of Directors of fine foods limited are Md.
Nazrul Islam: Chairman and Managing Director, Md. Zakir Hossain : Independent
Director, Md. Angur Khan:Independent Director, Ansar Uddin Ahmed :Sponsor,
K.M Tanjibul Alam :Sponsor.
2.1 Products:
Fine Foods Limited has mainly produced many kind of local fish.
That’s are
1. Telapia Fish
2. Rui Fish
3. Katla Fish
4. Mrigel Fish
5. Pangash Fish
6. Common Carp Fish
7. Finger link etc.
There are more items which
are under project and fine
foods limited recently launch
these kinds of products like
poultry firm, Dairy firm and
others. So though these are
current products but they are
working with a lot of other
products.

5
2.2 Projects:
Fine foods Limited has operated 2 (two) Number of project.
No. 1 is situated at Village Mondolvog
P.O - Manikkhali
P.S - Katiadi
Dist – Kishorgonj
No.2 is Situated at Villag Machhera
P.O - Chandpur
P.S - Tarakanda
Dist - Mymensingh
3.0 Trend Analysis:
In the trend analysis the trend of various important financial statement
particulars are analyzed in a time series to observe the growth and tendency of
movement of those particulars to understand their relationship with other
important factors.
3.1 Sales:
Fine Foods Limited is a rapidly growing company and it is also reflected in their
annual sales record. There are ten years data from 2002-2011. In 2010 and 2011
the graph shows the highest sell which are close to 60000000. And 2010 has the
great sell among all these ten years. But from 2004-2009 the sale was too low
compared with 2010and 2011. In that time they cannot touch the 20000000
figure.
0
10000000
20000000
30000000
40000000
50000000
60000000
70000000
1 2 3 4 5 6 7 8 9 10
Sales
Series1

6
3.2 EPS:
Fine Foods Limited sales have increased a lot in last three years. So their profit
has increased at a high percentage too. Its EPS was Tk. 1.008 in 2010 and It has
increased Tk.3.108 in 2010 although it has decreased to TK 1.58 in 2012.
3.3 Cash and cash equivalents:
The company has held regular amount of cash and cash equivalents
throughout the years. It has increased massively at early of starting the company
approximately 16000000 but from 2003 to 2011 it was too low. Though the cash
has became increase slightly from 2003 to 2011. But in 2003 a huge fall is located
in the cash sight.
-0.5
0
0.5
1
1.5
2
2.5
3
3.5
1 2 3 4 5 6 7 8 9 10
EPS
Series1

7
3.4 Inventories:
Year by year the inventory held by Fine Foods Limited has increased. It has
shown a 42.64% growth over four years. It may signal to increased demand of
the company’s product which requires holding more raw materials, work in
process and finished goods.
0
2000000
4000000
6000000
8000000
10000000
12000000
14000000
16000000
18000000
1 2 3 4 5 6 7 8 9 10
Cash & Bank Balance
Series1
0
5000000
10000000
15000000
20000000
25000000
30000000
35000000
40000000
45000000
1 2 3 4 5 6 7 8 9 10
Inventories
Series1

8
3.5 Liabilities for Expenses:
As the company’s sales has increased year by year its trade and other liabilities
has also increased. Its liabilities were Tk 250000 in 2010 and Tk 200000 in 2011
which shows a 20% decrease but from 2002 to 2011 it has decreased
approximately 50%.
3.6 Total Current Assets:
Total current assets hold by Fine Foods limited has been raised from Tk. 36000000
to TK. 50000000 in 2011. As the company has seen more purchase of their
product it is normal for to hold more current assets.
0
50000
100000
150000
200000
250000
300000
1 2 3 4 5 6 7 8 9 10
Liabilities for Expenses
Series1
0
10000000
20000000
30000000
40000000
50000000
60000000
1 2 3 4 5 6 7 8 9 10
Total Current Assets
Series1
9
3.7 Trade Creditors:
Fine Foods Limited had huge amount of borrowings in 2007 which was repaid in
2011. After that the company had again short term borrowing of Tk. 3427419 in
2007 and Tk. 3105210 in 2011.
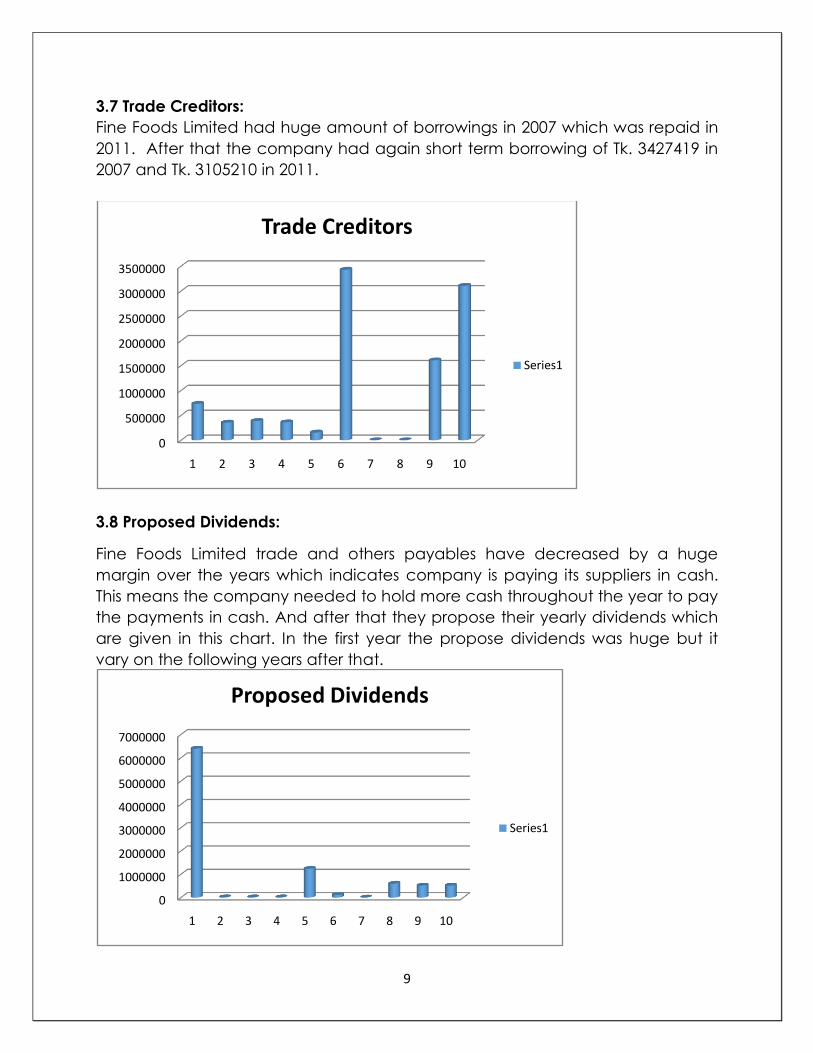
3.8 Proposed Dividends:
Fine Foods Limited trade and others payables have decreased by a huge
margin over the years which indicates company is paying its suppliers in cash.
This means the company needed to hold more cash throughout the year to pay
the payments in cash. And after that they propose their yearly dividends which
are given in this chart. In the first year the propose dividends was huge but it
vary on the following years after that.
0
500000
1000000
1500000
2000000
2500000
3000000
3500000
1 2 3 4 5 6 7 8 9 10
Trade Creditors
Series1
0
1000000
2000000
3000000
4000000
5000000
6000000
7000000
1 2 3 4 5 6 7 8 9 10
Proposed Dividends
Series1

10
3.9 Total Current Liabilities:
Total liability of the company was Tk. 13333107 in 2002 which dropped to Tk.
1689897 in 2008 but then it rose again and in 2011 the total liability held by the
company was Tk 6016053. So Fine Foods Limited holding of total liabilities was
quite stable throughout the years.
3.10 Trend Analysis:
There is a similar trend between the gross working capital and sales for
Fine Foods Limited over the year. Gross working capital is calculated by
summing up the total current assets and total current liabilities. Although
total current liabilities for the year 2009 had dropped whereas total
current assets had increased but gross working capital for the company
has increased each year. At the same time sales volume for each year
has also increased for Fine Foods Limited. So it is showing a very similar
trend and signals to a positive relationship among these variables.
0
2000000
4000000
6000000
8000000
10000000
12000000
14000000
1 2 3 4 5 6 7 8 9 10
Total Liabilities
Series1

11
There is also a very similar trend between net working capital and profit for
each year. Net working capital has increased from 2009 to 2011 and so as
profit from 2008 to 2010. But in 2011 net working capital has decreased
and profit has decreased too. A highly significant relationship is revealed
through.
0
10000000
20000000
30000000
40000000
50000000
60000000
70000000
1 2 3 4 5 6 7 8 9 10
Current Asset vs Current Liabilities vs Sales
Series1 Series2 Series3
0
2000000
4000000
6000000
8000000
10000000
12000000
14000000
16000000
18000000
1 2 3 4 5 6 7 8 9 10
Opening cash & closing cash
Series1 Series2

12
Cash inflow and outflow of Fine foods limited in the first of 2002 was too
high. In 2002 there was huge cash inflow but the next year in 2003 there
was a great fall and a huge cash outflow is shown in the graph. But the
less of the year the cash inflows are shown as similar to each year. But
in2010 the cash inflow is slightly increased.
Retained earnings are gradually increased in the fine foods limited. In the
first 7 years it was too low but gradually it becomes increase from the year
of 2009 to 2011. The highest retained earnings is shown in 2010. It is more
than 20000000 and in 2011 it is slightly decreased. But the total retained
earnings is in good position for the Fine foods Limited.
-2000000
-1500000
-1000000
-5000000
0
5000000
10000000
15000000
20000000
1 2 3 4 5 6 7 8 9 10
Cash Inflow & Outflow Model
Series1
0
10000000
20000000
30000000
1 2 3 4 5 6 78
910
Retained Earnings
Series1

13
4.0 Ratio Analysis:
In this section some of the major and relevant ratios to working capital and
profitability of the company have been analyzed. These ratios have been
calculated from 2009 to 2011. The mean, median of the company has been
measured too. Following are some of the major and relevant ratios to working
capital management are given.
2002(TK)
2003 (TK)
2004 (TK)
2005 (TK)
2006(TK)
2007(TK)
2008(TK)
2009(TK)
2010(TK)
2011(TK)
Current ratio
2.740942
2.758325
12.22184
12.87438
10.32572
6.699736
20.17254
15.86437
12.04758
8.334317
Quick Ratio
2.15719
1.496218
6.897596
7.193647
6.089656
4.240008
9.820334
2.160634
2.189264
1.657893
Cash Ratio
1.222618
0.033525
0.23149 0.306767
0.248522
0.148347
0.313988
0.598568
0.74049
0.385354
Net working Capital to sales
0.88592
0.750756
1.642877
1.639106
1.829155
1.968528
2.610197
1.268625
0.646442
0.743879
Inventory turnover in days
198.0768
264.6711
407.8898
377.1675
315.1428
325.6347
643.484 710.9407
397.2697
385.244
Accounts receivable turnover in days
88.62688
63.69707
84.16469
74.47254
87.00375
89.10723
107.0943
24.44583
22.18347
8.511956
Operating Cycle
286.7037
328.3682
492.0545
451.64 402.1466
414.7419
750.5783
735.3865
419.4532
393.756
EPS 1.18 0.57 0.3 0.303 -0.145 -0.139 0.099 1.008 3.108 1.57
ROA 0.085519
0.042866
0.022103
0.023833
-0.0099
9
-0.009
47
0.007704
0.071222
0.199107
0.122322

14
5.0 Correlation:
Current ratio
Quick Ratio
Cash Ratio
Net working Capital to sales
Inventory turnover in days
Accounts receivable turnover in days
Operating Cycle
EPS ROA
Current ratio
1
Quick Ratio
0.64 1
Cash Ratio
-0.131 -0.359 1
Net working Capital to sales
0.59 0.89 -0.41 1
Inventory turnover in days
0.877 0.31 -0.089 0.403 1
Accounts receivable turnover in days
0.019 0.69 -0.177 0.723 -0.19 1
Operating Cycle
0.899 0.47 -0.13 0.56 0.97 0.017 1
EPS -0.06 -0.6 0.5723 -0.747 -0.008 -0.75 -0.172 1
ROA -0.09 -0.63 0.57 -0.77 -0.017 -0.78 -0.18 0.99 1

15
6.0 FINDINGS.
Working capital of the Fine Foods Limited was increasing and showing
positive working capital per year.
The Fine Foods Limited has higher current and quick ratios are i.e., 20.1725
and 9.82 respectively.
Inventory turnover ratio is very low in the year 2002-03. In the year 20010-11 it
has increased by 6.32 times as compared to 2007-08 and in the last year 2009-10
it has again increased by 3.26 times as compared to 2008-09.
Debtor’s turnover ratio is very high in the year 2007-08. In the year 2008-09 it
has decreased by 5.28 times as compared to 2007-08 and in the last year 2009-
10 it has again decreased by 0.44 times as compared to 2008-09.
Creditor’s turnover ratio has increased in the years of 2007-08 and 2008-09. It
is same in the last year 2009-10 as compared to 2008-09.
Working capital turnover ratio is very low in the year 2007-08. In the year
2008-09 it has increased by 0.95 times as compared to 2007-08 and in the last
year 2009-2010 it has again increased by 0.03 times.

16
7.0 SUGGESTIONS.
Working capital of the company has increasing every year. Profit also
increasing every year this is good sign for the company. It has to maintain it
further, to run the business long term.
The Current and quick ratios are almost up to the standard requirement. So
the Working capital management Fine Foods Limited is satisfactory and it has to
maintain it further.
The company has sufficient working capital and has better liquidity position.
By efficient utilizing this short-term capital, then it should increase the
turnover.
The company should take precautionary measures for investing and
collecting funds from receivables and to reduce the bad debts.
The company has sufficient working capital and has better liquidity position.
By efficient utilizing this short-term capital, then it should increase the
turnover.
Creditor’s turnover ratio has increasing from 2007-08 to 2008-09 and in the last
year 2009-2010 it is same as compared to 2008-09. Company is making
prompt payment to its creditors. This is good sign for the company. On-time
payment to suppliers will increase the credibility of the firm. It has maintained
it further to survive in the market.

17
The company is utilizing working capital effectively this is good for the
company. It has to maintain it further.
8.0 CONCLUSIONS.
The study on working capital management conducted in Fine Foods
Limited to analyze the financial position of the company. The company’s
financial position is analyzed by using the tool of annual reports from 2002to
2011.
The financial status of Fine Foods Limited is good.
In the last year the inventory turnover has increased, this is good sign for the
company.
The company’s liquidity position is very good With regard to the investments in
current assets there are adequate funds invested in it. Care should be taken by
the company not to make further investments in current assets, as it would block
the funds, which could otherwise be effectively utilized for some productive
purpose. On the whole, the company is moving forward with excellent
management.