ANALYSIS OF YOUTH UNEMPLOYMENT IN...
20
JUNE 2015 ANALYSIS OF YOUTH UNEMPLOYMENT IN MPUMALANGA, 2008-2015
Transcript of ANALYSIS OF YOUTH UNEMPLOYMENT IN...
JUNE 2015
ANALYSIS OF YOUTH UNEMPLOYMENT
IN MPUMALANGA, 2008-2015
COMPILED BY: ECONOMIC ANALYSIS
CONTACT DETAILS: No 7 Government Boulevard
Building No 4
Riverside Park Extension 2
Nelspruit
1201
Tel: 013 766 4409
Fax: 013 766 9139
Email: [email protected]
Analysis of youth unemployment in Mpumalanga, 2008-2015 i
KEY FINDINGS
For the purpose of this report, Statistics South Africa’s youth definition that regards
those between 15 and 34 years of age as youth, will be used.
In Mpumalanga, youth accounted for 58.9 per cent of the working age population in
2015, however, their share of the provincial employed was only 43.8 per cent, which
highlights the youth’s vulnerability.
The youth’s vulnerability is further emphasised when one consider their share of the
unemployed in Mpumalanga was 69.9 per cent in 2015.
Mpumalanga’s youth unemployment rate deteriorated by 5.9 percentage points to
38.8 per cent between 2008 and 2015, which was the fifth lowest/highest deterioration
over the 7-year period.
The youth unemployment rate was more than double the adult (35 to 64 years)
unemployment rate over the entire period under observation.
In 2015, Mpumalanga’s male youth unemployment rate was the fourth lowest (best) at
33.2 per cent and its female youth unemployment rate as the second highest (worst) at
46.9 per cent.
In 2015, the female youth unemployment rate was 1.4 times higher than the male
youth unemployment rate.
Over the 7-year period, African/Black youth recorded the highest unemployment rate
among the population groups in Mpumalanga. The unemployment rate of
African/Black youth increased from 34.0 per cent in 2008 to 40.9 per cent in 2015.
The unemployment rate of all four age cohorts that make up the youth of working-age
population increased between 2008 and 2015. The 20 to 24 year age cohort
registered the highest unemployment rate among the four age cohorts and increased
from 43.5 per cent in 2008 to 55.6 per cent in 2015.
At the end of the first quarter 2015, youth without a complete secondary education
(45.5 per cent) registered the highest unemployment rate and youth with a complete
tertiary education (23.5 per cent) of any sort recorded the lowest.
The share of youth that have not worked previously and can therefore not claim any
work related skills, increased from 49.4 per cent to 61.6 per cent over the period 2008
to 2015.
Youth that have been unemployed for longer than one year numbered 212 461 in 2015
or some 66.4 per cent of unemployed youth.
Over the 7-year period, youth that last worked in skilled and semi-skilled occupations
increased (deteriorated) by 15.2 per cent and 3.2 per cent, respectively, and can be
said to be increasingly laid off from skilled and semi-skilled occupations.
Analysis of youth unemployment in Mpumalanga, 2008-2015 ii
TABLE OF CONTENTS
KEY FINDINGS ................................................................................................................... i
TABLE OF CONTENTS ..................................................................................................... ii
1. INTRODUCTION ......................................................................................................... 1
2. BACKGROUND .......................................................................................................... 1
3. DEFINITIONS ON YOUTH AND YOUTH UNEMPLOYMENT ..................................... 2
4. YOUTH UNEMLOYMENT IN A NATIONAL AND PROVINCIAL CONTEXT ............... 4
5. YOUTH UNEMPLOYMENT IN MPUMALANGA ......................................................... 7
6. RESPONSES TO YOUTH UNEMPLOYMENT .......................................................... 13
7. RECOMMENDATIONS ............................................................................................. 15
Analysis of youth unemployment in Mpumalanga, 2008-2015 1
1. INTRODUCTION
Youth unemployment is a global problem with the International Labour Organisation (ILO)
describing the situation as reaching crisis proportions. In 2011, nearly 75 million youth1
worldwide (12.6 per cent of youth) were unemployed, an increase of four million since
2007. Not only are the numbers high and on the rise, but for many young people
unemployment is a long-lasting condition, with 1 out of every 10 unemployed youth either
abandoning job search altogether or delaying transition from the education system to the
labour market.
Youth unemployment has been high for many years in South Africa and is one of the
country’s major socio-economic challenges. Worldwide comparisons regularly affirm that
South Africa’s youth unemployment rates are among the highest in the world. Youth
unemployment in South Africa is high, even in comparison with the country’s very high
average unemployment rate of 26.4 per cent.
It is critically important to reflect, as Provincial Government, on this major socio-economic
challenge in the province. Therefore this report analyses youth unemployment in
Mpumalanga from the end of the first quarter 2008 to the end of the first quarter 2015. The
report specifically focuses on definitions of youth unemployment, youth unemployment in a
national context, youth unemployment in Mpumalanga and responses to youth
unemployment. The Quarterly Labour Force Survey (QLFS) published by Statistics South
Africa (Stats SA), was used as the main data2 source.
2. BACKGROUND
The National Development Plan (NDP) provides an aspiring vision of South Africa in 2030
and the context within which all youth-oriented programmes should be located. The NPC
(National Planning Commission) stipulated that the NDP should specifically embrace
issues affecting the country’s youth, as South Africa has a young population which is
rapidly urbanising. A young population can be an advantage to a country, provided that
the majority can be employed productively. However, the NDP further states that South
Africa must find ways to urgently reduce the alarming levels of youth unemployment and to
provide young people with broader opportunities, which is why it has adopted a youth
focus or lens in preparing its proposals.
The framework of the New Growth Path (NGP), that was released in 2010, had as its main
objective to create 5 million new jobs by 2020. It was stated in the document that
1 The ILO defines youth as those aged between 15 and 24 years.
2 Due to the dynamic nature of data and the regular release of data sets, it is important to note that the cut-off date for data
presented in the document was the second week of June 2015.
Analysis of youth unemployment in Mpumalanga, 2008-2015 2
Government is committed to develop a multi-pronged strategy to support youth
employment in particular.
The National Youth Policy 2015–2020 (and its predecessor the National Youth Policy
2009-2014) is an essential planning tool guiding the country on its approach to youth
development. In this policy document interventions and services are spelled out that
would have to be rolled out to ensure effective and efficient mainstreaming of youth
development.
The National Youth Development Agency (NYDA) was formally established in 2009 under
the NYDA Act 54 of 2008. Part of NYDA’s mandate is to implement the Integrated Youth
Development Strategy (IYDS) which aims to set specific targets and milestones for
programmes to be implemented as well as mainstream youth development in government
departments and the private sector.
In February 2011, National Treasury suggested that the high rate of youth unemployment
was a result of insufficient demand within the labour market to meet the rising number of
youth job seekers. Therefore a youth employment subsidy was proposed to target job
creation for youth and not merely absorbing youth into the labour market at the expense of
adults already in the labour market.
3. DEFINITIONS ON YOUTH AND YOUTH UNEMPLOYMENT
Youth
The United Nations (UN), for statistical consistency across regions, defines youth as those
persons between the ages of 15 and 24 years. Similarly youth is defined by the
International Labour Organization (ILO) as individuals between the ages of 15 to 24 years.
However, the UN recognises that for activities at a national level, youth may be understood
in a more flexible manner. The UN will then adopt the definition of youth as used by a
particular Member State.
For example, in much of sub-Saharan Africa, the term youth is associated with young
people from 15 to 30 or even 35 years of age. Therefore the definition given in the African
Youth Charter to youth means every person between the ages of 15 and 35 years. In
South Africa the definition of youth is consistent with the African Youth Charter’s.
Therefore, the National Youth Commission Act (1996), the National Youth Development
Policy Framework (2002) and the National Youth Policy (NYP) 2015-2020, defines young
people as those falling within the age group of 14 to 35 years. The NYP 2015-2020 states
further that although much has changed for young people since the advent of democracy
in 1994, the motivation for the age limit of 35 years has not yet changed because historical
imbalances in the country are yet to be fully addressed.
Analysis of youth unemployment in Mpumalanga, 2008-2015 3
Youth unemployment rate
According to, probably the highest international labour authority, the ILO, unemployed
youth comprise all persons between the age of 15 and 24. The UN and World Bank
definitions are also in line with the ILO definition. However, the European Union (EU)
statistics agency, Eurostat, declares that the main indicator of youth unemployment is the
youth unemployment rate for the age group 15 to 24 or 15 to 34, depending on which
definition is in operation.
Stats SA employs the national (and African) description of youth and therefore the
unemployment rate of youth is the population between 15 and 34 years of age that are
unemployed divided by the total number of youth in the labour market (employed plus
unemployed). For the purpose of this report, this is the definition of youth that will be
employed.
The fact that people younger than 18 can be regarded as in the labour market is also not in
conflict with important labour legislation in South Africa. According to the Basic Conditions
of Employment Act (2002) it is legal to employ a child less than 18 years of age but not
less than 15 years of age. Therefore, because it is legal to employ individuals between the
ages of 15 and 18 and it is acceptable to include them in the definition as well.
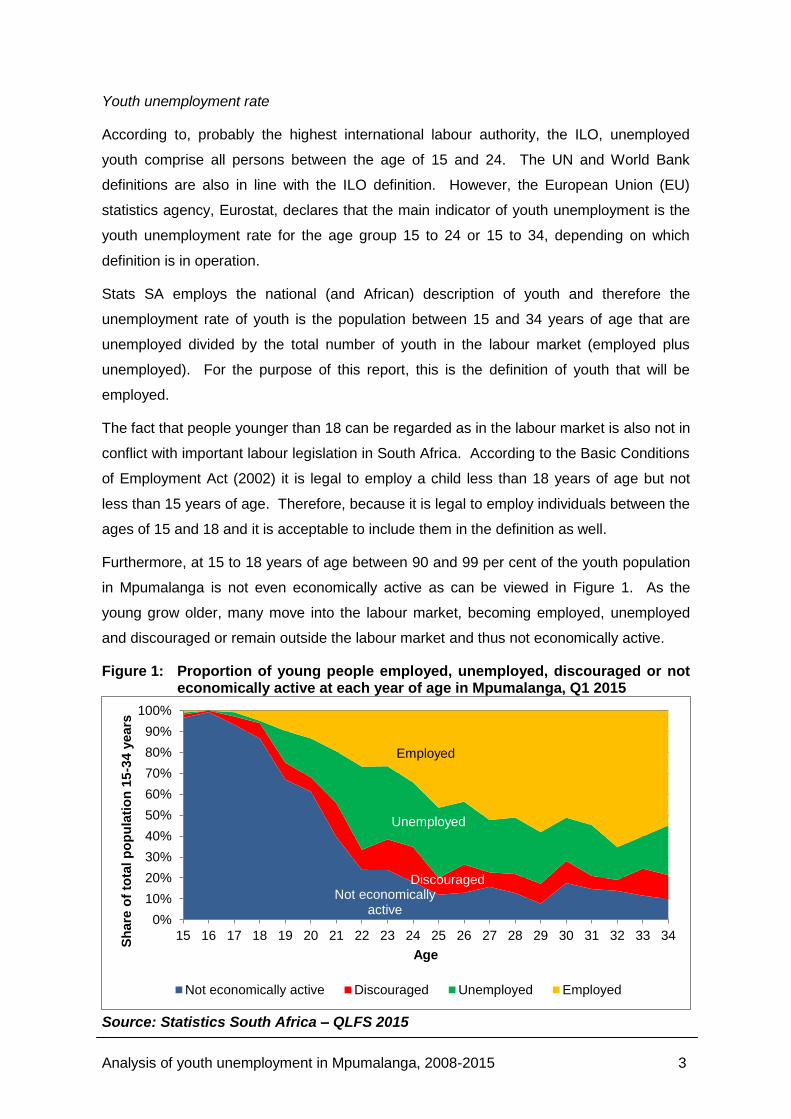
Furthermore, at 15 to 18 years of age between 90 and 99 per cent of the youth population
in Mpumalanga is not even economically active as can be viewed in Figure 1. As the
young grow older, many move into the labour market, becoming employed, unemployed
and discouraged or remain outside the labour market and thus not economically active.
Figure 1: Proportion of young people employed, unemployed, discouraged or not economically active at each year of age in Mpumalanga, Q1 2015
Source: Statistics South Africa – QLFS 2015
Not economically active
Discouraged
Unemployed
Employed
0%
10%
20%
30%
40%
50%
60%
70%
80%
90%
100%
15 16 17 18 19 20 21 22 23 24 25 26 27 28 29 30 31 32 33 34
Sh
are
of
tota
l p
op
ula
tio
n 1
5-3
4 y
ears
Age
Not economically active Discouraged Unemployed Employed
Analysis of youth unemployment in Mpumalanga, 2008-2015 4
4. YOUTH UNEMLOYMENT IN A NATIONAL AND PROVINCIAL CONTEXT
The vulnerability of youth in the labour market poses a major challenge for policymakers
across the world. The ILO states that around the world, youth unemployment and
underemployment is prevalent not only because of inadequate job opportunities, but also
because youth lack skills, work experience, job search abilities and financial resources to
find employment.
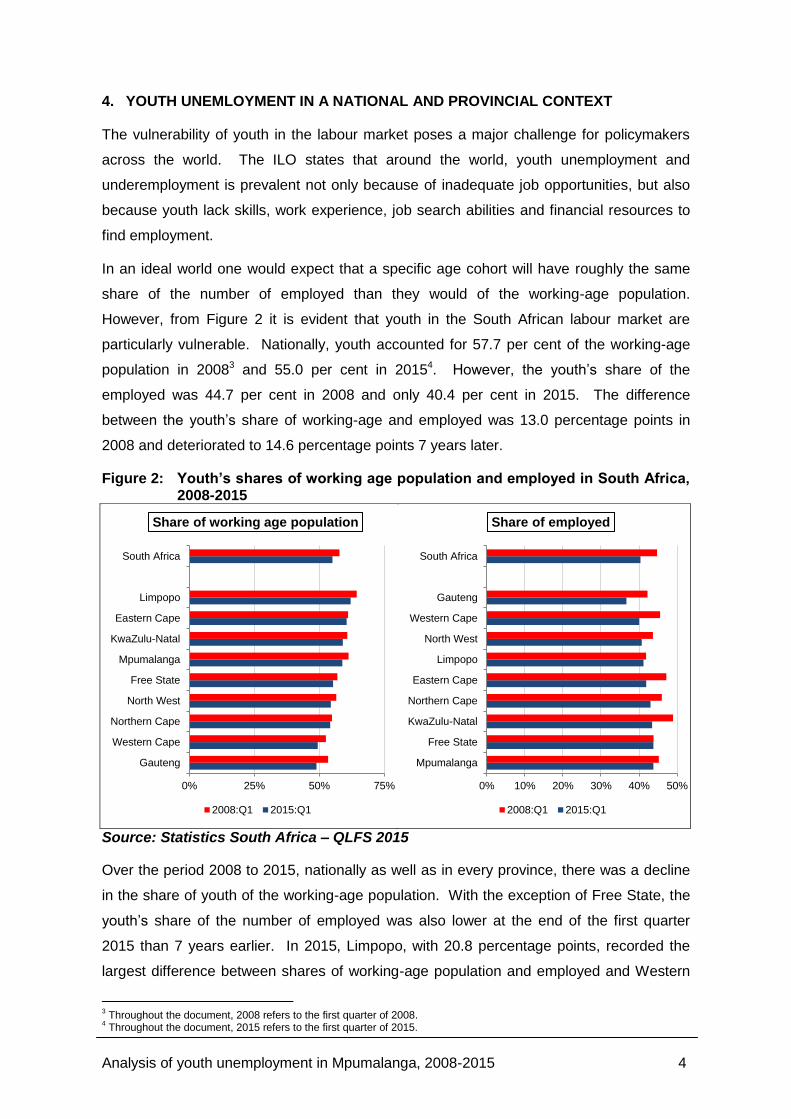
In an ideal world one would expect that a specific age cohort will have roughly the same
share of the number of employed than they would of the working-age population.
However, from Figure 2 it is evident that youth in the South African labour market are
particularly vulnerable. Nationally, youth accounted for 57.7 per cent of the working-age
population in 20083 and 55.0 per cent in 20154. However, the youth’s share of the
employed was 44.7 per cent in 2008 and only 40.4 per cent in 2015. The difference
between the youth’s share of working-age and employed was 13.0 percentage points in
2008 and deteriorated to 14.6 percentage points 7 years later.
Figure 2: Youth’s shares of working age population and employed in South Africa, 2008-2015
Source: Statistics South Africa – QLFS 2015
Over the period 2008 to 2015, nationally as well as in every province, there was a decline
in the share of youth of the working-age population. With the exception of Free State, the
youth’s share of the number of employed was also lower at the end of the first quarter
2015 than 7 years earlier. In 2015, Limpopo, with 20.8 percentage points, recorded the
largest difference between shares of working-age population and employed and Western
3 Throughout the document, 2008 refers to the first quarter of 2008.
4 Throughout the document, 2015 refers to the first quarter of 2015.
Gauteng
Western Cape
Northern Cape
North West
Free State
Mpumalanga
KwaZulu-Natal
Eastern Cape
Limpopo
South Africa
0% 25% 50% 75%
Share of working age population
2008:Q1 2015:Q1
Mpumalanga
Free State
KwaZulu-Natal
Northern Cape
Eastern Cape
Limpopo
North West
Western Cape
Gauteng
South Africa
0% 10% 20% 30% 40% 50%
Share of employed
2008:Q1 2015:Q1
Analysis of youth unemployment in Mpumalanga, 2008-2015 5
Cape (9.3 percentage points) the smallest. In terms of this indicator, Limpopo’s youth
could be regarded as the most vulnerable cohort in the South Africa working-age
population.
Mpumalanga’s youth (58.9 per cent) had the fourth highest share of working-age
population among the nine provinces. In 2015, Mpumalanga’s youth had the highest share
of the employed among the provinces with a 43.8 per cent share. Mpumalanga
(15.1 percentage points) also recorded the fourth largest difference between shares of
working-age population and employed. With this, Mpumalanga’s youth was more
vulnerable than the average youth in South Africa (14.6 percentage points), however,
Mpumalanga’s vulnerability decreased (improved) from 16.1 percentage points in 2008.
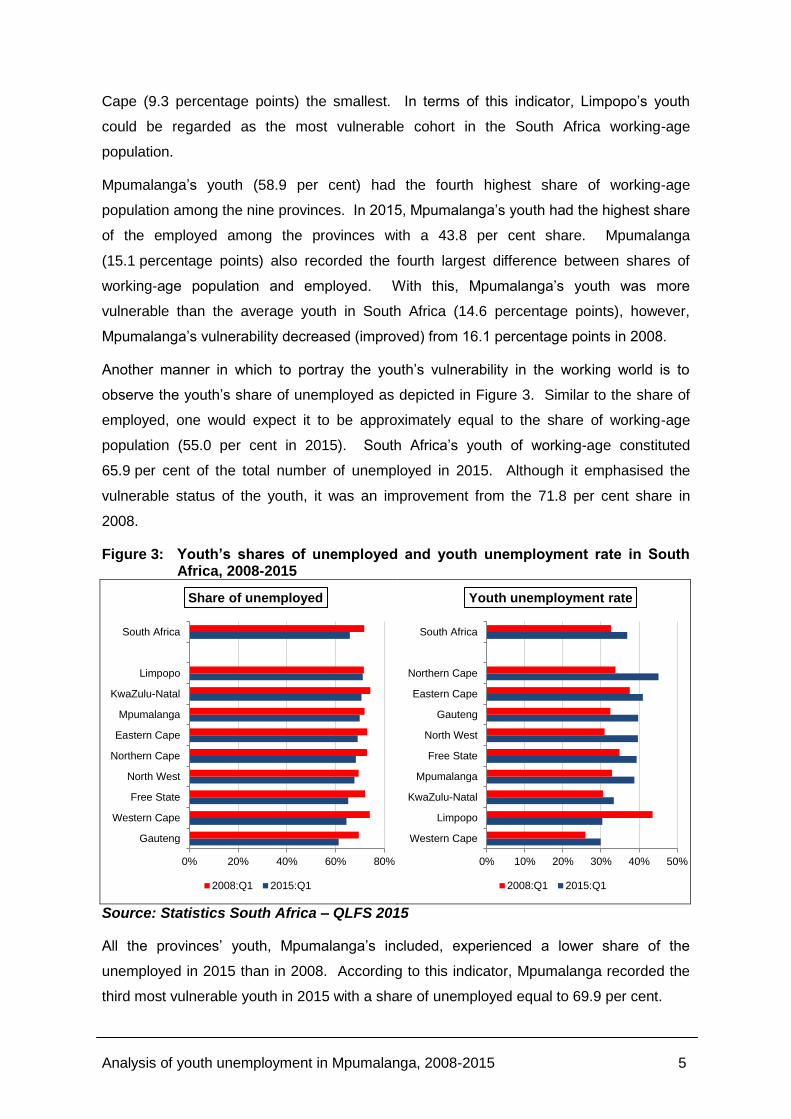
Another manner in which to portray the youth’s vulnerability in the working world is to
observe the youth’s share of unemployed as depicted in Figure 3. Similar to the share of
employed, one would expect it to be approximately equal to the share of working-age
population (55.0 per cent in 2015). South Africa’s youth of working-age constituted
65.9 per cent of the total number of unemployed in 2015. Although it emphasised the
vulnerable status of the youth, it was an improvement from the 71.8 per cent share in
2008.
Figure 3: Youth’s shares of unemployed and youth unemployment rate in South Africa, 2008-2015
Source: Statistics South Africa – QLFS 2015
All the provinces’ youth, Mpumalanga’s included, experienced a lower share of the
unemployed in 2015 than in 2008. According to this indicator, Mpumalanga recorded the
third most vulnerable youth in 2015 with a share of unemployed equal to 69.9 per cent.
Gauteng
Western Cape
Free State
North West
Northern Cape
Eastern Cape
Mpumalanga
KwaZulu-Natal
Limpopo
South Africa
0% 20% 40% 60% 80%
Share of unemployed
2008:Q1 2015:Q1
Western Cape
Limpopo
KwaZulu-Natal
Mpumalanga
Free State
North West
Gauteng
Eastern Cape
Northern Cape
South Africa
0% 10% 20% 30% 40% 50%
Youth unemployment rate
2008:Q1 2015:Q1
Analysis of youth unemployment in Mpumalanga, 2008-2015 6
Further from Figure 3 it is evident that the youth unemployment rate in South Africa was
higher in 2015 than in 2008. In every province, the unemployment rate among youth was
more than double that of adults (35 to 64 years). With the exception of Limpopo, all the
provinces recorded a similar deterioration in their respective youth unemployment rates.
Mpumalanga registered the fourth lowest youth unemployment rate among the nine
provinces in 2015. Between 2008 and 2015, Mpumalanga’s youth unemployment rate
deteriorated by 5.9 percentage points to 38.8 per cent. This was the fifth lowest/highest
deterioration over the 7-year period.
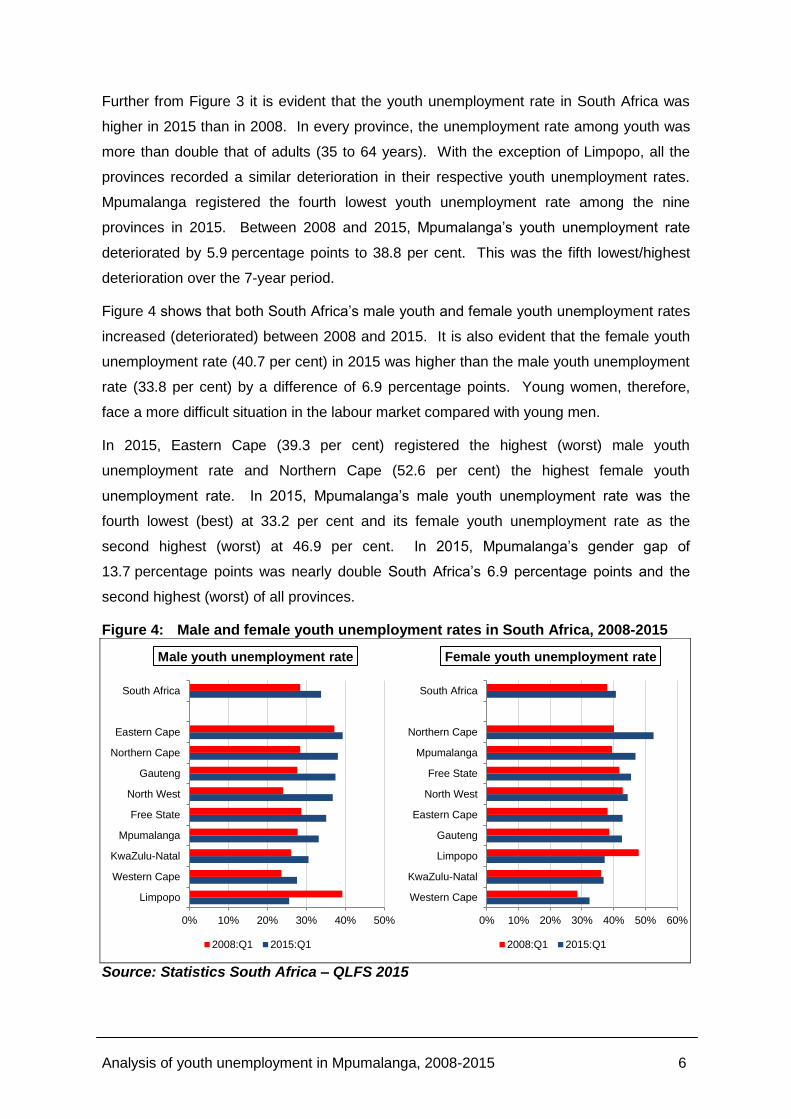
Figure 4 shows that both South Africa’s male youth and female youth unemployment rates
increased (deteriorated) between 2008 and 2015. It is also evident that the female youth
unemployment rate (40.7 per cent) in 2015 was higher than the male youth unemployment
rate (33.8 per cent) by a difference of 6.9 percentage points. Young women, therefore,
face a more difficult situation in the labour market compared with young men.
In 2015, Eastern Cape (39.3 per cent) registered the highest (worst) male youth
unemployment rate and Northern Cape (52.6 per cent) the highest female youth
unemployment rate. In 2015, Mpumalanga’s male youth unemployment rate was the
fourth lowest (best) at 33.2 per cent and its female youth unemployment rate as the
second highest (worst) at 46.9 per cent. In 2015, Mpumalanga’s gender gap of
13.7 percentage points was nearly double South Africa’s 6.9 percentage points and the
second highest (worst) of all provinces.
Figure 4: Male and female youth unemployment rates in South Africa, 2008-2015
Source: Statistics South Africa – QLFS 2015
Limpopo
Western Cape
KwaZulu-Natal
Mpumalanga
Free State
North West
Gauteng
Northern Cape
Eastern Cape
South Africa
0% 10% 20% 30% 40% 50%
Male youth unemployment rate
2008:Q1 2015:Q1
Western Cape
KwaZulu-Natal
Limpopo
Gauteng
Eastern Cape
North West
Free State
Mpumalanga
Northern Cape
South Africa
0% 10% 20% 30% 40% 50% 60%
Female youth unemployment rate
2008:Q1 2015:Q1
Analysis of youth unemployment in Mpumalanga, 2008-2015 7
5. YOUTH UNEMPLOYMENT IN MPUMALANGA
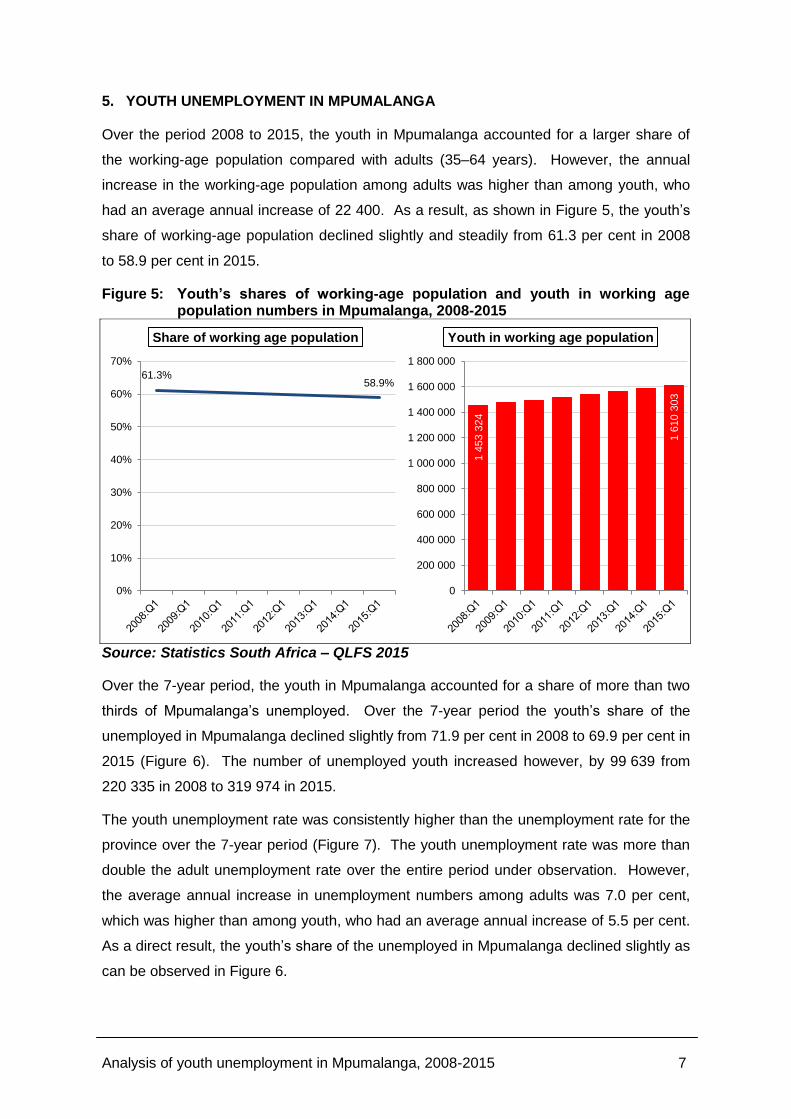
Over the period 2008 to 2015, the youth in Mpumalanga accounted for a larger share of
the working-age population compared with adults (35–64 years). However, the annual
increase in the working-age population among adults was higher than among youth, who
had an average annual increase of 22 400. As a result, as shown in Figure 5, the youth’s
share of working-age population declined slightly and steadily from 61.3 per cent in 2008
to 58.9 per cent in 2015.
Figure 5: Youth’s shares of working-age population and youth in working age population numbers in Mpumalanga, 2008-2015
Source: Statistics South Africa – QLFS 2015
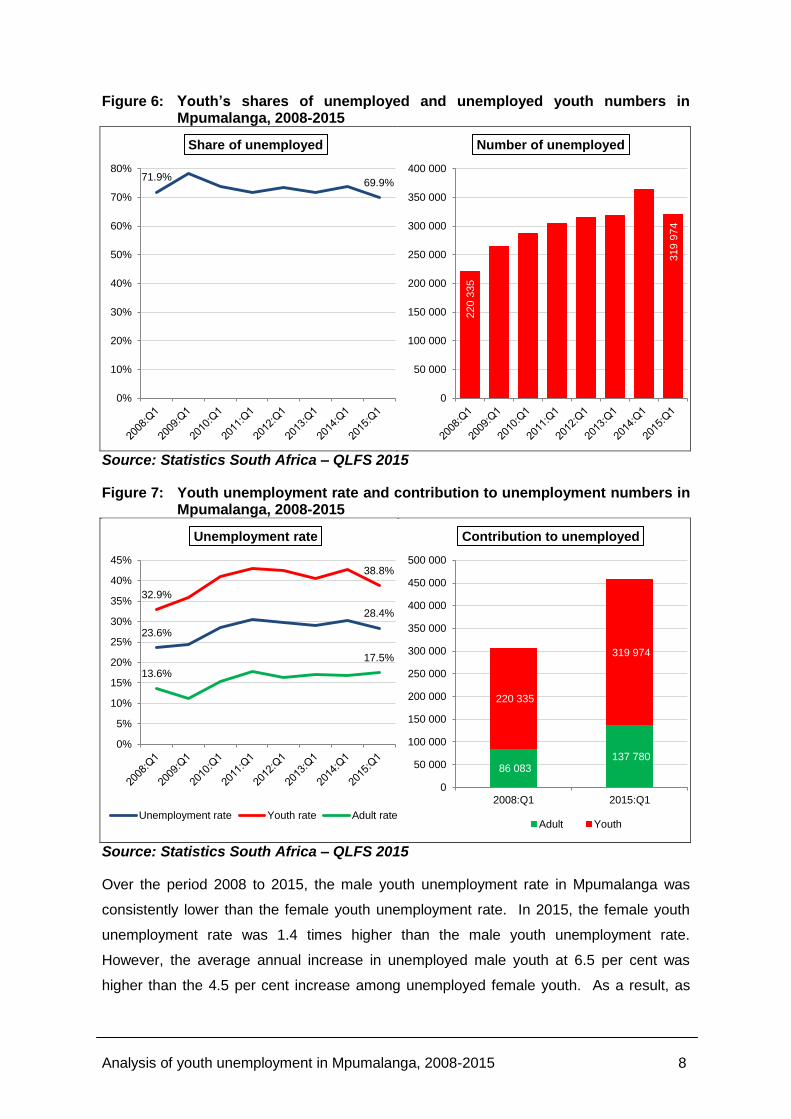
Over the 7-year period, the youth in Mpumalanga accounted for a share of more than two
thirds of Mpumalanga’s unemployed. Over the 7-year period the youth’s share of the
unemployed in Mpumalanga declined slightly from 71.9 per cent in 2008 to 69.9 per cent in
2015 (Figure 6). The number of unemployed youth increased however, by 99 639 from
220 335 in 2008 to 319 974 in 2015.
The youth unemployment rate was consistently higher than the unemployment rate for the
province over the 7-year period (Figure 7). The youth unemployment rate was more than
double the adult unemployment rate over the entire period under observation. However,
the average annual increase in unemployment numbers among adults was 7.0 per cent,
which was higher than among youth, who had an average annual increase of 5.5 per cent.
As a direct result, the youth’s share of the unemployed in Mpumalanga declined slightly as
can be observed in Figure 6.
61.3% 58.9%
0%
10%
20%
30%
40%
50%
60%
70%
Share of working age population
1 4
53 3
24
1 6
10 3
03
0
200 000
400 000
600 000
800 000
1 000 000
1 200 000
1 400 000
1 600 000
1 800 000
Youth in working age population
Analysis of youth unemployment in Mpumalanga, 2008-2015 8
Figure 6: Youth’s shares of unemployed and unemployed youth numbers in Mpumalanga, 2008-2015
Source: Statistics South Africa – QLFS 2015
Figure 7: Youth unemployment rate and contribution to unemployment numbers in Mpumalanga, 2008-2015
Source: Statistics South Africa – QLFS 2015
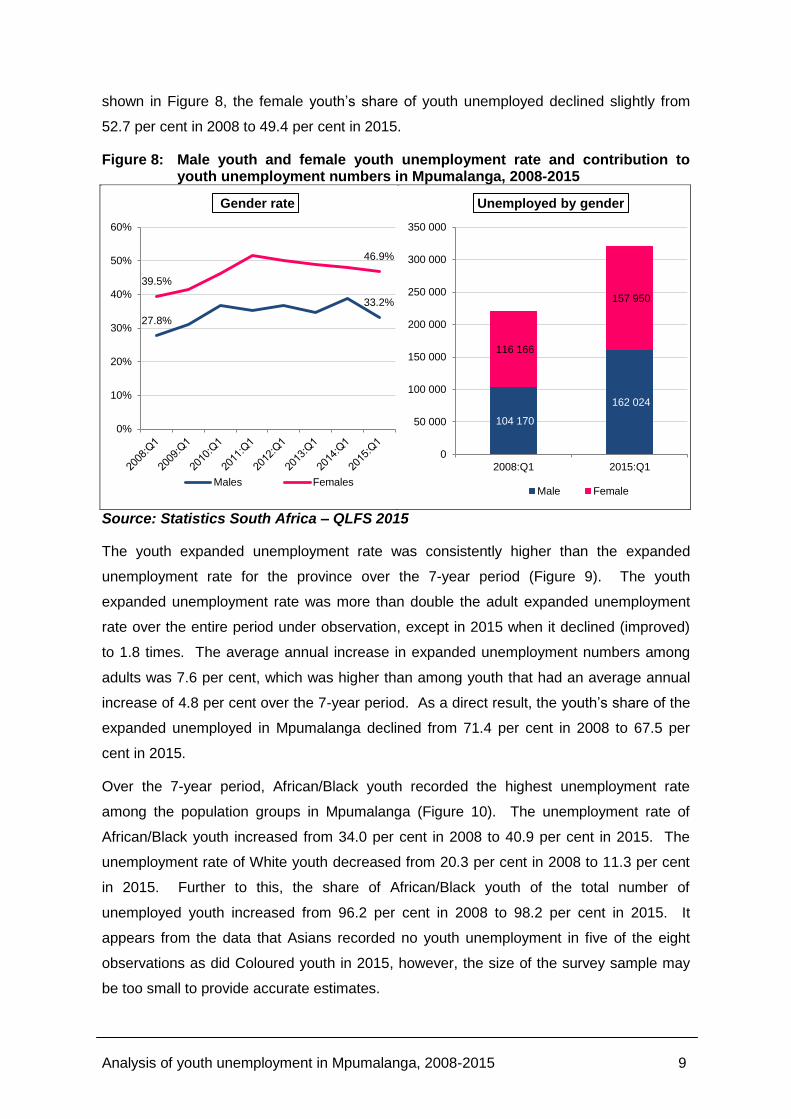
Over the period 2008 to 2015, the male youth unemployment rate in Mpumalanga was
consistently lower than the female youth unemployment rate. In 2015, the female youth
unemployment rate was 1.4 times higher than the male youth unemployment rate.
However, the average annual increase in unemployed male youth at 6.5 per cent was
higher than the 4.5 per cent increase among unemployed female youth. As a result, as
71.9% 69.9%
0%
10%
20%
30%
40%
50%
60%
70%
80%
Share of unemployed
220 3
35
319 9
74
0
50 000
100 000
150 000
200 000
250 000
300 000
350 000
400 000
Number of unemployed
23.6%
28.4%
32.9%
38.8%
13.6%
17.5%
0%
5%
10%
15%
20%
25%
30%
35%
40%
45%
Unemployment rate
Unemployment rate Youth rate Adult rate
86 083 137 780
220 335
319 974
2008:Q1 2015:Q1
0
50 000
100 000
150 000
200 000
250 000
300 000
350 000
400 000
450 000
500 000
Contribution to unemployed
Adult Youth
Analysis of youth unemployment in Mpumalanga, 2008-2015 9
shown in Figure 8, the female youth’s share of youth unemployed declined slightly from
52.7 per cent in 2008 to 49.4 per cent in 2015.
Figure 8: Male youth and female youth unemployment rate and contribution to youth unemployment numbers in Mpumalanga, 2008-2015
Source: Statistics South Africa – QLFS 2015
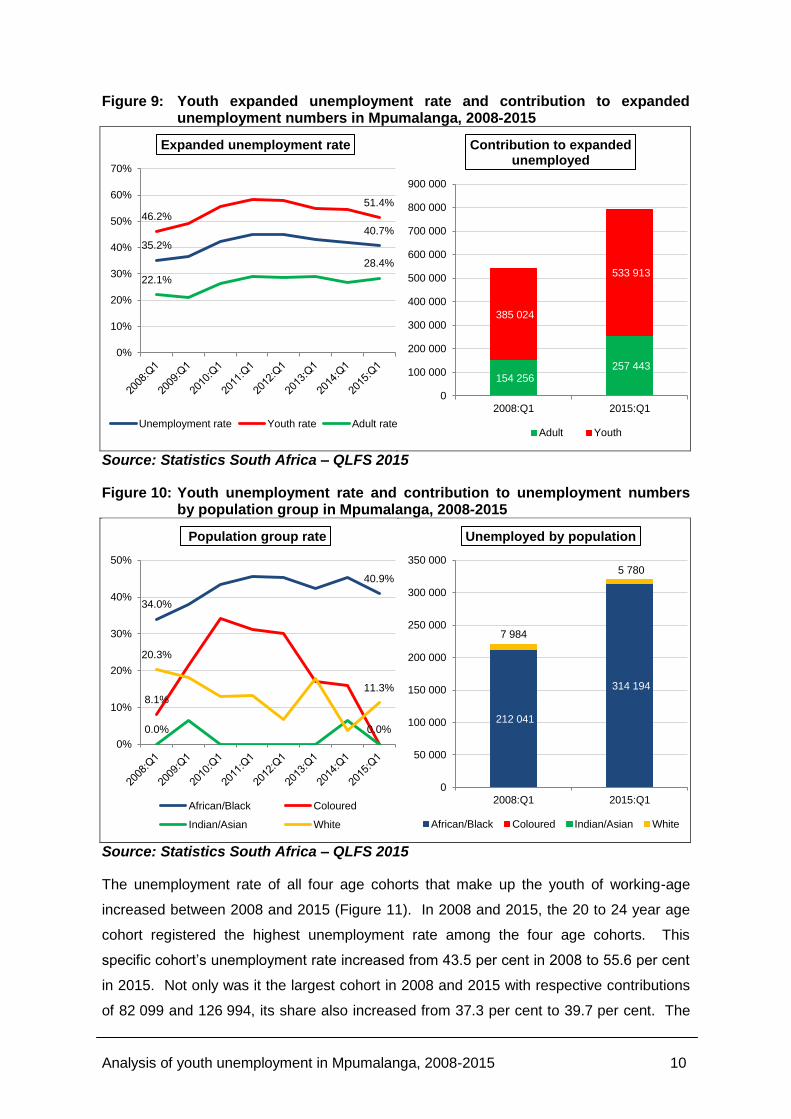
The youth expanded unemployment rate was consistently higher than the expanded
unemployment rate for the province over the 7-year period (Figure 9). The youth
expanded unemployment rate was more than double the adult expanded unemployment
rate over the entire period under observation, except in 2015 when it declined (improved)
to 1.8 times. The average annual increase in expanded unemployment numbers among
adults was 7.6 per cent, which was higher than among youth that had an average annual
increase of 4.8 per cent over the 7-year period. As a direct result, the youth’s share of the
expanded unemployed in Mpumalanga declined from 71.4 per cent in 2008 to 67.5 per
cent in 2015.
Over the 7-year period, African/Black youth recorded the highest unemployment rate
among the population groups in Mpumalanga (Figure 10). The unemployment rate of
African/Black youth increased from 34.0 per cent in 2008 to 40.9 per cent in 2015. The
unemployment rate of White youth decreased from 20.3 per cent in 2008 to 11.3 per cent
in 2015. Further to this, the share of African/Black youth of the total number of
unemployed youth increased from 96.2 per cent in 2008 to 98.2 per cent in 2015. It
appears from the data that Asians recorded no youth unemployment in five of the eight
observations as did Coloured youth in 2015, however, the size of the survey sample may
be too small to provide accurate estimates.
27.8%
33.2%
39.5%
46.9%
0%
10%
20%
30%
40%
50%
60%
Gender rate
Males Females
104 170
162 024
116 166
157 950
2008:Q1 2015:Q1
0
50 000
100 000
150 000
200 000
250 000
300 000
350 000
Unemployed by gender
Male Female
Analysis of youth unemployment in Mpumalanga, 2008-2015 10
Figure 9: Youth expanded unemployment rate and contribution to expanded unemployment numbers in Mpumalanga, 2008-2015
Source: Statistics South Africa – QLFS 2015
Figure 10: Youth unemployment rate and contribution to unemployment numbers by population group in Mpumalanga, 2008-2015
Source: Statistics South Africa – QLFS 2015
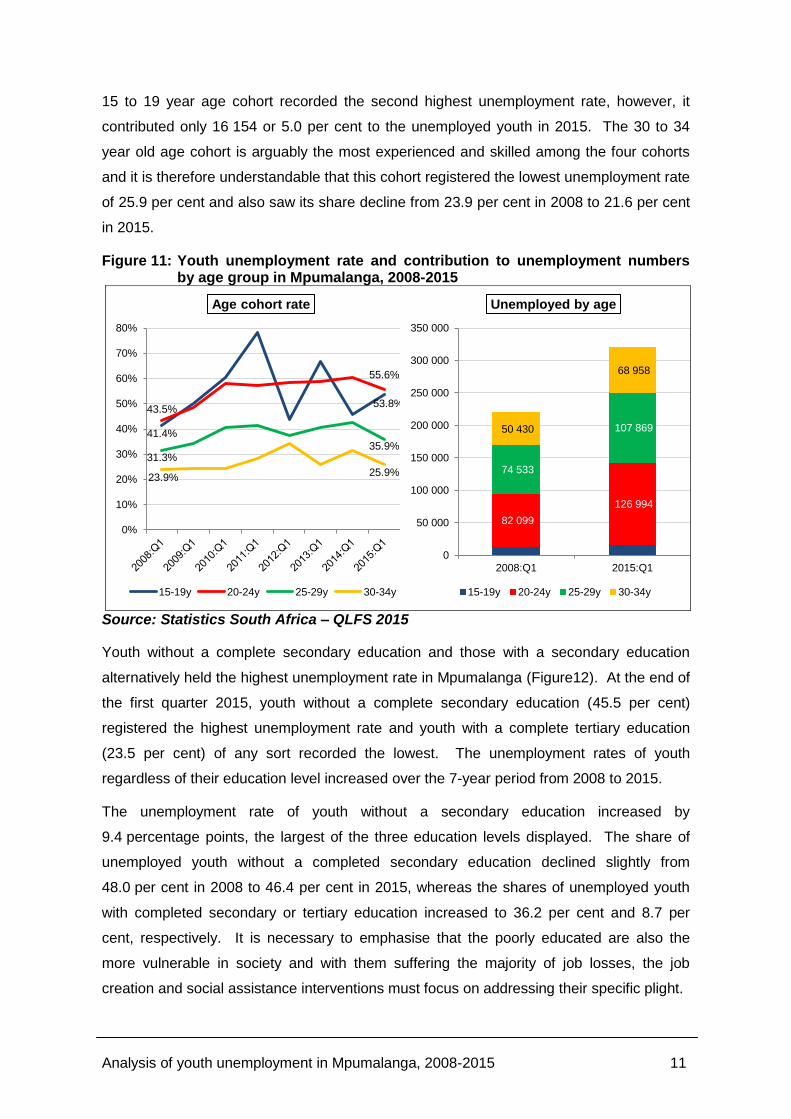
The unemployment rate of all four age cohorts that make up the youth of working-age
increased between 2008 and 2015 (Figure 11). In 2008 and 2015, the 20 to 24 year age
cohort registered the highest unemployment rate among the four age cohorts. This
specific cohort’s unemployment rate increased from 43.5 per cent in 2008 to 55.6 per cent
in 2015. Not only was it the largest cohort in 2008 and 2015 with respective contributions
of 82 099 and 126 994, its share also increased from 37.3 per cent to 39.7 per cent. The
35.2%
40.7%
46.2%
51.4%
22.1%
28.4%
0%
10%
20%
30%
40%
50%
60%
70%
Expanded unemployment rate
Unemployment rate Youth rate Adult rate
154 256 257 443
385 024
533 913
2008:Q1 2015:Q1
0
100 000
200 000
300 000
400 000
500 000
600 000
700 000
800 000
900 000
Contribution to expanded unemployed
Adult Youth
34.0%
40.9%
8.1%
0.0% 0.0%
20.3%
11.3%
0%
10%
20%
30%
40%
50%
Population group rate
African/Black Coloured
Indian/Asian White
212 041
314 194
7 984
5 780
2008:Q1 2015:Q1
0
50 000
100 000
150 000
200 000
250 000
300 000
350 000
Unemployed by population
African/Black Coloured Indian/Asian White
Analysis of youth unemployment in Mpumalanga, 2008-2015 11
15 to 19 year age cohort recorded the second highest unemployment rate, however, it
contributed only 16 154 or 5.0 per cent to the unemployed youth in 2015. The 30 to 34
year old age cohort is arguably the most experienced and skilled among the four cohorts
and it is therefore understandable that this cohort registered the lowest unemployment rate
of 25.9 per cent and also saw its share decline from 23.9 per cent in 2008 to 21.6 per cent
in 2015.
Figure 11: Youth unemployment rate and contribution to unemployment numbers by age group in Mpumalanga, 2008-2015
Source: Statistics South Africa – QLFS 2015
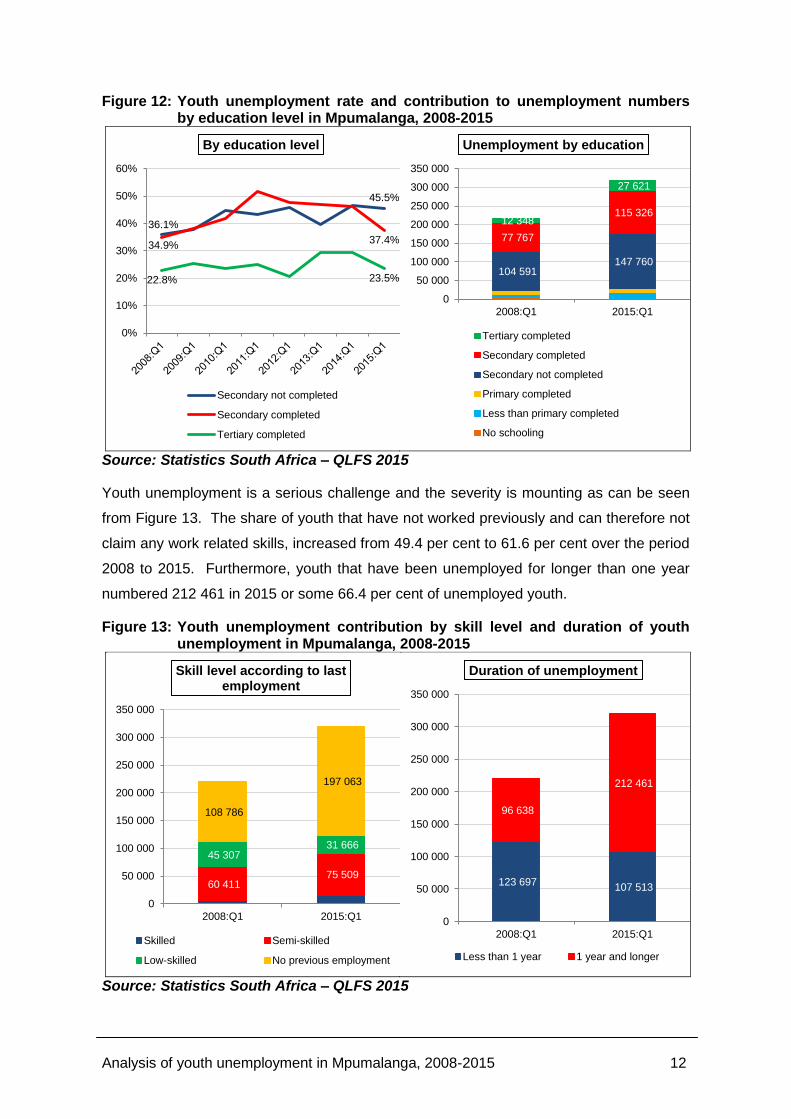
Youth without a complete secondary education and those with a secondary education
alternatively held the highest unemployment rate in Mpumalanga (Figure12). At the end of
the first quarter 2015, youth without a complete secondary education (45.5 per cent)
registered the highest unemployment rate and youth with a complete tertiary education
(23.5 per cent) of any sort recorded the lowest. The unemployment rates of youth
regardless of their education level increased over the 7-year period from 2008 to 2015.
The unemployment rate of youth without a secondary education increased by
9.4 percentage points, the largest of the three education levels displayed. The share of
unemployed youth without a completed secondary education declined slightly from
48.0 per cent in 2008 to 46.4 per cent in 2015, whereas the shares of unemployed youth
with completed secondary or tertiary education increased to 36.2 per cent and 8.7 per
cent, respectively. It is necessary to emphasise that the poorly educated are also the
more vulnerable in society and with them suffering the majority of job losses, the job
creation and social assistance interventions must focus on addressing their specific plight.
41.4%
53.8% 43.5%
55.6%
31.3% 35.9%
23.9% 25.9%
0%
10%
20%
30%
40%
50%
60%
70%
80%
Age cohort rate
15-19y 20-24y 25-29y 30-34y
82 099
126 994
74 533
107 869 50 430
68 958
2008:Q1 2015:Q1
0
50 000
100 000
150 000
200 000
250 000
300 000
350 000
Unemployed by age
15-19y 20-24y 25-29y 30-34y
Analysis of youth unemployment in Mpumalanga, 2008-2015 12
Figure 12: Youth unemployment rate and contribution to unemployment numbers by education level in Mpumalanga, 2008-2015
Source: Statistics South Africa – QLFS 2015
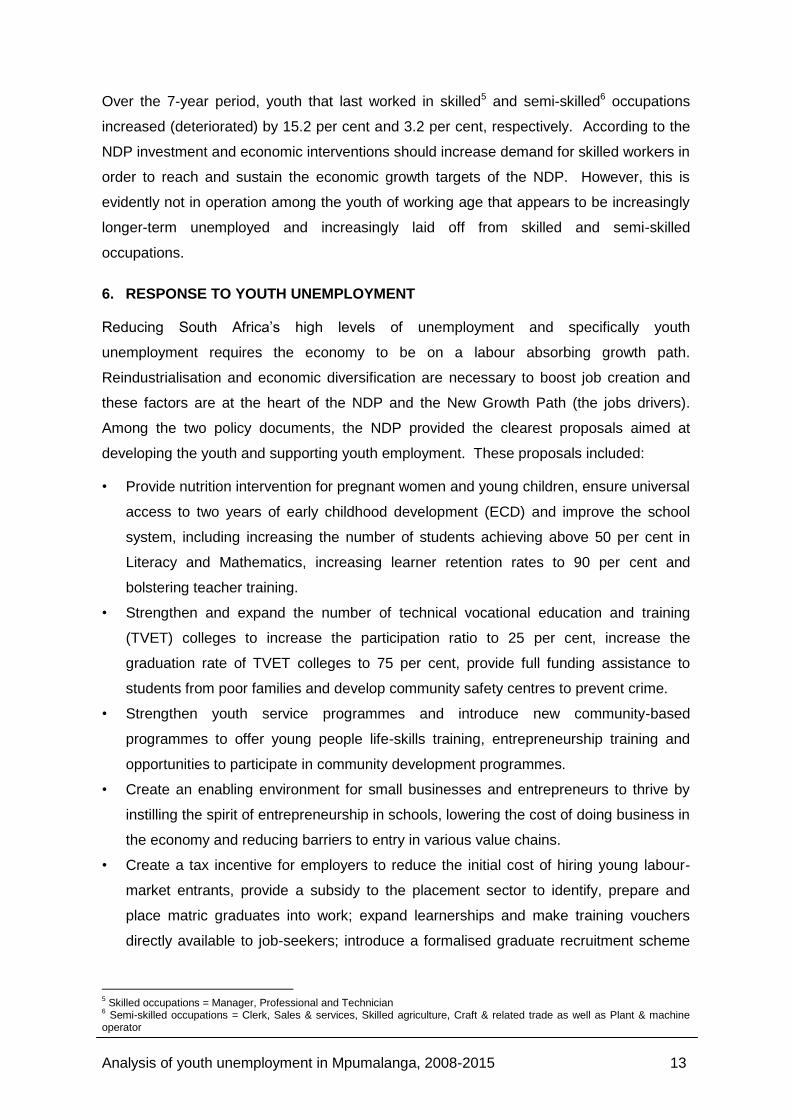
Youth unemployment is a serious challenge and the severity is mounting as can be seen
from Figure 13. The share of youth that have not worked previously and can therefore not
claim any work related skills, increased from 49.4 per cent to 61.6 per cent over the period
2008 to 2015. Furthermore, youth that have been unemployed for longer than one year
numbered 212 461 in 2015 or some 66.4 per cent of unemployed youth.
Figure 13: Youth unemployment contribution by skill level and duration of youth unemployment in Mpumalanga, 2008-2015
Source: Statistics South Africa – QLFS 2015
36.1%
45.5%
34.9% 37.4%
22.8% 23.5%
0%
10%
20%
30%
40%
50%
60%
By education level
Secondary not completed
Secondary completed
Tertiary completed
104 591 147 760
77 767
115 326 12 348
27 621
2008:Q1 2015:Q1
0
50 000
100 000
150 000
200 000
250 000
300 000
350 000
Unemployment by education
Tertiary completed
Secondary completed
Secondary not completed
Primary completed
Less than primary completed
No schooling
60 411 75 509
45 307 31 666
108 786
197 063
2008:Q1 2015:Q1
0
50 000
100 000
150 000
200 000
250 000
300 000
350 000
Skill level according to last employment
Skilled Semi-skilled
Low-skilled No previous employment
123 697 107 513
96 638
212 461
2008:Q1 2015:Q1
0
50 000
100 000
150 000
200 000
250 000
300 000
350 000
Duration of unemployment
Less than 1 year 1 year and longer
Analysis of youth unemployment in Mpumalanga, 2008-2015 13
Over the 7-year period, youth that last worked in skilled5 and semi-skilled6 occupations
increased (deteriorated) by 15.2 per cent and 3.2 per cent, respectively. According to the
NDP investment and economic interventions should increase demand for skilled workers in
order to reach and sustain the economic growth targets of the NDP. However, this is
evidently not in operation among the youth of working age that appears to be increasingly
longer-term unemployed and increasingly laid off from skilled and semi-skilled
occupations.
6. RESPONSE TO YOUTH UNEMPLOYMENT
Reducing South Africa’s high levels of unemployment and specifically youth
unemployment requires the economy to be on a labour absorbing growth path.
Reindustrialisation and economic diversification are necessary to boost job creation and
these factors are at the heart of the NDP and the New Growth Path (the jobs drivers).
Among the two policy documents, the NDP provided the clearest proposals aimed at
developing the youth and supporting youth employment. These proposals included:
• Provide nutrition intervention for pregnant women and young children, ensure universal
access to two years of early childhood development (ECD) and improve the school
system, including increasing the number of students achieving above 50 per cent in
Literacy and Mathematics, increasing learner retention rates to 90 per cent and
bolstering teacher training.
• Strengthen and expand the number of technical vocational education and training
(TVET) colleges to increase the participation ratio to 25 per cent, increase the
graduation rate of TVET colleges to 75 per cent, provide full funding assistance to
students from poor families and develop community safety centres to prevent crime.
• Strengthen youth service programmes and introduce new community-based
programmes to offer young people life-skills training, entrepreneurship training and
opportunities to participate in community development programmes.
• Create an enabling environment for small businesses and entrepreneurs to thrive by
instilling the spirit of entrepreneurship in schools, lowering the cost of doing business in
the economy and reducing barriers to entry in various value chains.
• Create a tax incentive for employers to reduce the initial cost of hiring young labour-
market entrants, provide a subsidy to the placement sector to identify, prepare and
place matric graduates into work; expand learnerships and make training vouchers
directly available to job-seekers; introduce a formalised graduate recruitment scheme
5 Skilled occupations = Manager, Professional and Technician
6 Semi-skilled occupations = Clerk, Sales & services, Skilled agriculture, Craft & related trade as well as Plant & machine
operator
Analysis of youth unemployment in Mpumalanga, 2008-2015 14
for the public service to attract highly skilled people; and expand the role of state-
owned enterprises in training artisans and technical professionals.
From these proposals flowed a number of interventions by the public sector.
Youth service programmes and community based programmes
The Community Works Programme (CWP) was already rolled out in 2008 and was
designed as an employment safety net whereby a person’s existing livelihood is
supplemented by offering a basic level of income through work. This programme has been
used in the poorest communities and complements the social grant system. This
programme was later extended to the Extended Public Works Program (EPWP). In
response to the NDP, the NYP proposes that there should be a youth target that should
gradually increase to above 50 per cent.
The National Rural Youth Service Corps, targeting rural youth, was implemented in
September 2010. The intervention comprised a comprehensive two-year skills and
incubation programme after which participants would be involved in community
development projects and be paid by government for their services. Training was
conducted in numeracy, literacy, construction and entrepreneurship skills relevant to
community development. The programme underestimated the amount of training required
for youth to actually take on community projects and the project was only seen as
marginally successful. The NYP, proposes that future iterations of this programme should
work toward scaling up the training that facilitated employment.
Furthermore, the NYP proposes that the public service internship programme must be
scaled up even beyond the current commitments to create 60 000 internship opportunities
or reach 5 percent of total employment. Government departments, provinces and
municipalities should be required to link the internship programme to their human resource
development strategies to create a talent pool from which to recruit when vacancies are
available.
Youth enterprises
Notable incentives to young entrepreneurs include:
The Departments of Trade and Industry (DTI) and Small Business Development’s
Youth Enterprise Development Strategy, 2013-2023 intends to provide support
schemes (i.e. youth business incubation, youth entrepreneurship collateral fund)
for young entrepreneurs with an objective of creating and managing sustainable
and efficient businesses capable of providing decent permanent jobs and
employment growth.
Analysis of youth unemployment in Mpumalanga, 2008-2015 15
The Industrial Development Corporation (IDC) and the Small Enterprise Finance
Agency have committed a combined R2.7 billion to finance youth-owned
enterprises.
NYDA has also supported a range of youth-owned enterprises and cooperatives
with finance, training and market linkages.
Tax incentive
National Treasury’s proposed youth employment subsidy, which was also proposed by the
NDP, resulted in an employment tax incentive (ETI) that came into effect on 1 January
2014 and is scheduled to end on 31 December 2016. The ETI encourages employers to
hire new, young and less experienced people aged between 18 and 29 years. The 2015
Budget Review reports that R2 billion was claimed in 2014 by some 29 000 employers who
have claimed for at least 270 000 young people. National Treasury indicated that the
incentive effectiveness will be reviewed after 2016 to determine whether or not it will be
continued after that.
7. RECOMMENDATIONS
The unemployment challenge confronting South Africa and Mpumalanga is significant, with
more than a quarter of the labour force unemployed. Within this bleak situation the
problem of youth unemployment is even more acute with close to 39 per cent of 15 to 34
year olds in Mpumalanga being unemployed. The prospects of finding a job are lower than
for the adult unemployed, because without experience, young people have little chance of
becoming employed. This is an economic problem and a waste of potentially productive
resources.
Essentially what is necessary is achieving and sustaining faster and inclusive economic
growth and a coordinated youth development approach consisting of:
better education and skills outcomes for the youth (Department of Education),
improved public employment schemes targeting youth (Departments involved in
EPWP, CWP and CDW),
industrial policy interventions to improve youth absorption in the economy
(Department of Economic Development and Tourism),
work exposure measures to provide young people with opportunities to gain on-the
job experience (all Departments),
interventions to support entrepreneurship among youth (Department of Economic
Development and Tourism), and
much stronger labour demand for youth through demand-side policies such as
National Treasury’s ETI.
Analysis of youth unemployment in Mpumalanga, 2008-2015 16
For the effective implementation of any youth policy, all spheres of government need to
work alongside the youth to involve them in planning and decision making. To this end,
youth desks must be established and fully capacitated at all provincial departments and
not just at the Office of the Premier.
Provincial departments should further be required to create internship opportunities that
reach 5 per cent of total employment in that department. This should include creating
student-teacher and student-nurse opportunities at public schools and hospitals.
Furthermore departments should be required to link the internship programme to their
human resource development strategies in order to create a talent pool from which to
recruit when vacancies are available.