Analysis of Web Caching in the Gigabit Research Network G-WiN
73
Analysis of Web Caching in the Gigabit Research Network G-WiN Christoph Lindemann and Oliver P. Waldhorst University of Dortmund Department of Computer Science August-Schmidt-Str. 12 44227 Dortmund, Germany http://www4.cs.uni-dortmund.de/~Lindemann/ April 2001 Abschlußbericht zum Projekt Analyse der Wirksamkeit von Web Caching im G-WiN Gefördert vom DFN-Verein mit Mitteln des BMBF Computer Systems and Performance Evaluation Prof. Dr.-Ing. Christoph Lindemann
Transcript of Analysis of Web Caching in the Gigabit Research Network G-WiN

Analysis of Web Caching in the Gigabit Research Network G-WiN
Christoph Lindemann and Oliver P. Waldhorst University of Dortmund
Department of Computer Science August-Schmidt-Str. 12
44227 Dortmund, Germany http://www4.cs.uni-dortmund.de/~Lindemann/
April 2001
Abschlußbericht zum Projekt
Analyse der Wirksamkeit von Web Caching im G-WiN
Gefördert vom DFN-Verein mit Mitteln des BMBF
Computer Systems and Performance EvaluationProf. Dr.-Ing. Christoph Lindemann


Project Summary
The tremendous growth expected in World Wide Web traffic in the next years
requires huge efforts to insure scalability and user acceptance. Web caching is a
common tool for reducing network traffic and guaranteeing reasonable response
times. To provide optimal Web caching solutions, network operators need in-
depth understanding of how the performance of a proxy cache is influenced by
workloads characteristics and network technology. This requires detailed analysis
and evaluation of different organizations of a standalone web proxy caches as well
as evaluation of different forms of cooperation between caching proxies
distributed across a wide area network.
In the first part of this report, we present a comprehensive performance study of
different organizations of a standalone web proxy cache under current and future
workload characteristics. As a novel feature of our study, we characterize request
streams seen at a Web proxy cache to HTML, images, and multi media documents
seen at a proxy cache. Based on this workload characterization, we derive
workload forecasts for institutional Web proxy caches and proxies residing in a
backbone network. The goal of our study constitutes the understanding how these
replacement schemes deal with different Web document classes. This
understanding is important for the effective design of Web cache replacement
schemes under changing workload characteristics.
While bandwidth for previous IP backbone networks deployed by Internet Service
Providers typically has been limited to 34 Mbps, current and future IP networks
provide bandwidth ranging from 155 Mbps to 2.4 Gbps. Thus, it is important to
investigate the impact of emerging network technologies on the performance of
cooperative Web caching protocols. In the second part of this project, we present
a comprehensive performance study of four cooperative Web caching protocols.
The goal of this performance study lies in understanding the behavior and limiting
factors of the considered protocols for cooperative Web caching under measured
traffic conditions. Based on this understanding, we give recommendations for
Internet Service Providers, Web clients, and Application Service Providers.
Key words:
Performance-oriented design and evaluation studies of Web caches, Web cache
replacement schemes, protocol support for cooperative Web caching, workload
characterization and forecasting, trace-driven simulation.

4 Analysis of Web Caching in the Gigabit Research Network G-WiN
Contents
1 Introduction.....................................................................................................................5
Part 1: Evaluating Hardware and Software Web Proxy Caching Solutions ......................7 2 Overview.........................................................................................................................7 3 Web Caching Products....................................................................................................9
3.1 Hardware Solutions.................................................................................................9 3.2 Software Solutions ................................................................................................12
4 Web Cache Replacement Schemes...............................................................................16 5 Workload Characterization of Traces and Workload Forecast.....................................20
5.1 Characterization of Current Web Proxy Workloads.............................................20 5.2 Forecast of Future Web Proxy Workloads............................................................23 5.3 Deriving the Workload Forecasts from the DEC and DFN Traces ......................26
6 Performance Experiments.............................................................................................27 6.1 Investigation of the Adaptability of Greedy Dual *..............................................27 6.2 Performance for Current Workloads.....................................................................29 6.3 Performance for Future Workloads ......................................................................31 6.4 Partitioned Web Proxy Caches .............................................................................36
Part 2: Evaluating Cooperative Web Caching for Emerging Network Technologies......38 7 Overview.......................................................................................................................38 8 Protocols for Cooperative Web Caching ......................................................................40 9 Simulation Environment ...............................................................................................45
9.1 Network Model .....................................................................................................45 9.2 Characteristics of the Considered Workloads.......................................................50
10 Comparative Performance Study of Considered Protocols ..........................................52 10.1 Performance Measures..........................................................................................52 10.2 Bandwidth Consumption and Protocol Efficiency ...............................................53
11 Document Retrieval Latency ........................................................................................58 11.1 Cache Utilization ..................................................................................................61
12 General Conclusions Drawn from Performance Studies ..............................................67 13 Recommendations for DFN-Verein..............................................................................69 References.............................................................................................................................71

Introduction 5
1 Introduction
Applications of the World Wide Web reach form browsing of information and online catalogs
over e-business solutions, teleteaching and –learning up to video conferences. The continued
exponential growth of the traffic volume and growing demand for access to web resources
anytime form anywhere sets new challenges to network operators, e.g Internet Service
Providers and academic institutions. Web caching is a common tool for reducing network
traffic and guaranteeing reasonable response times. Standalone Web proxy caches reduce the
traffic between local and wide area network. Internet Service Providers widely use
hierarchical clusters of web proxy caches. Several protocols for cooperation were developed,
e.g. the Internet Cache Protocol, ICP. These protocols make it easy to build up heterogeneous
caching solutions, employing cache appliances developed by different hardware vendors.
Transparent techniques enable users to benefit form the advantages of Web Caching without
even knowing of its existence.
Providing optimal caching solutions requires in-depth understanding of caching
technologies, workload characteristics as well as sensitivity to changes in technology and user
behavior. Therefore, detailed studies must be employed to explain and optimize the
performance of standalone web proxy caches. Furthermore, the behavior of cooperating web
caches has to be investigated with respect to the changing characteristics of the underling
network infrastructure, e.g. increasing bandwidth availability in the backbone network of a
national Internet Service Provider. Both studies must be accomplished by detailed analysis of
workload characteristics seen by caching proxies at different locations, i.e. institutional or
backbone proxies. Sensitivity studies help to understand behavior of protocols and algorithms
and supports design of long-term scalable caching solutions.
This report consists of two parts. Part 1 focuses on the organization of standalone web
proxy caches. It gives an overview over replacement schemes and protocols supported by
commercial caching solutions. A comprehensive performance study of widely used as well as
recently proposed replacement scheme is provided. The presented results are derived using
trace driven simulation. As simulation input, we use traces recorded by proxy caches located
at Universities and commercial institutions as well as in the backbone of the German research
network G-WiN. As a novel feature of our study, we characterize request streams seen at a
Web proxy cache to HTML, images, and multi media documents seen at a proxy cache. Based
on this workload characterization, we derive workload forecasts for institutional Web proxy
caches and proxies residing in a backbone network. The goal of our study constitutes the
understanding how these replacement schemes deal with different Web document classes.
This understanding is important for the effective design of Web cache replacement schemes
under changing workload characteristics.

6 Analysis of Web Caching in the Gigabit Research Network G-WiN
Part 2 focuses on the cooperation of Web proxy caches located in the backbone of a
national internet service provider, e.g. the G-WiN. While bandwidth for previous IP backbone
networks deployed by Internet Service Providers typically has been limited to 34 Mbps,
current and future IP networks provide bandwidth ranging from 155 Mbps to 2.4 Gbps. Thus,
it is important to investigate the impact of emerging network technologies on the performance
of cooperative Web caching protocols. In this report, we present a comprehensive
performance study of four cooperative Web caching protocols. We consider the Internet cache
protocol ICP, Cache Digests, the cache array routing protocol, CARP, and the Web cache
coordination protocol, WCCP. The performance of these protocols is evaluated using trace-
driven simulation with measured Web traffic from DFN and NLANR. The goal of this
performance study lies in understanding the behavior and limiting factors of the considered
protocols for cooperative Web caching under measured traffic conditions. Based on this
understanding, we give recommendations for Internet Service Providers, Web clients, and
Application Service Providers.
Part 1: Evaluating Hardware and Software Web Caching Solutions 7
Part 1: Evaluating Hardware and Software Web Proxy Caching Solutions
2 Overview
The continued growth of the World Wide Web and the emergence of new multi media
applications necessitates the use of proxy caches to reduce end-user latency and network
traffic. Commercial Web caching solutions include CacheFlow’s Server Accelerator, Cisco
CacheEngine, InforLibria’s DynaCache, Network Appliance NetCache, Inktomie’s Traffic
Server, Novell’s Internet Cache System. These products differ in cache size, disk storage, and
throughput. However, all commercial products currently on the market solely rely on the
replacement scheme Least-Recently-Used. Only Squid as open-source software freely
available to academic institutions can be configured to employ other cache replacement
schemes which have been proposed recently.
The optimization of cache replacement schemes is important because the growth rate of
Web content (i.e., multi media documents) is much higher that anticipated growth of memory
sizes for future Web caches [JB00]. Furthermore, recent studies (see e.g. [BCF+99]) have
shown hit rate and byte hit rate grow in a log-like fashion as a function of size of the Web
cache. Cao and Irani introduced the Web cache replacement scheme Greedy Dual Size [CI97]
which takes into account document sizes and a user defined cost function. They showed that
Greedy Dual size is on-line optimal with respect to this cost function. Jin and Bestavros
introduced Web cache replacement scheme Greedy Dual * as an improvement to Greedy Dual
Size [JB00]. They compared the performance of this newly proposed replacement scheme
with traditional schemes, are Least Recently Used (LRU), Least Frequently Used with
Dynamic Aging (LFU-DA), and with the size-aware scheme Greedy Dual Size [JB00]. Eager,
Ferris, and Vernon developed analytical models for determining optimal proxy cache content
for supporting continuous-media streaming [EFV00]. Arlitt, Friedrich, and Jin provided a
comparative performance study of six Web cache replacement schemes among which are
LRU, LFU-DA, and Greedy Dual Size [AFJ00]. They also observed an extreme
nonuniformity in popularity of Web requests seen at proxy caches. All these previous
performance studies consider a single request stream for analyzing the performance of
replacement schemes.
The first part of this project focuses on the evaluation of the replacement schemes of
hardware and software solutions of Web proxy caching solutions [CMT01]. The second part
focuses on the evaluation of the cooperative Web caching protocols (i.e., the Internet Cache
Protocol, ICP, the Cache Array Routing Protocol, CARP, and Cache Digests). In this part of
the report, we present comprehensive performance studies for LRU as traditional replacement
schemes as well as newly proposed schemes LFU-DA, Greedy-Dual-Size and Greedy-Dual *

8 Analysis of Web Caching in the Gigabit Research Network G-WiN
under current and future workload characteristics. The goal of our study constitutes the
understanding how these replacement schemes deal with different Web document classes.
This understanding is important for the effective design of Web cache replacement schemes
under changing workload characteristics.
A comprehensive characterization of previous Web workloads was given by Arlitt and
Williamson [AW97]. A recent survey article on performance characteristics of the Web
provided by Crovella [Cro00] explains why many of the characteristics of Web workloads
(e.g., document sizes and document popularity) possess high variability. The temporal locality
in Web workloads have been subject to two recent papers. Jin and Bestavros investigated
temporal locality in Web cache request streams [JB99]. Mahanti and Williamson provided a
detailed workload characterization for Web proxy caches [MW99]. They observed that in
several workload measured in 1998 HTML and image documents account for over 95% of all
requests. Eager, Mahanti and Williamson investigated the impact of temporal locality on
proxy cache performance [MEW00].
The workload characterization presented in Section 5 indicates that in future workloads
percentage of request for multi media documents will be substantially larger than in current
Web request streams seen at a proxy cache. Furthermore, we observed that the popularity of
some multi media documents rapidly increases. Moreover, the time between two successive
references to the same Web document denoted as temporal correlation decreases. These trends
are derived from five traces measured in 1996, 1998, and 2000. Based on these trends, using
linear regression we derive workload forecasts both for institutional Web proxy caches and
for proxy caches located in backbone networks. We present curves plotting the hit rate and
byte hit rate broken down for the HTML, image, and multi media documents. This breakdown
of hit rates and byte hit rates per document class shows that the overall hit rate is mainly
influenced by the hit rate on images. The overall byte hit rate is mainly influenced by the byte
hit rate on multi media documents. The presented curves indicate that in an overall evaluation
considering both hit rates and byte hit rates the software Web caching solution Squid with the
replacement scheme GD*(1) should be the choice for current workloads whereas Squid with
the replacement scheme GDS(1) should be the choice for future workloads. The performance
results are derived by trace-driven simulation. The simulator for the Web cache replacement
strategies has been implemented using the simulation library CSIM [Sch95].
This part of the report is organized as follows. Section 3 introduces commercial Web caching
products currently on the market. The replacement schemes employed in these Web caching
solutions are described in Section 4. Section 5 provides a comprehensive characterization of
the workloads derived from the considered traces. Moreover, we present two workload
forecasts taking into account the rapidly increasing popularity of multi media applications. In
Sections 6, we present performance curves for the considered Web cache replacement
schemes derived from trace data and workload forecasts.

Part 1: Evaluating Hardware and Software Web Caching Solutions 9
3 Web Caching Products
3.1 Hardware Solutions
CacheFlow
Cache Flow [CF01] offers two Web caching product lines called Client Accelerators and
Server Accelerators. Server Accelerators are surrogates also known as reverse proxy caches.
They are placed in front of a Web server in order to service request for documents located on
the Web server. Their functionality adds availability to popular Web sides by taking load
form the origin server. Server Accelerators are outside the scope of this report. Client
Accelerators (CA) are Web caches, which can be placed in existing networks. They reduce
response times and bandwidth requirements by moving Web and streaming content closer to
the user and accelerate client requests. Thus, they achieve scalability of existing networks.
All CacheFlow accelerators are run by the patent-pending CacheOS operating system.
CacheOS is a specially designed operating system for offering scalability and reliability to
Web caching applications. All CacheFlow accelerators can be upgraded by software-addons
to enable firewall functionality and content filtering. CacheFlow accelerators support the
Hypertext Transfer Protocol (HTTP) v1.0 and v1.1, the File Transfer Protocol (FTP), the
Network News Transfer Protocol (NNTP) and domain name system (DNS) caching. The CA
600 family additionally supports the Internet Cache Protocol (ICP) as well as the Web Cache
Coordination Protocol (WCCP) v1.0 and v2.0 for cooperative Web caching. The WCCP
protocol is shipped with Cisco routers and offers transparent Web caching. Network
management support is provided through compatibility with the Simple Network
Management Protocol (SNMP). The CacheFlow products currently available do not offer
protocol support for streaming applications like digital audio and video transmission over the
Internet.
CacheFlow product line of accelerators differs in cache size, throughput, and price. The
CA 600 family is designed for small Internet Service Providers (ISPs) and enterprises, while
CA 3000 and 5000 families are designed for large ISPs who aim at saving substantial
bandwidth in the wide area network. The CA-600 series of client accelerators are used by
enterprises, ISPs, and other organizations worldwide to manage and control Web traffic
growth, while accelerating the delivery of content to users. The CacheFlow client accelerator
is deployed between users and the Internet or at remote sites, and intelligently manages
requests for content. The CacheFlow 3000 is a high performance Internet caching appliance.
Supporting incoming traffic loads from 10 to 45 Mbps, the 3000 Series is a mid-range Web
caching solution for ISPs and enterprises. According to its vendor, CacheFlow 3000 products
scale network capacity with minimal infrastructure investments. The CacheFlow 5000 is the
high-end product of CacheFlow supporting incoming traffic loads up to 135 Mbps containing

10 Analysis of Web Caching in the Gigabit Research Network G-WiN
126 GB disk storage. The technical data of CacheFlow client accelerators is summarized in
Table 1.
Cisco
Cisco’s Web caching solution comprises of the Cache Engine 500 series [CS01]. The Cisco
Cache Engine 500 series products accelerate content delivery, optimize network bandwidth
utilization, and control access to content. Opposed to the operating-system-based caching
solution provided by CacheFlow, Cisco cache engines are integrated into the network
infrastructure. Cisco caching solutions can be cost-effectively deploy on a wide-scale basis
and gain the benefits of caching throughout your entire network. Traditional proxy-based or
standalone caches are not inherently designed to be network integrated, resulting in relatively
higher costs of ownership and making them less desirable for wide-scale deployment.
All Cisco products support HTTP v1.0 and v1.1, FTP, NNTP, and DNS caching.
Supporting ICP provides compatibility to existing environments for cooperative Web caching.
In 1997, Cisco pioneered the industry's first content routing technology, the Web Cache
Coordination Protocol (WCCP) version 1.0. WCCP is a router-cache protocol that localizes
network traffic and provides network-intelligent load distribution across multiple network
caches for maximized download performance and content availability. Since spring 2000, the
protocol WCCP v2.0 is available and widely employed. According to Cisco, they will
continue to lead the innovations and enhancements to this protocol and other content routing
technologies. As for CacheFlow products, Cisco provides network management support
through compatibility with SNMP and Cisco products currently available do not offer
protocol support for streaming applications.
Cisco Cache Engine Series products differ in storage capacity and throughput. Cisco Cache
Engine 505 is a entry-level cache engine for small enterprise branch offices with incoming
traffic up to 1.5 Mbps. Cisco’s Cache Engine 550 is a midrange a Web caching solution for
regional offices with uplink network bandwidth up to 11 Mbps. Cisco’s Cache Engine 570 is
a Web caching solution for small service provider POPs and medium-sized enterprises with
incoming traffic up to 22 Mbps. Storage expansion is available via the Cisco Storage Array.
Cache Engine 590 is a high-end caching solution designed for service providers and large
enterprises with incoming traffic up to 44.7 Mbps. The technical data of Cisco Cache Engine
series products is summarized in Table 1.
InfoLibria
The Web caching solution offered by InfoLibria's comprises of the DynaCache [Inf01]
products. According to InfoLibria, DynaCache offers carrier-grade caching and intelligent
content management. By automatically storing commonly requested Web objects at the edge
of the local network, DynaCache enables high-speed access to the freshest Internet content

Part 1: Evaluating Hardware and Software Web Caching Solutions 11
while minimizing bandwidth demand to popular Web sites. The result is increased network
reliability, faster performance and shorter end-user latency. DynaCache products comes in
configurations to meet the diverse networking and business needs. DynaCache technology is
applied at ISPs and Application Service Providers (ASPs), wireless ISPs, and Satellite Service
Providers.
As CacheFlow accelerators InfoLibria’s DynaCache products are run by a special-purpose
operating system specially designed for offering scalability and reliability to Web caching
applications. DynaCache contains software for firewall functionality and content filtering.
DynaCache supports the protocols HTTP v1.0 and v1.1, FTP, NNTP, and DNS caching. For
cooperative Web caching, DynaCache supports ICP and WCCP v2.0. Network management
support is provided through compatibility with SNMP. As for CacheFlow and Cisco products,
InfoLibria’s products currently available do not offer protocol support for streaming
applications like digital audio and video transmission over the Internet.
InfoLibria’s DynaCache series offer products with different storage capacity and
throughput. The entry solution constitutes the DynaCache 10 with a hard disk storage
capacity of 36 GB and a maximal throughput of 12 Mbps. The most powerful Web caching
device of InfoLibria’s product line is the DynaCache 40. Its hard disks offer up do 144 GB of
cache storage. Its maximum throughput is 34 Mbps. The technical data of InfoLibria’s
DynaCache products is summarized in Table 1.
Network Appliance
The hardware Web caching solution offered by Network Appliance [NA01] comprises of the
NetCache product lines. NetCache products solve content delivery problems faced by
enterprises, content distribution networks, ISPs, and ASPs. These appliances can be used in
the entire network, from central headquarters to remote points of presence and local offices.
Opposed to the products introduced above, the NetCache product line does support streaming
applications. Thus, NetCache can also deliver digital audio and video enabling next-
generation network applications such as large-scale video-on-demand services.
As CacheFlow accelerators and InfoLibria’s DynaCache, the NetCache products are run by
a special-purpose operating system specially designed for offering scalability and reliability to
Web caching and media streaming applications. NetCache supports the protocols HTTP v1.0
and v1.1, FTP, NNTP, and DNS caching. For cooperative Web caching, DynaCache supports
ICP and WCCP v2.0. Network management support is provided through compatibility with
SNMP. NetCache also include support for major streaming media technologies through
compatibility with the Real Time Streaming Protocol (RTSP) and the internet Content
Adaptation Protocol (iCAP).
The NetCache family includes three distinct product lines: NetCache C1100, NetCache
C700, and NetCache C6100. NetCache C1100 Series are the entry-level NetCache products

12 Analysis of Web Caching in the Gigabit Research Network G-WiN
designed for enterprise remote or branch offices as well as small and medium enterprises. The
C1100 series supports multiple connections for HTTP environments with 1.5 Mbps
bandwidth and connections with 155 Mbps for streaming applications. The mid-range
NetCache C700 Series products supporting a wide range of capacity, performance, and
reliability features. Reliability and availability of mission-critical data is ensured with features
like RAID, redundant hardware, and hot-swap drives. The expansion choices make the
NetCache C700 series ideal solutions for environments experiencing rapid growth. The high-
end NetCache C6100 Series products deliver highest performance and reliability for the data
center and other high-bandwidth locations. The C6100 solutions support 155 Mbps and more
for HTTP environments and 622 Mbps and more for streaming applications. Large content
libraries with up to 2 TB of storage can be reliably stored and accessed.
Table 1 summarizes the technical data of the hardware solutions for Web caching. Note
that the commercial products differ in size of disk storage and RAM while all products
employ Least Recently Used (LRU) as replacement scheme for Web documents.
3.2 Software Solutions
Inktomi
Inktomi [Inc01] offers a software Web caching solution called Traffic Server. Inktomi’s
Traffic Server is a robust network cache platform that improves quality of service, optimizes
bandwidth usage and provides a foundation for the delivery of new services at the edge of the
network. Traffic Server is available in three versions: Traffic Server C-Class for carriers and
Vendor Product Disk in GB
RAM in MB
Throughput in Mbps
Replacement Scheme
CacheFlow 600 36 768 10 LRU CacheFlow 3000 63 1,024 45 LRU
CacheFlow
CacheFlow 5000 126 N/A 135 LRU
Cache Engine 505 18 128 1.5 LRU Cache Engine 550 18 256 11 LRU Cache Engine 570 144 384 22 LRU
Cisco Systems
Cache Engine 590 144 384 44.7 LRU
DynaCache DC 10 36 512 12 LRU DynaCache DC 20 40 512 21 LRU DynaCache DC 30 72 512 27 LRU
InfoLibria
DynaCache DC 40 144 1,024 34 LRU
NetCache C1100 9 256 1.5 LRU NetCache C1105 72 512 1.5 LRU NetCache C720 1,024 512 N/A LRU
Network Appliance
NetCache C6100 2,048 3,096 155 LRU
Table 1. Technical summary of hardware caching solutions

Part 1: Evaluating Hardware and Software Web Caching Solutions 13
service providers, Traffic Server E-Class for enterprise networks, Traffic Server Engine cache
appliance solutions. The first two products are true software solutions; the latter one
constitutes an integrated hardware and software package through Inktomi's partners called
original equipment manufacturers (OEM). These OEMs associated with Inktomie include
Sun, HP, and SGI. As a software solution, Traffic Server easily allows the integration of
services like on-demand streaming media, filtering and transformation at the edge of the
network. According to Inktomie, Traffic Server is the only network cache that also functions
as a platform for delivering services at the edge of the network. Traffic Server allows the
integration of applications directly into the network to perform valuable functions like
filtering out inappropriate or offensive Web content or transforming Internet content so that it
can be viewed on cell phones or hand-held PCs.
As all hardware cache solutions introduced in the previous section, Inktomi’s Traffic
Server supports the protocols HTTP v1.0 and v1.1, FTP, NNTP, and DNS caching. For
cooperative Web caching, the Traffic Server products support the protocols ICP and WCCP
v2.0. ICP is used for cache coordination and provides compatibility with existing network
caches. Transparent caching using the WCCP protocol enables interoperability between
Inktomi’s Traffic Server and Cisco-based routers. Network management support is provided
through compatibility with SNMP. As the NetCache products of Network Appliance,
Inktomi’s Traffic Server include support for major streaming media technologies through
compatibility with the Real Time Streaming Protocol (RTSP) and the internet Content
Adaptation Protocol (iCAP).
Inktomie’s Traffic Server can be run on the operating system platforms Sun Solaris 2.6 and
Solaris 7 under a Sun Ultra SPARC with at least 256 MB RAM, True64 UNIX on a Digital
Alpha/OSF server with at least 256 MB RAM, SGI IRIX 6.5 on SGI MIPS systems with at
least 256 MB RAM, as well as FreeBSD 3.1 and Windows NT 4.0 on any Pentium-based
system or equivalent. On these systems, the Traffic Server software platforms support six to
eight disks for Web caching. Employing the largest SCSI disks currently available, the high-
end Traffic Server product can manage cache size of 400 GB. Throughput values achieved by
Inktomie’s Traffic Server products cannot be specified since it depends on the underlying
hardware and operation system.
Novell
The software Web caching solution offered by Novell [Nov01] comprises of the Internet
Caching System (ICS) product line. ICS enables small and medium enterprises as well as ISPs
to increase the efficiency of their network infrastructures while reducing their associated costs
by acting as forward proxy to accelerate organizations' access to the Internet. According to
Novell, ICS appliances typically serve 40% to 70% of requests directly from the cache, thus,
reducing request latency and tremendously improving the network efficiency. ICS appliances

14 Analysis of Web Caching in the Gigabit Research Network G-WiN
can be configured in clusters for load balancing and fault tolerance. Furthermore, ICS also
supports activity logging and transparent proxy. ICS provides high-speed delivery of any
static multimedia object through HTTP encapsulation. For December 2000, Novell has
announced to add native support for common media formats, providing control of live and on-
demand media streams. Novell’s partners include major PC manufacturers such as Compaq,
Dell, and IBM. These original equipment manufacturers (OEM) have licensed ICS and
integrate this software caching solution into their own internet appliances.
As Inktomi’s Traffic Server, Novell’s ICS supports the protocols HTTP v1.0 and v1.1,
FTP, and NNTP. However, opposed to the Traffic Server product line, ICP does not support
DNS caching. Again as Inktomi’s Traffic Server, ICS products support the protocols ICP and
WCCP v2.0 for cooperative Web caching and network management support is provided
through compatibility with SNMP. As the hardware solutions of CacheFlow, Cisco, and
Novell’s products currently available do not offer protocol support for streaming applications
like digital audio and video transmission over the Internet.
Novell’s ICS products run on Intel Pentium based PCs with at least 256 MB RAM. As
operating system, the ICS products run under the special purpose operating system Proxy-OS
provided by Novell. Depending on the hardware platform, ICS product can manage cache size
between 9 and 27 GB. As for Inktomie’s Traffic Server, throughput values achieved by
Novell’s ICS products cannot be specified since it depends on the underlying hardware
platform.
Squid
Opposed to the commercial hardware and software caching solutions introduced above, Squid
[Squ01] is a non-commercial, full-featured software Web proxy cache. Squid is designed to
run on Unix systems. Squid is open-source software freely available to academic institutions.
The Squid software was originally developed at the National Laboratory for Applied Network
Research (NLANR) in a project funded by the National Science Foundation. The Squid
project was lead by Duane Wessels. The current version of Squid, Squid v2.3, is the result of
efforts by numerous individuals from the Internet community. Due to its open source
philosophy, Squid constitutes an ideal platform for implementation of academic prototypes of
Web caching schemes and protocols.
Squid supports the protocols HTTP v1.0 and v1.1, FTP, NNTP, and DNS caching. For
cooperative Web caching, Squid supports the protocols ICP and WCCP v2.0. Moreover,
opposed to all other caching solution introduced above Squid also supports cooperative
caching using the Cache Array Routing Protocol (CARP) and Cache Digests. As Novell’s
software solution, Squid does not offer protocol support for streaming applications like digital
audio and video transmission over the Internet.

Part 1: Evaluating Hardware and Software Web Caching Solutions 15
Squid is a high-performance proxy caching server for Web clients. Unlike traditional
caching software, Squid handles all requests in a single, non-blocking, I/O-driven process.
Squid keeps meta data and especially hot objects cached in RAM, caches DNS lookups,
supports non-blocking DNS lookups, and implements negative caching of failed requests.
Squid supports the Secure Sockets Layer (SSL), extensive access controls, and full request
logging. By using the lightweight ICP, Squid caches can be arranged in a hierarchy or mesh
for additional bandwidth savings. Squid consists of a main server program called squid, a
DNS lookup program called dnsserver, some optional programs for rewriting requests and
performing authentication, and some management and client tools. When squid starts up, it
spawns a configurable number of dnsserver processes, each of which can perform a single
blocking DNS lookup.
Squid runs on any modern Unix platform. In particular, Squid runs on Linux, FreeBSD,
NetBSD, OSF and Digital Unix, IRIX, SunOS/Solaris, AIX, HP-UX, and OS/2. The
minimum hardware requirements comprise of a single-processor PC or workstation with 128
MB RAM. Depending on the hardware platform, Squid can manage cache size up to 512 GB.
As in case of the other software solutions, throughput values achieved by Squid cannot be
specified.
Table 2 summarizes the product data of the software solutions for Web caching. Note that
again all commercial products employ LRU as replacement scheme for Web documents. Note
that Squid not only can be configured to use the cache replacement schemes LRU but also
Least Frequently Used with Dynamic Aging (LFU-DA), Segmented LRU, and Greedy Dual
Size (GDS).
Table 3 provides a summary of the protocols for data transport, cooperative Web caching,
streaming and content adaption supported by the considered hardware and software solutions
for Web caching.
Vendor Product Replacement Original Equipement Manufacturer Inktomi Traffic Server E-Class
Traffic Server C-Class Traffic Server Engine
LRU Intel NetStructure 3Com
Novell Internet Caching System LRU Compaq TaskSmart Dell PowerAppliance IBM Netfinity
NLANR Squid LRU, SLRU, LFU-DA, GDS
Unix Workstations
Table 2. Technical summary of software caching solutions

16 Analysis of Web Caching in the Gigabit Research Network G-WiN
Vendor
HT
TP
1.0
/1.1
FT
P
NN
TP
DN
S
ICP
CA
RP
Cac
he D
iges
ts
WC
CP
RT
SP
iCA
P
Cache Flow x x x x - - - x - -Cisco x x - - x - - x - -InfoLibria x x - x x - - x - xNetwork Appliance x x x - x - - x x xInktomi x x x - x - - x x -Novell x x x - x - - x - -Squid x x - x x x x x - -
Streamingand Content
AdaptionProtocol Web Caching
Transport Cooperative
Table 3. Protocol support provided by hardware and software caching solutions
4 Web Cache Replacement Schemes
In traditional memory systems object sizes (i.e., a cache line or a memory page) and miss
penalties (delay for bringing an object into the cache) are constant. The salient feature of Web
caching lies in the high variability of both the cost for bringing in new Web documents and
the size of such documents. In this report, we present the results for Least Recently Used,
Segmented Least Recently Used, a frequency based algorithm Least Frequently Used with
Dynamic Aging, and two size-aware replacement schemes Greedy Dual Size and Greedy
Dual * which have been recently proposed.
In [JB00], two cost models for Web cache replacement schemes have been introduced. In
the constant cost model, the cost of document retrieval is fixed. The packet cost model
assumes that the number of packets transmitted determines the cost of document retrieval.
The constant cost model is the model of choice for institutional proxy caches, which mainly
aim at reducing end user latency by optimizing the hit rate. The packet cost model is
appropriate for backbone proxy caches aiming at reducing network traffic by optimizing the
byte hit rate.
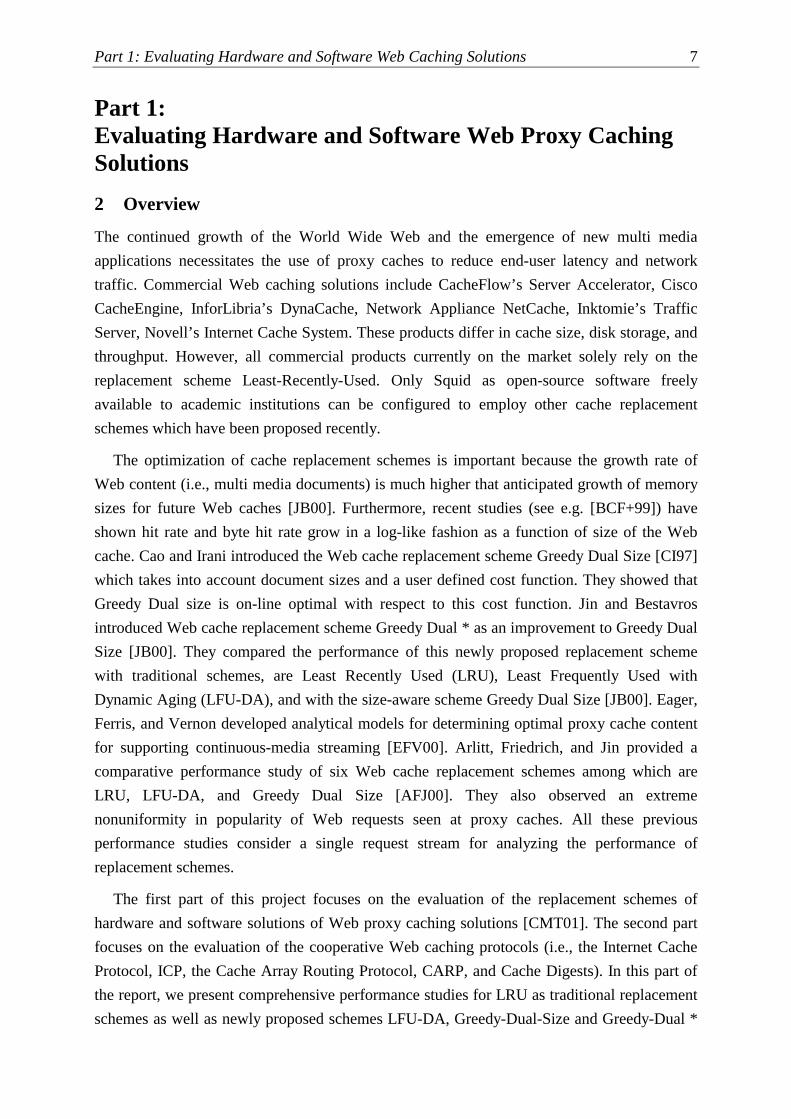
Least Recently Used (LRU [AW97]) is a recency-based policy. It is based on the
assumption that a recently referenced document will be referenced again in near future.
Therefore, on replacement LRU removes the document from cache, which has not been
referenced for the longest period of time. The functionality of LRU is illustrated in Figure 1.
LRU uses a LRU-Stack. On a cache miss, the requested document is put on the most recently
used (MRU) end
Part 1: Evaluating Hardware and Software Web Caching Solutions 17
Hit
Miss
MRU
Evicted Document
LRU...
Figure 1. Illustration of the Least Recently Used replacement scheme
of the stack. All other documents are pushed one step towards the least recently used (LRU)
end of the stack. On a cache hit, the requested document is located in the stack and moved
again to the MRU end. On document eviction, the document at the LRU end of the stack is
evicted. LRU can be implemented using a reference stack as illustrated in Figure 1.
LRU is the most widely used cache replacement scheme. Because LRU considers a fixed
cost and size of documents, LRU aims at optimizing the hit rate. The good performance of
LRU is due to the exploitation of locality of reference in the document request stream. The
disadvantage of LRU lies in neglecting the variability in cost and size of Web documents.
Furthermore, LRU does not take into account frequency information in the request stream.
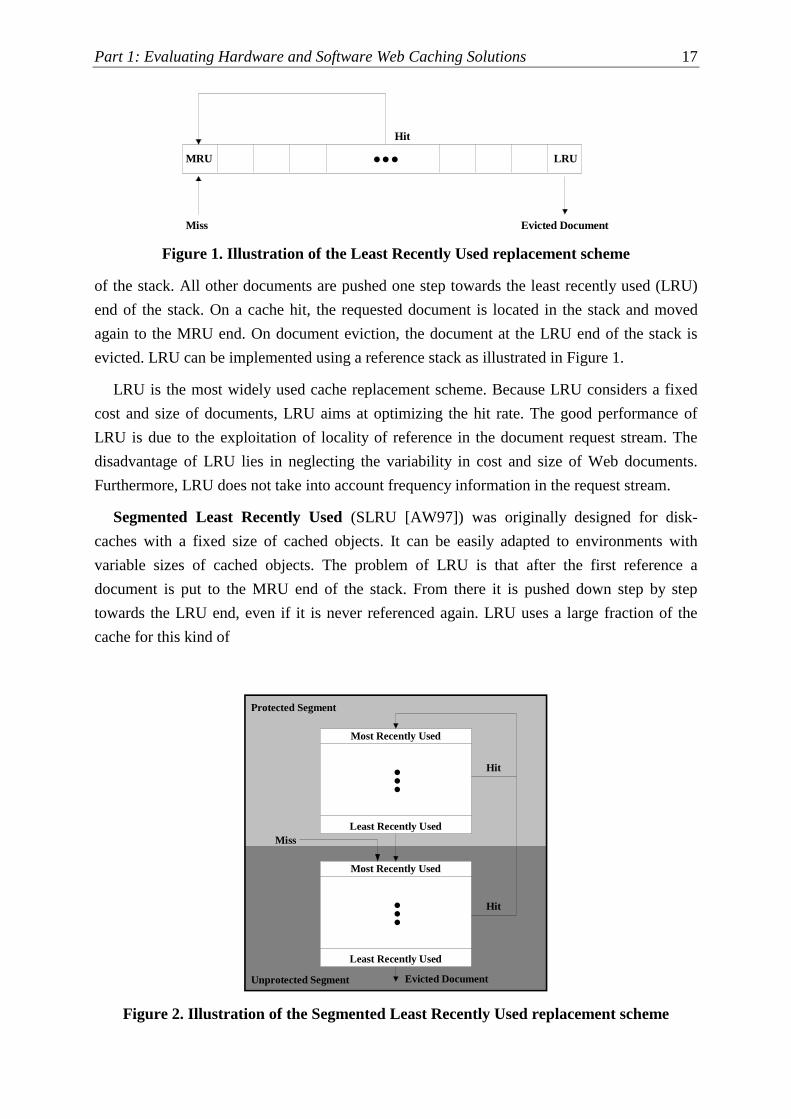
Segmented Least Recently Used (SLRU [AW97]) was originally designed for disk-
caches with a fixed size of cached objects. It can be easily adapted to environments with
variable sizes of cached objects. The problem of LRU is that after the first reference a
document is put to the MRU end of the stack. From there it is pushed down step by step
towards the LRU end, even if it is never referenced again. LRU uses a large fraction of the
cache for this kind of
Most Recently Used
Least Recently Used
...
Most Recently Used
Least Recently Used
...
Unprotected Segment
Protected Segment
Evicted Document
Hit
Hit
Miss
Figure 2. Illustration of the Segmented Least Recently Used replacement scheme

18 Analysis of Web Caching in the Gigabit Research Network G-WiN
one timers. Segmented LRU solves the problem of one timers by dividing the stack in two
segments, a protected segment and an unprotected segment. Both segments are implemented
by LRU stacks. After a cache miss, the requested document is fetched and put at the MRU
end of the unprotected segment. From there it is pushed down towards the LRU end. If the
document is never referenced again, it is evicted form cache when reaching the LRU end. On
a cache hit, the requested document is located in the stacks and placed at the MRU end of the
protected segment from which is pushed down step by step towards the LRU end of the
segment. If an object reaches the LRU end, it is placed at the MRU end of the unprotected
segment and treated as after a cache miss. The functionality of SLRU is illustrated in Figure
2.
SLRU is a parameterized replacement scheme. It requires a parameter specifying the
fraction fp of cache memory used for the protected segment. Previous studies have shown that
a fp = 0.6 yields best results [AFJ00]. Therefore, in performance studies we set size of the
protected segment to 60% of cache size.
Least Frequently Used with Dynamic Aging (LFU-DA [AFJ00]) is a frequency-based
policy that also takes into account the recency information under a fixed cost and fixed size
assumption. In LFU, a decision to evict a document from cache is made by the number of
references made to that document. The reference count for all documents in cache is kept and
the document with smallest reference count is evicted. LFU-DA extends LFU by an dynamic
aging algorithm in order to avoid cache pollution. LFU-DA keeps a cache age which is set to
the reference count of the last evicted document. When putting a new document into cache or
referencing an old one, the cache age is added to the documents reference count. It has been
shown that LFU-DA achieves high byte hit rates. A basic implementation of LRU-DA shown
in Figure 3. A value Ap is associated with each cached document. The cache age is denoted by
Initialize
Set L � 0 for each request to a document p do if p resides in cache Ap � L + V(p) else fetch p while there is not enough free space in the cache Set L � min{ Aq | q is a document in the cache } evict the document q with smallest Aq value end while Set Ap � L + V(p) end if end for
Figure 3. Pseudo code implementation for LFU-DA, GDS and GD*

Part 1: Evaluating Hardware and Software Web Caching Solutions 19
L, whereas the value of a document V(p) is set to its reference count. On every request, the
value Ap of the requested document is updated. On every eviction, L is set to the value Ap of
the evicted document.
Greedy Dual Size (GDS [CI97]) proposed by Cao and Irani considers variability in cost
and size of Web documents by choosing the victim based on the ratio between the cost and
size of documents. As LFU-DA, GDS associates a value Hp with each Web document p in the
cache. When document p is brought initially into the cache or is referenced while already in
cache, H p( ) is set to c p s p( ) ( ) . Here s p( ) is the document size and c p( ) is a cost function
describing the cost of bringing p into the cache. When a document has to be replaced, the
victim �p with � : min{ ( )}minH H pp
� is chosen among all documents resident in the cache.
Subsequently, the H values are reduced by Hmin [CI97]. However, as LRU, the disadvantage
of GDS lies in not taking into account frequency information in the request stream. An
efficient implementation of the GDS functionality is provided in Figure 3. Here, the Value
V(p) of a document p is set to H(p).
Greedy Dual * (GD* [JB99], [JB00]) proposed by Jin and Bestavros captures both
popularity and temporal correlation in a Web document reference stream. The frequency in
the formula for the base value L captures long-term popularity. Temporal correlation is taken
into account by the rate of aging controlled by the parameter �. GD* sets the values of H for a
document p to � � ��
H p f p c p s p( ) ( ) ( ) ( )� � E where f p( ) is the document’s reference count.
The parameter E is characterizing the temporal correlation between successive references to a
certain document observed in the workload as described in Section 5. The novel feature of
GD* is that f p( ) and E can be calculated in an on-line fashion which makes the algorithm
adaptive to these workload characteristics. GD* can be implemented by setting V(p) = H’(p)
in the pseudo code implementation shown in Figure 3.
GDS and GD* describe families of algorithms. The optimized performance measure (i.e.
hit rate or byte hit rate) of a specific implementation depends on definition of the cost
function c p( ) . In this report, we examine two variants of GDS and GD*. The first applies the
constant cost model by setting cost function to c p( ) 1. We refer to the resulting algorithms
as GDS(1) and GD*(1), respectively. The second variant applies the packet cost model by
setting the cost function to the number of TCP packets needed to transmit document p , i.e.,
c p s p( ) ( ) �2 536. These replacement schemes are denoted GDS(packets) and
GD*(packets), respectively.
A discrete-event simulator has been implemented for the replacement schemes LRU,
SLRU, LFA-DA, GDS(1), GD*(1), GDS(packets), and GD*(packets) using the simulation
library CSIM [JB00]. This simulator consists of 15,000 lines of C++ code. The simulation
runs presented in Section 5 are performed on a dual processor Sun Enterprise 450
workstation. For details of the simulation environment see Appendix A and B.

20 Analysis of Web Caching in the Gigabit Research Network G-WiN
5 Workload Characterization of Traces and Workload Forecast
5.1 Characterization of Current Web Proxy Workloads
To characterize the workload of Web proxy caches, we consider five different traces. The
oldest trace was collected in 1996 by DEC [Mog96] and already used in previous
performance studies of replacement schemes [BCF+99], [CF01], [JB00]. The most recent
trace was recorded in July 2000 in the German research network by DFN [GPV01]. For
workload forecasting, we additionally consider traces collected at the Canadian CA* net II
[MW99], at the University of Saskatchewan [MW99] both of 1998, and at the University of
Dortmund of July 2000. These five traces are referred to as DEC, DFN, CANARIE, Univ.
Sask., and Univ. Do., respectively. The DEC and DFN traces are used for evaluating the
performance of proxy cache replacement schemes under current workload conditions. The
characteristics of the remaining traces are employed for deriving workload forecasts. The
CANARIE and DFN traces were collected at the primary-level proxy cache in the core of the
Canadian CA* Net II and of the German Research Network, respectively. The DEC, Univ.
Sask., and Univ. DO. traces were collected at institutional-level Web proxy caches
functioning as secondary-level Web proxy caches.
Preprocessing the DEC and DFN traces, we excluded uncachable documents by commonly
known heuristics, e.g. by looking for string “cgi” or “?” in the requested URL. From the
remaining requests, we considered responses with HTTP status codes 200 (OK), 203 (Non
Authoritative Information), 206 (Partial Content), 300 (Multiple Choices), 301 (Moved
Permanently), 302 (Found), and 304 (Not Modified) as cacheable [AFJ00], [CI97], [JB99].
Details on trace preprocessing are given in Appendix B. Table 4 summarizes the properties of
the DEC and DFN trace. We brake down the request stream of documents according to their
content type as specified in the HTTP header. If no content type entry is specified, we guess
the document class using the file extension. We omit documents which could not be classified
in this way. We distinguish between three main classes of Web documents: HTML documents
(e.g., .html, .htm), image documents (e.g., .gif, .jpeg), and multimedia documents (e.g., .mp3,
.ram, .mpeg, .mov). Text files (e.g. .tex, .java) are added to the class of HTML documents.
Typical multimedia documents are static audio and video files. A few compressed binary
downloads (.gz, .zip) as well as a small number of application documents (.ps and .pdf)
contained in the traces are also categorized as multi media documents. Table 4 states the
properties of the DEC and DFN traces. We observe that in current workloads HTML and
image documents together account for about 95% of documents seen and of requests received.
This observation has also been observed in [MW99] for a number of other proxy traces
among which are CANARIE and Univ. Sask.
The key property for the performance of Web caching constitutes temporal locality in the
request stream. Temporal locality can be quantified by the relationship between the

Part 1: Evaluating Hardware and Software Web Caching Solutions 21
Trace DEC DFN Date 1996 2000 Classification of cache Institutional Proxy Backbone Proxy
Number of documents 1,226,350 2,841,790
Overall size (MB) 19,420.16 39,434.24
Mean document size (KB)
16.21 14.55
Variance of document size
55.45 268.62
Number of requests 3,643,328 6,686,409
All cachable documents
Requested data (MB) 45,396.99 81,337.55
Number of documents 301,926 (24.6%) 626,418 (22.0%)
Overall size (MB) 1,945.60 (10.0%) 8,755.20 (22.2%)
Mean document size (KB)
6.84 14.63
Variance of document size
3.96 4.28
Number of requests 574,551 (15.7%) 1,346,231 (20.1%)
HTML
Requested data (MB) 3,997.70 (8.8%) 17,431.93 (21.4%)
Images Number of documents 875,700 (71.1%) 2,063,076 (72.6%)
Overall size (MB) 8,448,00 (43.5%) 13,957.12 (35.4%) Mean document size (KB)
10.22 7.10
Variance of document size
7.66 7.38
Number of requests 2,994,068 (82.2%) 5,096,117 (76.2%) Requested data (MB) 21,240.52 (46.8%) 25,265.22 (31.1%)
Number of documents 48,724 (4.0%) 152,296 (5.4%)
Overall size (MB) 9,026.56 (46.5%) 16,721.92 (42.4%) Multi media
Mean document size (KB)
189.71 115.23
Variance of document size
25,003 43,593
Number of requests 74,709 (2.1%) 244,061 (3.7%) Requested data (MB) 20,158.77 (44.4%) 38,640.31 (47.5%)
Table 4. Properties of DEC and DFN traces
probability of an access to a Web document and the time passed since the last access to this
document. As discussed in [JB00], temporal locality in the request stream is caused by two
different sources: The popularity of Web documents and the temporal correlation in the
request stream. A popular Web document is seen often in a request stream. Therefore, popular
documents are referenced more often in a short time interval than less popular documents.
Temporal correlation take into account the time between two successive references to the
same document. A hot Web document is requested several times in a short intervals whereas

22 Analysis of Web Caching in the Gigabit Research Network G-WiN
1
1.5
2
2.5
3
3.5
4
4.5
5
1 1.5 2 2.5 3
log 1
0(re
fere
nce
coun
t)
log10(time since last reference) in minutes
HTMLImage
Multi Media
Figure 4. Breakdown of interreference times by document class in DEC trace
1
1.5
2
2.5
3
3.5
4
4.5
5
1 1.5 2 2.5 3
log 1
0(re
fere
nce
coun
t)
log10(time since last reference) in minutes
HTMLImage
Multi Media
Figure 5. Breakdown of interreference times by document class in DFN trace

Part 1: Evaluating Hardware and Software Web Caching Solutions 23
the average document is referenced just a few times. Temporal locality can be characterized
by two parameters. The first parameter, denoted as the popularity index � describes the
distribution of popularity among the individual documents. The number of requests N to a
Web document is proportional to its popularity rank � to the power of ��, that is: N ~ � D� .
The popularity index � can be determined the slope of the log/log scale plot for the number of
references to a Web document as function of its popularity rank.
The second parameter, denoted as � measures the temporal correlation between two
successive references to the same Web document. The probability P that a document is
requested again after n requests is proportional to n to the power of ��, that is: P n~ �E .
Temporal correlation between successive accesses to the same document can be measured by
plotting the reference count as a function of reference interarrivals. That is the number of
requests seen in the request stream between successive access to one particular document. To
eliminate the influence of popularity on such a plot (i.e., more popular documents are likely to
be accessed after shorter periods of time) the plot is done for equally popular document, e.g.
by plotting reference interarrivals after a document has been accessed k times.
For the DEC and DFN traces, the calculated values for � and ��are shown in Tables 5 and
6. These values indicate that there are some extremely popular images whereas popularity is
more wide spread for text documents and multi media documents. Figures 4 and 5 plot for the
DEC and DFN traces the interreference times broken down for each document class. The
interreference time is given by the time elapsed between two successive accesses to a
particular Web document. Note that distribution of interreference times reflects both
popularity and temporal correlation [JB99]. As shown in Figures 4 and 5, the degree of
temporal locality in Web request streams is different for the three considered document
classes.
5.2 Forecast of Future Web Proxy Workloads
For forecasting the workload of institutional Web proxy caches, besides the DEC trace we
additionally consider Univ. Sask. and Univ. Do. traces. Table 4 presents the characteristics for
each document class. The values of the Univ. Sask. trace are derived from Table 5 and Figure
5 of [MW99]. From Table 5, we observe the following trends: The percentages of requests to
multi media documents increases more than linear. The popularity of multi media documents
increases, that is the parameter � of the Zipf-like distribution decreases. Furthermore,
temporal correlation increases and, thus, the parameter � increases. The percentages of
requests to HTML documents also increases more than linear.
Due to clearly observable trends, linear regression is employed for determining the forecast
for popularity index and temporal correlation for each document class. That is the forecasted
value y3 is derived from the observed values y1 and y2 by y y y y3 2 2 1� � �( ). The forecasted

24 Analysis of Web Caching in the Gigabit Research Network G-WiN
1996 1998 2000 2002 DEC Univ. Sask. Univ. Do. Forecast
Number of requests (%) 15.69 19.72 24.15 28.47
Mean document size (KB) 6.84 8.96 7.49 7.76 Variance of document size 3.96 � � 5.39
Popularity index, � 0.79 0.78 0.76 0.74
HTML
Temporal correlation, � 0.42 ?? 0.51 0.56
Number of requests (%) 82.24 77.45 72.03 66.35
Mean document size (KB) 10.22 5.63 8.31 8.05 Variance of document size 7.66 � � 9.95
Popularity index, � 0.75 0.76 0.78 0.80
Image
Temporal correlation, � 0.50 ?? 0.54 0.56
Multi Media Number of requests (%) 2.07 2.81 3.82 5.17
Mean document size (KB) 189.71 49.15 124.81 121.22 Variance of document size 25,003 � � 19,549 Popularity index, � 0.78 0.75 0.73 0.71 Temporal correlation, � 0.65 ?? 0.78 0.85
Table 5. Workload forecast for institutional Web proxy caches
1
1.5
2
2.5
3
3.5
4
4.5
5
1 1.5 2 2.5 3
log 1
0(re
fere
nce
coun
t)
log10(time since last reference) in minutes
HTMLImage
Multi Media
Figure 6. Breakdown of interreference times by document class in workload forecast for institutional proxy caches

Part 1: Evaluating Hardware and Software Web Caching Solutions 25
1998 2000 2002 CANARI DFN Forecast
Number of requests (%) 17.27 20.10 22.61
Mean document size (KB) 10.30 14.29 12.29 Variance of document size � 4.28 2.83
Popularity index, � 0.60 0.54 0.48
HTML
Temporal correlation, � 0.49 0.65 0.81
Number of requests (%) 80.67 76.20 70.73
Mean document size (KB) 6.25 6.93 6.59 Variance of document size � 7.10 7.47
Popularity index, � 0.61 0.65 0.69
Image
Temporal correlation, � 0.51 0.60 0.69
Number of requests (%) 2.05 3.70 6.66
Mean document size (KB) 122.67 115.23 118.95 Variance of document size � 43,593 42,943
Popularity index, � 0.73 0.70 0.67
Multi Media
Temporal correlation, � 0.58 0.71 0.84
Table 6. Workload forecast for backbone Web proxy caches
1
1.5
2
2.5
3
3.5
4
4.5
5
1 1.5 2 2.5 3
log 1
0(re
fere
nce
coun
t)
log10(time since last reference) in minutes
HTMLImage
Multi Media
Figure 7. Breakdown of interreference times by document class in workload forecast for
backbone proxy caches

26 Analysis of Web Caching in the Gigabit Research Network G-WiN
percentages of requests is derived using a linear logarithmic regression for representing
exponential growth of Web users. That is the forecasted percentage values y3 is derived by
ln ln (ln ln )y y y y3 2 2 1� � � . Subsequently, the forecasted percentage values are normalized,
so that they sum up to 100%. Since for all three classes of Web documents no trends can be
observed, the forecasts for the mean document sizes are determined using the method of
moving average, that is y3 = ½ (y1 + y2). Subsequently, based on these characteristics, the
reference stream of the DEC trace is altered and the corresponding variances are determined
based on the modified trace data. Figure 6 plots the interreference times for individual
document classes for the workload forecast derived in this way. The different slopes describe
how the temporal locality in the request streams have been modified.
Using the same kind of data of the CANARIE and DFN traces, we can derive with the
same regression methods a workload forecast for proxy caches located in backbone networks.
Table 6 presents the corresponding characteristics for HTML, image, and multi media
documents. The log/log plot of the interreference times for individual document classes is
shown in Figure 7.
5.3 Deriving the Workload Forecasts from the DEC and DFN Traces
To analyze the performance of Web replacement schemes for the workload forecasts
introduced in Section 5.2, synthetic workloads rather than measured data are needed as input
for our simulator. These synthetic traces are based on current traces: Forecast 1 is based on
DEC trace, Forecast 2 on DFN trace, respectively. To obtain the characteristics specified in
Tables 5 and 6, we need to modify the number of requests to the different document classes,
the distribution of document sizes, and the document popularity and temporal correlation in
the reference stream. Timestamps of incoming requests are kept from original traces, avoiding
the need for a reasonable model of interarrival times. The mean document sizes specified in
Table 5 and 6 can be achieved by individual scaling document sizes for each document class
by a constant factor. Number of requests to each class can be achieved by randomly selecting
the document class for an outstanding request according to the probability distribution
specified by the fraction of requests to this class.
It remains to show how the documents within a class can be referenced according to the
distributions of the two sources of temporal locality specified by � an �. The independent
reference model [BCF+99], [JB99] considers only one source of temporal locality, i.e., the
popularity. The independent reference model chooses a document with popularity rank � with
probability P ~ � D� As stated in [MEW00], temporal locality resulting from short term
temporal correlations is important for performance of small caches. To generate a request
stream considering both sources of temporal locality, we used the method described below.

Part 1: Evaluating Hardware and Software Web Caching Solutions 27
To keep correlations between document size and request count [MW99], for the DEC and
DFN traces we number all documents dU of a document class by their popularity rank � . We
calculate relative frequency N d( )U according to the distribution specified by the popularity
index �. That is N d R( )UD��
� . Here, R is the number of references to the most popular
document scaled according to the overall reference count for the document class in the
workload forecast. The documents are divided into (possibly empty) popularity classes Cj of
equally popular documents, that is C d N d jj � �U U| ( )� �. To generate a request, we select a
popularity class C with probability P C C C jj j( )� ��D . Here Cj denotes the cardinality of
popularity class Cj . Among the documents d CU � , we choose a document d with
P d d t dci( ) ~ ( )�
�
U U
E . Here, t dci( )U is the number of references to documents in class Ci since
the last reference to dU . The correctness of this algorithm can be verified by plotting the
distribution functions of popularity and temporal correlation on a log/log scale and fitting the
slopes � and � by a least square fit. Empirical tests show that the resulting request stream
yields the same overall characteristics, e.g., the fraction of one-timers as reported in [MW99].
6 Performance Experiments
6.1 Investigation of the Adaptability of Greedy Dual *
In a first experiment, we evaluate the ability of the GD* replacement scheme to adapt to the
actual workload seen at the proxy cache. Under the constant cost model, the optimal case
constitutes that for each document class (i.e., HTML, images, and multi media) the fraction of
cached documents is equal to the fraction of requests to this document class in the request
stream. Figures 7 and 8 plot the fraction of cached image and multi media documents for
GD*(1) and LRU. As workload the DEC trace is considered. The cache size is assumed to be
1 GByte.
Figure 4 and 5 show that for each document class GD*(1) quickly reaches the optimal
fraction of cached documents specified in Table 4 (i.e., 82% images and 2.1% multi media).
Opposed to that, in LRU the fraction of cached image documents is smaller (i.e., 40%) and
the fraction of multi media documents is substantially larger (i.e., 50%). Similar results have
been observed for the DFN trace. These observations explain why GD*(1) achieves high hit
rates: GD*(1) does not waste space of the Web cache by keeping large multi media
documents that will not be requested again in the near future.

28 Analysis of Web Caching in the Gigabit Research Network G-WiN
0
10
20
30
40
50
60
70
80
90
0 0.5 1 1.5 2 2.5 3 3.5 4 4.5
Frac
tion
of C
ache
d D
ocum
ents
in %
Number of Requests in Millions
GD*(1)
LRU
Optimal Fraction
Figure 7. DEC trace: Fraction of Web cache occupied by images for LRU and GD*(1)
0
10
20
30
40
50
60
70
80
90
0 0.5 1 1.5 2 2.5 3 3.5 4 4.5
Frac
tion
of C
ache
d D
ocum
ents
in %
Number of Requests in Millions
GD*(1)
LRU
Optimal Fraction
Figure 8. DEC trace: Fraction of Web cache occupied by multi media documents
for LRU and GD*(1)

Part 1: Evaluating Hardware and Software Web Caching Solutions 29
6.2 Performance for Current Workloads
In a second experiment, we provide a comparative study for the Web replacement schemes
LRU, LFU-DA, GDS(1), and GD*(1) for current workloads of institutional and backbone
Web proxy caches. Other replacement schemes are not considered, since in [CI97] it has been
shown that GDS outperforms these schemes. As performance measures, the hit rate and byte
hit rate are considered. In Figures 9 to 12, we plot the hit rate (left) and byte hit rate (right) for
increasing cache sizes. Cache sizes are set to 0.05%, 0.10%, 0.20%, 0.50%, 1%, 2%, 5%,
10%, and 20% of overall trace size mentioned in Table 4. Recall that the DEC trace was
recorded at an institutional Web proxy cache whereas the DFN trace was recorded
HTML
0
0.1
0.2
0.3
0.4
0.5
0.6
0.01 0.1 1 10
Hit
Rat
e
Cache Size in GB
LRULFU-DA
GDS(1)GD*(1)
0
0.1
0.2
0.3
0.4
0.5
0.6
0.01 0.1 1 10
Byt
e H
it R
ate
Cache Size in GB
LRULFU-DAGDS(1)GD*(1)
Images
0
0.1
0.2
0.3
0.4
0.5
0.6
0.01 0.1 1 10
Hit
Rat
e
Cache Size in GB
LRULFU-DA
GDS(1)GD*(1)
0
0.1
0.2
0.3
0.4
0.5
0.6
0.01 0.1 1 10
Byt
e H
it R
ate
Cache Size in GB
LRULFU-DAGDS(1)GD*(1)
Multi Media
0
0.1
0.2
0.3
0.4
0.5
0.6
0.01 0.1 1 10
Hit
Rat
e
Cache Size in GB
LRULFU-DA
GDS(1)GD*(1)
0
0.1
0.2
0.3
0.4
0.5
0.6
0.01 0.1 1 10
Byt
e H
it R
ate
Cache Size in GB
LRULFU-DAGDS(1)GD*(1)
Figure 9. DEC trace: Breakdown of hit rates for different document classes

30 Analysis of Web Caching in the Gigabit Research Network G-WiN
in a backbone network. Thus, the recorded request streams of the DEC and DFN traces
contain different degrees of temporal locality. This leads to different maximal achievable hit
rates and byte hit rates. For example, for the DEC trace, the maximal achievable hit rate is
about 63% for images, while it is only about 27% for the DFN trace. In the following, we
relate our observations to the results of [JB00] in which GD* has been introduced.
Consistent with [JB00], we observe that frequency based replacement schemes outperform
recency-based schemes in terms of hit rates. As shown in Figures 9 and 10, GD*(1)
outperforms GDS(1) and LFU-DA outperforms LRU in terms of hit rate. This holds for each
document class. It is most obvious for images while there are only a small advantage
HTML
0
0.05
0.1
0.15
0.2
0.25
0.3
0.01 0.1 1 10
Hit
Rat
e
Cache Size in GB
LRULFU-DAGDS(1)GD*(1)
0
0.05
0.1
0.15
0.2
0.25
0.3
0.01 0.1 1 10
Byt
e H
it R
ate
Cache Size in GB
LRULFU-DA
GDS(1)GD*(1)
Images
0
0.05
0.1
0.15
0.2
0.25
0.3
0.01 0.1 1 10
Hit
Rat
e
Cache Size in GB
LRULFU-DAGDS(1)GD*(1)
0
0.05
0.1
0.15
0.2
0.25
0.3
0.01 0.1 1 10
Byt
e H
it R
ate
Cache Size in GB
LRULFU-DA
GDS(1)GD*(1)
Multi Media
0
0.05
0.1
0.15
0.2
0.25
0.3
0.01 0.1 1 10
Hit
Rat
e
Cache Size in GB
LRULFU-DAGDS(1)GD*(1)
0
0.05
0.1
0.15
0.2
0.25
0.3
0.01 0.1 1 10
Byt
e H
it R
ate
Cache Size in GB
LRULFU-DA
GDS(1)GD*(1)
Figure 10. DFN trace: Breakdown of hit rates for different document classes

Part 1: Evaluating Hardware and Software Web Caching Solutions 31
for HTML and multi media documents. Consistent with [JB00], we observe that in terms of
hit rate LRU and LFU-DA perform worse than GDS(1) and GD*(1). This observation is
significant for HTML and image documents because of their small document sizes, while
there are only small advantages for large multi media documents. This observation can be
explained by the fact that LRU and LFU-DA do not take into account document sizes.
Opposed to [JB00], we do not observe in Figure 13 that GD*(1) achieves competitive
performance in terms of byte hit rate. As shown in Figure 9 and 7 for HTML and image
documents the byte hit rate achieved by GD*(1) is competitive. However, for multi media
documents GD*(1) performs significantly worse in terms of byte hit rate than LRU and LFU-
DA. Since the byte hit rate for multi media documents dominate the overall byte hit rate, this
observation leads to a poor byte hit rate for GD*(1).
As novel aspect of our study, Figures 9 and 10 plot curves for the achieved hit rates and
byte hit rates broken down by document class. Comparing the curves of Figures 9 and 10 with
corresponding curves of Figure 13, illustrate that the overall hit rate is mainly influenced by
the overall hit rate for images. The overall byte hit rate is mainly determined by the overall
byte hit rate for multi media documents. The first result can be explained by the fact that
about 70% of the requests in the DEC and DFN traces are requests for images. The second
result is due to the fact that multi media documents determine nearly 50% of the requested
data in the DEC and DFN traces.
6.3 Performance for Future Workloads
As a third experiment, we investigate performance of replacement schemes on the workload
forecasts specified in Tables 5 and 6. Recall that in these workload forecasts, the mean file
sizes for HTML, image, and multi media documents as well as the fraction of requests to
individual document classes have been modified. As a consequence, the overall size of the
trace representing the forecast for institutional Web proxies is 18.7 GB instead of 19.2 GB of
the DEC trace. The overall size of the trace representing the forecast for backbone proxies is
38.5 GB instead of 39.4 GB of the DFN trace. As before, cache sizes are set to 0,05%, 0,10%,
0,20%, 0,50%, 1%, 2%, 5%, 10%, and 20% of overall trace sizes.
Consistent with [JB00], we observe in Figures 11 and 12 that LRU and LFU-DA perform
significantly worse than GDS(1) and GD*(1) in terms of hit rate. As already observed for
current workloads in Section 6.2, the gap between GD*(1) and LRU is significant for HTML
and images while it diminishes for multi media documents. Opposed to [JB00], Figures 11
and 12 show that the gap between frequency-based and recency- based schemes in terms of
hit rates vanishes for the workload forecasts. That is, LRU performs almost as good as LFU-
DA and GDS(1) performs even better than or GD*(1). This can be explained by the short
term temporal correlation assumed for the future workloads. Increasing the parameter � let

32 Analysis of Web Caching in the Gigabit Research Network G-WiN
temporal correlation become a more important factor of temporal locality than document
popularity. Recency-based replacement schemes make use of temporal correlation, while
frequency-based replacement schemes make use of document popularity. Also opposed to
[JB00], we observe in Figure 13 that the byte hit rate of GD*(1) is not competitive for the
workload forecasts. Because of the higher temporal correlation, the byte hit rate of GD*(1) for
HTML and images looses ground to other schemes, while byte hit rates on multi media
documents stays low resulting from discrimination of large documents. Low byte hit rates on
multi media have even larger impact on overall byte hit rates because of the higher fraction of
such requests.
HTML
0
0.1
0.2
0.3
0.4
0.5
0.6
0.01 0.1 1 10
Hit
Rat
e
Cache Size in GB
LRULFU-DA
GDS(1)GD*(1)
0
0.1
0.2
0.3
0.4
0.5
0.6
0.01 0.1 1 10
Byt
e H
it R
ate
Cache Size in GB
LRULFU-DAGDS(1)GD*(1)
Images
0
0.1
0.2
0.3
0.4
0.5
0.6
0.01 0.1 1 10
Hit
Rat
e
Cache Size in GB
LRULFU-DA
GDS(1)GD*(1)
0
0.1
0.2
0.3
0.4
0.5
0.6
0.01 0.1 1 10
Byt
e H
it R
ate
Cache Size in GB
LRULFU-DAGDS(1)GD*(1)
Multi Media
0
0.1
0.2
0.3
0.4
0.5
0.6
0.01 0.1 1 10
Hit
Rat
e
Cache Size in GB
LRULFU-DA
GDS(1)GD*(1)
0
0.1
0.2
0.3
0.4
0.5
0.6
0.01 0.1 1 10
Byt
e H
it R
ate
Cache Size in GB
LRULFU-DAGDS(1)GD*(1)
Figure 11. Workload forecast for institutional proxy caches: Breakdown of hit rates for
different document classes

Part 1: Evaluating Hardware and Software Web Caching Solutions 33
Furthermore, our studies show that the hit rate on HTML and multi media documents
increase whereas the hit rates on images decreases. This effect is due to the smaller fraction of
requests to images in the workload forecasts. In terms of byte hit rate LRU and GDS(1)
perform for the workload forecasts significantly better than for the current workloads. In fact,
LRU outperforms the frequency-based schemes LFU-DA and GDS(1) outperforms GD*(1).
This is due to the assumption that the temporal correlation specified by the parameter � is
higher in future workloads than in current workloads.
HTML
0
0.05
0.1
0.15
0.2
0.25
0.3
0.01 0.1 1 10
Hit
Rat
e
Cache Size in GB
LRULFU-DAGDS(1)GD*(1)
0
0.05
0.1
0.15
0.2
0.25
0.3
0.01 0.1 1 10
Byt
e H
it R
ate
Cache Size in GB
LRULFU-DA
GDS(1)GD*(1)
Images
0
0.05
0.1
0.15
0.2
0.25
0.3
0.01 0.1 1 10
Hit
Rat
e
Cache Size in GB
LRULFU-DAGDS(1)GD*(1)
0
0.05
0.1
0.15
0.2
0.25
0.3
0.01 0.1 1 10
Byt
e H
it R
ate
Cache Size in GB
LRULFU-DA
GDS(1)GD*(1)
Multi Media
0
0.05
0.1
0.15
0.2
0.25
0.3
0.01 0.1 1 10
Hit
Rat
e
Cache Size in GB
LRULFU-DAGDS(1)GD*(1)
0
0.05
0.1
0.15
0.2
0.25
0.3
0.01 0.1 1 10
Byt
e H
it R
ate
Cache Size in GB
LRULFU-DA
GDS(1)GD*(1)
Figure 12. Workload forecast for backbone proxy caches: Breakdown of hit rates for
different document classes

34 Analysis of Web Caching in the Gigabit Research Network G-WiN
DEC Trace
0
0.1
0.2
0.3
0.4
0.5
0.6
0.01 0.1 1 10
Hit
Rat
e
Cache Size in GB
LRULFU-DA
GDS(1)GD*(1)
0
0.1
0.2
0.3
0.4
0.5
0.6
0.01 0.1 1 10
Byt
e H
it R
ate
Cache Size in GB
LRULFU-DAGDS(1)GD*(1)
Forecast for institutional proxy caches
0
0.1
0.2
0.3
0.4
0.5
0.6
0.01 0.1 1 10
Hit
Rat
e
Cache Size in GB
LRULFU-DA
GDS(1)GD*(1)
0
0.1
0.2
0.3
0.4
0.5
0.6
0.01 0.1 1 10
Byt
e H
it R
ate
Cache Size in GB
LRULFU-DAGDS(1)GD*(1)
DFN trace
0
0.05
0.1
0.15
0.2
0.25
0.3
0.01 0.1 1 10
Hit
Rat
e
Cache Size in GB
LRULFU-DAGDS(1)GD*(1)
0
0.05
0.1
0.15
0.2
0.25
0.3
0.01 0.1 1 10
Byt
e H
it R
ate
Cache Size in GB
LRULFU-DA
GDS(1)GD*(1)
Forecast for backbone proxy caches
0
0.05
0.1
0.15
0.2
0.25
0.3
0.01 0.1 1 10
Hit
Rat
e
Cache Size in GB
LRULFU-DAGDS(1)GD*(1)
0
0.05
0.1
0.15
0.2
0.25
0.3
0.01 0.1 1 10
Byt
e H
it R
ate
Cache Size in GB
LRULFU-DA
GDS(1)GD*(1)
Figure 13. Overall hit rates and byte hit rates for current and future workloads

Part 1: Evaluating Hardware and Software Web Caching Solutions 35
0
0.1
0.2
0.3
0.4
0.5
0.6
0.01 0.1 1 10
Hit
Rat
e
Cache Size in GB
LRUGD*(1)
GDS(packets)GD*(packets)
0
0.1
0.2
0.3
0.4
0.5
0.6
0.01 0.1 1 10
Byt
e H
it R
ate
Cache Size in GB
LRUGD*(1)
GDS(packets)GD*(packets)
Figure 14. Performance of GD*(packets) and GDS(packets) for institutional proxy caches
As a last experiment we studied the performance of GD* and GDS for the workload
forecasts under packet cost model. Figures 14 and 15 compare GD*(packets) and
GDS(packets) with GD*(1) and LRU which has shown in Figure 13 best hit rates and byte hit
rates, respectively. For our simulation runs, we used the cache sizes as mentioned in Section
5.3.
Opposed to [JB00], we observe that GD*(packets) does not outperform LRU in terms of
byte hit rates. The increasing importance of temporal correlation in the request streams of the
workload forecasts and the lack of size awareness of LRU close the gap in byte hit rate. As
described in [JB00], large values for � put more weight on frequency decisions, which are not
suited for workloads with high temporal correlation. Therefore, GD*(packets) looses ground
to LRU, which is tailored to capture temporal correlation in form of recency-based
replacement decisions. In term of hit rate, GD*(packets) outperforms LRU only for small
cache sizes. This is due to taking into account the document popularity in terms of frequency
of access to certain Web documents.
Figures 14 and 15 also show that for future workloads GDS(packets) achieves the highest
byte hit rates (i.e., as high as LRU) while outperforming LRU in terms of hit rate. In an
integrated evaluation considering both hit rate and byte hit rate GDS(packets) performs
slightly better than GD*(packets).
0
0.05
0.1
0.15
0.2
0.25
0.3
0.01 0.1 1 10
Hit
Rat
e
Cache Size in GB
LRUGD*(1)
GDS(packets)GD*(packets)
0
0.05
0.1
0.15
0.2
0.25
0.3
0.01 0.1 1 10
Byt
e H
it R
ate
Cache Size in GB
LRUGD*(1)
GDS(packets)GD*(packets)
Figure 15. Performance of GD*(packets) and GDS(packets) for backbone proxy caches

36 Analysis of Web Caching in the Gigabit Research Network G-WiN
6.4 Partitioned Web Proxy Caches
As last experiment, we evaluated performance of the replacement schemes LRU and SLRU
on a partitioned organization for Web proxy caches. Thus, the cache memory is split up in
several partitions of different sizes. Each partition is assigned to a certain class of web
documents. E.g., there are three partitions, one is assigned to HTML document, one to images
and one to multi media documents. On each partition an autonomous replacement scheme is
applied. That is, for the replacement schemes LRU one LRU stack is implemented each for
HTML documents, images, and multi media documents. Size of partitions can be determined
by the fraction of requests for documents belonging to the class managed by the partition.
Partitioned Web caches have several application areas. First, statically partitioned caches
can be implemented by running several cache processes on a single machine. As results of our
experiments show, this can improve hit rate of traditional replacement schemes as LRU,
SLRU and LFU-DA. Second, the individual partitions can be distributed on work stations
connected by a local area network, each running a cache process. Small partitions, e.g. the
HTML partition, can be managed by small workstations. Large partitions, e.g. the multi media
partition can be managed by workstations with sufficient disk space. Partitions with high
access frequencies, e.g. the Image partition, can be managed by workstations with high
processing power.
Figure 16 and 17 show that a partition organization of the cache can improve hit rate of the
cache for replacement schemes LRU and SLRU. On the same time, there are small losses in
byte hit rate compared to a unpartitioned organization. In the figures, we put the results in
relation to the best stable implemented replacement scheme (i.e., GDS in Squid) and to the
best known replacement scheme (i.e. GD*). This shows, that partitioned organization makes
LRU and SLRU more competitive to GDS and GD* in terms of hit rate. In the same time,
byte hit rate of partitioned LRU and SLRU remains superior to the byte hit rate of GDS and
GD*.
0.1
0.2
0.3
0.4
0.5
0.6
0.01 0.1 1 10
Cac
he H
it R
ate
Cache Size (GB)
LRULRU part.
GDS(1)GD*(1)
0
0.1
0.2
0.3
0.4
0.5
0.6
0.01 0.1 1 10
Cac
he B
yte
Hit
Rat
e
Cache Size (GB)
LRULRU part.
GDS(1)GD*(1)
Figure 16. Performance of partitioned LRU

Part 1: Evaluating Hardware and Software Web Caching Solutions 37
0.1
0.2
0.3
0.4
0.5
0.6
0.01 0.1 1 10
Cac
he H
it R
ate
Cache Size (GB)
SLRUSLRU part.
GDS(1)GD*(1)
0
0.1
0.2
0.3
0.4
0.5
0.6
0.01 0.1 1 10
Cac
he B
yte
Hit
Rat
e
Cache Size (GB)
SLRUSLRU part.
GDS(1)GD*(1)
Figure 17. Performance of partitioned SLRU
For LFU-DA we achieved results comparable to SLRU. It is not reasonable to implement a
partitioned organization of a cache managed by the replacement schemes GDS and GD*.
Those replacement schemes adapt the fraction of cached documents very well to the number
of request for the distinct classes. Our experiments have shown, that partitioned organization
of cache will always decrease the performance of GDS and GD*.

38 Analysis of Web Caching in the Gigabit Research Network G-WiN
Part 2: Evaluating Cooperative Web Caching for Emerging Network Technologies
7 Overview
Cooperative Web caching means the sharing and coordination of cached Web documents
among multiple communicating proxy caches in an IP backbone network. Cooperative
caching of data has its roots in distributed file and virtual memory systems in a high-speed
local area network environment. Cooperative caching has shown to substantially reduce
latencies in such distributed computing systems because network transfer time is much
smaller than disk access time to serve a miss. While bandwidth for previous IP backbone
networks deployed by Internet Service Providers typically has been limited to 34 Mbps,
current and future IP networks provide bandwidth ranging from 155 Mbps to 2.4 Gbps (see
e.g., CA*Net-3 [CA01], G-WiN [GW01], or Internet-2 [IN01]). Thus, it is important to
investigate the impact of emerging network technologies on the performance of cooperative
Web caching protocols.
Protocols for cooperative Web caching can be categorized as message-based, directory-
based, hash-based, or router-based [CMT01]. Wessels and Claffy introduced the Internet
cache protocol, ICP [WC98], which has been standardized and is widely used. As a message-
based protocol, ICP supports communication between caching proxies using a simple query-
response dialog. It has been reported that ICP scales poorly with increasing number of caches.
Directory-based protocols for cooperative Web caching enable caching proxies to exchange
information about cached content. The information is compressed using arrays of bits, so
called Bloom filters. Notable protocols of this class include Cache Digests by Rousskov and
Wessels [RW98] and Summary Cache by Fan, Cao, Almeida, and Broder [FCAB00]. The
most notable hash-based cooperative Web caching protocol constitutes the cache array routing
protocol, CARP, introduced by Valloppillil and Ross [Ros97], [VR98]. The rationale behind
CARP constitutes load distribution by hash routing among Web proxy cache arrays. Recently,
Karger et al. proposed hash-based routing using URL resolution at the domain name service
as another protocol of this class [KBB+99]. In recent work, Wu and Yu introduced several
improvements to hash-based routing, considering network latency and allowing local
replication [WY99], [WY00]. Cieslak, Foster, Tiwana, and Wilson introduced the Web cache
coordination protocol, WCCP, as a router-based protocol. WCCP transparently distributes
requests among a cache array [CFTW00]. Very recently, the caching neighborhood protocol,
CNP, has been introduced by Chiang et al. [CLLM00], [CULM99]. CNP allows request
forwarding among caching proxies in a dynamically changing hierarchy controlled by the
origin server.

Part 2: Evaluating Cooperative Web Caching for Emerging Network Technologies 39
In previous work, the performance of cooperative Web caching protocols has mostly been
studied just in comparison to ICP. Performance results comparing Cache Digests versus ICP
based on the NLANR cache hierarchy have been reported in [RW98]. The performance of
CARP versus ICP has been studied using a Markov model [Ros97]. The performance of CPN,
Cache Digests, and CARP has also been analyzed by high-level analytical models
[CULM99]. A first comprehensive performance study of cooperative Web caching was
conducted by Wolman et al. [WVS+99]. They studied upper bounds achievable through
cooperative Web caching under the assumption that no communication overhead is
introduced by inter cache communication and no cache space is wasted by holding multiple
copies of the same document in several caches. They derived the results by trace-driven
simulation of a single Web proxy cache and provide sensitivity analysis using a Markov
model. The Markov model also provides a comparison of a Squid-like hierarchical Web
caching system, a hash-based caching system, and a directory-based caching system inspired
by Summary Cache. In another recent paper, Rodriguez, Spanner, and Biersack developed
analytical models for comparing the performance of hierarchical and distributed Web caching
[RSP99]. Feldmann, Cáceres, Douglis, Glass, and Rabinovich investigated the performance of
caching proxies in environments with different network bandwidth between client and proxy
and between proxy and server, respectively [FCD+99].
To best of our knowledge, a comprehensive performance study of the protocols ICP,
CARP, Cache Digests, and WCCP based on the same IP backbone network topology and
workload characteristics has not been reported so far. Furthermore, the effect of rapidly
increasing bandwidth availability to these cooperative Web caching protocols has not been
investigated. We are also not aware of any performance study of WCCP v2.0. Opposed to
previous work [FCD+99], [RSP99], [WVS+99], the goal of this part of the project lies in
understanding the behavior and limiting factors of specific protocols for cooperative Web
caching under measured traffic conditions. Based on this understanding, we give
recommendations for Internet Service Providers (ISPs), Web clients, and Application Service
Providers (ASPs).
In Section 10, we present a comprehensive performance study for the cooperative Web
caching protocols ICP, Cache Digests, CARP, and WCCP. The performance of the considered
protocols is evaluated using measured Web traffic from DFN [GW01] and NLANR [NL01].
The presented curves illustrate that for ISPs operating IP networks with high bandwidth
availability (622 Mbps and 2.4 Gbps), clearly either CARP and WCCP is the protocol of
choice. From the clients’ point of view, ICP is most beneficial because ICP achieves lowest
latency. For ASPs, WCCP is the protocol of choice because WCCP achieves the best
cost/performance ratio with respect to cache utilization. Sensitivity studies show that temporal
locality and low cache utilization due to low participation to cooperative Web caching make
considerably impact to the performance of individual protocols. The presented results are

40 Analysis of Web Caching in the Gigabit Research Network G-WiN
derived using a discrete-event simulator of an IP backbone network implemented with the
simulation library CSIM [Sch95].
The part of the report is organized as follows. To make the report self-contained, Section 8
provides an introduction to cooperative Web caching and recalls the functionality of the
protocols ICP, Cache Digests, CARP and WCCP. The simulation environment for evaluating
the considered protocols for cooperative Web caching is introduced in Section 9. In Sections
10, we present performance curves for the considered protocols for cooperative Web caching
derived from the simulator and the measured trace data.
8 Protocols for Cooperative Web Caching
The aim of Web proxy caching lies in reducing both document retrieval latency and network
traffic. Cooperative Web caching provide means that if a requested document is not contained
in the queried Web cache, other caches are queried first before the document is downloaded
from the origin Web server. Protocols for cooperative Web caching can be categorized as
message-based protocols, directory-based protocols, hash-based protocols, and router-based
protocols. Message-based protocols define a query/response dialog for exchanging
information about cached content. An example for a message based protocol is the Internet
cache protocol, ICP. Directory based protocols summarize information into frequently
exchanged directories. Cache Digests constitutes an example for a directory-based protocol.
Hash-based protocols as e.g., the cache array routing protocol, CARP, employ hash functions
to distribute the URL space among cooperating Web caches. Router-based protocols intercept
Web traffic on IP layer and redirect it to a caching proxy. An example for a router-based
protocol constitutes the Web cache coordination protocol, WCCP.
In this Section, we recall the major functionality of these protocols for cooperative Web
caching in a mesh of loosely coupled Web proxy caches. Most protocols include further
functionality, e.g., for dynamic reconfiguration of the caches or fault tolerance. This
functionality is beyond the scope of our study and is omitted in the description. We describe
the actions performed by a cache after a miss for a client request. We call the queried Web
cache the target cache, all other caches in the mesh are denoted as peer caches [CMT01].
Web caches holding a valid copy of the queried document are marked with X in Figures 18 to
21.
ICP is an application layer protocol based on the user datagram protocol/internet protocol,
UPD/IP. It was originally introduced by the Harvest Web cache for coordinating hierarchical
Web caching. ICP defines a set of lightweight messages used to exchange information about
cached documents among caches. Figure 18 illustrates the functionality of ICP. If a target
cache suffers a miss on a client request, it queries its configured peers using a special ICP
query message as shown in Figure 18 (a). A peer cache replies with an ICP hit message, if it
holds the requested document. Otherwise, the peer cache reports an ICP miss message as

Part 2: Evaluating Cooperative Web Caching for Emerging Network Technologies 41
shown in Figure 18 (b). The target cache waits either an ICP hit is received or all configured
siblings reported a miss. Since ICP is based on UDP, messages are not reliably delivered. A
timeout prevents a cache from infinite waiting for lost messages. The target cache fetches the
document from the first peer cache signaling a hit; see Figure 18 (c). If no peer cache signals a
hit, the document is fetched from the origin Web server or a configured parent cache. The
document is stored locally at the target cache and delivered to the client ; see Figure 18 (d).
Note that with ICP multiple copies of a particular document may be stored in a cache mesh.
ICP can adapt to network congestion and cache utilization by locating peer caches which send
the fastest response. The disadvantage of ICP lies in introducing additional latency on a cache
miss due to waiting until receiving replies from all peer caches or reaching the timeout.
Cache Digests defines a protocol based on the hypertext transfer protocol, HTTP. As ICP,
Cache Digests operates on the application layer of the TCP/IP protocol stack. Cache Digests
was introduced by Rousskov and Wessels and is implemented in the Squid Web cache
[RW98]. Cache Digests enables caching proxies to exchange information about cached
content in compact form. A summary of documents stored by a particular caching proxy is
coded by an array of bits; i.e., so called Bloom filter. To add a document to a Bloom filter, a
number of hash functions are calculated on the document URL. The results of the hash
functions specify which bits of the bit array have to be turned on. On a lookup for a particular
document the same hash functions are calculated and the specified bits are checked. If all bits
are turned on, the document is considered to be in the cache. With a certain probability, a
document is erroneously reported to be in the cache. The probability depends on the size of
(a) miss at target cache
Target Cache
PeerCaches X
Client Requestfor Document X
...
ICP_QUERY ICP_QUERY
(b) replies of peer caches
Target Cache
PeerCaches X
...
ICP_HIT ICP_MISS
(c) fetching document at target caches
Target Cache
PeerCaches X
...
HTTP_REQUEST
(d) storing document at target caches and delivering document to client
Target Cache
PeerCaches X
Deliver Document Xto Client
...
HTTP_RESPONSE
X
Figure 18. Illustration of the functionality of ICP

42 Analysis of Web Caching in the Gigabit Research Network G-WiN
the Bloom filter. Cooperating caching proxies build Cache Digests as a summary of locally
cached content. Figure 19 illustrates the functionality of Cache Digests. Each target cache
requests digests from all peer caches on a regular basis as shown in Figure 2 (a). If a target
cache misses on a client request, it searches the digests of its peer caches; see Figure 19 (b). If
the requested document is reported to be cached by any digest, the document is requested
form the corresponding peer cache; see Figure 19 (c). Otherwise, the document is fetched
from the origin Web server. In both cases, a copy of the requested document is stored by the
target cache and the document is delivered to the client; see Figure 19 (d). Note that as in ICP,
multiple copies of a particular document may be stored in a cache mesh.
An advantage of Cache Digests lies in only generating network traffic on the digest
exchange and not on each document request. The disadvantage of Cache Digests lies in
causing false cache hits. False hits can occur in two ways: First, a digest reports that a
particular document is cached, but the document has been already evicted since the generation
of the digest. Second, a bloom filter may report a hit when the document is not in the cache.
The number of false hits influences the performance of a cache mesh by causing unnecessary
network traffic [RW98].
CARP constitutes also a cooperative Web caching protocol on the application layer of the
TCP/IP protocol stack. CARP is based on HTTP and was introduced by Valloppillil and Ross
[VR98]. As Cache Digests, CARP is based on hash functions. The version of CARP we
consider in Section 10 implements hashing inside the caches [Ros97]. Thus, the considered
version of CARP does not require to change the client software. Note that another version of
(a) requesting digests from peer caches
Target Cache
PeerCaches X
...CD_GET
CD_GETSEND_CD SEND_CD
(b) searching digests at target cache
Target Cache
PeerCaches X
Client Requestfor Document X
...
Cache Digest A
Cache Digest B...
(c) requesting document from peer cache found by digests search
Target Cache
PeerCaches X
...
Cache Digest A
Cache Digest B...
HTTP_REQUEST
(d) storing document at target cache and delivering document to client
Target Cache
PeerCaches X
...
Cache Digest A
Cache Digest B X
Deliver Document Xto Client
...
HTTP_RESPONSE
Figure 19. Illustration of the functionality of Cache Digests

Part 2: Evaluating Cooperative Web Caching for Emerging Network Technologies 43
(a) calculating hash key of document URL
Target Cache
PeerCaches X
Client Requestfor Document X
...
Hash Function
(b) forwarding request to selected cache
Target Cache
PeerCaches X
...
HTTP_REQUEST
Hash Function
(c) selected cache delivers document to target cache
Target Cache
PeerCaches X
Deliver Document Xto Client
...
HTTP_RESPONSE
Hash Function
Figure 20. Illustration of the functionality of CARP
CARP is implemented such that hashing is performed in the client software [CMT01]. Each
cache in the cache mesh stores an unique hash function, which maps the URL space to a hash
space. Each element of the hash space is associated with a particular caching proxy. Figure 20
illustrates the functionality of CARP. If a target cache receives a client request, it calculates
the hash key of the document URL; see Figure 20 (a). The result is combined with the hash
keys of the names of all caches in the mesh. The request is forwarded to the cache which
achieves the smallest value of the combined hash key; see Figure 20 (b). We refer to this
cache as the selected cache.
The selected cache can be any member of the cache mesh including the target cache. On a hit,
the selected cache delivers the document to the target cache, if both are different as shown in
Figure 20 (c). On a miss, the selected cache retrieves the document from the origin Web
server, stores a copy and delivers it to the target cache. The target cache delivers the
document to the client. Note that the target cache does not store a copy of the document. Each
document is stored only in the selected cache. This unifies several physically distributed
caching proxies to one logical cache. The advantage of CARP lies in not wasting cache
memory for replicated documents. As a disadvantage, CARP employs expensive HTTP
communication among the caching proxies on each request.
WCCP is a router-based protocol on the network layer of the TCP/IP protocol stack.
Recently, the specification of WCCP v2.0 has been made public available in an Internet draft
[CFTW00]. WCCP takes the responsibility for the distribution of requests away from the
caches. It allows a Web cache to join a service group. A service group contains one or more
caches and one ore more routers. Figure 21 illustrates the functionality of WCCP. The routers

44 Analysis of Web Caching in the Gigabit Research Network G-WiN
of a service group intercept IP packets of HTTP requests sent from a client to the origin Web
server as shown in Figure 21 (a). The packets are redirected to a particular caching proxy in
the service group. As in CARP, the caching proxy is chosen by a hash key. Opposed to
CARP, in general the router does not know the complete URL of a requested document.
Therefore, it uses the IP address of the destination of intercepted packets for the hash
function, i.e., the IP address of the origin Web server of the document. The result of the hash
function yields an index into a redirection hash table. This redirection hash table provides the
IP address of the Web cache to which the request is forwarded as shown in Figure 21 (b). Due
to hashing based on IP addresses, all objects of a particular site are serviced by the same
caching proxy. This constitutes the main difference to the version of CARP we consider. The
selected cache services the request from cache memory or the origin Web server. The
requested document is delivered directly to the client by the cache; see Figure 21 (c). Note
that as in CARP, at most a single copy of a document is stored in a local cache mesh. As a
further advantage, WCCP does not increase the load on caching proxies by distributing
documents via the routers. As a disadvantage, WCCP increases the load on routers due to the
calculation of hash functions and packet redirection.
As mentioned above, we use implementations that do not require changes in user agents.
That is the client has to be configured to issue document request to a statically assigned
caching proxy or the origin Web server.
(a) intercepting IP packets by a router
Router
Caches X...
Client Requestfor Document X
Hash Function
(b) locating cache by a redirection hash table
Router
Caches X...
RedirectedHTTP_REQUEST
Hash Function
(c) deliver the document to the client
Deliver Document Xto Client
Router
Caches X...
Hash Function
Figure 21. Illustration of the functionality of WCCP

Part 2: Evaluating Cooperative Web Caching for Emerging Network Technologies 45
Clients
...Clients
...Clients
...Clients
...
RemoteNational Backbone
RegionalNetwork
RegionalNetwork
InstitutionalNetwork
InstitutionalNetwork
InstitutionalNetwork
InstitutionalNetwork
Access Router 4
Web Servers
InstitutionalCaches
RegionalCaches
LocalNational Backbone
Access Router 3
Access Router 5
Access Router 1
Access Router 2
To otherRegional Networks
Low Bandwidth Link
......
......
Figure 22. Considered network configuration
9 Simulation Environment
9.1 Network Model
In our experiments, we investigate the performance of cooperative caching for caching
proxies distributed across the backbone network of a national Internet service provider (ISP).
To simulate a particular network topology, we adopt the modeling approach for IP networks
connecting clients and servers presented in [RSP99]. They model the internet as a hierarchy
of ISPs as shown in Figure 23. All clients (i.e., user agents) are connected to institutional
networks which are connected via regional networks to a national backbone. National
backbones are also connected. Caches are located at the access points between two networks
to reduce the consumption of network bandwidth. As in [RSP99], the simulator represents just
one local and one remote national backbone network. The hierarchical structure of the local
network comprises of several regional networks. One or more institutional networks are
connected to each regional network. All user agents reside in the institutional networks. All
original servers are assumed to be located in the remote backbone network.
Opposed to [RSP99], the goal of our simulation study constitutes the comparative
performance evaluation of the protocols for cooperative Web caching introduced in Section 8
rather than evaluating distributed versus hierarchical Web caching. Therefore, we replace the
single national cache used in [RSP99] by a cache mesh distributed across the national
backbone as shown in Figure 24. We assume that caches are placed at five access routers
which connect one or more regional networks to the backbone. User agents are allowed to
peer directly with national caches located at the access router connecting them via
institutional and regional networks to the local national backbone, or to use institutional or

46 Analysis of Web Caching in the Gigabit Research Network G-WiN
AccessRouter
5
AccessRouter
2
AccessRouter
1
AccessRouter
1
AccessRouter
1
AccessRouter
4
AccessRouter
1
AccessRouter
1
AccessRouter
3
Cache 2
Cache 4
Cache 5
Cache 3AggregatedClients 3
Cache 1
RemoteWeb Servers
VirtualLink Aggregated
Clients 2Aggregated
Clients 5
AggregatedClients 1
AggregatedClients 4
Low Bandwidth Link
RemoteWeb Servers
RemoteWeb Servers
RemoteWeb Servers
RemoteWeb Servers
Figure 23. Model of network configuration with virtual links and aggregated clients
regional caches on the intermediate levels of a cache hierarchy. Institutional and regional
caches are allowed to peer with the national cache at their access point to the national
backbone. Therefore, clients of a national cache consist of user agents, institutional and
regional caches, which are directly connected to the associated access router via institutional
and regional networks. Without loss of generality, these clients are aggregated to a single
component called clients. This component is directly connected to an access router.
Figure 24 shows the configuration of the local backbone network considered for the
comparative performance study presented in Section 10. The configuration comprises of five
caching proxies, each of them connected to an access router. The access routers are fully
connected by virtual links. Clients and a local Web server are connected to each access router.
Note that all clients located in the dashed circle in Figure 23 are aggregated in the client
component denoted as “Clients 4” in Figure 24. The simulator assumes the network
configuration to be fixed. Thus, we do not take into account failures and down times of any
network component.
The simulator comprises of several building blocks which can be utilized to assemble
arbitrary configurations for backbone networks. The following describes the behavior and
simplifying assumptions of the building blocks of the simulator. These building blocks are
CSIM simulation components modeling virtual links, access routers, clients, caches, and Web
servers. Table 7 provides an overview of the parameter settings of the simulator.

Part 2: Evaluating Cooperative Web Caching for Emerging Network Technologies 47
Parameter Description Value
RTT Average round trip time in local backbone network varying
Ploss Packet loss probability in local backbone network 0.01 %
THTTP Time for of HTTP connection 3.0 msec.
TCache Time for cache lookups/updates (0.5*THTTP ) 1.5 msec.
TICP Time for processing an ICP query/response (0.1*THTTP ) 0.3 msec.
TCARP Time for calculation of destination cache (0.2*THTTP ) 0.6 msec.
TWCCP Time for calculation of target IP address and processing encapsulated IP packets (0.1*THTTP )
0.3 msec.
Table 7. Parameters of the simulator
Virtual links
The simulator represents connectivity of basic components by virtual links. That is as
simplifying assumption, we do not represent each physical link in the local national backbone
network. A virtual link connects each pair of access routers. Each virtual link is associated
with a round trip time RTT , i.e., the time which is needed by an IP packet to be transmitted
from the source router of the virtual link to the destination and back. Furthermore, a packet
loss probability Ploss is assigned to each link. This is the probability that a packet is lost while
being transmitted on a virtual link. Virtual links are used to transmit two types of messages.
The first type are ICP messages which use UDP/IP as underlying transport protocol. We
assume an ICP message to get lost with probability Ploss and to get delayed with a mean of RTT
2 otherwise. The second type of transmission is a HTTP request/response dialog. HTTP
uses the transmission control protocol/internet protocol, TCP/IP as underlying transport
protocol. To capture the mean delay introduced by TCP/IP, we employ the analytical model
introduced in [CSA00]. This model takes RTT and Ploss as well as some parameters of the
TCP/IP protocol stack together with the size of the transmitted message as input for deriving
the mean delay for connection setup and data transmission. To model the request part of
HTTP, we calculate the mean time for connection set up as well as the transmission time for
the request in TCP’s slow start mode. For the response, we assume the mean delay for
document transmission consisting of the slow start phase and a following steady state
transmission phase if the document is large enough. We make the assumption that RTT and
Ploss are not significantly influenced by traffic originating from intercache communication,
i.e., they are constant during the simulation run. This assumption holds for intercache traffic
in most national backbone networks because of low cache utilization.
To evaluate cooperative Web caching for emerging network technologies, we need to
configure virtual links for different bandwidth available in the local backbone network. In our

48 Analysis of Web Caching in the Gigabit Research Network G-WiN
experiments, we examined network bandwidth of 34 Mbps, 155 Mbps (STM-1 connection),
622 Mbps (STM-4 connection), and 2.4 Gbps (STM-16 connection). Following [FCD+99],
we estimate round trip times for links offering different bandwidth. For a 155 Mbps and 622
Mbps bandwidth, we assume an average round trip times of 15 msec. and 10 msec.,
respectively. These delays are observed in the Gigabit research network G-WiN [GW01]. To
estimate round trip times for 34 Mbps and 2.4 Gbps connections, we employ linear
regression. From the measured delays, we observe that increasing network bandwidth by
factor four approximately decreases average round trip time by 5 msec. Thus, we assume
average round trip times of 20 msec. and 5 msec. for 34 Mbps and 2.4 Gbps connections,
respectively.
Local Web Caches
Web proxy caches are connected to the access routers connecting regional networks to the
local national backbone. The simulator implements the basic functionality of a caching proxy
similar as described in [WY99], [WY00]. Each cache implements a cache manager using the
LRU replacement scheme and a CPU server servicing requests in a FIFO queue. The cache
manager can be configured to provide the functionality of ICP, Cache Digests, or CARP as
described in Section 8. The core functionality of WCCP is implemented in the routers and,
therefore, is not part of the cache manager. The simulator does not represent modifications of
Web documents. Thus, the cache manager does not expire documents as real Web caches do.
Therefore, the simulator slightly overestimates the amount of traffic saved by the cooperative
Web caching. The service time of the CPU server depends on the operation performed. For
processing a HTTP request time THTTP is required. Time for cache lookups and updates is
denoted by TCache . Following [WY99], we assume that T TCache HTTP� �0 5. . A single ICP query
or response is processed in time TICP . It holds TICP < THTTP , since ICP messages are short and
simple UDP transmissions [WC98]. Therefore, we assume that T TICP HTTP� �0 1. . Calculation
of hash functions takes time TCARP for CARP. The hash function defined by CARP uses
several arithmetic operations as 32 bit multiplication [VR98]. Therefore, we assume that
hashing is more expensive than processing ICP messages, i.e., T TCARP HTTP� �0 2. . We assume
that calculation of an entry of a cache digests based on hash functions also takes the delay
TCARP . Requesting and sending digests is performed based by HTTP and takes the delay THTTP .
The delay THTTP is determined experimentally as follows. Following [WY00], we perform
simulation runs for various values of THTTP and monitor the utilization of the simulated caches
for each value of THTTP . Since the correct cache utilization has also been measured during the
trace recording, the values for cache utilization corresponding to different values of THTTP are
used to calibrate the delay THTTP . This calibration yields THTTP = 3.0 msec.

Part 2: Evaluating Cooperative Web Caching for Emerging Network Technologies 49
Access routers
We refer to a router connecting one or more regional networks to the national backbone
network as an access router. Access routers receive transmissions from a client, Web cache,
or link component and pass it to an other Web cache, client, or link. Because all network
transmission delays are included in the round trip time associated with virtual links, a
transmission is not further delayed by an access router. The transmission redirected by WCCP
constitutes an exception to this. In WCCP, an access router has to calculate the new target
cache of a client request using a hash function and encapsulate the IP package for redirection.
The combined time needed for these operations is denoted by TWCCP. Opposed to CARP, the
hash function defined by WCCP is based on simple bit shifting and XOR operations, which
can be easily calculated by the router [CFTW00]. Redirection is done by rewriting a IP packet
with an additional header, which is also a fast operation. Therefore, it holds T TWCCP CARP� , and
we assume T TWCCP HTTP� �0 1. .
Clients
Several user agents, institutional, and regional caches can be connected to an access router via
local and regional networks. The comparative simulation study presented in Section 10
focuses on distributed caching in a national backbone network. Thus, we refer to all these
sources of requests as clients. We assume that all clients are configured to peer with the
closest national cache, i.e., the cache located at the access router connecting their regional
network to the national backbone network. We aggregate all clients connected to one access
router in one clients component. The clients component assumed to be connected to the
access router via a client link. Client links are used to transmit HTTP responses and introduce
the same delay to a transmission as a virtual link does. The clients component issues requests
to the caching proxy located at the same router. The request stream consists of the aggregated
request streams of all clients located in the lower level networks connected to the central
router. The request interarrival times are given by the timestamps of the requests recorded in
the trace. A detailed description how client request streams are obtained from the trace files is
given in Section 9.2.
Origin Web Servers in Remote Backbone Network
In the simulator, all origin Web servers are assumed to be located in a remote national
backbone network. This remote network is connected via a low bandwidth connection to the
local backbone network in which distributed Web caching using the considered protocols is
explicitly represented. This low bandwidth connection to the remote backbone clearly
dominates the delay for receiving a document from its origin Web server in the remote
network. To reach the origin Web server, additional delays are introduced by passing the
national, regional and institutional networks under the remote backbone network. However,

50 Analysis of Web Caching in the Gigabit Research Network G-WiN
these delays are negligible compared to the delay between two backbone networks. Finally,
the utilization of the origin Web server constitutes another important factor for the overall
document retrieval latency. The sum of these latencies is denoted as the download time of a
Web document. Estimates for these mean delays are derived from the considered traces as
described in Section 9.2.
9.2 Characteristics of the Considered Workloads
To derive meaningful performance results for distributed Web caching in a national backbone
network, we need to feed our simulator with representative workloads collected at top-level
caches. Request streams for top-level caches show significantly different characteristics than
request streams for institutional caches [MWE00]. The performance studies presented in
Section 10 are based on traces from log files of two different networks: (1) four top-level
proxy caches of the German Gigabit research network, G-WiN [GW01] and (2) ten top-level
proxy caches of the National Laboratory for Applied Network Research (NLANR) cache
hierarchy [NL01]. At the time of trace collection, 44 universities all around Germany
configured their local caching proxies to use the top level caching proxies of the G-WiN as
parents. For NLANR, at time of trace collection 584 individual clients peered to the caches.
For both networks, we evaluated the trace files for a period of one week. Due to space
limitations, we present only the results for a single day in the particular week. For all other
days recorded in the trace files, similar performance results will be achieved.
To make the trace files usable for our performance study, some preprocessing has to be
performed. First, from request recorded in the trace file we consider only GET requests to
cacheable documents. We exclude uncachable documents by commonly known heuristics,
e.g., by looking for string “cgi” or “?” in the requested URL. From the remaining requests, we
consider responses with HTTP status codes 200 (OK), 203 (Non Authoritative Information),
206 (Partial Content), 300 (Multiple Choices), 301 (Moved Permanently), 302 (Found), and
304 (Not Modified) as cacheable. To determine the correct size of data transmissions with
status code 304, we scanned the trace in a two pass scheme. Furthermore, we exclude all log
file entries indicating intercache communication, because intercache communication is
performed by the simulator. Trace characteristics after preprocessing are shown in Table 8.
Recall that the modeled network configuration contains five cooperating Web caches
whereas we have traces from a single Web cache. Following [WVS+99], the overall request
stream recorded in a measured trace is divided into fractional request streams issued by
individual clients (i.e., 44 request streams for DFN). Subsequently, these fractional request
streams are agglomerated into five subtraces, one for each aggregated clients of Figure 24,
such that the total number of requests issued by clients is approximately equal for each
subtrace.

Part 2: Evaluating Cooperative Web Caching for Emerging Network Technologies 51
Trace DFN NLANR
Date June 7, 2000 December 6, 2000
Duration (hours) 24 24
Number of Web documents 2,208,527 1,935,226
Overall document size (GB) 42.75 23.07
Number of requests 4,310,753 3,361,744
Requested data (GB) 67.45 64.11
Average requests/sec. 49.89 38.90
Number of clients 44 584
Table 8. Properties of traces measured in DFN and NLANR
Table 9 states the properties of the subtraces for DFN and NLANR. To estimate the mean
delays for retrieving documents from the origin Web server, we consider requests recorded
with a TCP_MISS/200 status written by the Web proxy cache Squid. The transmission of a
document from a cache to the client can be widely overlapped with the delay for transmitting
the document form the origin Web server to the cache. Therefore, the time needed by a top
level cache to retrieve a document from the origin Web server and deliver it to the client is a
close approximation for the download delay specific for the document. If a document appears
in several log file entries with status code TCP_MISS/200, we calculate download delay as
mean value of the recorded time intervals. By scanning log files for an entire week, we were
able to determine download delays for about 98% of the requested documents.
The important factor for the performance of cooperative Web caching in the backbone of a
national ISP is the ratio between the document transmission time in the local backbone
network to the document download time from the origin Web server. Table 10 provides
numerical results for the average download times derived from the DFN and NLANR traces
as well as mean document transmission times for different network bandwidth. These mean
document transmission times are derived by the performance modeling for TCP latency of
[CSA00]. Note that the average download time in the DFN trace is significantly lower than in
DFN NLANR
Average number of requests 862,151 672,349
Average requested data (GB) 13.49 12.82
Average requests/sec. 9.97 7.78
Table 9. Properties of DFN and NLANR subtraces for modeling aggregated clients

52 Analysis of Web Caching in the Gigabit Research Network G-WiN
Bandwidth DFN NLANR
2.4 Gbps 225.32 msec. 224.21 msec.
622 Mbps 245.73 msec. 243.72 msec.
155 Mbps 266.14 msec. 263,28 msec.
Document transmission time in local backbone
network
34 Mbps 286.54 msec. 282.74 msec.
Document download time
unknown 2681.66 msec. 3633.88 msec.
Table 10. Document transmission and document download times derived from trace
data
the NLANR trace. However, corresponding document transmission times are almost equal for
both traces. From Table 10, we conclude that for a bandwidth of 622 Mbps in the local
backbone network, the ratio between the document transmission time and the document
download time is about 1/11 for DFN while this ratio is about 1/15 for NLANR.
10 Comparative Performance Study of Considered Protocols
10.1 Performance Measures
Performance measures of interest for evaluating cooperative Web caching protocols include
document retrieval latency, bandwidth consumption, and average cache utilization. For ISPs
the bandwidth consumption of a cache mesh constitutes the most important measure.
Bandwidth consumption can be split up into two parts: intercache traffic and saved traffic.
The intercache traffic specifies the traffic used by communication and document transfers
among the caches in a mesh. This part of bandwidth consumption constitutes the overhead
introduced by cooperative Web caching. The simulator measures intercache traffic by
counting the volume transferred via the virtual links. The saved traffic is the volume of all
documents which can be delivered by a caching proxy of the mesh. That is the traffic which
can be kept within the local backbone network. This part of bandwidth consumption
determines the benefit of cooperative Web caching. Saved traffic can be determined by
measuring the amount of data delivered by the local Web caches in the mesh. To relate traffic
saved by cooperative Web caching to the overhead introduced by intercache communication,
we define protocol efficiency. We denote the saved traffic due to cooperative Web caching by
SVcoop , the traffic saved without cooperative Web caching by SVno coop_ , and the traffic for
intercache communication by Vicc . Protocol efficiency is given by SV SVV
coop no ccop
icc
� _ .
Document retrieval latency is the most important performance measure for clients. To be
beneficial for clients, cooperative Web caching should significantly decrease document
retrieval latency [CULM99]. The average retrieval latency specifies the mean time a client

Part 2: Evaluating Cooperative Web Caching for Emerging Network Technologies 53
has to wait until the entire document is delivered. Latency is measured at the client side.
Whenever a client establishes a connection to the target cache, a timer is started. The timer is
stopped when the client has received the requested document, entirely. Recall that we assume
the caches to be in a cut-through mode, i.e., a cache instantly forwards to the client IP packets
received from another cache or the origin Web server.
The performance measure most interesting for Internet enterprises like Application Service
Providers (ASPs) constitutes the average cache utilization because this measure immediately
implies cost/performance trade-offs. Average cache utilization indicates the number of
requests supplied by a given Web cache. The average cache utilization is determined by
measuring the fraction of time the Web cache CPU is busy.
Recall from Table 8 that in the considered traces the overall amount of requested data is
about 65 GB. In the experiments presented below, relative cache sizes range from about 0.4%
to more than 20% of the overall amount of data requested by all clients. Note that for larger
cache sizes all requested documents of the considered traces can be stored in one cache. Thus,
curves for individual protocols are independent from further increasing cache size.
10.2 Bandwidth Consumption and Protocol Efficiency
In a first experiment, we study bandwidth consumption in the cache mesh of the local
backbone network for the considered cooperative Web caching protocols. Figures 25 and 27
plot the amount of saved traffic as a function of individual cache size for the DFN trace and
the NLANR trace, respectively. The results show that without cooperative Web caching an
amount of 15 GB is saved for DFN, i.e., 22% of the overall requested data. For NLANR, 26
GB are saved, i.e., 39% of the requested data. This difference can be explained by the
different client populations of the caches underlying the traces. Clients of the DFN caches are
institutional level proxies whereas clients of the NLANR caches can be user agents,
institutional level proxies, and regional proxies like e.g., the proxies of the CANARII cache
hierarchy [CA01]. As described in [MWE00], locality of reference is affected by intermediate
levels of a cache hierarchy. Thus, user agents peering a cache raise locality and increase hit
rate in the NLANR trace. Cooperative Web caching increases saved volume up to 22 GB for
the DFN trace, i.e. 29% of the total requested data. This constitutes an increase of 39%
relative to the saved data volume among the caches without cooperative Web caching. For the
NLANR trace, cooperative Web caching increases saved volume by 17% to about 30 GB, i.e.,
46% of the total amount of requested data. As above, the difference can be explained by the
different client population. Higher locality leads to higher hit rates in individual proxies and
leaves smaller space for improvements by cooperative Web caching.
Figures 26 and 29 plot the intercache traffic as a function of cache size for the DFN and the
NLANR trace, respectively. Note that without cooperative Web caching no intercache
communication occurs. Thus, these figures do not contain curves for this case. For CARP, we

54 Analysis of Web Caching in the Gigabit Research Network G-WiN
observe that the amount for intercache communication is about 80% of the requested total
amount of data. This can be explained by the fact that the URL space is equally partitioned
among the five caches by the hash functions. Only 20% of the requested documents are
serviced by the Web cache to which the request was issued. The remaining 80% must be
delivered from another cache in the mesh. Due to simple hashing, WCCP does not achieve
optimal distribution of requests among the caches. This causes for WCCP the higher
intercache traffic than for CARP. ICP generates overhead traffic for every cache miss in a
target cache [RW98]. ICP also causes intercache traffic when retrieving a document from a
peer cache. The overhead traffic decreases with increasing cache size, because hit rates at the
target cache increase. On the opposite, traffic caused by document retrieval increases because
more misses in the target cache can be resolved by hits in the peer caches. Cache Digests
cause the smallest amount of intercache communication for because Cache Digests does not
introduce communication on every request as CARP or on every miss as ICP. Consistent with
[Ros97], CARP and WCCP save most traffic. For small caches, WCCP saves slightly less
traffic than CARP because of uneven load balancing. CARP distributes documents from the
same site equally among all caches in the local mesh. CARP and WCCP are tightly followed
by ICP because of sufficient bandwidth. Cache Digests performs worst because of false
misses.
Figures 29 and 30 plot the efficiency of the considered cooperative Web caching protocols
as a function of cache size. CARP yields low efficiency of about 10%, the efficiency achieved
by WCCP is even lower. As explained above, this is due to the high rate of document
transmissions between the caches which occur on about 80% of all requests. On the opposite,
ICP yields efficiency of about 80%, mainly because of the high amount of UDP
communication for documents not in the caches. Cache Digests yield best efficiency because
digests are rarely exchanged and request issued to other caches result in cache hits with high
probability.
The results for bandwidth consumption presented in Figures 25 to 30 are measured for a
bandwidth of 622 Mbps in the local backbone. In further experiment, we performed the same
simulation study for 155 Mbps and 2.4 Gbps bandwidth. These curves have basically the
same shape than the curves of Figures 25 to 30. Thus, bandwidth consumption is almost
independent from the bandwidth available in the local backbone.

Part 2: Evaluating Cooperative Web Caching for Emerging Network Technologies 55
0
10
20
30
40
50
1 10
Tot
al S
aved
Tra
ffic
(G
B)
Relative Cache Size (%)
No cooperative cachingICP
Cache DigestsCARPWCCP
Figure 24. DFN trace: Bandwidth consumption of different protocols;
saved traffic; 622 Mbps bandwidth
0
10
20
30
40
50
1 10
Tot
al I
nter
-Cac
he T
raff
ic (
GB
)
Relative Cache Size (%)
ICPCache Digests
CARPWCCP
Figure 25. DFN trace: Bandwidth consumption of different protocols; intercache traffic; 622 Mbps bandwidth

56 Analysis of Web Caching in the Gigabit Research Network G-WiN
0
10
20
30
40
50
1 10
Tot
al S
aved
Tra
ffic
(G
B)
Relative Cache Size (%)
No cooperative cachingICP
Cache DigestsCARPWCCP
Figure 26. NLANR trace: Bandwidth consumption of different protocols;
saved traffic; 622 Mbps bandwidth
0
10
20
30
40
50
1 10
Tot
al I
nter
-Cac
he T
raff
ic (
GB
)
Relative Cache Size (%)
ICPCache Digests
CARPWCCP
Figure 27. NLANR trace: Bandwidth consumption of different protocols; intercache traffic; 622 Mbps bandwidth

Part 2: Evaluating Cooperative Web Caching for Emerging Network Technologies 57
0
0.2
0.4
0.6
0.8
1
1 10
Prot
ocol
Eff
icie
ncy
Relative Cache Size (%)
ICPCache Digests
CARPWCCP
Figure 28. DFN trace: Protocol efficiency versus cache size;
622 Mbps bandwidth
0
0.2
0.4
0.6
0.8
1
1 10
Prot
ocol
Eff
icie
ncy
Relative Cache Size (%)
ICPCache Digests
CARPWCCP
Figure 29. NLANR trace: Protocol efficiency versus cache size;
622 Mbps bandwidth

58 Analysis of Web Caching in the Gigabit Research Network G-WiN
11 Document Retrieval Latency
Figures 31 to 34 provide a comparison of the latencies introduced by the protocols for
increasing cache sizes. The experiments are performed for bandwidths of 155 Mbps and 2.4
Gbps in the local backbone. To illustrate the relative performance difference of the protocols,
the origin of the y-axis is not zero in Figures 31 to 38. For very small caches in DFN, no
cooperative Web caching outperforms all protocols except ICP in terms of latency. In fact, the
benefit from receiving documents from the local mesh due to cooperative Web caching is less
than the overhead introduced by the protocols. An exception constitutes ICP because of its
rather low overhead for discovering copies of a particular document. If the target cache misses
on a request, the probability for finding the requested document in any other cache in the local
mesh is rather low for small cache sizes. With increasing cache size, cache hit rate increases,
too. For 155 Mbps bandwidth, CARP yields almost the same to document retrieval latency as
no cooperative Web caching. For 2.4 Gbps bandwidth, CARP performs slightly better than no
cooperative Web caching. However, the benefit of any cooperative Web caching protocol is
not significant for clients, i.e., a reduction of document retrieval latency of at most 10%.
Comparing corresponding curves in Figures 33 and 34, we observe that higher locality
caused by different client population in the NLANR trace causes all protocols to be beneficial
even for small cache sizes. Cache Digests shows worst performance of all protocols. This can
be explained by the fact that Cache Digests is not capable of exploiting the high temporal
locality in the NLANR trace because of low actuality of the digests. Opposed to [CULM99],
[RW98], ICP achieves lower document retrieval latency than Cache Digests. CARP performs
better than Cache Digests because of more effectively exploiting temporal locality. The low
document retrieval latency of WCCP is due to low overhead of redirecting requests by routers
and a high probability for cache hits.
Comparing the curves of the DFN and NLANR in Figures 31 to 34, we conclude that the
performance gain of CARP and WCCP over no cooperative Web caching is significantly
influenced by the locality in the workload. Low locality in DFN yields relatively high
latencies for CARP and WCCP. For good locality in NLANR, Figures 33 and 34 show that
the performance of CARP and WCCP is close to Cache Digests and ICP, respectively.
Comparing the curve shown in Figures 31 and 32 with corresponding curves of Figures 33
and 34 for NLANR, we observe that the impact of bandwidth availability in the local
backbone network on document retrieval latency is rather low. In order to further illustrate
this effect, we keep in Figures 35 and 36 the relative cache size fixed to 15 % and investigate
document retrieval latency for network bandwidth of 34 Mbps, 155 Mbps, 622 Mbps and 2.4
Gbps. We observe that document retrieval latency scales linear when bandwidth availability
in the backbone network scales by factor four. Different slopes of the graphs show different

Part 2: Evaluating Cooperative Web Caching for Emerging Network Technologies 59
1400
1600
1800
2000
2200
2400
2600
1 10
Ave
rage
Lat
ency
(m
sec)
Relative Cache Size (%)
No cooperative cachingICP
Cache DigestsCARPWCCP
Figure 30. DFN trace: Document latency of different protocols; 155 Mbps bandwidth
1400
1600
1800
2000
2200
2400
2600
1 10
Ave
rage
Lat
ency
(m
sec)
Relative Cache Size (%)
No cooperative cachingICP
Cache DigestsCARPWCCP
Figure 31. DFN trace: Document latency of different protocols; 2.4 Gbps bandwidth

60 Analysis of Web Caching in the Gigabit Research Network G-WiN
2200
2400
2600
2800
3000
3200
3400
1 10
Ave
rage
Lat
ency
(m
sec)
Relative Cache Size (%)
No cooperative cachingICP
Cache DigestsCARPWCCP
Figure 32. NLANR trace: Document latency of different protocols; 155 Mbps bandwidth
2200
2400
2600
2800
3000
3200
3400
1 10
Ave
rage
Lat
ency
(m
sec)
Relative Cache Size (%)
No cooperative cachingICP
Cache DigestsCARPWCCP
Figure 33. NLANR trace: Document latency of different protocols; 2.4 Gbps bandwidth

Part 2: Evaluating Cooperative Web Caching for Emerging Network Technologies 61
sensitivity of the protocols to network round trip time. Consistent with [WVS+99], we find
that CARP and WCCP show greatest sensitivity because the retrieval of more than 80% of the
data from other caches introduces substantial traffic in the network. ICP is only a slightly less
sensitivite. This can be explained by the fact that the duration of the query response dialog
introduced by ICP depends mainly on network round trip time. Cache Digests show least
sensitivity, because of its small amount of intercache traffic.
From Figures 35 and 36, we conclude that the availability of additional bandwidth in the
local backbone network has little impact on document retrieval latency. Currently, document
retrieval latency is dominated by document download time observed in the traces (see Table
10). Recall that document download time is determined by the bandwidth of the connection
between local and remote backbone and by the delay at the origin Web servers. These delays
are independent from cooperative Web caching protocols in the local backbone. To show the
impact of the ratio between document download time and document transmission time,
Figures 37 and 38 present a sensitivity study. Consistent for both DFN and NLANR, we
observe that document retrieval latency depends linearly on the ratio between document
transmission and document download time. Different slopes in the curves for individual
protocols show different sensitivity of the protocols. The slopes depend on the fraction of
documents which can be delivered form the local cache mesh due to cooperative caching with
the considered protocols. Thus, no cooperative Web caching achieves the steepest slope while
CARP and WCCP achieve lowest slope. Comparing results for DFN and NLANR, we find
again that effectiveness of cooperative Web caching heavily depends on locality observed in
the workload. For the DFN trace showing low temporal locality, no cooperative Web caching
outperforms CARP and WCCP for a ratio between document transmission time and document
download time of 1/8. For the NLANR trace which exhibits higher temporal locality than
DFN trace no cooperative Web caching performs worse than all cooperative Web caching
protocols for all considered ratios.
11.1 Cache Utilization
Figures 39 and 40 plot the average cache utilization as a function of cache size for the
different protocols. Without cooperative Web caching low cache utilization is achieved
because besides a constant number of client requests no further messages are generated.
Higher overhead for processing requests at the origin Web server cause slightly higher
utilization for small cache sizes. Opposed to this, ICP yields the highest utilization due to its
overhead on a cache miss. Consistent with [Ros97], we conclude that ICP scales poorly when
the number of peer caches increases. CARP achieves little less cache utilization because
CARP forces caches to calculate a hash sum on every request. Opposed to ICP, in CARP the
load of retrieving a document is only added to the target cache and the selected cache. In fact,
the additional load introduced by CARP is independent of the number of caches in the local
mesh. Cache Digests yield rather low cache utilization because Cache Digests exchange

62 Analysis of Web Caching in the Gigabit Research Network G-WiN
1400
1600
1800
2000
2200
2400
2600
34 Mbps 155 Mbps 622 Mbps 2.4 Gbps
Ave
rage
Lat
ency
(m
sec)
Backbone Bandwidth (Mbps)
No cooperative cachingICP
Cache DigestsCARPWCCP
Figure 34. DFN trace: Document latency for different bandwidth availablity;
relative cache size 15%
2200
2400
2600
2800
3000
3200
3400
34 Mbps 155 Mbps 622 Mbps 2.4 Gbps
Ave
rage
Lat
ency
(m
sec)
Backbone Bandwidth (Mbps)
No cooperative cachingICP
Cache DigestsCARPWCCP
Figure 35. NLANR trace: Document latency for different bandwidth availablity
relative cache size 15%

Part 2: Evaluating Cooperative Web Caching for Emerging Network Technologies 63
1600
1800
2000
2200
2400
2600
2800
3000
3200
1/8 1/10 1/12 1/14
Ave
rage
Lat
ency
(m
sec)
Transmission Time / Download Time
No cooperative cachingICP
Cache DigestsCARPWCCP
Figure 36. Sensitivity study for DFN trace: Latency vs. transmission/download ratio;
622 Mbps bandwidth, relative cache size 15%. Ratio observed in DFN trace is 1/11.
1600
1800
2000
2200
2400
2600
2800
3000
3200
1/8 1/10 1/12 1/14
Ave
rage
Lat
ency
(m
sec)
Transmission Time / Download Time
No cooperative cachingICP
Cache DigestsCARPWCCP
Figure 37. Sensitivity study for NLANR trace: Latency vs. transmission/download ratio;
622 Mbps bandwidth, relative cache size 15%. Ratio observed in NLANR trace is 1/15.

64 Analysis of Web Caching in the Gigabit Research Network G-WiN
0
1
2
3
4
5
6
7
1 10
Ave
rage
Cac
he U
tili
zati
on (
%)
Relative Cache Size (%)
No cooperative cachingICP
Cache DigestsCARPWCCP
Figure 38. DFN trace: Cache utilization versus cache size;
622 Mbps bandwidth
0
1
2
3
4
5
6
7
1 10
Ave
rage
Cac
he U
tili
zati
on (
%)
Relative Cache Size (%)
No cooperative cachingICP
Cache DigestsCARPWCCP
Figure 39. NLANR trace: Cache utilization versus cache size;
622 Mbps bandwidth

Part 2: Evaluating Cooperative Web Caching for Emerging Network Technologies 65
0
5
10
15
20
25
30
0 5 10 15 20
Ave
rage
Cac
he U
tili
zati
on (
%)
Requests / Second
No cooperative cachingICP
Cache DigestsCARPWCCP
Figure 40. Sensitivity study for DFN trace: Cache utilization vs. request rate;
622 Mbps bandwidth, relative cache size 15%. 10 requests/sec. are observed in DFN.
0
5
10
15
20
25
30
0 5 10 15 20
Ave
rage
Cac
he U
tili
zati
on (
%)
Requests / Second
No cooperative cachingICP
Cache DigestsCARPWCCP
Figure 41. Sensitivity study for NLANR trace: Cache utilization vs. request rate;
622 Mbps bandwidth, relative cache size 15%. 8 requests/sec. are observed in NLANR.

66 Analysis of Web Caching in the Gigabit Research Network G-WiN
messages only on a regular basis. WCCP offers lowest load to the caches due to balancing
requests in the routers. In fact, average cache utilization with WCCP is even lower than for no
cooperative Web caching.
From Figures 39 and 40, we also observe that both the DFN and NLANR trace offer a
moderate load to the caches. In fact, DFN has an average of 10 request/sec. and NLANR 8
requests/sec. To investigate protocol performance for increasing request rates, we perform a
sensitivity study shown in Figures 41 and 42. The relative cache size is kept fixed to 15%,
network bandwidth is fixed to 622 Mbps and the interrequest times in the DFN and NLANR
traces are varied. For both DFN and NLANR, we find that relative order in cache utilization
between the protocols does not change with increasing workload. ICP achieves highest cache
utilization because of its overhead on each miss. CARP scales slightly better than ICP. WCCP
achieves even better scalability than no cooperative Web caching because of its load
balancing among the caches. Consistent with [RW98], we conclude that Cache Digests yields
high scalability while ICP scales poorly. To ensure scalability, clearly the protocol of choice
is WCCP. Comparing Figures 41 and 42, we find that the higher locality in the NLANR trace
has substantial impact on cache utilization. High hit rates at target caches reduce network
traffic. Thus, all cooperative Web caching protocols scale considerably better in environments
offering high temporal locality.

Recommendations for DFN-Verein 67
12 General Conclusions Drawn from Performance Studies
In this project, we provided an in-depth analysis of behavior and design issues of standalone
and cooperative Web caching environments. We presented several performance studies based
on current and future workload characteristics. To enable long-term design, we presented
sensitivity studies, which show the behavior of state-of-the-art algorithms and protocols under
changing user behavior, workload characteristics and network technology. The results can be
directly transferred into recommendations for operators of local area networks, Internet
service provider and application service provider.
In Part 1, we presented comprehensive performance studies of the Web cache replacement
schemes LRU, LFU-DA, Greedy-Dual-Size (GDS) and Greedy-Dual * (GD*). While all
commercial Web caching solutions solely rely on LRU, the newly proposed schemes
LFU-DA, GDS, and GD* can be used in Squid software Web cache. Opposed to previous
studies, we not only consider current workloads based on measured trace data, but also two
forecasts for future workloads seen at Web proxy caches. This workload forecasting is
motivated by the rapidly increasing number of digital audio (i.e., MP3) and video (i.e.,
MPEG) documents in the Web. To derive synthetic workloads for the workload forecasts, we
introduced an effective method for modifying given trace data so that the modified request
stream represents the workload characteristics of the forecast. To understand how Web cache
replacement schemes deal with different Web document classes, we presented curves plotting
hit rate and byte hit rates broken down for HTML, images, and multi media documents.
The investigation of the adaptability of GD*(1) presented in Section 6.1 evidently shows
that GD*(1) does not waste cache space by keeping large multi media documents that are
likely not to be referenced in the near future. This observation explains why GD*(1) almost
always achieves the highest hit rate. The breakdown of hit rates and byte hit rates per
document class shows that the overall hit rate is mainly influenced by the hit rate on images.
The overall byte hit rate is mainly influenced by the byte hit rate on multi media documents.
Recall that current workloads consist of about 70% images and only about 2% multi media
documents. As a consequence, GD*(1) performs significantly better that the other schemes in
terms of hit rate. For small proxy caches, GD*(1) also stays competitive with LRU and LFU-
DA in terms of byte hit rate. In an overall evaluation considering both hit rates and byte hit
rates, the software Web caching solution Squid with the replacement scheme GD*(1) should
be the choice for current workloads. Recall that our workload forecasts are based on the
assumption that the fraction of multi media documents significantly increases, the popularity
of some multi media documents also increases and that the time between two successive
references to the same Web document decreases. These assumptions are motivated by the
trends derived from five traces measured in 1996, 1998, and 2000. For future workloads,
GDS(1) achieves the same performance as GD*(1) in terms of hit rate. Furthermore, the

68 Analysis of Web Caching in the Gigabit Research Network G-WiN
difference in hit rate achieved by GD*(1) over LRU and LFU-DA became considerably
smaller. On the other hand, the disadvantage of GD*(1) over LRU and LFU-DA in terms of
byte hit rate clearly became significant. In an overall evaluation considering both hit rates and
byte hit rates the software Web caching solution Squid with the replacement scheme GDS(1)
should be the choice for future workloads.
In Part 2, we presented a comprehensive performance study of the cooperative Web caching
protocols ICP, CARP, Cache Digests, and WCCP. We investigated performance of individual
protocols from viewpoints of Internet Service Providers (ISPs), clients, and Internet
enterprises like Application Service Providers (ASPs). Consequently, as performance
measures we considered bandwidth consumption, user latency, and cache utilization.
Recall that ISPs are most interested in the amount of saved traffic and in protocol
efficiency. The curves presented in Figures 24 to 29 indicate that ISPs clearly benefit from
cooperative Web caching. For currently operating backbone networks having a bandwidth of
155 Mbps, ICP is the protocol of choice because of its high protocol efficiency. For future
backbone networks having bandwidth of 2.4 Gbps, WCCP is superior to ICP because WCCP
yields higher saved traffic than ICP while the low protocol efficiency of WCCP does not
matter. Recall that ASPs are most interested in low cache utilization because this implies
good cost/performance trade-offs. As illustrated in Figures 39 to 40, ASPs benefit from
cooperative Web caching in case of future backbone networks providing bandwidth of 622
Mbps or 2.4 Gbps. In this case, WCCP yields the lowest cache utilization of all protocols and
also lower cache utilization than no cooperative Web caching. Recall that clients are most
interested in low document retrieval latency. We observe only little differences in document
retrieval latencies achieved by the individual protocols. Moreover, these latency curves are in
the neighborhood of the latency curve for no cooperative Web caching. Thus, clients have not
much benefit from cooperative Web caching regardless which protocol is employed. As
illustrated in a sensitivity study, clients will benefit most from reducing the ratio between
transmission time and document download time. Therefore, providing higher bandwidth in
links to remote backbone networks or deploying a content delivery network are considerably
more effective approaches for reducing document retrieval latency than cooperative Web
caching.
In all experiments, we found that the performance of cooperative Web caching protocols
heavily benefits from temporal locality. Since temporal locality is more likely to occur on a
lower level of a cache hierarchy, cooperative Web caching is most beneficial among
institutional caching proxies. Thus, corresponding curves of NLANR show better
performance than for DFN. Furthermore, both the DFN trace and NLANR trace indicate a
rather low participation to cooperative Web caching among their subscribers. Furthermore,
we found that the impact of low cache utilization due to low participation in cooperative Web
caching make considerably impact to the performance of individual protocols.

Recommendations for DFN-Verein 69
13 Recommendations for DFN-Verein
In this final chapter, we give general recommendations drawn from our performance studies.
We sum up how the customers of the DFN-Verein as well as the DFN in its function as an
ISP can take advantages from the lessons learned in this project.
Recommendations for Operators of Local Web Caches at DFN Customer Sites
In the performance studies presented in Part 1 we investigated the performance of locale Web
caches. We showed that usage of a state-of-the art replacement scheme, e.g. Greedy Dual Size
or Greedy Dual * can save up to 40% of the WWW traffic volume for current and future
workloads. This studies assumes that all clients inside an institution make use of the Web
caching service, as given in the DEC trace. However, if the cache is only used by a subset of
all potential clients, as it is usually in all German universities by now, the amount of saved
traffic reduces to less than 20%. The gap in cache performance caused by different usage
patterns is much bigger than the gap caused by the application of different caching
technologies and algorithms.
As a result of our study, we recommend to the operators of local caches taking measures to
ensure high usage of their caching services. For example an appropriate measure is the
installation of transparent web caching solutions, e.g. by employment of the Web Cache
Coordination Protocol WCCP. High cache acceptance and usage are the building blocks for a
sufficient performance of al presented caching solutions.
Recommendations for the DFN-Verein as Internet Service Provider
The performance studies presented in Part 2 show that, given the current usage pattern, the
highest bandwidth savings achievable by cooperative web caching in the G-WiN Backbone is
about 22%. As investigated for local caching solutions, the reason for this poor performance
is low usage of the caching service by the clients. Opposed to the results investigated for the
DFN-trace, the NLANR-trace shows better performance due to high acceptance and
utilization of the NLANR cache hierarchy.
As a result of our study, one can argue that the DFN-Verein should take measures to
ensure sufficient cache usage by the clients. For example clients could be forced to make use
of the caching service by transparent caching solutions in local institutions. Nevertheless,
caching of every WWW request issued from inside the G-WiN puts tremendous challenges to
WWW caches and protocols. Caching Hardware capable of managing workloads of this
dimension, if available, would have problems to gain a sufficient cost-performance-ratio.
A reason for low cache utilization is the little impact of cooperative Web caching on end
user latency, as shown in Part 2. A primary goal of a caching solution must be to optimize this
performance measure in order to get widely accepted by the clients. To develop a scalable an

70 Analysis of Web Caching in the Gigabit Research Network G-WiN
cost efficient Web caching service, we recommend to the DFN-Verein to focus future efforts
on transparent WWW replication techniques and content routing solutions, e.g. as employed
by Content Delivery Networks.
General Recommendations
The results presented in Part 1 and 2 show how performance studies can be employed to
evaluate the benefit of the installation of new technological approaches. Our studies showed
that web caching is only effective, if widely used by the clients. The results of the studies
were derived based on workload-measurements and –forecasts which were available without
building a complex Web caching infrastructure, neither at local institutions nor inside the G-
WiN backbone. We conclude that in-depth performance studies should be used before the
installation of new technological solutions, because they can a priori discard several design
alternatives and identify the framework for efficient use of a technological approach.
Proposals for Future Projects
The majority of work done in this project constitutes the development of the simulation
environment for local and distributed Web caching solutions as well as the workload
characterization and modeling. The developed components could be reused in a short-term
project, which provides economic evaluations of different Web caching solutions. Using the
existing components, the expected bandwidth savings for an arbitrary cache configuration can
be calculated based on a given workload trace. The simulation results can be used to perform
a detailed cost / benefit analysis considering the investment in hardware and labor. By
providing such combination of simulation software and economic calculations, the project
results can easily be transferred from network performance measures (i.e., byte hit ration and
end user latency) to economic performance measures (i.e., return of investment).
In a long-term project, the current project results can build a theoretical foundation for the
development of an efficient ISP-centric content delivery solution. To increase client
acceptance for content delivery solutions in the Gigabit Research Network G-WiN, to issues
must be addressed: First, End user latency has to be substantially reduced. As shown in Part 2,
this can be achieved by reducing Web server delays. Second, transparent methods for
redirection of user requests to cache servers have to be employed. Request must be addressed
to the server, which can serve the requested content optimal from two different points of
view. An optimal delivery from the client’s point of view is the fastest possible delivery of a
requested Web document. From the point of view of an Internet service provider, an optimal
delivery saves most bandwidth on external (i.e. expensive) links. To meet these conflicting
goals, in-depth understanding of cache cooperation and the sensitivity of distributed caching
systems to workload characteristics is needed. Such understanding is provided by the results
the current project.

References 71
References
[AFJ00] M. F. Arlitt, R. Friedrich and T. Jin: Performance Evaluation of Web Proxy Cache
Replacement Policies, Performance Evaluation, 39, pp. 149-164, 2000.
[AW97] M. F. Arlitt and C. Williamson: Internet Web Servers: Workload Characterization
and Performance Implications, IEEE/ACM Trans. on Networking, 5, pp. 631-645,
1997.
[BCF+99] L. Breslau, P. Cao, L. Fan, G. Phillips, and S. Shenker. Web Caching and Zipf-
like Distributions: Evidence and Implications. Proc. 21st Annual Conf. of the
IEEE Computer and Communication Societies, (IEEE Infocom) New York, pp.
126-134, 1999.
[CA01] CA*�Net 3, Canada’s Advanced Internet Development Organization.
http://www.canarie.ca/advnet/canet3.html
[CF01] CacheFlow, Inc., http://www.cacheflow.com/, 2001
[CFTW00] M. Cieslak, D. Foster, G. Tiwana, and R. Wilson, Web Cache Coordination
Protocol v2.0. IETF Internet draft, 2000. http://www.ietf.org/internet-drafts/draft-
wilson-wrec-wccp-v2-00.txt
[CI97] P. Cao and S. Irani, Cost-Aware WWW Proxy Caching Algorithms. Proc. 1st
USENIX Symp. on Internet Technologies and Systems, Monterey, California, pp.
193-206, 1997.
[CLLM00] C. Chiang, Y. Li, M. T. Liu, and M.E. Muller, On Request Forwarding for the
Dynamic Web Caching Hierarchies, Proc. 20th Int. Conf. on Distributed
Computing Systems (ICDCS), Taipei Taiwan, 2000.
[CMT01] I. Cooper, I. Melve, and G. Tomlinson, Internet Web Replication and Caching
Taxonomy, IETF Internet draft, 2000. http://www.ietf.org/internet-drafts/draft-
ietf-wrec-taxonomy-05.txt
[Cro00] M. Crovella, Performance Characteristics of the World Wide Web, In: G. Haring,
C. Lindemann, M. Reiser (Eds.) Performance Evaluation: Origins and Directions,
LNCS Vol. 1769, pp. 219-232, Springer 2000.
[CS01] Cisco Systems, Inc., http://www.cisco.com/
[CSA00] N. Cardwell, S. Savage, and T. Anderson, Modeling TCP Latency, Proc. 20th
Conf. on Computer Communications (IEEE INFOCOM), Tel Aviv Israel, 2000.
[CULM99] C. Chiang, M. Ueno, M. Liu, and M. Muller, Modeling Web Caching Hierarchy
Schemes, Technical Report OSU-CISRC-6/99-TR17, Ohio State University,
1999.
[EFV00] D. L. Eager, M. C. Ferris, and M. K. Vernon. Optimized Caching in Systems with
Heterogeneous Client Populations, Performance Evaluation, 42, pp. 163-185,
2000.

72 Analysis of Web Caching in the Gigabit Research Network G-WiN
[FCAB00] L. Fan, P. Cao, J. Almeida, and A. Broder, Summary Cache: A Scalable Wide
Area Web Cache Sharing Protocol, Proc. ACM Conf. on Applications,
Technologies, Architectures, and Protocols for Computer Communication
(SIGCOMM), Vancouver Canada, pp. 254-265, 1998.
[FCD+99] A. Feldmann, R. Cáceres, F. Douglis, G. Glass, and M. Rabinovich, Performance
of Web Proxy Caching in Heterogeneous Bandwidth Environments, Proc. 19th
Conf. on Computer Communications (IEEE INFOCOM), New York NY, pp. 107-
116, 1999.
[GPV01] C. Grimm, H. Pralle and J. Vöckler, The DFN Cache Mesh,
http://www.cache.dfn.de/
[GVP98] C. Grimm, J. Vöckler, and H. Pralle, Load and Traffic Balancing in Large Scale
Cache Meshes, Computer Networks and ISDN Systems, 30, pp. 1687-1695, 1998.
[GW01] G-WiN, The German Research Network Association (DFN-Verein),
http://www.dfn.de/win/gwin/
[IN01] Internet�2, University Corporation for Advanced Internet Development.
http://www.internet2.edu/
[Inc01] Inctomi, http://www.inktomi.com/
[Inf01] InfoLibria, http://www.infolibria.com/
[JB00] S. Jin and A. Bestavros: Greedy Dual* Web Caching Algorithm: Exploiting the
Two Sources of Temporal Locality in Web Request Streams, Proc. 5th Int.
Workshop on Web Caching and Content Delivery, Lisboa, Portugal, 2000.
[JB99] S. Jin and A. Bestavros: Temporal Locality in Web Request Streams: Sources,
Characteristics, and Caching Implications, Technical Report 1999-014, CS
Department, Boston University, October 1999.
[KBB+99] D. Karger, A. Sherman, A. Berkheimer, B. Bogstad, R. Dhanidina, K. Iwamoto,
B. Kim, L. Matkins, and Y. Yerushalmi, Web Caching with Consistent Hashing,
Computer Networks and ISDN Systems, 31, pp. 1203-1213, 1999.
[MEW00] A. Mahanti, D. Eager, and C. Williamson. Temporal Locality and its Impact on
Web Proxy Cache Performance, Performance Evaluation, 42, pp. 187-203, 2000.
[Mog96] J. Mogul, Digital's Web Proxy Traces, Digital Equipement Corporation,
ftp://ftp.digital.com/pub/DEC/traces/proxy/tracelistv1.2.HTML
[MS99] K. Mehlhorn and S. Näher, The LEDA Platform of Combinatorial and Geometric
Computing, Cambridge University Press, 1999.
[MW99] A. Mahanti and C. Williamson, Web Proxy Workload Characterization, Technical
Report, Department of Computer Science, University of Saskatchewan, February
1999, http://www.cs.usask.ca/faculty/carey/papers/workloadsudy.ps
References 73
[MWE00] A. Mahanti, C. Williamson, and D. Eager, Workload Characterization of a Web
Proxy Caching Hierarchy, IEEE Network Magazine: Special Issue on Web
Performance, 14, pp. 16-32, 2000.
[NA01] Network Appliance, http://www.netapp.com/
[NL01] NLANR, National Laboratory for Applied Network Research,
http://www.nlanr.net/
[Nov01] Novell, http://www.novell.com/
[Ros97] K.W. Ross, Hash Routing for Collections of Shared Web Caches, IEEE Network,
11, pp. 37-44, 1997.
[RSP99] P. Rodriguez, C. Spanner, and E.W. Biersack, Analysis of Web Caching
Architectures: Hierarchical and Distributed Caching, submitted to IEEE/ACM
Trans. on Networking 1999, http://www.eurecom.fr/~btroup/FormerPages/
rodrigue_htdoc/
[RW98] A. Rousskov and D. Wessels, Cache Digests, Computer Networks and ISDN
Systems, 30, pp. 22-23, 1998.
[Sch95] H. Schwetman, Object-oriented Simulation Modeling with C++/CSIM17, Proc. of
the 1995 Winter Simulation Conference, Eds. C. Alexopoulos, K. Kang, W.
Lilegdon, D. Goldsman, 529-533, 1995, http://www.mesquite.com/
[Sch95] H. Schwetman, Object-oriented Simulation Modeling with C++/CSIM17, Proc. of
the 1995 Winter Simulation Conference, Eds. C. Alexopoulos, K. Kang, W.
Lilegdon, D. Goldsman, pp. 529-533, 1995. http://www.mesquite.com
[Squ01] The Squid Web Proxy Cache, http://www.squid-cache.org/
[VR98] V. Valloppillil and K.W. Ross, Cache Array Routing Protocol v1.0, expired
Internet draft, 1998, http://www.ircache.net/Cache/ICP/carp.txt
[WC98] D. Wessels and K.C. Claffy, ICP and the Squid Web Cache, IEEE Journal on
Select. Areas in Comm., 16, pp. 345-357, 1998.
[WVS+99] A. Wolman, G. Voelker, N. Sharma, N. Cardwell, A. Karlin, and H. Levy, On the
Scale and Performance of Cooperative Web Proxy Caching, Proc. 17th ACM
Symp. on Operating Systems Principles (SOSP), Kiawah Island SC, pp. 16-31,
1999.
[WY00] K.-L. Wu and P.S. Yu. Latency-sensitive Hashing for Collaborative Web
Caching, Proc. 9th World Wide Web Conference, Amsterdam The Netherlands,
pp. 633-644, 2000.
[WY99] K.-L. Wu and P.S. Yu. Local Replication for Proxy Web Caches with Hash
Routing, Proc. 8th Int. Conf. on Information Knowledgement (CIKM), Kansas
City KS, pp. 69-76, 1999.