ANALYSIS OF THE RESULTS OF HYDRAULIC- FRACTURE STIMULATION ... · ANALYSIS OF THE RESULTS OF...
54
ANALYSIS OF THE RESULTS OF HYDRAULIC- FRACTURE STIMULATION OF TWO CRYSTALLINE BEDROCK BOREHOLES, GRAND PORTAGE, MINNESOTA U.S. GEOLOGICAL SURVEY Water-Resources Investigations Report 94-4044 (200) WRi no.94-4044
Transcript of ANALYSIS OF THE RESULTS OF HYDRAULIC- FRACTURE STIMULATION ... · ANALYSIS OF THE RESULTS OF...

ANALYSIS OF THE RESULTS OF HYDRAULIC- FRACTURE STIMULATION OF TWO CRYSTALLINE BEDROCK BOREHOLES, GRAND PORTAGE, MINNESOTA
U.S. GEOLOGICAL SURVEY
Water-Resources Investigations Report 94-4044
(200)WRi
no.94-4044

COVER ILLUSTRATION: Pigeon Point and Lucille Island viewed from Mount Josephine, Grand Portage Indian Reservation; Isle Royale National Park is on the horizon.

Analysis of the Results of Hydraulic-Fracture Stimulation of Two Crystalline Bedrock Boreholes, Grand Portage, Minnesota
1 2by Frederick L. Paillet and James D. Olson
U.S. GEOLOGICAL SURVEY
Water-Resources Investigations Report 94-4044
U. S. Geological Survey, Denver, Colorado
Midwest Hydrofrac, Inc., Eau Claire, Wisconsin
Denver, Colorado 1994
U.S. DEPARTMENT OF THE INTERIOR
BRUCE BABBITT, Secretary
U.S. GEOLOGICAL SURVEY
Gordon P. Eaton, Director
The use of trade, product, industry, or firm names is for descriptive purposes only and does not imply endorsement by the U.S. Government.
For additional information write to: Copies of this report can be purchased from:
Chief, Branch of Regional Research U.S. Geological SurveyU.S. Geological Survey Earth Science Information CenterBox 25046, MS 418 Open-File Reports SectionDenver Federal Center Box 25286, MS 517Denver, CO 80225 Denver Federal Center
Denver, CO 80225

CONTENTSPage
Abstract............................................................. 1Introduction......................................................... 1
Purpose and scope............................................... 2Description of study site....................................... 2Hydraulic fracture stimulation in the water well industry....... 9
Description of equipment used in study............................... 9Conventional borehole geophysics equipment...................... 9Acoustic televiewer............................................. 10Heat-pulse flowmeter............................................ 10Hydraulic fracture stimulation equipment........................ 12
Model of hydraulic fracture stimulation.............................. 12Method of study...................................................... 19Analysis of results.................................................. 22
Pressure records during stimulation............................. 22Inflow profiles before and after stimulation.................... 25Net increases in production attributed to stimulation........... 25Changes in geophysical logs attributed to stimulation........... 32Relation between pressure diagnostics and production
increases.................................................... 38Comparison of results from single packer and straddle-packer
stimulations................................................. 40Summary.............................................................. 41References cited..................................................... 44
FIGURES
1. Map showing location of the three test boreholes in the Grand Portage, Minnesota, area....................................................... 3
2. Photographs of fractured gabbro exposed along Minnesota Highway 61 about one-half mile northeast of the Reservation River borehole site......................................................... 4
3. Caliper, natural gamma, short-normal resistivity, acoustic televiewer, and drill bit penetration logs for (A) The Reservation River borehole, and (B) The Hollow Rock Creek borehole at the Grand Portage, Minnesota, study site........................................................... 7
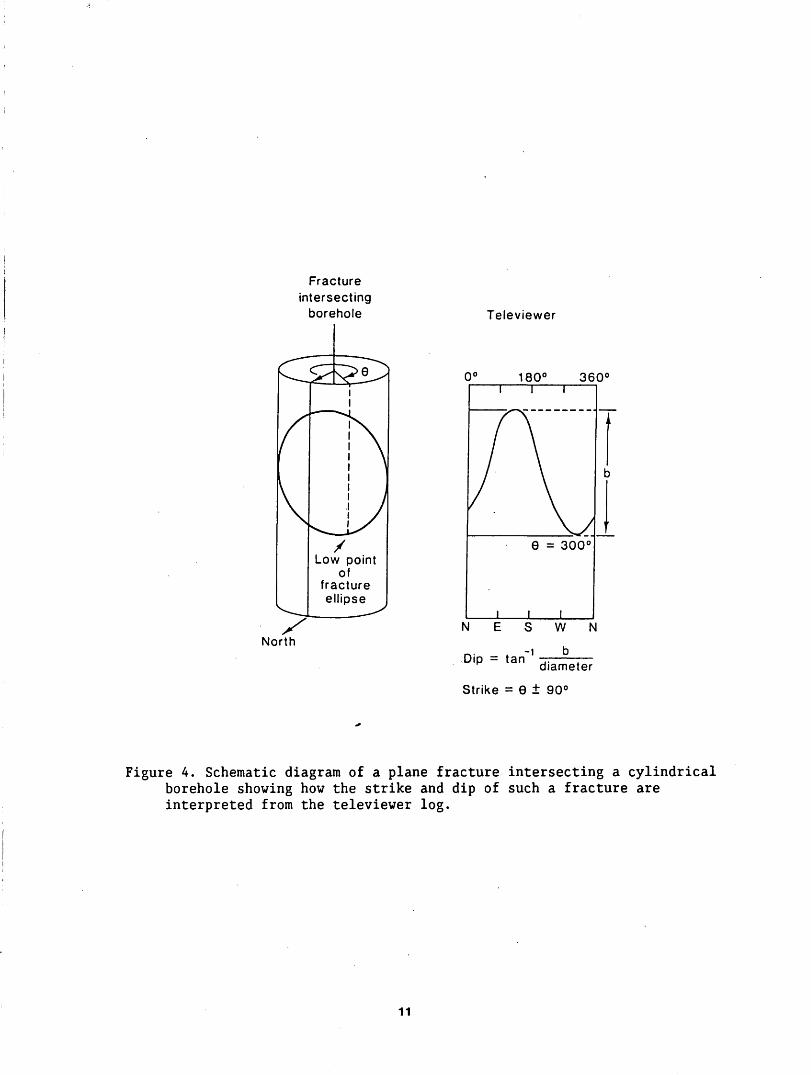
4. Schematic diagram of a plane fracture intersecting a cylindrical borehole showing how the strike and dip of such a fracture are interpreted from the televiewer log................................. 11
5. Schematic diagram of the U.S. Geological Survey heat-pulse flowmeter, illustrating configuration of heat grid, thermistors, and downhole packer............................................................... 13
6. Graph showing calibration curve relating heat-pulse-flowmeter response to borehole flow.................................................... 14
7. Schematic diagram of equipment used for hydraulic fracture stimulation of fractures intersecting a borehole drilled in fractured bedrock.... 15
8. Diagrams showing geomechanical model of hydraulic fracture stimulation: (A) Fracture geometry of a closed fracture connected to an open fracture at a distance, L, from the borehole, and (B) Expected or ideal pressure response during injection of water into this fracture................ 17
IV

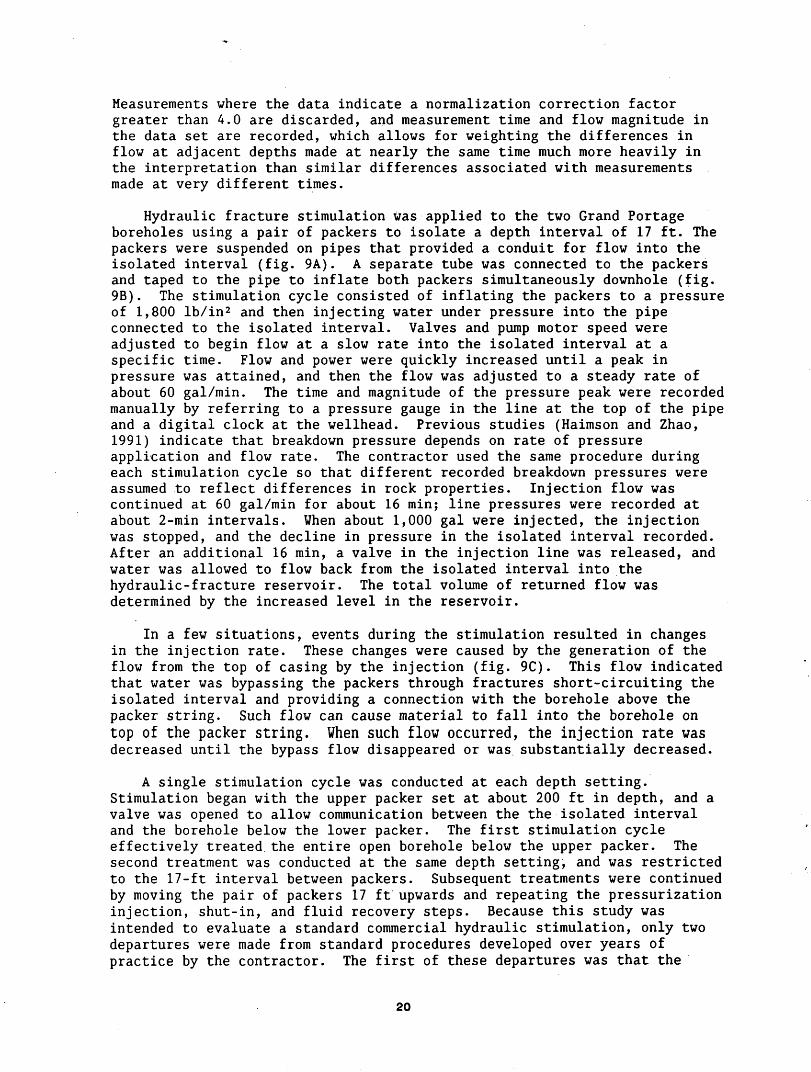
9. Photographs of hydraulic fracture-stimulation operations at the Reservation River site: (A) General view of equipment at wellhead. (B) One of the pair of packers used to isolate an interval during packing. (C) Water flowing from top of casing indicating that injected water is bypassing the upper packer during injection......... 21
10. Graphs showing records of injection line pressure during stimulation for(A) The 10 intervals stimulated in the Reservation River borehole, and(B) The 6 intervals stimulated in the Hollow Rock Creek borehole....... 24
11. Graphs showing drawdowns measured in (A) The Reservation River borehole, and (B) The Hollow Rock Creek borehole during steady pumping at a rate of 1.2 gallons per minute and during subsequent recovery............... 26
12. Diagram showing heat-pulse flowmeter measurements of flow in (A) TheReservation River borehole, and (B) The Hollow Rock Creek borehole during pumping at a rate of 1.2 gallons per minute; flows are normalized to values that would be measured at a drawdown of about 20 feet........... 27
13. Borehole televiewer logs obtained in four intervals before and afterhydraulic stimulation in the Reservation River borehole................ 33
14. Caliper, fluid conductivity, and short-normal resistivity logs obtained before and after hydraulic stimulation in A) The Reservation River borehole, and B) The Hollow Rock Creek borehole ....................... 36
15. Results of correlation between hydraulic-fracture diagnostics and increased production of ground water from fractures after stimulation: (A) Normalized breakdown pressure. (B) Normalized injection pressure. (C) Pressure decline time after the end of injection. (D) Percentage of injected water recovered........................................................ 39
TABLES
1. Drilling information and estimated yield for Grand Portage boreholes... 52. Summary of hydraulic fracture stimulation treatments conducted
in the Grand Portage boreholes........................................ 233. Heat-pulse flow measurements during post-stimulation test at a constant
discharge of 1.2 gallons per minute................................... 284. Summary of inflow zones in Grand Portage boreholes.................... 315. Estimated results from single-packer stimulation in Grand
Portage boreholes..................................................... 42

CONVERSION FACTORS
Multiply By To obtain
foot (ft) 0.3048gallon (gal) 3.785gallon per 0.06309minute (gal/min)
inch (in) 25.40mile (mi) 1.609pound per ,6.895
square inch (Ib/in 2 ')
meter liter liter per second
millimeterkilometerkilopascal
To convert degrees Fahrenheit (°F) to degrees Celsius (°C), use the following formula:
°C=(°F-32)/1.8
To convert degrees Celsius (°C) to degrees Fahrenheit (°F), use the following formula:
°F=1.8°C+32.
The following terms and abbreviations also are used in this report:
parts per million (ppm) ohmmeters (ohm-m) liters per minute (L/min) borehole televiewer (BHTV) heat-pulse flowmeter (HPFM)
vi

ANALYSIS OF THE RESULTS OF HYDRAULIC-FRACTURE STIMULATION OF TWO CRYSTALLINE BEDROCK BOREHOLES, GRAND PORTAGE, MINNESOTA
Frederick L. Paillet James D. Olson
ABSTRACT
Hydraulic fracture-stimulation procedures typical of those provided by contractors in the water-well industry were applied to two boreholes in basaltic and gabbroic rocks near Grand Portage, Minnesota. These boreholes were considered incapable of supplying adequate ground water for even a single household although geophysical logs showed both boreholes were intersected by many apparently permeable fractures. Tests made before and after stimulation indicated that the two boreholes would produce about 0.05 and 0.25 gallon per minute before stimulation, and about 1.5 and 1.2 gallons per minute after stimulation. These increases would be enough to obtain adequate domestic water supplies from the two boreholes but would not furnish enough water for more than a single household from either borehole. Profiles of high-resolution flow made during pumping after stimulation indicated that the stimulation enhanced previously small inflows or stimulated new inflow from seven fractures or fracture zones in one borehole and from six fractures or fracture zones in the other. Geophysical logs obtained after stimulation showed no specific changes in these 13 fractures that could be related to stimulation other than the increases in flow indicated by the flowmeter logs. The results indicate that the stimulation has increased inflow to the two boreholes by improving the connectivity of favorably orientated fractures with larger scale flow zones in the surrounding rocks. Three of four possible diagnostics related to measured pressure and flow during the stimulation treatments were weakly correlated with the increases in production associated with each treatment interval. These correlations are not statistically significant on the basis of the limited sample of 16 treatment intervals in two boreholes, but the results indicate that significant correlations might be established from a much larger data set.
INTRODUCTION
Fractured crystalline basement rocks provide an important source of drinking water for many regions in North America (Trainer, 1987). There is also great interest in predicting the movement of contaminants accidentally introduced into aquifers in fractured crystalline rock (Vernon and others, 1993). The heterogeneous distribution of hydraulic conductivity in these rocks, however, makes the prediction of well yield difficult and makes the potential for contaminant dispersal hard to quantify. A number of studies show how borehole geophysics and well testing can be used to estimate the distribution of hydraulic conductivity along boreholes drilled into crystalline rocks (Paillet, 1991, 1993; Vernon and others, 1993). Nonetheless, it often is not possible to determine the three-dimensional geometry of flow paths in fractured basement rocks without measuring the distribution of fracture permeability in a prohibitively large number of boreholes.

All of these factors result in a recognized need for the development of entirely new techniques for the characterization of fracture permeability in relatively large masses of rock (dimensions from 5 to 500 ft) around and between boreholes. Hydraulic fracture techniques, where the tensile strength of the rock is exceeded, pressure in isolated intervals of borehole is raised to levels where fractures, and water is allowed to flow into the formation, appear to offer one approach to such measurements. Studies indicate that fracture connections and intersections are as important in controlling the flow through fractured rocks as the aperture of individual fractures measured at a given location (Long and others, 1982; Paillet and others, 1987). Hydraulic fracturing provides the ability to focus increased pressures on constrictions in slightly permeable fracture networks. Therefore, the characterization of hydraulic fracture stimulations has the potential to provide information about the hydraulic properties of the fracture network and constrictions in the flow paths. Hydraulic fracture techniques might also be useful in improving the connection between individual boreholes and the major flow paths in heterogeneous formations. Several studies have indicated that individual boreholes drilled into known fracture zones can be poorly connected to the surrounding rocks, even though the rock mass is shown to be hydraulically conductive on a larger scale (Paillet, 1991; Vernon and others, 1993). In spite of the these potential benefits, there have been relatively few detailed investigations of hydraulic fracture stimulations in shallow crystalline rocks (Paillet and others, 1989). The investigation described in this report was undertaken as part of a long-term study to evaluate the effects of hydraulic fracture stimulation treatments applied in boreholes typical of those drilled as domestic water supplies. It was hoped that this investigation would provide specific information about fractures affected by the procedure and the nature of the changes induced in those fractures.
Purpose and Scope
This report describes the analysis of the results of a commercial stimulation procedure applied to two boreholes in crystalline rocks in northeastern Minnesota. The report presents profiles of fracture density, and ground-water production zones determined for the two boreholes before stimulation and compares these data with similar data obtained after stimulation. These results illustrate the effects of hydraulic stimulation in typical applications, and provide examples of how specific indicators recorded during stimulation, such as breakdown pressure and rate of pressure loss at the end of injection, might relate to the effectiveness of the treatment.
Description of Study Site
The study site is located in northeastern Minnesota near the town of Grand Portage on the Grand Portage Indian Reservation (fig. 1). Fractures exposed in fresh outcrop can be viewed in road cuts along U.S. Highway 61 throughout the .study site (fig. 2).
Three bedrock boreholes were drilled in 1991 as part of a study on the availability of ground water from fracture flow zones in gabbroic and basaltic bedrock (table 1). The three boreholes are 6-in-diameter, open boreholes drilled by the air-rotary method (Teasdale and Pemberton, 1984). This drilling method maintains an air-filled borehole by driving all

CO
NT
OU
R I
NTE
RV
AL
IS 2
00 F
EE
T
CO
NT
OU
RS
AR
E I
N F
EE
T A
BO
VE
ME
AN
SE
A L
EV
EL
Fig
ure
1.
L
oca
tio
n
of
the
thre
e te
st
bo
reh
ole
s in
th
e G
rand
P
ort
age,
M
innes
ota
, ar
ea.

Figure 2. Photographs of fractured gabbro exposed along Minnesota Highway 61 about one-half mile northeast of the Reservation River borehole site.

Table 1. Drilling information and estimated yield for Grand Portage boreholes [gal/min, gallons per minute; RR, Reservation River; HRC, Hollow Rock Creek; MC, Mineral Center]
Borehole
RR
HRC
MC
Surface , elevation
695
645
1,400
Casing bottom depth, in feet
50
85
28
Drilled depth
345
265
275
Date drilled
10-24-91
10-31-91
11-14-91
Rock type
Gabbro
Basalt
Gabbro
Estimated yield2
in gal/min
0.05
0.50
100.00
"Surface elevation, in feet, at top of casing.>'Based on water removed from borehole by compressed air during drilling,

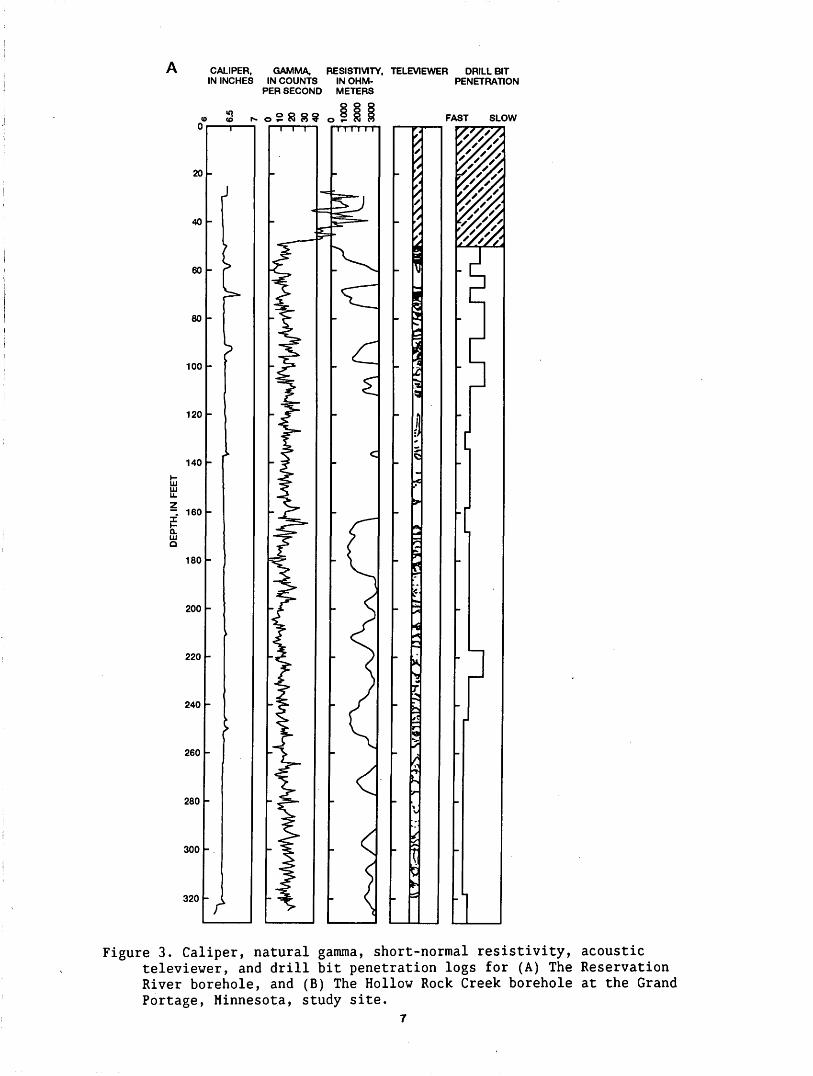
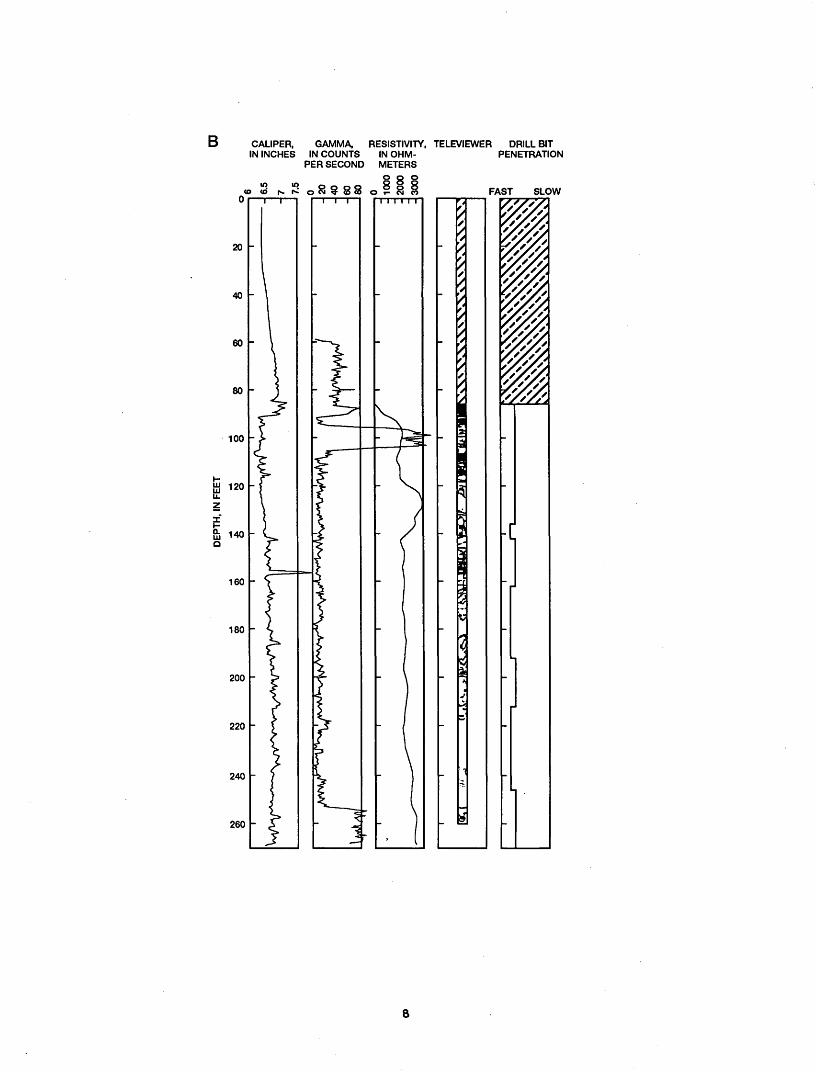
inflowing water and rock cuttings out of the borehole with compressed air. The water produced during drilling can be used to estimate borehole production (Paillet and Duncanson, 1994). One of these boreholes, the Mineral Center (MC) borehole, was rated by the driller as capable of producing about 100 gal/min. The two other boreholes, the Reservation River (RR) borehole and the Hollow Rock Creek (HRC) borehole were rated at capacities of 0.05 and 0.5 gal/min, respectively. These two boreholes hereafter will be the focus of this study and will be referred to as the Grand Portage boreholes. Natural gamma, caliper, and short-normal resistivity, and fluid conductivity logs are compared to the BHTV and driller's logs for the two Grand Portage boreholes in figure 3. The bedrock intersected by borehole RR is mapped as "gabbro" and that intersected by borehole HRC is mapped as "basalt" (Sims and Morey, ed., 1972). The driller's log is given in terms of the reported rate of drill bit penetration on a scale from 1 (fast drill bit penetration into "very soft", weathered rock) to 6 ( slow drill bit penetration into "very hard" unweathered crystalline rock). The BHTV logs show the distribution of fractures encountered by the two boreholes, both of which are intersected by numerous permeable-looking fractures.
The fluid conductivity logs for both boreholes show shifts in fluid resistivity that might be associated with inflow or outflow from the borehole. However, no consistently measurable flow was detected in these boreholes under ambient hydraulic-head conditions, and only a small amount of upflow was detected in borehole HRC during pumping. In the first test, borehole RR was pumped at 1.1 gal/min, but almost all flow came from water stored in the casing. No upflow could be measured using the HPFM when drawdown exceeded 20 ft, and less than 2 in. of water-level recovery was measured during the first hour after the end of pumping. The inflow during drilling was estimated at 0.05 gal/min, which would correspond to a rise of water in the well bore of less than 2 ft per hour at more than 10 times the drawdown available during the HPFM measurements. About 0.10 gal/min of inflow was measured with the HPFM with about 20 ft of drawdown in borehole HRC, but all of this inflow entered within a few feet of the bottom of casing. This amount of inflow seems consistent with the 0.5 gal/min capacity indicated by the driller.
The geophysical and drillers logs also indicate some substantial differences between the rocks surrounding boreholes RR and HRC. The driller's log describes the rocks while drilling borehole HRC as much softer than those penetrated by borehole RR. The identification of altered zones may be important in assessing the effects of hydraulic stimulation because the mechanical strength of rocks adjacent to stimulated fractures may influence the effectiveness and long term stability of changes in fracture permeability induced by stimulation. This difference is confirmed by the other geophysical logs. For example, the BHTV log indicates a large number of fractures intersected by both boreholes, but some of the fractures intersected by borehole HRC seem much more altered than those intersected by borehole RR. The short-normal resistivity log for borehole RR shows a number of intervals where formation resistivity is greater than the 3,000 ohm-meter capacity of the logging sonde. These intervals correspond with depths where the driller found the formation very hard, and drilling was very slow. Intervals of relatively low resistivity (less than 2,000 ohm-meters) correspond with intervals of medium to soft rock described by
CALIPER, GAMMA, RESISTIVITY, TELEVIEWER DRILL BIT IN INCHES IN COUNTS IN OHM- PENETRATION
PER SECOND METERS
FAST SLOW
20
60
80
100
120
140
~. 160
iLLJ Q
180
200
220
240
260
280
300
320 r
Figure 3. Caliper, natural gamma, short-normal resistivity, acousticteleviewer, and drill bit penetration logs for (A) The Reservation River borehole, and (B) The Hollow Rock Creek borehole at the Grand Portage, Minnesota, study site.
7
GAMMA, RESISTIVITY, TELEVIEWER DRILL BITPENETRATION
FAST SLOW
240 -
260 -
-t

the driller and with zones where the borehole intersected numerous fractures. In contrast, the short-normal resistivity log indicates resistivity values less than 1,000 ohm-meters for all of borehole HRC. These values, in part, are caused by the relatively low resistivity of the borehole fluid. When this low borehole fluid resistivity value is taken into account using the correction curves given by Hearst and Nelson (1985), only the interval from 120 to 130 ft in depth in borehole HRC corresponds in formation resistivity with the many high-resistivity intervals in borehole RR.
Hydraulic Fracture Stimulation in the Water-Well Industry
Hydraulic fracture stimulation is a commercially viable technique for improving the production of otherwise poorly productive wells. Stimulation procedures are offered by private companies specializing in these services at such locations as northern New England, the southern Canadian Shield, the Rocky Mountain Front Range, and the Sierra Nevada foothills of California. Although few details have been published, conversations with drillers and hydraulic fracture-stimulation specialists indicate that from 10 to 20 percent of boreholes drilled in crystalline rocks produce 0.5 gal/min or less when originally drilled, and hydraulic stimulation procedures increase the production from these boreholes by at least 0.5 gal/min in more than 90 percent of treatments (Waltz, James, verbal commun., 1992).
In general, hydraulic stimulation consists of isolating an interval of borehole with one or more packers, increasing the pressure in the isolated interval until water begins to flow into the formation, and allowing a quantity of water to flow into the formation (Paillet and others, 1989; Zoback and Haimson, 1982). The exact way in which this stimulation is done varies considerably. Some commercial companies use a single packer lowered by cable, whereas others use pairs of packers (straddle packers) suspended from drill strings. Stimulations may be applied near the bottom of the borehole and repeated at higher levels (typical procedure if straddle packers are used), or may be started in the upper part of the borehole and repeated at greater depths (typical procedure if a single packer is used). Some stimulation treatments involve a number of short injection cycles, whereas others use one, long injection cycle. Finally, some treatments provide for the introduction of sand or some other "proppant" during the last cycle. The proppant is injected into the flow so that individual grains of proppant will become lodged in fracture passages during stimulation, possibly causing fracture apertures to remain open after pressure is decreased in the stimulation interval. The diagnostics used to track the characteristics of the stimulation also vary from occasional recording of pressure gage measurements to continuous digital recording of pressures and flow rates during stimulation.
DESCRIPTION OF EQUIPMENT USED IN STUDY
Conventional Borehole .Geophysics Equipment
The two Grand Portage boreholes were logged with a suite of conventional logs consisting of caliper, temperature, fluid resistance, natural gamma, and normal resistance logs before and after stimulation. Conventional borehole geophysics (well logging) is useful in defining the general lithology of rock masses penetrated by boreholes, but is not very useful in

identifying individual fractures. Caliper logs indicate those intervals where fracturing or geochemical alteration has weakened the borehole wall rock so the borehole is locally enlarged. Natural gamma logs indicate where fractures may be associated with lithologic contacts, or where radioisotopes may be deposited as fracture infillings. Electrical resistivity logs indicate where rock properties have been altered adjacent to fractures. Acoustic logs were not available for this study. Previous studies show that acoustic logs are useful in fracture characterization, but probably would not have provided information that would not be available from the combination of electric and televiewer logs. All of these logs sample rock properties over sample volumes too large to be directly affected by the permeability of individual fractures, but each of them provides useful indications of the direct (mechanical weakening) and indirect (alteration) effects of fractures on the bulk properties of rocks (Keys, 1979, 1990; Paillet, 1992).
Conventional geophysical logs also may indicate where there is water flowing along the borehole. Such natural flows are common in boreholes that intersect fractured rocks because hydraulic heads may be different in fracture zones isolated from each other, and these hydraulic head differences can drive flow along a borehole intersecting the two zones. This flow may be indicated by local isothermal intervals on temperature logs, or by contacts between water of very different electrical conductivity indicated by the fluid resistivity log (Keys, 1986, 1990). Fluid conductivity contrasts in the borehole also may show up on other electric logs such as the long- and short-normal resistivity logs because the measured electrical properties of the rocks are affected by the conductivity of the borehole fluid.
Acoustic Televiewer
The acoustic borehole televiewer (BHTV) is a device that produces a photograph-like image of the borehole wall by recording the intensity of ultrasonic reflections from the borehole wall as a pulsed source/detector transducer scans the borehole at a rate of 3 rotations per second (Zemanek and others, 1970). Applications of the BHTV in fracture detection are discussed in detail by Keys (1979) and Paillet and others (1985, 1990). The images produced by the BHTV system can be used to identify the strike, dip, and relative aperture of fractures intersecting the borehole (fig. 4; Paillet and Kapucu, 1987). However, the BHTV system characterizes fractures at the borehole-fracture intersection where the appearance of this fracture intersection has been affected by drilling. Because of its good spatial resolution and detailed depiction of fracture properties, the BHTV is used as the primary method for identifying the distribution of fractures along the well bore. Estimations of the relative hydraulic conductivity of individual fractures are based on apparent aperture and fracture strike and dip.
Heat-pulse Flowmeter
The heat-pulse flowmeter (HPFM) is a high-resolution flowmeter designed to measure vertical flows in well bores over the range from 0.01 to 5 gallons per minute (gal/min) (Hess, 1986). This device was designed and developed to provide a way to identify depth intervals where water enters boreholes during production tests of low-capacity aquifers. Flows are
10
Fractureintersecting
borehole
Low pointof
fracture ellipse
North
Televiewer
180 360<
.Dip = tan ..diameter
Strike = 0 ± 90°
Figure 4. Schematic diagram of a plane fracture intersecting a cylindrical borehole showing how the strike and dip of such a fracture are interpreted from the televiewer log.
11

measured by recording the time interval between the electrical generation of a small parcel of heated water in the measurement section of the tool and the arrival of that pulse at a thermistor located 0.8 in. above or below the heat source (fig. 5). The resolution is increased by forcing all flow to pass through the measurement section of the logging tool (Hess and Paillet, 1990). The resolution of the flowmeter is increased by using a downhole- inflated bladder to seal the annular region between the tool and the borehole wall. Vertical flow logs are generated by measuring flow at discrete depth points where the tool is held stationary and the bladder is inflated to fill the annulus. The inverse of measured pulse travel time is related to borehole flow in gallons per minute using calibration curves (fig. 6) generated in the U.S. Geological Survey Flow Calibration Laboratory (Hess and Paillet, 1990).
Hydraulic Fracture Stimulation Equipment
Although many different combinations of drill strings, packers, pumps, and tubing are used for hydraulic stimulatipfi in the water-well industry, the equipment used in this study consisted of a pair of packers suspended from a truck-mounted tower (fig. 7). The packers were separated by 17 ft of pipe and were inflated to a pressure of 1,800 pound per square inch (lb/in 2 ). The pressure line was mated to pipe sections as they were lowered into the borehole. The interval isolated by inflation of the packers was pressurized by a high capacity, high-pressure pump. The pressure and rate of flow into the isolated interval were controlled by the transmission and throttle. Pressure in the isolated interval was read from a gage mounted at the well head. The rate of injection was controlled by throttle and transmission settings on the power take-off from the truck engine, where rate of injection was given by the known relation between engine rotation rate and pump discharge for each transmission setting.
Depth intervals for packer setting were determined by the number of 17-ft-long pipe sections in the string suspended in the borehole. The exact depth setting below the top of casing could be controlled by suspending the uppermost section of pipe a given distance above the ground. Communication between the isolated interval and the open borehole below the lower packer was possible by opening a bypass valve in the bottom of the pipe during stimulation cycles. This valve permitted the treatment of the entire open borehole below the upper packer in the first stimulation cycle of the experiment. This allowed the stimulation to affect fractures that might be located below the depth capability of the available drill stem.
MODEL OF HYDRAULIC FRACTURE STIMULATION
Extensive literature about hydraulic fracture techniques exists in the petroleum and waste-disposal industries (Hubbert and Willis, 1957; Nolte and Economides, 1991). Most of this theory applies to deep, sedimentary formations where the technique results in the generation of new fractures in unfractured rocks, or in rocks where previously existing fractures have been completely sealed with mineralization. The orientation of such induced fractures can be related to the in-situ state of stress (Howard and Fast, 1970; Zoback and Haimson, 1982). However, the relatively shallow, fractured formations encountered by ground-water exploration boreholes in crystalline-rock terrains differ from those described in the petroleum and
12

FEET r-3.0
-2.0
-1.0
ELECTRONIC SECTION
BOWSPHING -CENTRALIZERS
__ FLOW SENSOR
ii
> <
o"" "T
;;
SIGNAL
CONOUIONH " ~N
CHART RECO«OER
o ( oo ( c
ELECTRONIC °° _) °° SECTION ' 1 '
FLOW LOG
a0z5oo
JfLCrtJA.iS
( \
\
UPPERTEMPERATURESENSOR^^^
HIGH VOLTAGE
9
/V
y/, < POWERy/, 1 PULS£i \±A y/ r°~1 v ciyy. POIVER v,ty STORAGE r>
^ pXA LOWER ~$
yy TEMPERATURE I.yy . SENSOR ? yfo FLOW SENSOR WITH \ '/ft INFLATED PACKER
^ VALVEi. s°*
/f
1 ^
2^y* \T\t
. $0.8 In
4fWf J"c' ?j 0 -81"
«c l -^ A/Vv j.
PMFLOW SENSCH
PACKER PUMP
\_y
Figure 5. Schematic diagram of the U.S. Geological Survey heat-pulseflowmeter, illustrating configuration of heat grid, thermistors, and downhole packer.
13


waste-disposal literature. Shallow bedrock formations usually are extensively fractured and weathered even where boreholes in such rocks are not very productive. Furthermore, near-surface ground water has low dissolved mineral content and vertical stress associated with the overburden is small, so fractures do not seal with mineralization (Trainer, 1987). In addition, packer spacings used in water-well stimulations tend to be greater than 10 ft or involve the entire open borehole below a single packer. For these reasons, hydraulic fracture stimulation is assumed to be applied to existing permeable fractures.
The generalized model of hydraulic stimulation used in this study is illustrated in figure 8A. This model represents a working hypothesis rather than a proven theory and is based on the assumption that the hydraulic stimulation affects fractures that are already present rather than creating entirely new fractures (Paillet and others, 1989). This hypothesis is based on the densely fractured nature of shallow bedrock, where it is unlikely that there will be large intervals (in this study, 17 ft) entirely free of fractures, in contrast with much deeper formations most often considered in hydraulic fracturing, where fracture density is much lower, and elevated temperature, pressure, and solute content of ground water are associated with the "healing" of fractures over time. The isolated interval is assumed to intersect one or more fractures. These fractures are assumed to connect with other, more permeable fractures at an unknown distance L from the borehole.
An increase in pressure in the isolated interval will enlarge one or more of the existing fractures so that water flows into the fracture network. The pressure transmitted from the isolated interval into the formation depends upon the largely unknown details of fracture intersections and connections within the surrounding rocks. The initial rate of flow into the formation will depend on the permeability of the fractures intersecting the isolated interval. It is assumed that the permeability of these fractures is low, because the borehole being treated is known to produce very little water when pumped. The working model used in this study assumes that the pressure gradients introduced in the fracture network surrounding the borehole will increase in proportion to the pressure within the isolated interval until those gradients become large enough to deform the rock mass. The deformation of the rock mass is assumed to "inflate" the fracture network, allowing a substantial increase in flow away from the borehole. One possible example of such deformation is indicated in figure 8A, where the hydraulic forces increase the aperture of a fracture segment (in Fig 8A), connecting the borehole with a larger fracture located a distance L from the borehole. The combination of deformation and movement of natural rock debris within the fracture network is assumed to cause a permanent increase in fracture-network permeability when the pressure in the isolated interval is eventually released after a period of constant flow from the isolated interval.
The working model of hydraulic fracture stimulation used in this study is somewhat different from that used in other hydraulic fracture studies, where the hydraulic-fracture technique is assumed to create or extend isolated fractures rather than deform an already existing network of interconnected fractures (Hubbert and Willis, 1957; Howard and Fast, 1970). However, the standard model for measured pressures is assumed to apply to
16

STIMULATION INTERVAL
FRACTURED ROCK MASS
OPEN FRACTURE
FLOW CONDUIT
CLOSED FRACTURE BEFORE INJECTION
B
3000
O
LLJCC <
O COCC LLJa.OzO Q.
2000
1000
BREAKDOWN PRESSURE
INJECTION PRESSURE
STOP INJECTION AND "SHUT IN"
PRESSURE RELEASE
40
Figure 8. Geomechanical model of hydraulic fracture stimulation: (A)Fracture geometry of a closed fracture connected to an open fracture at a distance, L, from the borehole, and (B) Expected or ideal pressure response during injection of water into this fracture.
17


Measurements where the data indicate a normalization correction factor greater than 4.0 are discarded, and measurement time and flow magnitude in the data set are recorded, which allows for weighting the differences in flow at adjacent depths made at nearly the same time much more heavily in the interpretation than similar differences associated with measurements made at very different times.
Hydraulic fracture stimulation was applied to the two Grand Portage boreholes using a pair of packers to isolate a depth interval of 17 ft. The packers were suspended on pipes that provided a conduit for flow into the isolated interval (fig. 9A). A separate tube was connected to the packers and taped to the pipe to inflate both packers simultaneously downhole (fig. 9B). The stimulation cycle consisted of inflating the packers to a pressure of 1,800 lb/in 2 and then injecting water under pressure into the pipe connected to the isolated interval. Valves and pump motor speed were adjusted to begin flow at a slow rate into the isolated interval at a specific time. Flow and power were quickly increased until a peak in pressure was attained, and then the flow was adjusted to a steady rate of about 60 gal/min. The time and magnitude of the pressure peak were recorded manually by referring to a pressure gauge in the line at the top of the pipe and a digital clock at the wellhead. Previous studies (Haimson and Zhao, 1991) indicate that breakdown pressure depends on rate of pressure application and flow rate. The contractor used the same procedure during each stimulation cycle so that different recorded breakdown pressures were assumed to reflect differences in rock properties. Injection flow was continued at 60 gal/min for about 16 min; line pressures were recorded at about 2-min intervals. When about 1,000 gal were injected, the injection was stopped, and the decline in pressure in the isolated interval recorded. After an additional 16 min, a valve in the injection line was released, and water was allowed to flow back from the isolated interval into the hydraulic-fracture reservoir. The total volume of returned flow was determined by the increased level in the reservoir.
In a few situations, events during the stimulation resulted in changes in the injection rate. These changes were caused by the generation of the flow from the top of casing by the injection (fig. 9C). This flow indicated that water was bypassing the packers through fractures short-circuiting the isolated interval and providing a connection with the borehole above the packer string. Such flow can cause material to fall into the borehole on top of the packer string. When such flow occurred, the injection rate was decreased until the bypass flow disappeared or was substantially decreased.
A single stimulation cycle was conducted at each depth setting. Stimulation began with the upper packer set at about 200 ft in depth, and a valve was opened to allow communication between the the isolated interval and the borehole below the lower packer. The first stimulation cycle effectively treated the entire open borehole below the upper packer. The second treatment was conducted at the same depth setting, and was restricted to the 17-ft interval between packers. Subsequent treatments were continued by moving the pair of packers 17 ft upwards and repeating the pressurization injection, shut-in, and fluid recovery steps. Because this study was intended to evaluate a standard commercial hydraulic stimulation, only two departures were made from standard procedures developed over years of practice by the contractor. The first of these departures was that the
20
Figu
re 9.
Photographs
of hydraulic
fracture-stimulation operations at the
Rese
rvat
ion
River
site:
(A)
General
view
of
eq
uipm
ent
at we
llhe
ad.
(B)
One
of the
pair
of packers
used
to is
olat
e an in
terv
al during
pack
ing.
(C
) Water
flow
ing
from
top
of casing in
dica
ting
th
at injected!
wate
r is by
pass
ing
the
upper
pack
er du
ring
in
ject
ion.


BOREHOLE RR
RESERVATION RIVER iBOREHOLE HRC
HOLLOW ROCK CREEK
10 20 30 TIME, IN MINUTES
40
TIME, IN MINUTES
EXPLANATION
a END OF INJECTION
b RELEASE OF PRESSURE IN ISOLATED INTERVAL
Figure 10. Records of injection line pressure during stimulation for (A)the 10 intervals stimulated in the Reservation River (RR) borehole, and (B) the 6 intervals stimulated in the Hollow Rock Creek (HRC) borehole.
24
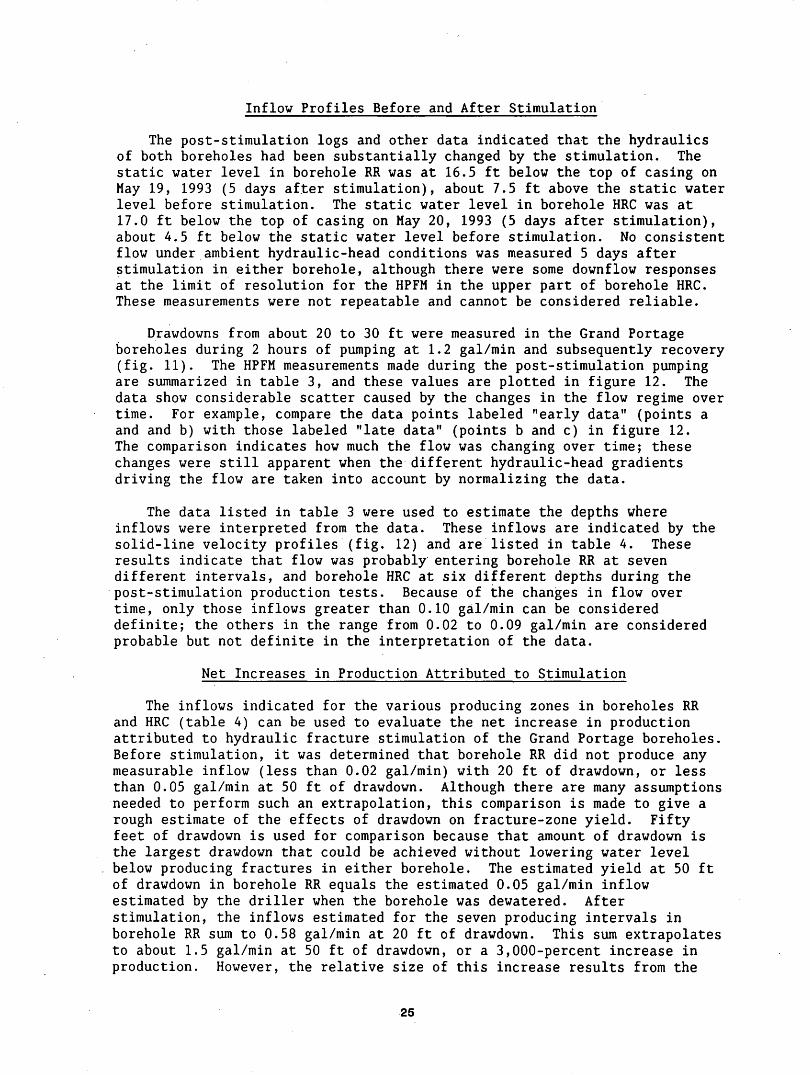
Inflow Profiles Before and After Stimulation
The post-stimulation logs and other data indicated that the hydraulics of both boreholes had been substantially changed by the stimulation. The static water level in borehole RR was at 16.5 ft below the top of casing on May 19, 1993 (5 days after stimulation), about 7.5 ft above the static water level before stimulation. The static water level in borehole HRC was at 17.0 ft below the top of casing on May 20, 1993 (5 days after stimulation), about 4.5 ft below the static water level before stimulation. No consistent flow under ambient hydraulic-head conditions was measured 5 days after stimulation in either borehole, although there were some downflow responses at the limit of resolution for the HPFM in the upper part of borehole HRC. These measurements were not repeatable and cannot be considered reliable.
Drawdowns from about 20 to 30 ft were measured in the Grand Portage boreholes during 2 hours of pumping at 1.2 gal/min and subsequently recovery (fig. 11). The HPFM measurements made during the post-stimulation pumping are summarized in table 3, and these values are plotted in figure 12. The data show considerable scatter caused by the changes in the flow regime over time. For example, compare the data points labeled "early data" (points a and and b) with those labeled "late data" (points b and c) in figure 12. The comparison indicates how much the flow was changing over time; these changes were still apparent when the different hydraulic-head gradients driving the flow are taken into account by normalizing the data.
The data listed in table 3 were used to estimate the depths where inflows were interpreted from the data. These inflows are indicated by the solid-line velocity profiles (fig. 12) and are listed in table 4. These results indicate that flow was probably entering borehole RR at seven different intervals, and borehole HRC at six different depths during the post-stimulation production tests. Because of the changes in flow over time, only those inflows greater than 0.10 gal/min can be considered definite; the others in the range from 0.02 to 0.09 gal/min are considered probable but not definite in the interpretation of the data.
Net Increases in Production Attributed to Stimulation
The inflows indicated for the various producing zones in boreholes RR and HRC (table 4) can be used to evaluate the net increase in production attributed to hydraulic fracture stimulation of the Grand Portage boreholes. Before stimulation, it was determined that borehole RR did not produce any measurable inflow (less than 0.02 gal/min) with 20 ft of drawdown, or less than 0.05 gal/min at 50 ft of drawdown. Although there are many assumptions needed to perform such an extrapolation, this comparison is made to give a rough estimate of the effects of drawdown on fracture-zone yield. Fifty feet of drawdown is used for comparison because that amount of drawdown is the largest drawdown that could be achieved without lowering water level below producing fractures in either borehole. The estimated yield at 50 ft of drawdown in borehole RR equals the estimated 0.05 gal/min inflow estimated by the driller when the borehole was dewatered. After stimulation, the inflows estimated for the seven producing intervals in borehole RR sum to 0.58 gal/min at 20 ft of drawdown. This sum extrapolates to about 1.5 gal/min at 50 ft of drawdown, or a 3,000-percent increase in production. However, the relative size of this increase results from the
25


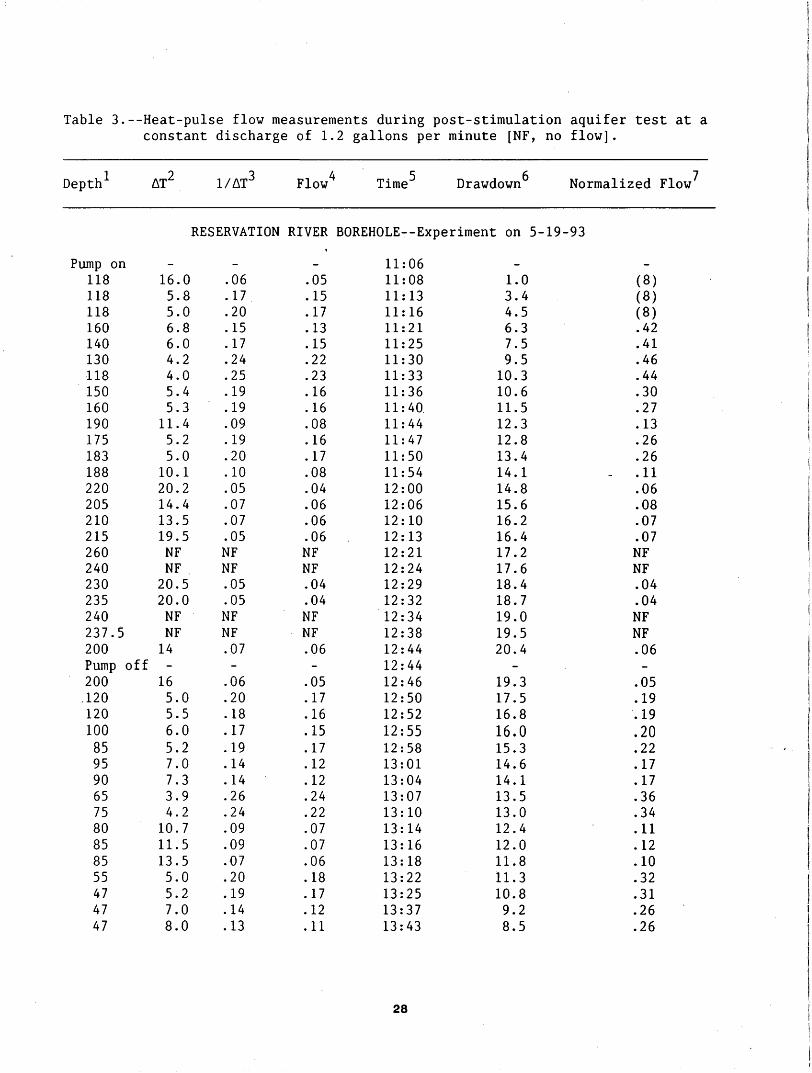
Table 3.--Heat-pulse flow measurements during post-stimulation aquifer test at a constant discharge of 1.2 gallons per minute [NF, no flow].
Depth AT2 I/ AT3 Flow4 Time5 Drawdown Normalized Flow7
RESERVATION RIVER BOREHOLE--Experiment on 5-19-93
Pump on118118118160140130118150160190175183188220205210215260240230235240237.5200Pump off200.120120100859590657580858555474747
-16.05.85.06.86.04.24.05.45.311.45.25.0
10.120.214.413.519.5NFNF20.520.0NFNF14-
165.05.56.05.27.07.33.94.2
10.711.513.55.05.27.08.0
-.06.17.20.15.17.24.25.19.19.09.19.20.10.05.07.07.05NFNF.05.05NFNF.07-
.06
.20
.18
.17
.19
.14
.14
.26
.24
.09
.09
.07
.20
.19
.14
.13
-.05.15.17.13.15.22.23.16.16.08.16.17.08.04.06.06.06NFNF.04.04NFNF.06-.05.17.16.15.17.12.12.24.22.07.07.06.18.17.12.11
11:0611:0811:1311:1611:2111:2511:3011:3311:3611:4011:4411:4711:5011:5412:0012:0612:1012:1312:2112:2412:2912:3212:3412:3812:4412:4412:4612:5012:5212:5512:5813:0113:0413:0713:1013:1413:1613:1813:2213:2513:3713:43
-1.03.44.56.37.59.510.310.611.512.312.813.414.114.815.616.216.417.217.618.418.719.019.520.4
-19.317.516.816.015.314.614.113.513.012.412.011.811.310.89.28.5
(8)(8)(8).42.41.46.44.30.27.13.26.26.11.06.08.07.07NFNF.04.04NFNF.06
.05
.19
.19
.20
.22
.17
.17
.36
.34
.11
.12
.10
.32
.31
.26
.26
28
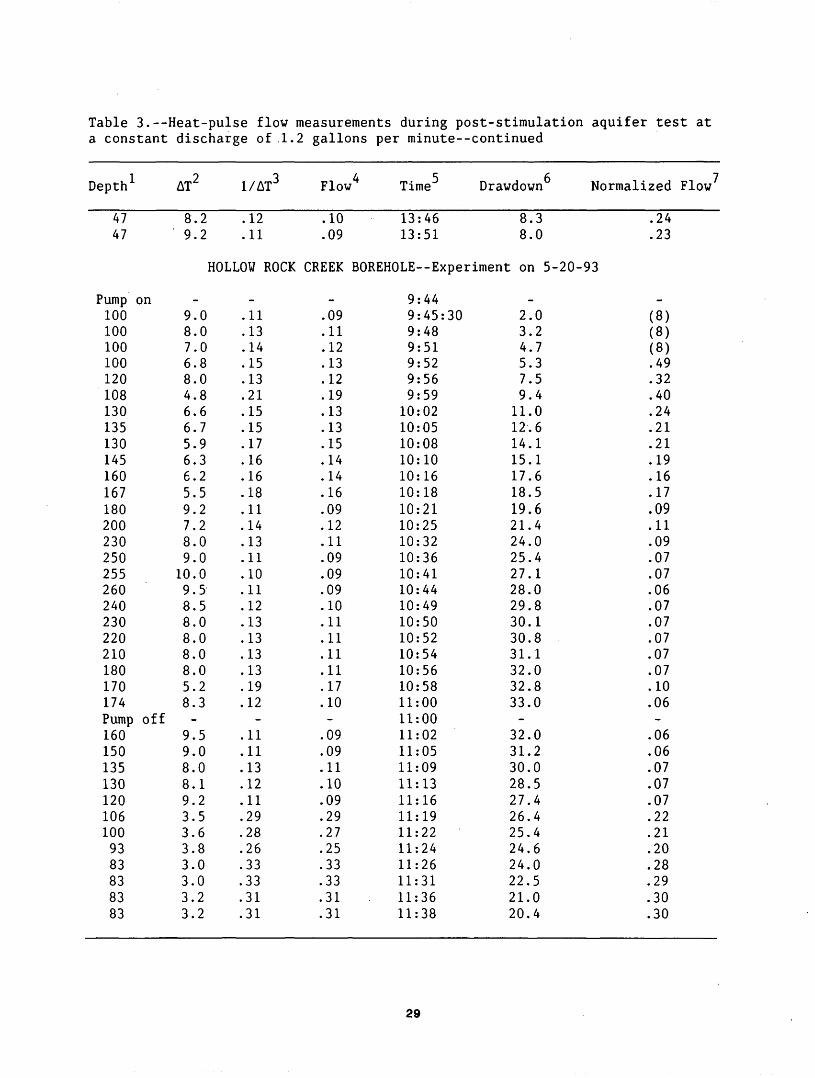
Table 3.--Heat-pulse flow measurements during post-stimulation aquifer test at a constant discharge of .1.2 gallons per minute continued
Depth 1
47 47
AT2
8.2 9.2
I/ AT3
.12
.11
Flow4
.10
.09
Time
13:46 13:51
Drawdown Normalized Flow
8.3 8.0
.24
.23
HOLLOW ROCK CREEK BOREHOLE Experiment on 5-20-93
Pump on100100100100120108130135130145160167180200230250255260240230220210180170174Pump off1601501351301201061009383838383
-9.08.07.06.88.04.86.66.75.96.36.25.59.27.28.09.010.09.58.58.08.08.08.05.28.3-
9.59.08.08.19.23.53.63.83.03.03.23.2
-.11.13.14.15.13.21.15.15.17.16.16.18.11.14.13.11.10.11.12.13.13.13.13.19.12
-.11.11.13.12.11.29.28.26.33.33.31.31
-.09.11.12.13.12.19.13.13.15.14.14.16.09.12.11.09.09.09.10.11.11.11.11.17.10-.09.09.11.10.09.29.27.25.33.33.31.31
9:449:45:309:489:519:529:569:59
10:0210:0510:0810:1010:1610:1810:2110:2510:3210:3610:4110:4410:4910:5010:5210:5410:5610:5811:0011:0011:0211:0511:0911:1311:1611:1911:2211:2411:2611:3111:3611:38
-2.03.24.75.37.59.411.012.614.115.117.618.519.621.424.025.427.128.029.830.130.831.132.032.833.0-
32.031.230.028.527.426.425.424.624.022.521.020.4
(8) (8) (8) .49 .32 .40 .24 .21 .21 .19 .16 .17 .09 .11 .09 .07 .07 .06 .07 .07 .07 .07 .07 .10 .06
.06
.06
.07
.07
.07
.22
.21
.20
.28
.29
.30
.30
29

Depth in feet (+ 0.5 feet) below top of casing..-Average of at least two pulse arrival times, in seconds ( + 0.3 second), .Inverse of average pulse arrival time in second -Upflow, in gallons per minute (+ 0.02 gallon per minute). ,Time of day at approximate midpoint of measurement. 7 Interpolated drawdown, in feet, at time of flow measurement.Normalized flow giving flow extrapolated to a downdrawn of 20 feet, in .gallons per minute.Flows not normalized because correction too large.
30

Table 4.--Summary of inflow zones in Grand Portage boreholes [<, less than].
Depth interval I
Pre-stimulationHydraulic fracture
intervalNormalized inflow
Percentage of total
Post-stimulation Normalized Percentage inflow of total
75-80 85-90 130-140 138-188 190-200 210-215 235-238
10974321
RESERVATION RIVER BOREHOLE
<0.02 <0.02 <0.02 <0.02 <0.02 <0.02 <0.02
(5) (5) (5) (5) (5) (5) (5)
HOLLOW ROCK CREEK BOREHOLE
0.20 .12 .05 .12 .02 .02 .05
34219
21339
85-90108-120130-135167-180235-240250-255Below 260
NS U
653111
0.10<0.02<0.02<0.02<0.02<0.02<0.02
100000000
.10
.06
.03
.14
.03
.03
.10
20126
2966
20
-Depth in feet below top of casing.-Denotes interval shown in figure 10.Inflows, in gallons per minute, normalized to a drawdown of 20 feet.No inflow detected during experiment; where limit of detection was about
,. 0.01 gallon per minute.Percentage could not be computed because total inflow was too small to
, measure.NS denotes not stimulated; This interval was not treated because of possible
borehole instability.
31

very small pre-stimulation production rather than an unusually large net increase.
Before stimulation, it was determined that borehole HRC produced 0.1 gal/min at about 20 ft of drawdown, or about 0.25 gal/min at 50 ft of drawdown. This production can be compared to the 0.5 gal/min reported by the driller. After stimulation, the inflows from the six different producing zones identified during flowmeter profiling (table 4) sum to 0.49 gal/min at 20 ft of drawdown, or about 1.2 gal/min at 50 ft of drawdown. This sum represents a 300-percent increase in production. More importantly, this increase in production comes mostly from depth intervals above 200 ft, whereas the fluid conductivity log indicates saline water (fluid conductivity of about 2 ohmmeters at 8 degrees Celsius, corresponding to a dissolved solids concentration of about 4,000 ppm) in the lower part of the borehole.
The comparison of net ground-water production from both Grand Portage boreholes before and after stimulation indicates a substantial increase associated with the hydraulic-fracture treatments. These increases seem large when expressed in the form of a percent increase only because the initial productivity of the two boreholes was very low. The stimulation has increased production so that both boreholes could produce enough water to supply a single household. Borehole RR could be completed as it now exists, whereas borehole HRC would have to be screened or partially plugged to exclude inflow from fractures below 200 ft in depth to prevent the inflow of saline water. However, the relatively large increases in production produced by the stimulation provide ground-water production from boreholes RR and HRC that is much less than the estimated 100 gal/min capacity of borehole MC.
Changes in Geophysical Logs Attributed to Stimulation
The HPFM profiles of flow in the two Grand Portage boreholes enable each of the increases in production produced by the stimulation treatments to be associated with a single fracture or set of fractures indicated on the BHTV log. Almost all of these fractures or sets of fractures appear as fractures that would be interpreted as permeable by an experienced log analysts, but they do not otherwise appear different from many other fractures that were unaffected by the stimulation and that were not producing water either before or after stimulation. The two largest fracture sets in borehole RR (one of which is illustrated in figure 13A) did not produce water before stimulation, and appear unchanged as a result of the stimulation. Those fractures affected by the stimulation do not show any significant changes in the BHTV logs (fig. 13B, 13C). There was only one instance where a very faint fracture on the pre-stimulation BHTV log was associated with a relatively large increase in production as a result of stimulation (fig. 13D). This fracture probably would not have been interpreted as an open fracture (Paillet and others, 1985; Paillet, 1991). This fracture also appears unchanged by the stimulation.
32

BEFORE STIMULATION
AFTER STIMULATION
SPALLING
NO FLOWSTIMULATED FROM THIS FRACTURE
N E S W N
95
I STIMULATED J INTERVAL
SPALLING
NESWN NESWN
Figure 13. Borehole televiewer logs obtained in four intervals before and after hydraulic stimulation in the Reservation River borehole.
33

135
BEFORE STIMULATION
240
245
AFTER STIMULATION
, .:. . > ' :
' ' ' * ' *'' "
I STIMULATED /INTERVAL
SPALLING
W N
[.STIMULATED J INTERVAL
SPALLING
W N W N
34

These results are consistent with the model of hydraulic fracture stimulation (fig. 8) where the stimulation increases the permeability of existing fracture networks rather than creating a new fracture. The individual fracture opened by the stimulation of an isolated interval is probably determined by the nature of the connections between that fracture and other fractures within the formation. These connections are not apparent on the BHTV log, so the physical properties that distinguish the limited number of fractures affected by the stimulation cannot be distinguished from the many others not affected by the stimulation on the basis of the geophysical-log data alone.
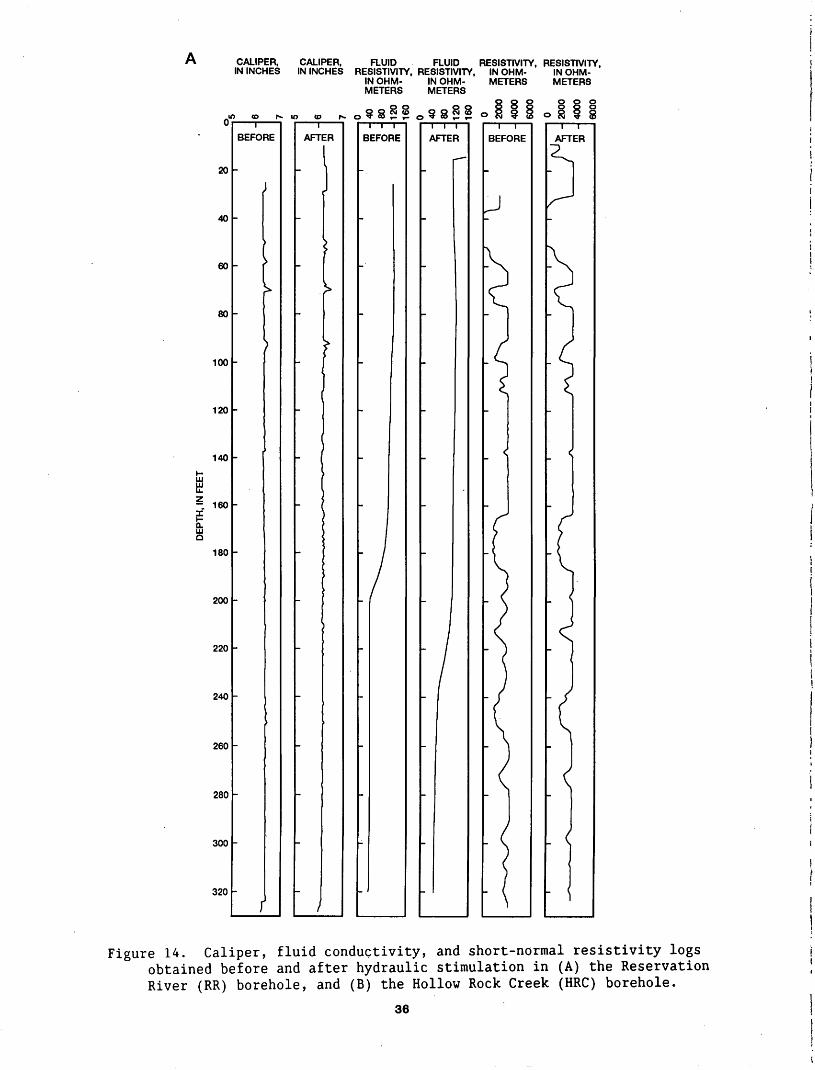
Although there are no specific changes unambiguously associated with the individual fractures and sets of fractures affected by the stimulation, differences between the geophysical logs obtained before and after stimulation can be recognized on the logs (fig. 14). These changes are of two types: (1) changes associated with spalling of the borehole wall under the stresses induced by the stimulation, and (2) changes associated with the permanent change in flow regime. The effects of borehole-wall spalling are apparent in the caliper logs, even though there are no changes in the natural gamma log and only a modest shift in one of the short-normal (16 in.) resistivity logs. The minor shift in the short-normal resistivity log after stimulation for borehole HRC is attributed to the effects of less saline borehole fluid associated with the increased influx of freshwater caused by the stimulation. The increased roughness of the borehole wall indicated by the caliper logs obtained before and after stimulation is apparently related to shallow spalling of the borehole wall. The spalling is not confined to the vicinity of the fracture zones affected by the stimulation, but it extends over large intervals in both boreholes. Comparison of the BHTV logs obtained before and after stimulation indicates that spalling is most common where several fractures intersect each other (fig. 13B, 13C), or at the acute angle where steeply dipping fractures intersect the borehole wall (fig. 13A, 13D).
Other changes in geophysical logs associated with the stimulation are attributed to the permanent change in flow regime. These changes are best illustrated by comparing the fluid conductivity logs obtained before stimulation with those obtained after stimulation (fig. 14). No flow was detected under ambient hydraulic-head conditions in borehole RR before stimulation, but the fluid conductivity log indicated some inflow or outflow of relatively fresh water at about 185 ft in depth, and possibly even more flow in the interval from 70 to 90 ft in depth (fig. 14A). Therefore, the logs indicate that post-stimulation producing zones at 180, 85, and 75 ft probably were capable of producing some inflow before stimulation. The post-stimulation-fluid conductivity log for borehole RR indicates that the fluid conductivity anomaly extends down to a depth of nearly 240 ft, which coincides with the deepest post-stimulation producing zone.
Even more pronounced changes are apparent when the post-stimulation fluid conductivity log for borehole HRC is compared with the pre-stimulation fluid conductivity log from the same borehole (fig. 14B). The pre-stimulation log indicates inflow of saline water near the bottom of the borehole, which mixes with somewhat less saline water inflowing at about 250 ft in depth and probably exits near the bottom of casing. After stimulation, the fluid conductivity log indicates inflow of relatively fresh
35
CALIPER, CALIPER, FLUID FLUID RESISTIVITY, RESISTIVITY, IN INCHES IN INCHES RESISTIVITY, RESISTIVITY, IN OHM- IN OHM-
INOHM- IN OHM- METERS METERSMETERS METERS
<o r>- « to 8 § §
BEFORE AFTER BEFORE AFTER BEFORE AFTER
20 -
40 -
60 -
80 -
100 -
120 -
140 -
-. 160
io
180 h
200 -
220 -
240 -
260 -
280 -
300 -
320 -
BEFO
;
RE
\
)
>
J*
AFT
I
ER
:r
BEFO
/
RE
Figure 14. Caliper, fluid conductivity, and short-normal resistivity logs obtained before and after hydraulic stimulation in (A) the Reservation River (RR) borehole, and (B) the Hollow Rock Creek (HRC) borehole.
36

B CALIPER, CALIPER, FLUID FLUID RESISTIVITY, RESISTIVITY, IN INCHES IN INCHES RESISTIVITY, RESISTIVITY, IN OHM- IN OHM-
IN OHM- IN OHM- METERS METERS METERS METERS
in co r~ co to co r-coocMrj-cocoocN'tcocooS^co o 8 ? 8
20
60
80
100
120
140
160
180
200
220
240
260
BEFORE AFTER BEFORE AFTER BEFORE AFTER
37

water at two depths where stimulation produced increases in inflow (240 and 170 ft). The fluid conductivity log indicates weak upflow of a mixture of saline and fresh water, probably exiting at the production zones near 115 and 90 ft in depth, and too slow to measure with the HPFM.
Relation Between Pressure Diagnostics and Production Increases
The theory of hydraulic fracture stimulation of bedrock aquifers indicates that such diagnostics as breakdown pressure and rate-of-pressure decline after the end of injection recorded during the stimulation might be related to the effectiveness of the stimulation treatment. For example, relatively low injection pressures or rapid pressure declines after the end of injection might indicate that the stimulation has produced a much improved hydraulic connection between the borehole and some distant fracture zone. Four diagnostics were selected as possible indicators of the effectiveness of stimulation: (1) breakdown pressure, (2) injection pressure, (3) rate of pressure decline after injection, and (4) volume of water returned after release of uphole pressure. Values of these four quantities were estimated from the pressure records obtained during the stimulation cycles (fig. 10) and are listed for each cycle in table 4. However, pressures cannot be compared directly for each interval because the stimulation cycles work against differing amounts of overburden stress, and returned volumes need to be related to the total volume of water injected. For this reason, breakdown and injection pressure values were normalized with respect to the overburden stress in the center of each isolated depth interval, and returned volumes were expressed as the percentage of total injected volumes. Pressure decline at the end of injection was expressed as the time required for pressure in the isolated interval to decline to about one-half of the pressure value at the end of injection.
The relation between four possible indicators or diagnostics for the effectiveness of stimulation and the production increases associated with each stimulation cycle are shown in figure 15. All four indicators were expected to be inversely correlated with fracture-zone production. Although the rate of pressure decline after injection ceases is expected to be directly correlated with the effectiveness of stimulation, the measure of pressure decline used here represents the inverse of that rate and is therefore inversely correlated with the effectiveness of stimulation. Both breakdown and injection pressures are indicators of the strength of the formation and represent the approximate magnitude of the geomechanical stress field that closes the fracture. The weaker these stresses, the more permeable the fracture after stimulation. The rate of pressure decline after injection, but before the pressure in the isolated interval is released, is related to the rate at which fluid can flow away from the pressurized fracture network. This rate of decline would correlate with the connectivity of the stimulated fracture with a larger scale fracture flow system if the surrounding unfractured rock is assumed to have negligible permeability. Finally, the amount of fluid that fails to flow back to the hydraulic fracture .reservoir after pressure is released would indicate how much fluid has been lost by flow into the formation. Therefore, the relative amount of fluid returned after injection would be approximately inversely correlated with the hydraulic conductivity of the stimulated fracture.
38

gia
(O (0 UJ CC Q.
'
I10
0
|
3 CC
(
^^ UJ N "*j
^ CC
1 1
1 1
> *
!" « 0
0
I£
o
1111
19
^UJ 5 o
*
Q°i
'
UJ<
/>
3s
5UJ CC Q-
< < <
n
i I
I I
0
» i0*0
0
0
I o
!
. 1
1 I
EX
PLA
NA
TIO
N
B
OR
EH
OLE
RR
DA
TA
O B
OR
EH
OLE
HR
C D
ATA
0.05
0.10
0.15
0.20
0.05
0.10
0.15
0.20
CO
(OB
111
D.U
CC
(0
( (0
'
UJ
CC
Q.
Z4
.0o 5 y
1
Z 82.0
D CC on
ill!
i 0
-
0
. L
o _
*
i i
i i
DU
Q UJ
CC
UJ s 0
40
CC
2U
Jg
(
^a
z-2
0(
g
<
UJ ^
<n<
I 1
1 I
-
_
H
O
_ O
)
O
0f
1 O
1
1 1
0.05
0.
10
0.15
0.
20
NO
RM
ALI
ZED
IN
CR
EA
SE
IN
PR
OD
UC
TIO
N,
IN G
ALL
ON
S P
ER
MIN
UT
E
0.05
0.
10
0.15
0.
20
NO
RM
AL
IZE
D I
NC
RE
AS
E I
N P
RO
DU
CTI
ON
, IN
GA
LLO
NS
PE
R M
INU
TE
Figu
re 15.
Resu
lts
of correlation
betw
een
hydraulic-fracture diagnostics
and
incr
ease
d pr
oduc
tion
of gr
ound
wa
ter
from fr
actu
res
after
stimulation:
(A)
Norm
aliz
ed br
eakd
own
pres
sure
. (B)
Norm
aliz
ed injection
pres
sure
. (C)
Pressure de
cline
time af
ter
the
end
of injection.
(D)
Percentage of
in
ject
ed
water
reco
vere
d.

Three of the four possible indicators of the effectiveness of stimulation in enhancing fracture conductivity seem weakly correlated with post-stimulation production from stimulated intervals, but there is so much scatter in the graphs that these correlations cannot be considered statistically significant (fig. 15). The three possible correlations show the expected inverse relation between the indicators (breakdown pressure, pressure decline, and percentage of returned fluid) and the effectiveness of stimulation. Given the known heterogeneity of fractured bedrock aquifers, many more data points than the 16 stimulation records available from the two Grand Portage boreholes would be needed to substantiate the proposed inverse relations.
One other possible indicator of the effectiveness of the hydraulic fracture stimulation of specific intervals is the degree to which the pressure changes during stimulation (fig. 10) resemble the ideal pressure function defined for the fracture stimulation model (fig. 8). Of the five intervals associated with increases in fracture-zone production greater than 0.1 gal/min (intervals 4, 9, and 10 in borehole RR and intervals 1 and 3 in borehole HRC), two (intervals 4 and 10 in borehole RR) appear very similar to the expected response, two (intervals 9 in borehole RR and interval 1 in borehole HRC) appear different from the expected response, and one (interval 3 in borehole HRC) shows a slight departure from the expected response. At the same time, other intervals, such as interval 8 in borehole RR, show significant departure from the expected shape but are not associated with a substantial increase in production. These results seem to indicate that some intervals conformed to the model of stimulation as the hydraulic enlargement of a single existing fracture, whereas others did not, and that no specific attribute of the pressures recorded during stimulation is closely correlated with increase in production.
Comparison of Results from Single Packer and Straddle Packer Stimulations
One of the most significant differences between the hydraulic fracture-stimulation procedures developed by various commercial well-service companies is the number of packers used during stimulation. A single packer is easier to use, but two packers give greater control over the treatment interval and enable more treatments to be run in a well. The effectiveness of the straddle-packer treatments can be compared to single-packer treatments by comparing the results in table 4 with those that probably would have been obtained using a single-packer treatment. This comparison can be made by assuming that a packer set near the bottom of casing will permit stimulation of the entire open borehole, which results in treatment of the fracture with the smallest breakdown pressure in table 2. Subsequent treatments will only affect this same fracture until the packer is set at a depth below that fracture. This interpretation of the results in figures 10 and 12 indicates that a single-packer stimulation program would be capable of affecting only some of the intervals affected by the straddle-packer treatment. This interpretation ignores the possible effects of multiple, repeated treatments at the same depth setting which are more likely to be performed using a single-packer stimulation program. The effects of the single-packer treatment are assumed to be the same as those produced by the straddle-packer stimulations on those fracture zones that could be affected by the single-packer treatment.
40
The pressure data given in figure 10 were used to infer which of the changes associated with stimulation (table 4) would have been achieved by a single-packer treatment. These results (table 5) indicate that the straddle-packer treatments were more effective in stimulating the boreholes than single-packer treatments because more zones were affected by the treatments. However, about one-half of the increase in production in each borehole would have been realized by the single-packer treatment because the single-packer treatments would have affected at least one of the intervals that produced relatively large increases in flow in each borehole (table 4). These results demonstrate the advantages of the straddle-packer stimulation approach, while demonstrating that the single-packer stimulation may be cost-effective in some situations. These conclusions need to be viewed with caution because they are based on a very limited sample of data from two boreholes. Given the heterogeneity of fractured bedrock aquifers, a much larger number of case studies will be needed to relate the potential benefits of straddle-packer stimulation procedures to the additional costs over single-packer stimulation procedures.
SUMMARY
Hydraulic-fracture stimulation procedures typical of those provided by contractors in the water-well industry were applied to two boreholes in crystalline rocks near Grand Portage, Minnesota. Tests made before and after stimulation indicated that boreholes RR and HRC would produce about 0.05 and 0.25 gal/min before stimulation, and about 1.5 and 1.2 gal/min after stimulation, respectively. These increases would be enough to obtain useful domestic water supplies from the two boreholes but would not furnish enough water for more than a single household from either borehole. High-resolution flow logs made during pumping after stimulation indicated that they greatly enhanced very small inflows from seven fractures or fracture zones in borehole RR and from four zones in borehole HRC. No changes in the geophysical logs were identified to indicate that the fractures in these producing zones had been affected by the stimulation in the immediate vicinity of the borehole. The results indicate that the stimulation has increased inflow to the two boreholes by improving the connectivity of favorably orientated fractures with larger scale flow zones in the surrounding rocks.
Some general differences between the geophysical well logs obtained before and after stimulation were detected. These differences were attributed to two causes: (1) local spalling of the borehole wall under the hydraulic stresses of the stimulation cycles; and (2) permanent changes in the natural circulation of ground water along the well bore induced by the circulation. The spalling is indicated by an increased roughness in the borehole wall inferred from the caliper log, and by the appearance of numerous chips missing from the intersection of fractures indicated on the BHTV log. The changes in ambient flow regimes were most evident on the fluid conductivity logs for boreholes RR and HRC, where shifts in fluid resistivity at certain depths indicate where enhanced inflow of freshwater under ambient hydraulic-head conditions has been produced by the stimulation.
41

Table 5.-- Estimated results from single-packer stimulation in Grand Portage boreholes Reservation River and Hollow Rock Creek [lb/in 2 , pound-force per square inch; gal/min, gallon per minute]
Packer setting (in feet)
Breakdown pressure, in lb/in 2
Injection pressure, in lb/in 2
Net increase in production, in gal/min
6688
105122139156173190207
108130150167185
RESERVATION RIVER BOREHOLE
530 350(1) 350
1,450 8501,500 600'
(1) 600(1) 600(1) 600
2,050 , 700(1) 700
HOLLOW ROCK CREEK BOREHOLE
1,000 6201,206 830
(1) 830(1) 830(1) 830
0.120.00
. 0.000.120.000.000.000.050.00
Total 0.29
0.060.160.000.000.00
Total 0.22
No breakdown pressure because previous cycle has already opened fracture,
42

Four possible diagnostic indicators of the effectiveness of stimulation were obtained from pressures recorded in the isolated interval during stimulation and other data: (1) breakdown pressure, the maximum pressure needed to start injection into the treatment interval; (2) injection pressure, the pressure in the isolated interval after injection of about 1,000 gal; (3) the rate of pressure decline in the isolated interval after ending the injection; and (4) the amount of water returned after the valve isolating the injection interval from the stimulation reservoir is released, Breakdown and injection pressures were normalized with respect to lithostatic pressure inferred from the weight of the overlying column of rock at the midpoint of each stimulation treatment interval. The rate of pressure decline was expressed as the time required for the pressure to decline to one-half of its value at the end of injection. The amount of water returned after injection was expressed as the percent of total injected water returned after injection. Comparison of these diagnostics with the increases in production produced by the stimulation for each interval indicate that three of the four diagnostics may be weakly correlated with production increases. These correlations are not statistically significant on the basis of the limited sampling of 16 treatment intervals in two boreholes, but these results indicate that significant correlations might be established from a larger data set.
43
REFERENCES CITED
Haimson, B.C., and Zhao, Zhongliang, 1991, Effect of borehole size andpressurization rate on hydraulic fracture breakdown pressure, in J.C.Rogiers, ed., Rock Mechanics as a Multidisciplinary Science:Rotterdam, Balkema, p. 191-199.
Hearst, J.R. and Nelson, P.H., 1985, Well logging for physical properties:New York, McGraw-Hill, 571 p.
Hess, A.E., 1986, Identifying hydraulically conductive fractures with aslow-velocity borehole flowmeter: Canadian Geotechnical Journal, v.23, p. 69-78.
Hess, A.E., and Paillet, F.L., 1990, Applications of the thermal-pulseflowmeter in the hydraulic characterization of fractured rocks:American Society for Testing and Materials, ASTM STP 1101, p. 99-112.
Howard, G.C. and Fast, C.R., 1970, Hydraulic fracturing: Dallas, Tex.,Millet the Printer, Monograph Volume 2, 203 p.
Hubbert M.K., and Willis, D.G., 1957, Mechanics of Hydraulic fracturing,American Institute of Mining, Metallurgical and Petroleum Engineers:AIME Transactions, v. 210, p. 153-166.
Keys, W.S., 1979, Borehole geophysics in igneous and metamorphic rocks, inSociety of Professional Well Log Analysts Annual Logging Symposium,20th, Tulsa, Okla., 1979, Transactions: Houston, Society ofProfessional Well Log Analysts, p. 001-0026.
- -1986, Analysis of geophysical logs of water wells with a microcomputer: Ground Water, v. 24, no. 3, p. 750-760.
-----1990, Borehole geophysics applied to ground-water investigations: U.S.Geological Survey Techniques of Water-Resources Investigations, book 2,chap. E2, 150 p.
Long, J.C.S., Remer, J.S., Wilson, C.R., and Witherspoon, P.A., 1982, Porousmedia equivalents for networks for discontinuous fractures: WaterResources Research, v. 18, p. 645-658.
Nolte, K.G., and Economides, M.J., 1991, Fracturing diagnosis using pressureanalysis, in Reservoir Stimulation: New York, Prentice Hall, p. 7-1 to7-34.
Paillet, F.L., 1991, Use of geophysical well-logs in evaluating crystallinerocks for siting of radioactive waste repositories: The Log Analyst,v. 32, no. 2, p. 85-107.
-----1992, Applications of borehole geophysics in the characterization of flow in fractured rocks: Trends in Geophysics Research, vol. 1, p. 127-153.
-----1993, Using borehole geophysics and cross-borehole flow testing to define hydraulic connections between fracture zones in bedrock aquifers: Journal of Applied Physics, v. 30, no. 3, p. 261-279.
Paillet, F.L., and Duncanson, Russell, 1994, Comparison of drilling reports and detailed geophysical analysis of ground-water production in bedrock wells: Ground Water Journal, v. 32, no. 2, p. 200-206.
Paillet, F.L., and others, eds., 1990, SPWLA Reprint Series BoreholeImaging: Houston, Society of Professional Well Log Analysts, 472 p.
Paillet, F.L., Hess, A.E., Cheng, C.H., and Hardin, E.L., 1987,Characterization of fracture permeability with high-resolution vertical flow measurements during borehole pumping: Ground Water, v. 25, no. 1, p. 28-40.
44
Paillet, F.L., and Kapucu, Kemal, 1989, Characterization of fracturepermeability and fracture flow modeling at Mirror Lake, New Hampshire:U.S. Geological Survey Water-Resources Investigations Report 89-4058,49 p.
Paillet, F.L., Keys, W.S., and Hess, A.E., 1985, Effects of lithologyon televiewer-log quality and fracture interpretation: Society ofProfessional Well Log Analyst Annual Logging Symposium, 26th,Dallas, Tex., 1985, Transactions, p. JJJ1-JJJ30.
Paillet, F.L., Waltz, James, and Boyle, R.E., 1989, Geophysical loginvestigation of formation changes produced by hydraulic fracturestimulation in a crystalline-bedrock aquifer: Symposium on BoreholeGeophysics for Mineral Geotechnical, and Groundwater Applications, 3rd,Las Vegas, Nev., 1989, Proceedings, p. EE571-EE594.
Sims, P.K., and Morey, G.B., 1972, Geology of Minnesota a Centennialvolume: Minnesota Geological Survey, Minneapolis, 632 p.
Teasdale, W.E., and Pemberton, R.R., 1984, Wireline-rotary air coring of theBandelier tuff, Los Alamos, New Mexico: U.S. Geological SurveyWater-Resources Investigations Report 84-4176, 9 p.
Trainer, F.W., 1987, Hydrogeology of the plutonic and metamorphic rocks, inBack W., Rosenshein, J.S., and Seaber, P.R., eds., Hydrology:Geological Society of America, v. Q-2, p. 367-380.
Vernon, J.H., Paillet, F.L., Pedler, W.H., and Griswold, W.J., 1993,Application of borehole geophysics in defining the wellhead protectionarea for a fractured crystalline bedrock aquifer: The Log Analyst, v.35, no. 1, p. 41-57.
Zemanek, Joseph, Glenn, E.E., Norton, L.J., and Caldwell, R.L., 1970,Formation evaluation by inspection with the borehole televiewer:Geophysics, v. 35, p. 254-269.
Zoback, M.D., and Haimson, B.C., 1982, Status of hydraulic fracturing methodfor in situ stress measurement: Proceedings, 23rd, U.S. Rock MechanicsSymposium, Berkeley, Calif., p. 143-156.
45 Cr U.S. GOVERNMENT PRINTING OFFICE: 1994 - 573-191 / 80040 REGION NO.8

Paillet and Olson.-A
NA
LY
SIS OF TH
E RESU
LTS OF H
YD
RA
ULIC
-FRA
CTU
RE STIM
ULA
TION
OF TW
O C
RY
STALLIN
E BED
RO
CK
BO
REH
OLES,
USG
S/WR
IR 94-404-?
GR
AN
D PO
RTA
GE, M
INN
ESOTA
\