Analysis of the President's Budget for 2002: Accounting ... · financing program. The national...
38
For comments, suggestions or further inquiries please contact: Philippine Institute for Development Studies Surian sa mga Pag-aaral Pangkaunlaran ng Pilipinas The PIDS Discussion Paper Series constitutes studies that are preliminary and subject to further revisions. They are be- ing circulated in a limited number of cop- ies only for purposes of soliciting com- ments and suggestions for further refine- ments. The studies under the Series are unedited and unreviewed. The views and opinions expressed are those of the author(s) and do not neces- sarily reflect those of the Institute. Not for quotation without permission from the author(s) and the Institute. November 2001 The Research Information Staff, Philippine Institute for Development Studies 3rd Floor, NEDA sa Makati Building, 106 Amorsolo Street, Legaspi Village, Makati City, Philippines Tel Nos: 8924059 and 8935705; Fax No: 8939589; E-mail: [email protected] Or visit our website at http://www.pids.gov.ph DISCUSSION PAPER SERIES NO. 2001-19 (Revised) Analysis of the President's Budget for 2002: Accounting for New Modes of Financing the Fiscal Deficit Rosario G. Manasan
Transcript of Analysis of the President's Budget for 2002: Accounting ... · financing program. The national...

For comments, suggestions or further inquiries please contact:
Philippine Institute for Development StudiesSurian sa mga Pag-aaral Pangkaunlaran ng Pilipinas
The PIDS Discussion Paper Seriesconstitutes studies that are preliminary andsubject to further revisions. They are be-ing circulated in a limited number of cop-ies only for purposes of soliciting com-ments and suggestions for further refine-ments. The studies under the Series areunedited and unreviewed.
The views and opinions expressedare those of the author(s) and do not neces-sarily reflect those of the Institute.
Not for quotation without permissionfrom the author(s) and the Institute.
November 2001
The Research Information Staff, Philippine Institute for Development Studies3rd Floor, NEDA sa Makati Building, 106 Amorsolo Street, Legaspi Village, Makati City, PhilippinesTel Nos: 8924059 and 8935705; Fax No: 8939589; E-mail: [email protected]
Or visit our website at http://www.pids.gov.ph
DISCUSSION PAPER SERIES NO. 2001-19 (Revised)
Analysis of the President's Budgetfor 2002: Accounting for New Modes
of Financing the Fiscal DeficitRosario G. Manasan

ANALYSIS OF THEANALYSIS OF THE PRESIDENT’S BUDGET FOR 2002:PRESIDENT’S BUDGET FOR 2002: ACCOUNTING FOR NEW MODESACCOUNTING FOR NEW MODES
OF FINANCING THE FISCAL DEFICITOF FINANCING THE FISCAL DEFICIT
Rosario G. Manasan
November 2001

Table of Contents
Page ABSTRACT
1. INTRODUCTION 1 2. OVERALL FISCAL POSITION IN PERSPECTIVE 1 3. REVENUE PROGRAM 8 4. EXPENDITURE PROGRAM 15 5. FINANCING 21 6. SUMMARY AND CONCLUSION 27 REFERENCES 29
List of Tables Table 1 National Government Fiscal Position (in billion pesos) 4 Table 2 Sustainable Primary Deficit, 1995-2002 8 Table 3 Ratio of Excise Tax to GVA 10 Table 4 Components of Personal Income and Individual Income Tax (in %) 11 Table 5 Share of Various Sectors to Net Budget Increment in 2002 17 Table 6 Real Per Capita National Government Expenditures on Social 20 Services, 1975-2002 (in 1985 pesos) Table 7 Distribution of Education Budget by Level 21 Table 8 Distribution of DOH Budget by Function 21 Table 9 Percent Distribution of National Government Borrowings, (%) 22 Table 10 Reconciliation Between Obligation Expenditures and Cash 23 Disbursements, 1991-1993 Table 11 Reconciliation of the Expenditure Program with the Cash Program 24 (in million pesos)

List of Figures
Figure 1 Fiscal Aggregates (cash basis), 1990-2002 (% of GNP) 2 Figure 2 Evolution of National Government Revenues, 1990-2000, (% of GNP) 2 (percent of GNP) Figure 3 National Government Expenditures (cash basis) 1990-2000, (% of GNP) 3 Figure 4 Overall Tax Effort 9 Figure 5 Tax-to-GNP Ratio, Selected Taxes, 1990-2000 9 Figure 6 Income Tax Effort 10 Figure 7 Corporate Income Tax Effort 11 Figure 8 Income Tax on Wages and Non-Wages (% to GNP) 12 Figure 9 VAT Effort and Effective VAT Rate 12 Figure 10 Aggregate National Government Expenditures (Obligation 16 Basis), 1990-2002 Figure 11 Share of Major Expenditure Items in the Budget Increment for 2002 16 Figure 12 Distribution of National Government Expenditures Net of Debt 18 Service and IRA, by Sector Figure 13 National Government Expenditures, by Sector (%to GNP) 18

1
ANALYSIS OF THE PRESIDENT’S BUDGET FOR 2002: ACCOUNTING FOR NEW MODES OF FINANCING THE FISCAL DEFICIT
Rosario G. Manasan
1. INTRODUCTION
The purpose of this short note is to evaluate the President’s Budget (PB) for 2002. The assessment is composed of four parts: (i) an evaluation of the overall fiscal picture as projected in the President’s Budget; (ii) an examination of its revenue program; (iii) an appraisal of the expenditure program; and (4) an analysis of the financing program.
The national government’s fiscal position in any given year (by showing
whether the government has a surplus or a deficit) provides shorthand information on the fiscal health of the nation. Given this perspective, Section 2 evaluates the likelihood that the estimate of the fiscal deficit that is targeted in the President’s Budget will be met. At the same time, it also assesses if the projected fiscal position will lead to greater fiscal instability.
The fiscal outlook for 2001 and 2002 reveal the need to address the
weaknesses in the revenue performance of the national government. Thus, Section 3 starts with an analysis of the decline in the tax effort in 1997-2000 and segues to recommend possible policy changes that may arrest this alarming development. In addition, this section also evaluates the suitability of the proposed shift to gross income taxation in the context of the government’s fiscal bind.
On the other hand, Section 4 assesses the Arroyo administration’s expenditure
priorities relative to its policy pronouncements and relative to the overarching imperative for economic growth and poverty alleviation. Finally, Section 5 discusses the issues that emerge from the use of innovative and creative modes of financing the fiscal deficit and the expenditure requirements of the national government. Because these new approaches have rendered the orthodox way of measuring the fiscal deficit less meaningful, their evolution have highlighted the need for greater transparency in the fiscal accounts. 2. OVERALL FISCAL POSITION IN PERSPECTIVE
This section reviews the developments in the overall fiscal position of the national government in order to situate and to provide the context against which to assess the overall fiscal program in 2001 and 2002. Combining expenditure cuts with improvements in revenue generation, the national government successfully reined in its deficit of 3.4% of GNP in 1990 to post a surplus of 0.9% of GNP in 1994 (Figure 1). On the one hand, the national government’s tax effort rose from 14.2% of GNP in 1990 to 15.6% in 1994 even as its divestment program boosted its non-tax revenue from 2.7% to 3.7% of GNP (Figure 2). On the other hand, the national government kept subsidies and interest payments in check (reducing allocation for said items from

2
1.2% and 6.6% of GNP, respectively, in 1990 to 0.4% and 4.6% in 1994) while cutting back its capital outlays from 3.1% to 2.4% of GNP (Figure 3).
Figure 1. Fiscal Aggregates (cash basis), 1990-2002(percent of GNP)
(10)
(5)
-
5
10
15
20
25
1990 1991 1992 1993 1994 1995 1996 1997 1998 1999 2000 2001 2002
Year
Total Revenues Total Disbursements Fiscal Deficit
The national government was able to keep its bottom line in the black in
1995-1997 despite the slump in privatization proceeds largely because of the contraction in interest payments and the continuing retrenchment of capital spending. At the same time, it also helped that the national government was able to sustain its tax effort during this period.
However, the Asian financial crisis exacted a heavy toll on the tax revenue
performance of the national government. The fiscal position of the national government quickly deteriorated into a deficit of 1.8% of GNP in 1998 despite the deep cuts in maintenance and other operating expenditures (MOOE) as tax revenues plummeted to 14.9% of GNP from 16.3% of GNP in 1997. Moreover, the continuous slide in the tax effort in 1999-2000 led the fiscal deficit to surge to 3.6% of GNP in
Figure 2. Evolution of National Government Revenues, 1990-2000 (percent of GNP)
0
5
10
15
20
25
1990 1991 1992 1993 1994 1995 1996 1997 1998 1999 2000
Year
Per
cen
t
BIR BOC Others Privatization

3
1999 and 3.8% of GNP in 2000 in spite of the economic turnaround in those years. The causes of this development are discussed in greater detail in Section 3.
Figure 3. National Government Expenditure (cash basis) 1990-2000 (Percent of GNP)
0
5
10
15
20
25
1990 1991 1992 1993 1994 1995 1996 1997 1998 1999 2000
Year
Interest Payments Personnel Services Transfer to LGUs
MOOE Capital Outlays
Emerging Fiscal Picture in 2001. The national government hopes to trim the fiscal deficit, albeit marginally, to just below 3.8% of GNP in 2001 (Table 1). Available data as of the end of September 2001 indicate that the national government will find it difficult to achieve said target.
This arises as actual collections are expected once again to fall short of the adjusted 2001 revenue targets. In particular, the author projects that tax revenues will be P10.9 billion short of the officially designated goal. Of this amount, P5.1 billion is attributable to the Bureau of Customs (BOC), P3.9 billion to the Bureau of Internal Revenue (BIR) and P1.9 billion to other offices. Meanwhile, privatization proceeds and fees/charges are projected to fall short of their respective goals by P8 billion and P2.2 billion but the income of the Bureau of Treasury (BTr) is projected to exceed its target by some P13.1 billion. Consequently, the fiscal deficit is likely to reach P153 billion (or 4.0% of GNP) in 2001 unless the national government imposes further reductions on its already emaciated expenditure program. Note that the proposed cash expenditure program net of interest payments and transfers to LGUs amounts to only 10.4% of GNP in 2001, well below the 11.7% level that was registered in 2000 and the 11.9% average that was posted in 1992-2000.
Fiscal Outlook for 2002. The proposed President’s Budget estimates the fiscal
deficit of the national government at P130 billion (or 3.1% of GNP) in 2002 (Table 1). At this point, this target appears to be inconsistent with recent developments in the macroeconomic environment. In addition, it is also out of sync with the revealed capacity of the fiscal system to generate revenues.
On the one hand, the President’s Budget assumes that GNP will grow by a
minimum of 4.6% in real terms in 2002 while inflation is pegged at 5%. It also assumes that the foreign exchange rate will range from P50-P51 per dollar during the year. Recent developments, particularly the deteriorating global economic outlook following the September 11 terrorist attack in the US, indicate that these assumptions

4
paint a much rosier picture than is warranted. Specifically, many analysts have scaled down their forecasts of real GDP and GNP growth rate to 3.5% and 3.9%, respectively (IMF, ADB, Yap among others). Moreover, the foreign exchange rate is expected to settle at P52 per dollar on the average in 2002.
Table 1. National Government Fiscal Position (in billion pesos)
Author's Author's BESF Author's BESF Projections Differenceb/ Projections Differenceb/ Particulars Program Projections Differenceb/ Program (high rev.) (high rev.) (low rev.) (low rev.) 2001 2001 a/ 2001 2002 2002 2002 2002 2002 Revenues 558.2 550.2 8.0 624.3 600.2 24.1 586.2 38.1 Tax Revenues 498.9 488.0 10.9 571.3 533.8 37.5 520.2 51.1 BIR 388.1 383.0 5.1 447.6 418.6 28.9 408.1 39.4 BOC 105.1 101.2 3.9 115.1 110.4 4.7 107.5 7.7 Other Offices 5.7 3.8 1.9 8.6 4.8 3.8 4.6 4.0 Non-Tax Revenues 59.3 62.2 -2.9 53.0 66.4 -13.4 66.0 -12.9 Fees and Charges 23.2 21.0 2.2 25.6 23.9 1.7 23.4 2.1 BTr Income 24.9 38.0 -13.1 22.2 37.3 -15.1 37.3 -15.1 Privatization 10.0 2.0 8.0 5.0 5.0 - 5.0 - Others 1.2 1.2 - 0.3 0.3 - 0.3 - Disbursements 703.2 703.2 0.0 754.3 757.5 -3.2 758.4 -4.1 Current Operating Expenditure 626.4 626.4 - 673.8 677.0 -3.2 677.9 -4.1 Personal Services 234.6 234.6 - 251.3 251.3 - 251.3 - MOOE 79.6 79.6 - 80.8 80.8 - 80.8 - Subsidy 6.5 6.5 - 5.0 5.0 - 5.0 - Allotments to LGUs 124.1 124.1 - 132.5 132.5 - 132.5 - Interest Payments 181.6 181.6 - 204.3 207.5 -3.2 208.3 -4.1 Tax Expenditures - - - - - - Capital Outlays 76.825 76.825 - 80.5 80.5 - 80.5 - Infra/Other Capital Outlays 66.961 66.961 - 67.8 67.8 - 67.8 - Equity 0.861 0.861 - 0.9 0.9 - 0.9 - CARP 1.980 1.980 - 5.6 5.6 - 5.6 - Net Lending 7.023 7.023 - 6.1 6.1 - 6.1 - SURPLUS/(Deficit) -145.0 -153.0 8.0 -130.0 -157.3 27.3 -172.2 42.2 (Percent to GNP) (3.8) (4.0) 0.2 (3.1) (3.8) 0.7 (4.1) 1.0 a/ Based on actual data for Jan-Sept 2001 b/ Difference = target in Budget of Expenditures and Sources of Financing (BESF) less author's projections.
On the other hand, a closer scrutiny of the relationship between tax revenues
and GNP in recent years suggests that the tax elasticities1 used to arrive at the revenue goals for 2002 are unrealistic. Thus, the revenue goals in the President’s Budget tend to overestimate the amount of revenues that are forthcoming not only because they are based on optimistic GDP/GNP growth projections but also because they appear to assume that tax revenues are more elastic with respect to GNP than what more recent data indicate. In particular, it is apparent that the tax elasticities assumed in the President’s Budget do not take into account the well-defined downward trend in tax revenues when measured relative to GNP in 1997-2000 even after the economy has shown signs of recovering from the Asian financial crisis (Box 1). In addition, the revenue goals in the President’s Budget include estimates of the projected revenue 1 Tax elasticity is defined as the ratio of the proportional rate of increase in tax revenues to the proportional rate of increase in the tax base (usually proxied by GDP or GNP in the aggregative analysis).

5
gains from a number of tax measures that would still require legislation.2 Past experience indicates that Congress rarely acts on the proposed tax legislation in a timely fashion. Moreover, there are many instances where Congress passes an alternative version whose revenue impact is less than what the executive branch expected. Thus, this move may be seen as a reversal of the more prudent tack that fiscals managers decided to take in 2000 when they did not include the revenue gains from new tax legislation in setting the revenue goals for the President’s Budget.
Box 1
Delinking Revenue Forecasts for Public Expenditure Management and Revenue Forecasts for Measuring Performance of the Tax Collection
Agencies
Collections from all major tax groups fell relative to GNP in 1997-2000. (Refer to Section 3.) While the erosion of the tax effort may partly be traced to a deterioration in tax administration (e.g., VAT administration post-EVAT law and excise tax administration in 2000), the changes in tax structure introduced under the 1997/1998 round of tax reform undoubtedly also contributed to this worrisome trend. From the perspective of public expenditure management, it is clear that the tax elasticities used in projecting tax revenues for public expenditure management should reflect the observed decline in tax effort. To do otherwise would inevitably weaken the link between planning and budgeting as they create the mis-impression during the budget preparation phase that more resources are available than are likely to be realized, thus, postponing the need to make hard choices to the budget execution phase (Schiavo-Campo and Tommasi 1999). Consequently, during budget execution they necessitate across-the-board expenditure cuts, the imposition of reserves and the impoundment of appropriation which in turn all tend to politicize the prioritization process as different stakeholders jockey for favors in the release of spending authorization and/or cash allocation. As such, the amount of resources available to the various departments/agencies becomes unpredictable. At the same time, the tedious process of fine-tuning spending levels for each and every agency every time adjustments are made on the revenue targets detracts budget authorities from their more important function (Manasan 2001). A moral hazard problem becomes evident in this approach when the tax revenue forecasts in the President’s Budget are also used as the yardstick against which to gauge the performance of the tax collection agencies, as is the current practice in the Philippines. Thus, the DOF argues correctly that the more realistic revenue projections that are needed for prudent public expenditure management would tend to perpetuate the existing inefficiencies in tax administration.3 Given this background, there is a need for government to delink the revenue forecasts developed for public expenditure management from those developed for evaluating the performance of the BIR and the BOC. The former should provide accurate estimates of the amount of revenues that are likely to be forthcoming taking as given the current structure of the tax system and the prevailing weaknesses in tax collection. On the other hand, the latter has to take into account what can potentially be collected but with some allowance made for what can realistically be collected gathered given the technical and infrastructure support that is available in the BIR and the BOC.
2 Specifically, the President’s Budget assume that the government will get an additional P5 billion in revenues from the indexation of excise taxes on cigarettes and fermented liquor and P4.5 billion from the introduction of the modified gross income taxation. 3 This point was raised by Assistant Secretary Gil Beltran of the Department of Finance.
6
Given this background, BIR tax revenues are projected to range from a high of P418.6 billion to a low of P408.1 billion while BOC revenues are forecasted to vary between P107.5 billion and P110.4 billion (Table 1). The high revenue projections assume that the BIR/BOC tax effort actually realized in 2001 will be sustained in 2002 while the low revenue projections assume that BIR/BOC tax effort will decline by 0.25% and 0.1% of GNP, respectively. It should be emphasized that BIR revenues are expected to fall short of the official revenue goals for 2002 even if one does not include the revenue gains that are expected from the proposed tax legislation in the President’s Budget.
On the other hand, BTr income is projected to exceed its BESF goal in 2002
by P15.1 billion (to reach P37.3 billion) while fees and charges are expected to fall short of the target by P1.7 billion to P2.1 billion. At the same time, interest payments are expected to surpass their target level by P3.2 billion to P4.1 billion because of additional borrowings that will be necessitated by the revenue shortfalls and the higher peso-dollar exchange rate.
All of these developments combined are then expected to result in a fiscal
deficit of P157.3 billion – P172.2 billion (P27 billion - P42 billion higher than the target). Consequently, the fiscal deficit is expected to range between 3.8% and 4.1% of GNP in 2002 compared with the government’s projections.
However, two factors that might have a significant impact on the fiscal deficit
have not been taken into account in the discussion above. One, the national government stands to earn $125 million per year from 2002 to 2007 and $350 yearly from 2008 to 2021 from the Malampaya natural gas project. If this income stream is actually realized starting next year, then the coffers of the national government will have an additional inflow of P6.5 billion in 2002 with a corresponding adjustment in the fiscal deficit.4 Second, a comparison of the cash expenditure program with the obligation program suggests that the fiscal deficit is likely to be even larger than what is being projected officially with the difference being financed by arrearages. Specifically, the obligation program is higher than the cash program by some P25 billion. Even if one assumes that some of the current year’s obligations do not become due and demandable within the year, the difference between expenditures in the cash program and that in the obligation program is typically no bigger than 1.5% of the obligation program.5 This implies that the cash program for 2002 underestimates the obligation program by at least P18 billion even before one adjusts for the fact that the national government has promised to retire some P60 billion in accounts payable in 2002.6 Taken together then, these two opposing movements will add an additional P8.2 billion to the projected fiscal deficit for 2002.
4 This Department of Finance, however, did not impute this figure in the projected government revenue for 2002 because of the possibility that these revenues might be eroded by the performance guarantees provided to the contractor. 5 This ratio is true for the period prior to the 1990s. In 1990-1998, the ratio of the difference between the obligation and the cash program to the obligation program is higher but the author chose not to use the higher ratio precisely because of said period is associated with the accumulation of accounts payables. 6Section 5 provides a sketch of the build-up of the national government’s accounts payable.

7
Fiscal sustainability. Fiscal deficits per se are not bad. However, persistently large fiscal deficits may lead to fiscal instability. This is so because as government debt accumulates over time, interest payments on the debt may increase as the government pays interest not only on debt that it had in the past but also on the new debt that was issued to cover the deficit of the current year. This development results in even larger fiscal deficits and even higher levels of government debt stock, thus leading to an explosive situation where fiscal deficit feeds on itself.
In this subsection, the sustainability of the fiscal policy is evaluated in terms of
its ability to stabilize the ratio of government debt to GDP.7 In essence, government’s fiscal stance is said to be sustainable if its debt-servicing requirement does not exceed its primary surplus.8
Anand and van Wijbergen (1989) and Catsambas and Pigato (1989) establish
that the change in the debt-to-GDP ratio depends on the interrelationship amongst the GDP growth rate, the domestic real interest rate, the rate of inflation, the foreign interest rate, the exchange rate, the stock of domestic and foreign government debt at the start of the period, and the primary deficit.9 Said relationship suggests that the higher the domestic real interest rate and the lower the GDP growth rate, the more likely is the rise in the debt-to-GDP ratio. Similarly, the higher the foreign interest rate, the higher the depreciation of the exchange rate and the lower the domestic inflation rate, the greater is the tendency of the debt-to-GDP ratio to increase.
7 It is useful to look at the debt-to-GDP ratio rather than at the absolute level of debt because GDP is indicative of the government’s ability to pay for its debt. 8 The primary surplus is equal to government revenues less non-interest outlays. Alternatively, it is equal to the total surplus plus interest payments. 9 Specifically, they derive the following expression for the sustainable primary deficit (sus pdef):
sus pdef = - (r – g) b - ( i* + ∆ (E) / E - π −g ) b* (1)
where g is the growth rate of real GDP; r is the real domestic interest rate; b is the ratio of national government domestic debt to GDP; b* is the ratio of national government foreign debt to GDP; i* is the nominal foreign interest rate; ∆ (E)/ E is the proportional rate of change in the exchange rate; π is the domestic inflation rate. Fiscal sustainability (fs) is measured by comparing the actual primary deficit (act pdef) with the sustainable primary deficit. Thus,
fs = act pdef – sus pdef (2) Equation 2 suggests that sustainability requires the actual primary deficit to be less than the estimated sustainable primary deficit. In particular, if fs is positive, then the actual deficit exceeds the sustainable primary deficit and the debt-to-GDP ratio will increase. Conversely, if fs has negative sign, then the actual deficit is less than the sustainable deficit and the debt-to-GDP ratio will decline. In other words, the government’s fiscal stance is sustainable if its debt-servicing requirement does not exceed its primary surplus.

8
The application of this framework to the fiscal projections for 2001 and 2002 suggests that while the fiscal deficit in 2001 is not sustainable, that for 2002 is sustainable regardless of whether one uses the official or the author’s projections for the fiscal deficit (Table 2).10 Moreover, even if the higher fiscal deficit projection derived by the author is assumed, it is found that the fiscal deficit can still be increased by P29 billion in 2002 without increasing the debt-to-GDP ratio.11 More important, it might be more prudent to target a reduction (rather than simply maintaining the previous year’s level) in the debt-to-GDP ratio in 2002 since the government has had two years when its fiscal deficit was unsustainable and the share of interest payments in the budget is starting to balloon. 3. REVENUE PROGRAM
The fiscal outlook for 2001 and 2002 highlights the urgency of improving the revenue performance of the national government. The revenue performance of the national government has shown definite signs of weakening since the onset of the East Asian financial crisis - with the revenue effort sliding from 18.7% of GNP in 1997 to 14.7% of GNP in 2000. While the slippage in non-tax revenues is largely explained by the diminution in the income of the Bureau of Treasury following the decline in domestic interest rates, the slide in tax revenues has been a major source of concern to analysts inside and outside of government circles.
The overall tax effort tumbled by 3 percentage points from a peak of 16.3% of
GNP in 1997 to 13.2% of GNP in 2000 (Figure 4). Two-thirds of the contraction (or 2 percentage points of GNP) is due to the reduction in BIR tax revenues while the remainder (or 1 percentage point of GNP) is attributable to the fall in BOC revenues.
Collections for all the major tax groups declined relative to GNP in 1997-
2000. The biggest reductions are exhibited by the import duties, excise taxes, income taxes and value added tax with licenses (Figure 5). In particular, tariff revenues dropped from 3.8% of GNP in 1997 to 2.7% of GNP in 2000. Meanwhile, collections from excise taxes declined from 2.5% to 1.8% of GNP, revenues from taxes on
10 The reason for this may be traced to the fact that the effects of the higher GDP growth rate, the higher foreign interest rate and the lower rate of exchange rate depreciation in 2002 on the estimate of the sustainable primary deficit are not offset by the effects of higher real domestic interest rate and the lower inflation rate in the said year. 11 However, this number might be more illusory than real if one takes into account the arrearages that appear to be built into the fiscal statistics for 2002.
Table 2
Sustainable Primary Deficit
1995-2002
Actual Sustainable Actual
Primary Primary Less Sustainable
Deficit Deficit Primary Deficit
% GDP % GDP % GDP
1995 -4.392 2.690 -7.082
1996 -3.811 2.237 -6.049
1997 -3.277 -2.396 -0.882
1998 -1.869 -10.448 8.579
1999 0.180 2.328 -2.147
2000 -0.202 -4.210 4.008
2001 a/ -1.012 -3.527 2.515
2002 a/ -1.875 -0.060 -1.815
2001 b/ -0.813 -3.527 2.715
2002 b/ -0.786 -0.060 -0.726

9
income and profits decreased from 6.5% to 5.8% of GNP and collections from value added and licenses dipped from 2.7% to 2.2% of GNP during the same period.
Figure 4. Overall Tax Effort
0
2
4
6
8
10
12
14
16
18
1990 1991 1992 1993 1994 1995 1996 1997 1998 1999 2000
Year
Per
cen
t to
GN
P
Total Tax Revenue
Figure 5. Tax-to-GNP Ratio, Selected Taxes,1990-2000
0
1
2
3
4
5
6
7
1990 1991 1992 1993 1994 1995 1996 1997 1998 1999 2000
Year
Per
cen
t to
GN
P
Income Tax Import Duties Excise VAT Licenses
The decline in BOC revenues during this period is largely explained by the
contraction of merchandise imports following the sharp depreciation of the peso and the continuing reduction in tariff rates. On the other hand, scrutiny of the data on excise taxes reveals that the problem here lies in the structure of the tax (following the shift from the ad valorem to the per unit form of taxation without indexation in 1998) rather than from a deterioration of tax administration per se, except in 2000 when a 12% adjustment in the excise tax rates on alcoholic beverages and cigarettes was put into effect but without resulting in a corresponding improvement in the effective tax rates. Specifically, Table 3 shows that revenues from excise taxes on tobacco, alcoholic beverages and petroleum products have all declined by some 10 percentage points when measured relative to nominal gross value added (GVA) in their

10
respective subsectors (indicating how revenues have been unable to capture the increases in the value of the excisable products during the period). At the same time, it shows that the ratio of excise taxes collections to real GVA of these products was fairly stable in 1997-2000 (demonstrating how revenues have been pegged instead to the volume of domestic production of said products).
Table 3. Ratio of Excise Tax to GVA (in percent)
1995 1996 1997 1998 1999 2000
Excise Tax/GDP 2.05 2.23 2.60 2.35 2.07 1.88 Alcohol Tax/Nominal GVA-Beverage 49.06 47.69 51.16 43.39 41.00 39.71 Alcohol Tax/Real GVA-Beverage 132.34 134.59 149.67 138.05 140.89 142.30 Tobacco Tax/Nominal GVA-Tobacco 130.43 129.70 124.11 124.35 111.57 110.84 Tobacco Tax/Real GVA-Tobacco 273.07 274.81 275.40 302.75 290.98 301.73
Petroleum Tax/Nominal GVA-Petroleum 28.78 39.55 68.38 73.36 66.22 42.58 Petroleum Tax/Real GVA-Petroleum 29.40 41.10 73.63 82.08 80.73 70.67
On the other hand, a closer look at taxes on income and profits indicates that the primary culprit in the deterioration in the income tax effort is the decline in the corporate income tax effort. The corporate income tax revenues dropped from 3.2% to 2.5% of GNP while collections from the individual income tax and from taxes on passive income were fairly stable at 2.2% and 1.1% of GNP during the period (Figure 6). Also, the ratio of corporate income tax to corporate income plummeted from 22.5% to 15.8% (Figure 7). While this movement may be attributed to the phased reduction in the tax rate under the Comprehensive Tax Reform Program (CTRP), part of the problem may also be traced to the lower tax liabilities of corporations with foreign currency debt following the depreciation of the peso. In this regard, it is encouraging to find that the ratio of corporate income tax revenues to corporate income appears to have stabilized in 2000 but monitoring of developments in this area should be maintained.
Figure 6. Income Tax Effort
0.0
0.5
1.0
1.5
2.0
2.5
3.0
3.5
1990 1991 1992 1993 1994 1995 1996 1997 1998 1999 2000
Year
% to
GN
P
Corporate Individual Others

11
Figure 7. Corporate Income Tax Effort
0.0
0.5
1.0
1.5
2.0
2.5
3.0
3.5
1990 1991 1992 1993 1994 1995 1996 1997 1998 1999 2000
Year
% t
o G
NP
0
5
10
15
20
25
% o
f C
orp
ora
te In
com
e
% to GNP % of Corporate Income
Although the individual income tax effort has been consistent in 1997-2000, problems in tax administration continue to fester. First, close to 80% of collections from the individual income tax comes from compensation income even as the latter accounts for less than 50% of total personal income (Table 4). Second, the average effective tax rate for compensation income is 5%, five times as large as the effective tax rate for business and professional income of individuals (Figure 8).12 This finding indicates the continued leakage in the individual income tax system due to its inability to reach hard-to-tax group (i.e., professionals and the self-employed).
Table 4. Components of Personal Income and Individual Income Tax (in percent)
1995 1996 1997 1998 1999 2000 Share of: IIT on Wages in Total IIT 66.13 74.09 76.35 75.85 78.20 78.17 Compensation Income 41.42 42.88 45.77 47.46 47.98 48.30 in Total Personal Income
IIT refers to the individual income tax
12 The average effective tax rate for compensation income is computed as the ratio of collections from the individual tax from salaried individuals to the compensation income of households in the National Income Accounts while the average effective tax rate for business professional income is computed as the ratio of collections of the individual income tax from self-employed to the net operating surplus of households in the National Income Accounts.

12
Figure 8. Income Tax on Wages and Non-Wages(Percent to GNP)
0
1
2
3
4
5
6
7
1990 1991 1992 1993 1994 1995 1996 1997 1998 1999 2000
Yes
IIT on Wages/Compensation Income IIT on Non-Wage Income/NOS of HH
The expansion of the coverage of the VAT in 1997 has not yielded additional revenues.13 To wit, the ratio of revenues from VAT/licenses to GDP net of GVA in agriculture, fisheries, forestry, and exports has likewise dipped from 3.7% in 1997 to 3.3% in 2000 (Figure 9).14 Thus, the decline in the VAT-to-GNP ratio cannot be attributed to the changing structure of the economy.
Figure 9. VAT Effort and Effective VAT Rate
0.0
0.5
1.0
1.5
2.0
2.5
3.0
1990
1991
1992
1993
1994
1995
1996
1997
1998
1999
2000
Year
% to
GN
P
0.0
0.5
1.0
1.5
2.0
2.5
3.0
3.5
4.0
% to
GD
P N
et
% to GNP % to GDP Net
Areas for improvement. Given this background, there is an urgent need to support the administration’s proposal to amend RA 8240 to allow for the indexation of the excise taxes on tobacco and alcoholic products. In the near term, a price survey of tobacco and alcoholic products should be conducted immediately to permit the reclassification of said products for excise tax purposes. Such a survey is prescribed
13 The Expanded VAT law broadened the coverage of the VAT to include pesticides, hotels, inns, resorts, restaurants, dealers in securities and lending investors, taxicabs, tourist buses, rent-a-car companies, non-life insurance, telephone, and telegraph. 14 The GVA of agriculture, fisheries, forestry and exports are netted out of total GVA because exports are zero rated while agriculture, fisheries and forestry are exempt from the VAT.

13
in RA 8240 but has not been implemented to date. Such a move will provide temporary relief to the unmitigated erosion of revenues from excise taxes. Also, in the near term, a DOF regulation should refine the use of the term “automobile” for tax purposes so as to remove the ambiguity in the definition that is currently being used and which results in tax avoidance. In the medium term, such a definition should be legislated and embodied in an amendment of the tax code. Moves to expand the coverage of the withholding tax system to hard-to-tax groups (like the recent increase in the withholding tax rates on actors, actresses, etc.) should be intensified. Likewise, the immediate issuance of the Implementing Rules and Regulations that will impose limitations on deductions that can be claimed for income tax purposes as provided in the CTRP law should also supported. These moves will not only have a positive impact on revenues but will also help improve the equity of the tax system. The administration of the VAT, particularly with respect to the sales of services that were covered under the Expanded VAT law, needs to be strengthened. In this regard, profiling and benchmarking of the cost structure of industries/sectors is imperative. However, proposals for the wholesale abolition of the VAT should be approached with caution. Despite problems that persist in its administration, not only is the VAT a more revenue productive tax,15 it also reduces the allocative inefficiencies that arise with tax cascading under the sales tax. On a more general note, although many of the problems in the tax system are structural as pointed out in the discussion above, the pressing need to improve tax administration cannot be denied. Estimates of the leakage in the tax collection system from various analysts (e.g., Manasan 2000) have consistently indicated that the problem is by no means negligible. One concrete way to improve tax administration is for the BIR has to undertake further work on its computerization program so that the system supports the agency’s increased access to internal as well as external sources of information. This should then make possible the matching of tax returns with third-party information, make more difficult to tamper with records, and facilitate automated audit selection, thus, reducing the discretion of tax examiners. Will shift to gross income taxation help? It is unlikely that the proposal to shift to gross income taxation will generate more revenues for the government. The shift to the taxation of gross income is a bold and radical innovation that has not been implemented anywhere in the world. Although it may yield high returns, it also entails high risks.
Specifically, the Department of Finance (DOF) is proposing that income tax on corporations and self-employed individuals be taxed on the basis of their gross income at the uniform rate of 15%.16 Hand in hand with this, the government is also proposing that the individual income tax on salaries and wages be amended so as to replace the present rate schedule with one that varies from 0%-32%. At the same 15 This is indicated by the higher ratio of VAT/licenses revenues to GNP in 1988-2000 (2.3%) relative to the ratio of sales tax and licenses to GNP in 1975-1987 (1.5%). 16 The DOF has been looking at various formulae for the gross income tax. The one that is discussed in this paper is based on the October 15, 2001 draft.

14
time, proposal would also disallow individuals to claim personal exemptions for purposes of computing their income taxes.17
In contrast, under the present system, the corporate income tax is 32% of net
income. Also, the same rate schedule is applied to individual income from salaries and wages and individual income from business and exercise of profession with the latter being taxed on the basis of net income.
Analysis indicates that revenues from the income tax on compensation income
will decline by P33 billion in 2002 if this proposal is implemented. This revenue loss is associated with a probability that is close to 100% given the fact that the tax on compensation income is covered by the withholding system. On the other hand, revenue gains are expected from improvements in compliance in the corporate income tax and the individual income tax on the self-employed. However, because said gains are associated with a small probability (as the following discussion would indicate), the expected value of the revenue impact of the proposed gross income tax is negative even under generous assumptions.18 From this perspective then, such a reform is too risky a proposition to undertake at present when the fiscal position of the national government is extremely weak.19
At first blush, this proposal appears to be attractive because of its potential to
broaden the tax base. By purging the opportunities on the part of taxpayers to claim excessive deductions when they compute their tax liability and by eliminating the discretion that tax collectors have in deciding which deductions to allow when they audit tax returns, gross income taxation clearly seeks to plug the leakages in the system arising from the overstatement of deductions. In reality, however, the proposal will have to allow for the deduction of other costs that are directly related to the conduct of business20 because to do otherwise will introduce unparalleled inequity in the system given the wide variation in the cost structure of various activities and sectors. Moreover, in the case of “sales of services” delineating what constitutes cost of services is not that straightforward. These considerations will then put discretion back in equation and the promised simplicity, ease of administration and increased compliance that gross income taxation is expected to bring may not materialize at all.
In addition, the proposed amendments to the income tax provisions of the tax
code will also introduce other inefficiencies and inequities. First, the proposal tends to discriminate against the families with children and families with only one income earner.21 Second, the proposal tends to discriminate against the professionals and
17 In lieu of the personal exemptions, the proposal will tax the first P75,000 of individual income at 0%. 18 For example, if the government is able to capture all the leakages that existed prior to the proposed reform, it may be able to generate additional revenue of P45 billion from corporate income taxes. Now, even if one assumes that the government is able to double its take from the individual income tax on the self-employed and raise an additional P13 billion and if a probability of ½ is attached to these tax gains, the expected value of the reform would still be negative P4 billion (-33*1.0+ [45+13]*0.5). 19 In a sense, this reflects the wisdom of the provision in the Comprehensive Tax Reform Program (CTRP) law which only allows the shift to gross income taxation when an overall tax effort of 20% of GNP has been reached. 20 Examples of these types of expenditures are: marketing/selling expenses and certain overhead expenses. 21 This comes about because the tax will no longer differentiate taxpayers according to status.

15
individual business income earners22 and this will tend to drive these hard-to-reach taxpayers further out of the tax net. 4. EXPENDITURE PROGRAM
The proposed expenditure program under the President’s Budget for 2002 amounts to P780.8 billion. The President’s Budget Message emphasized that the national budget will be used as government’s primary weapon against poverty. In this regard, the administration promises to focus on the basics: (1) the modernization of the agriculture sector primarily to create jobs in rural areas and to raise the incomes of farmers and fisherfolk but also to produce food at lower prices; (2) the provision of basic human needs – jobs, food, medicine, and housing; and (3) the promotion of national security.
In fact, however, the first budget of the Arroyo (GMA) administration is
singularly distinguished by the palpable precedence that it accords to national defense and peace and order over all other sectors. In addition, the GMA budget proposes to provide more resources for agricultural and agrarian reform after it has cut back on the allocation to these subsectors in the re-enacted 2001 budget. Thus, the President’s Budget for 2002 proposes to shift resources away from the social service sectors in favor of the economic service sectors (notably agriculture) and military and police spending.
Aggregate national government spending. The President’s Budget for 2002
will allow total national government spending to increase by 11.6% over the 2001 expenditure program (Annex 1). This growth will permit national government spending to recover somewhat from the 2.6% rate of increase that was effected with the re-enacted budget of 2001 (including the supplemental budget). Nonetheless, the growth in the 2002 expenditure program is just in sync with the projected rate of inflation and growth in economic activity.
From a longer term perspective, however, the aggregate national government
expenditure program for 2002 at 18.5% of GNP is just slightly lower but still comparable to the budgets of earlier years –18.9% of GNP in 1986-1998 and 19.0% in 1999-2000 (Figure 10)
However, because of the surge in interest payments to 4.8% of GNP following the widening of the fiscal gap in 1998-2000, the amount of resources left for non-mandatory expenditures (i.e., total expenditures less interest payments) at 13.7% of GNP is substantially smaller than the 14.5% level that was registered in 1986-1998 and the 15.3% average in 1999-2000. Consequently, national government expenditure net of debt service continues the downward slide that it has started to register since 1998.
22 Assuming there is no evasion, the effective individual income tax rate on the self-employed will be almost double that on wage earners.
16
Figure 10. Aggregate National Government Expenditures (Obligation Basis), 1990-2002
0
5
10
15
20
25
1990
1991
1992
1993
1994
1995
1996
1997
1998
1999
2000
2001
2002
Year
Per
cen
t to
GN
P
GT GT-DS GT-DS-IRA
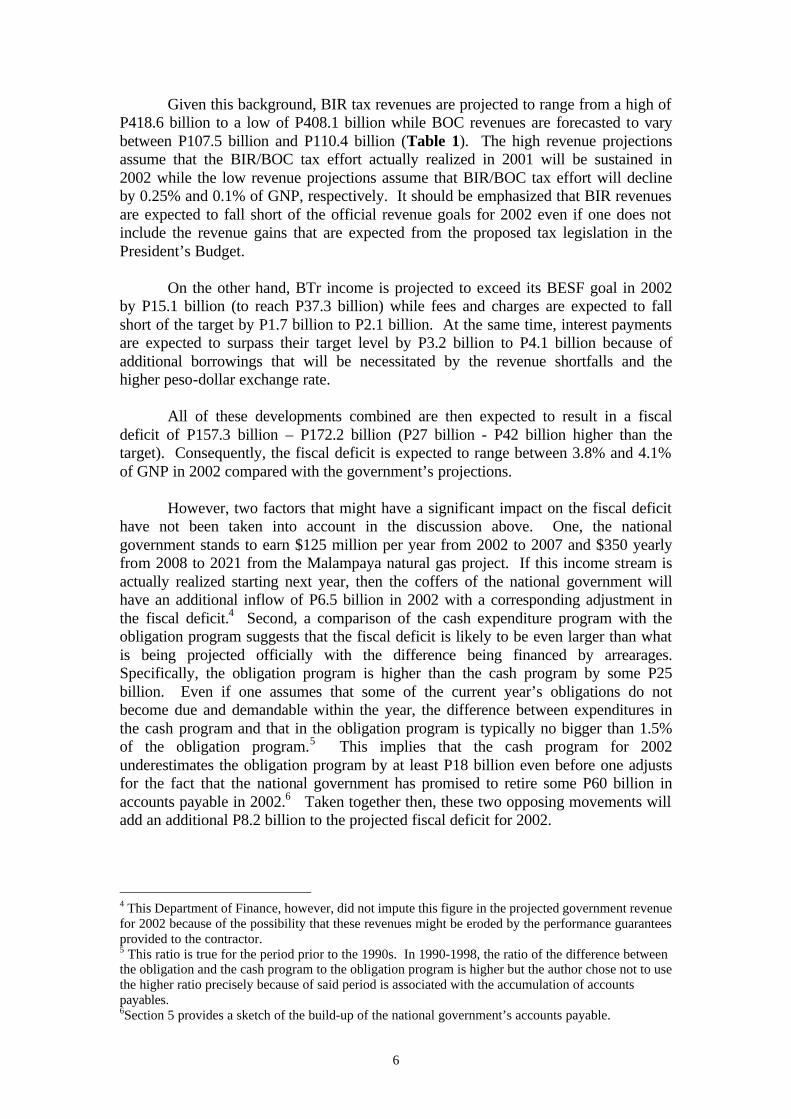
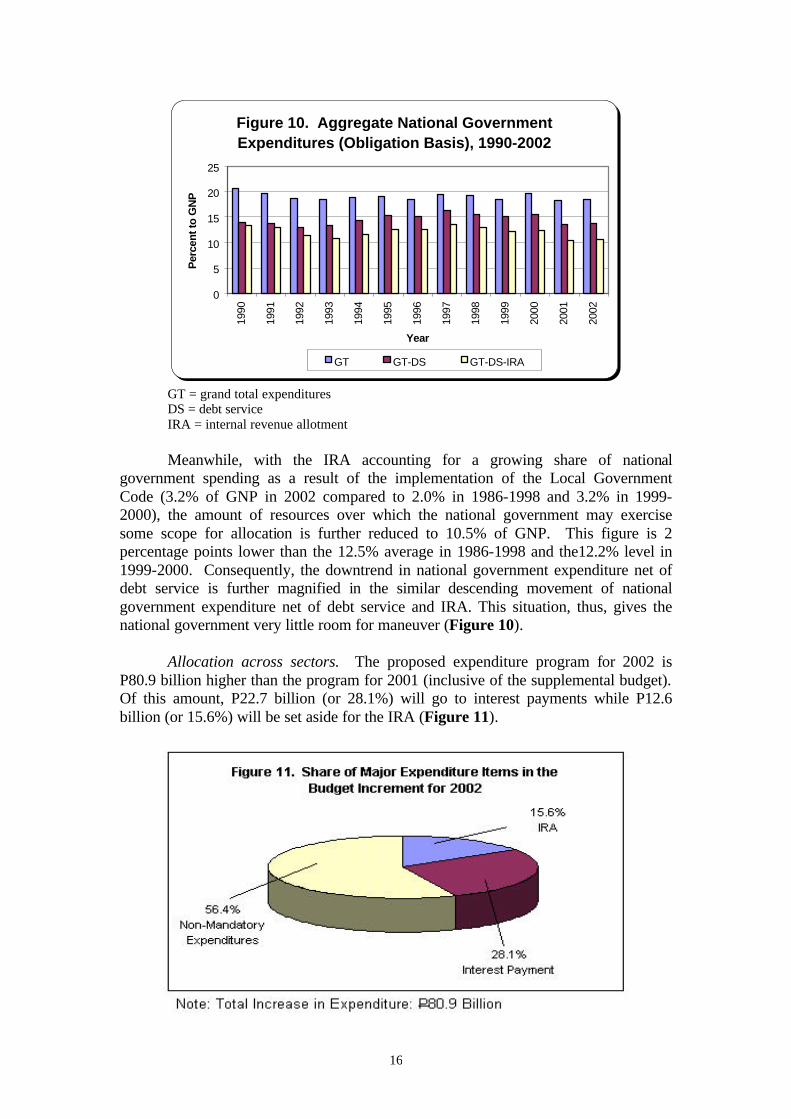
GT = grand total expenditures DS = debt service IRA = internal revenue allotment Meanwhile, with the IRA accounting for a growing share of national
government spending as a result of the implementation of the Local Government Code (3.2% of GNP in 2002 compared to 2.0% in 1986-1998 and 3.2% in 1999-2000), the amount of resources over which the national government may exercise some scope for allocation is further reduced to 10.5% of GNP. This figure is 2 percentage points lower than the 12.5% average in 1986-1998 and the12.2% level in 1999-2000. Consequently, the downtrend in national government expenditure net of debt service is further magnified in the similar descending movement of national government expenditure net of debt service and IRA. This situation, thus, gives the national government very little room for maneuver (Figure 10).
Allocation across sectors. The proposed expenditure program for 2002 is
P80.9 billion higher than the program for 2001 (inclusive of the supplemental budget). Of this amount, P22.7 billion (or 28.1%) will go to interest payments while P12.6 billion (or 15.6%) will be set aside for the IRA (Figure 11).

17
Table 5. Share of Various Sectors to Net Budget Increment in 2002
Difference % Share to Growth Rate 2002-2001 Total (%) (in billion pesos) 2002-2001 Total Economic Services 12.35 27.09 12.38 Agri/Agra/ENR 10.97 24.06 33.63 Agriculture 5.85 12.82 34.92 Agrarian Reform 2.76 6.05 28.70 Natural Resources 2.37 5.19 37.71 Infrastructure (1.26) (2.76) (2.00) Power & Energy (2.87) (6.30) (72.05) Water Resources Devt. (1.38) (3.03) (84.30) Transp. & Comm. 2.99 6.57 5.24 Total Social Services 10.52 23.06 6.61 Education 8.06 17.66 6.63 Health 0.72 1.58 5.72 Soc. Serv., Labor & Emp. & Other Social 1.99 4.36 8.85 Housing & Com. Devt. (0.25) (0.54) (9.79) Public Administration 4.24 9.29 7.42 Defense and Peace & Order 19.74 43.28 27.35 Grand Total-Debt Service-IRA 45.60 100.00 11.50
Thus, military and the police spending emerges to be the fastest growing major item in the national government expenditure program for 2002. This comes about as the combined budget for national defense and the police rose by 27.3% (Annex Table 1).23 Consequently, the share of the military and the police in the total expenditure program net of debt service and the IRA expands from 18.2% in 2001 to 20.8% in 2002, about 4 percentage points higher than the 16.9% average share of the sector in 1986-1998 (Figure 12). Relative to GNP, the budget of the defense and police establishment will rise to 2.2%, up from the 1.9% level in 2001 and the 2.1% average in 1986-1998 (Figure 13).
The huge increase in the allocation for the military and the police has been
attributed largely to the AFP Modernization Program. Ostensibly, this will be used to enable the Department of National Defense (DND) to upgrade its equipment (planes, ships and weaponry). However, about 20% of the increment in the DND budget (or P10.2 billion) will fund personal services while the same is true of the entire increase
23 In particular, the budget for national defense will increase by 33.2% while that for the police by 19.2%

18
in the budget of the Philippine National Police (PNP). Because of this, the personal services budget of the PNP and the DND will increase by 22.4% and 8.0%, respectively, compared to a 7.4% average increase in all the other sectors. On the part of the PNP, P2.1 billion will be used to implement the last tranche of the salary upgrading of uniformed personnel that was initially proposed under the President’s Budget for 2001, and P3.2 billion for the payment of terminal leave and pension benefits of police retirees.
Figure 12. Distribution of National Government Expenditures Net of Debt Service and IRA, by Sector
010
20304050
60708090
100
1990 1991 1992 1993 1994 1995 1996 1997 1998 1999 2000 2001 2002
Year
% T
o T
ota
l
Social Services Economic Services Denfense/Police
Public Admin Others
Figure 13. National Government Expenditures, by Sector (percent to GNP)
0
2
4
6
8
10
12
14
16
1990 1991 1992 1993 1994 1995 1996 1997 1998 1999 2000 2001 2002
Year
Social Services Economic Services Denfense/Police
Public Admin Others
The second fastest growing major sector in the President’s Budget for 2002 is
the combined economic services sector with the combined budget for the sector growing by 12.4% over the 2001 level. Consequently, national government spending on economic service will inch up to 2.7% of GNP from the 2.6% level in 2001 but

19
still lower than the 4.2% average in 1986-1998. This then allows the economic services sector to maintain its share in the net budget of the national government (Figure 12).
The biggest winners amongst the subsectors in economic services are agriculture, agrarian reform and environment/natural resources. These 3 subsectors combined account for 24.1% (or P11 billion) of the increment in the net budget. In turn, 72% (or P8 billion) of this amount is earmarked for capital outlays, leading to a 96% increase in the capital expenditures of the agri/agra/ENR group (from P8.3 billion in 2001 to P16.3 billion in 2002). The bulk of this amount (P6.8 billion) will be spent on the rehabilitation and construction of irrigation systems while P3.8 billion will go to production support (distribution of certified seeds, yield-enhancing technologies and marketing support) to farmers and P0.5 billion to the construction of farm to market roads. In addition, P4.8 billion is budgeted for the acquisition of compensable land for distribution to agrarian reform beneficiaries and P1 billion is allotted for the Price Stability and Food Security Program of the National Food Authority.
On the whole, the high priority given by the administration to the
agri/agra/ENR group is well placed given the urgent need for productivity improvements in the agricultural sector and the high incidence of poverty in rural areas. In particular, the allocation for the rehabilitation of existing irrigation systems and the construction of new ones will go some way in making up for the accumulated neglect in earlier years. In contrast, the value of the allocation of P1 billion for the NFA is dubious as many studies that have shown that ineffectiveness of the agency in reducing the price of rice that consumers pay and in helping improve farmers’ incomes.24
As a result of this realignment, the allocation for the agri/agra/ENR group will rise to 1.0% of GNP in 2002 from 0.9% in 2001 (Annex Table 2). However, this amount is still below the 1.2% average in 1986-1998. Thus, the share of the group in the budget will expand from 4.7% in 2001 to 5.6% in 2002, still lower than the 6.2% average in 1986-1998 (Annex Table 3). This is but a reflection of the squeeze on non-mandatory expenditures in 2001-2002.
Although the combined budgets of the infrastructure group (composed of
power/energy, water resources development, and transportation/communication) will decline by small amount in nominal terms in 2002, the allocation for transportation/communication subsector will increase by P3 billion in 2002. Thus, the subsector’s budget in 2002 will be 5.2% higher than the 2001 level. On the whole, however, the share of the infrastructure group in the budget further contracts to 7.9% in 2002 from 9.0% in 2001 and the 13.4% average in 1986-1998 (Annex Table 3) as aggregate allocation for the group slips to 1.5% to GNP in 2002 from 1.6% in 2001 and 2.5% average in 1986-1998 (Annex Table 2) and the 4.5% average in other Asian countries in the 1990s. This secular decline is worrisome considering the well-documented positive relationship between infrastructure spending and economic 24 Tolentino et al. (2001) noted that Filipino consumers pay double to triple the prices paid by Thai or Vietnamese households despite NFA intervention in the rice market. On the other hand, only about 67,000 farmers (or 3% of all rice farmers) directly befitted from the NFA’s rice paddy price support system.
20
growth. Moreover, even if one includes the BOT projects that are now in the bidding stage, this figure will only reach 2.2% of GNP. Clearly, this is where government rhetoric does not seem to be supported by the budget.
In contrast, the social service sector is the principal loser in the President’s
Budget for 2002. Amongst all the major sectors, the social services sector exhibits the lowest rate of growth in 2002. The 6.6% increase in the combined allocation for social services in the 2002 is not even sufficient to sustain real per capita spending at the 2001 level. In particular, the budget for social welfare/employment will grow by 8.9%, that for education by 6.6% and that for health by 5.7%. In contrast, the allocation for housing/community services will decrease by 8.9% relative to their 2001 levels (Annex Table 1).
About 77% of the increment in the combined allocation for social services in
2002 will go to the education subsector while 19% is set aside for social welfare/employment subsector. The increase in the budget of the education subsector (P8.0 billion) will be used to fund 20,000 new teaching positions (P2.1 billion), the increase in teacher salaries (about P5 billion), and a new foreign-assisted project for the upgrading of technical and vocational education under the TESDA (P900 million).
On the other hand, the growth in the allocation for the social
welfare/employment subsector is partly due to the substantial increase (32%) in the DSWD budget, particularly the funding support for the Comprehensive and Integrated Delivery of Social Services (CIDSS), the most effective program of the department, and its early childhood development project.
With the exception of debt service, the social services sector will continue to
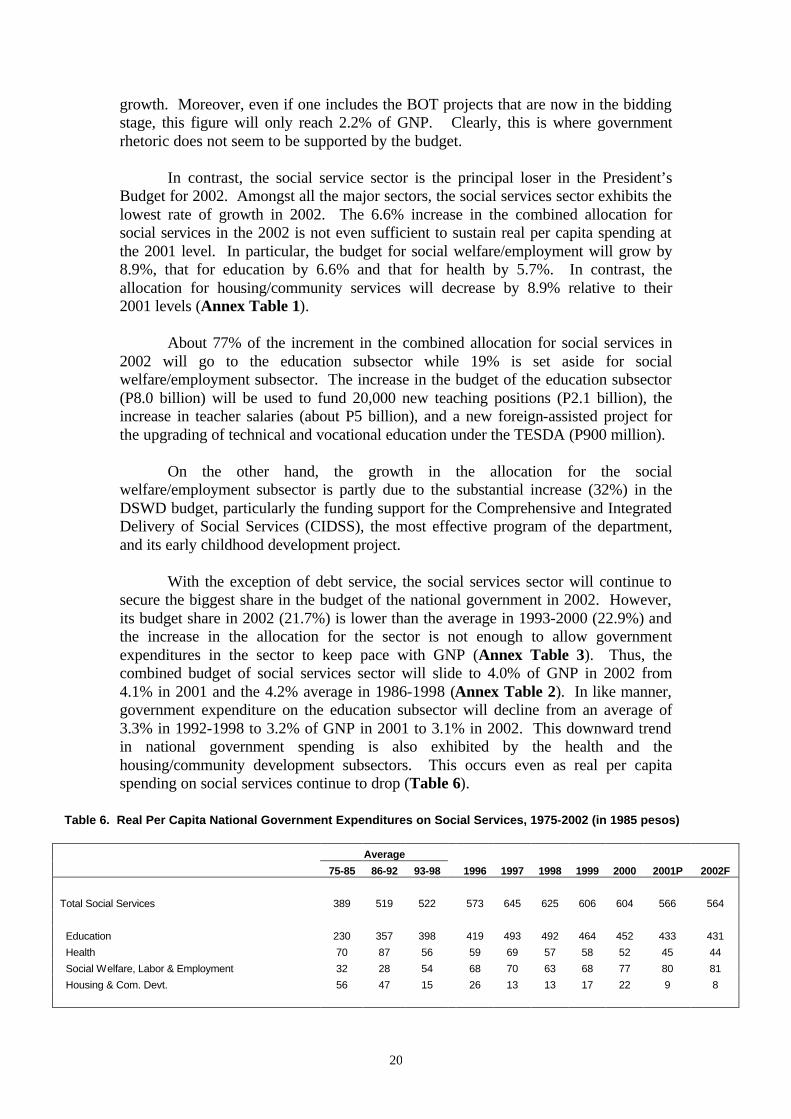
secure the biggest share in the budget of the national government in 2002. However, its budget share in 2002 (21.7%) is lower than the average in 1993-2000 (22.9%) and the increase in the allocation for the sector is not enough to allow government expenditures in the sector to keep pace with GNP (Annex Table 3). Thus, the combined budget of social services sector will slide to 4.0% of GNP in 2002 from 4.1% in 2001 and the 4.2% average in 1986-1998 (Annex Table 2). In like manner, government expenditure on the education subsector will decline from an average of 3.3% in 1992-1998 to 3.2% of GNP in 2001 to 3.1% in 2002. This downward trend in national government spending is also exhibited by the health and the housing/community development subsectors. This occurs even as real per capita spending on social services continue to drop (Table 6).
Table 6. Real Per Capita National Government Expenditures on Social Services, 1975-2002 (in 1985 pesos)
Average
75-85 86-92 93-98 1996 1997 1998 1999 2000 2001P 2002F
Total Social Services 389 519 522 573 645 625 606 604 566 564
Education 230 357 398 419 493 492 464 452 433 431
Health 70 87 56 59 69 57 58 52 45 44
Social Welfare, Labor & Employment 32 28 54 68 70 63 68 77 80 81
Housing & Com. Devt. 56 47 15 26 13 13 17 22 9 8

21
Moreover, although
there appears to be some improvement in the intra-sectoral allocation within the education subsector (Table 7) as indicated by the increasing share of basic education in total education budget in 2002, the same cannot be said of the health subsector. Thus, the share of preventive care (or basic health) in budget of the Department of Health continues to decline 2002 (Table 8). Such a contraction in the allocation for basic health services in the DOH budget cannot be explained away by the devolution of basic health services under the Local Government Code. It should be recalled that although responsibility for most basic health functions are assigned to local governments under the Code, the devolution program (specifically, the effective transfer of budget responsibilities that was implemented in 1993) only covered the budgets for the operations of facilities that were transferred to LGUs (i.e., hospitals to provinces, rural health units and barangay health stations to municipalities and cities) but not the budgets for most public health services which were left intact at that time in the DOH budget. Consequently, it should come as no surprise that the programs on basic social services that are enunciated in the MTPDP are found to be underfunded by some P20 billion (Manasan 2001).
Table 8. Distribution of DOH Budget by Function
1996 1997 1998 1999 2000 2001 2002
Preventive Care 36.38 30.76 23.53 32.18 32.09 26.39 25.23
Curative Care 53.57 58.23 63.31 56.67 56.82 59.58 61.54
General Administration 10.06 11.01 13.16 11.15 11.09 14.03 13.23
Total 100.00 100.00 100.00 100.00 100.00 100.00 100.00
Note: 1996-2000 based on actual obligations; 2001-2002 based on proposed obligations
5. FINANCING PROGRAM
In 1999-2000, the national government relied more on foreign borrowing to finance the fiscal deficit. In those years, the 45.6% and 51.0% of the national government’s borrowings came from external sources compared to 16.8% in 1986-1991 and –4.3% in 1992-1998 (Table 9). However, the opposite was true in 2001 as the government shifted back to domestic financing given the rapid depreciation of the peso in the last half of 2000. In contrast, the President’s Budget for 2002 plans to obtain 43.4% of its borrowings from external sources.
Table 7. Distribution of Education Budget by Level
1996 1997 1998 1999 2000 2001 2002
Basic Education 78.32 80.49 81.45 81.75 81.19 80.94 82.76
TVET 2.90 3.48 1.55 1.99 2.17 1.82 2.28
Higher Education 17.17 14.71 15.47 15.02 15.44 14.65 13.99
Total a/ 100.00 100.00 100.00 100.00 100.00 100.00 100.00
a/ Total includes miscellaneous education and culture institutions.
Note: 1996-2000 based on actual obligations; 2001-2002 based on
Proposed obligations.

22
Table 9. Percent Distribution of National Government Borrowings, (%)
Average 1975-85 1986-91 1992-98 1996 1997 1998 1999 2000 2001 2002
Net Domestic Financing 81 83 104 114 75 86 54 49 94 57 Net Foreign Financing 19 17 (4) (14) 25 14 46 51 6 43 Total Borrowings 100 100 100 100 100 100 100 100 100 100 Total Borrowings (in billion pesos) 12 34 33 43 (27) 89 182 204 174 112
But, what is perhaps more interesting than the rather sterile financing figures
given in Table 9 are some of the issues that arise from the more creative forms of debt-financing that has emerged in more recent years. These include: (1) arrearages or the build up of accounts payables, (2) zero-coupon bonds, and (3) securitization of government assets. The discussion below suggests that these new forms of financing all tend to make the orthodox way of rendering the fiscal accounts less transparent. Consequently, the conventional measure of the fiscal deficit becomes a less reliable measure of the actual change in the government’s liabilities and fiscal sustainability. In this sense, the continued reliance on the said measure may weaken fiscal discipline to the extent that it no longer provides an accurate picture of the true state of the government’s fiscal position.
Arrearages. The build up of accounts payables was first brought to the
attention of the public in 1998 when the Department of Budget and Management estimated that the value of outstanding accounts payable as of the end of that year was P151.1 billion. To appreciate the evolution of the accounts payable, it is necessary to understand the relationship between the appropriations and the obligations and also between the obligation expenditure program and the cash expenditure program. First, the obligation program is simply the sum of the programmed portion of current appropriations (or appropriations found in the General Appropriations Act), continuing appropriations and automatic appropriations (including interest payments and payment of retirement and life insurance premiums of government employees). To wit, the proposed obligation program for 2002 amounts to P780.8 billion:
Obligation program = current appropriations (P419.6 billion) + continuing
appropriations (P0) + automatic appropriations (P361.2 billion)
Second, the cash expenditure program is obtained by first subtracting unpaid
obligations for the current year from and adding payments for prior years’ accounts to the obligation program. It is but normal that some obligations for the current year would not require payment in the same year. This is so because the delivery of the goods/services involved may have not been completed in the current year or even if they were, billing and processing of the same may have completed only after the end of the current year. Conversely, however, obligations in previous years’ account may require payment in the current year.

23
Although there is no one-to-one correspondence between the obligation expenditure program and the cash expenditure program, the difference between the two is not large in a typical year. That is, unpaid obligations for the current year and payments of prior years’ account tend to wash each other out. Moreover, if the difference is large in one direction in any given year, it should go in the other direction in the next year. These observations are illustrated in Table 10 which reproduces the reconciliation of the obligation and cash disbursement program in the 1993 Budget of Expenditure and Sources of Financing or BESF (DBM 1993).
Table 10. Reconciliation Between Obligation Expenditures and Cash Disbursements, 1991-1993 (in billion pesos)
Particulars 1991 1992 1993 Obligation Program 247.7 289.2 296.6 Less: Unpaid Obligations 28.8 42.8 28.8 Reserve Control Account - 6.5 - Add: Payments of Prior Years' Accounts 28.3 32.9 38.5 Cash Disbursement Program 247.1 272.8 306.3
% Difference a/ 0.24 5.67 -3.27 a/ Obligation-Cash Obligation Source: BESF 1993
In contrast, Table 11 gives an indication of the accumulation of accounts
payable in the last half of the 1990s. While the cumulative difference between the obligation program and the cash program in 1975-1985 was only P2.6 billion (or 0.1% of obligations), the cumulative difference in 1990-1998 was P85.8 billion (or 2.1% of obligations). What is even more surprising, though, is the fact that the obligation program has consistently exceeded the cash program by substantial amounts in 1994-1997, years when the national government has registered fiscal surpluses.25 Moreover, the difference between the obligation program and the cash program in 2002 is P26.5 billion (or 3.4% of obligations) even as the national government professes to retire P60 Billion in accounts payable that were incurred in the earlier years. These figures raise the possibility that arrearages would once again figure in the financing of the fiscal deficit in 2002. The primary problem with arrearages is that they do not show up in the fiscal accounts and, thus, they are not reflected in the fiscal deficit figures. As such, they diminish the transparency of the fiscal accounts and make policy analysis more
25 It is recognized that the difference between commitments (or obligations) and payments (or cash disbursement) may overestimate arrears to the extent that goods/services contracted for in the current year may not have been delivered in the same year and to the extent that the processing of outstanding invoices require material time (usually referred to as the “float”). However, if commitments consistently exceed payments for a number of years then accounts payables are undoubtedly being accumulated.

24
difficult. Second, although no explicit interest payments are made to private contractors and suppliers, anecdotal evidence indicates that most contractors and suppliers, including those who are not adversely affected, adjust the prices they charge government upwards to reflect the cost of money that they might have to shoulder because of delays in payment. In addition, when the problem is particularly acute, some may even resort to bribing the agencies concerned (either the line departments or the DBM) so as to be put on top of the waiting list of arrears (Schiavo-Campo and Tommasi 1999). Third, line agencies that have to deal directly with government contractors and suppliers have been observed to wait for the release of the notice of cash allocations (NCAs) prior to contracting out projects even if the obligation authority is already with them.26
Table 11. Reconciliation of the Expenditure Program with the Cash Program
( in billion pesos) Difference
Year Cash Obligation Obligation - % to Cash Obligation
1990 218.10 220.54 2.45 1.11 1991 247.14 247.66 0.52 0.21 1992 258.68 256.95 -1.73 -0.67 1993 282.30 276.04 -6.25 -2.27 1994 319.87 327.77 7.89 2.41 1995 350.15 372.08 21.94 5.90 1996 404.19 416.14 11.95 2.87 1997 470.28 491.78 21.50 4.37 1998 512.50 537.43 24.94 4.64 1999 590.16 580.39 -9.78 -1.68 2000 648.97 682.46 33.49 4.91 2001 703.22 699.88 -3.34 -0.48 2002 754.31 780.79 26.48 3.39
Cumulative
1976-1989 2.61 0.15 1990-1998 85.81 2.06 1976-1998 88.42 0.90
Difference = Obligation - Cash
Schiavo-Campo and Tommasi (1999) point out that a number of measures are needed to limit the generation of arrears. At the top of this list is realistic revenue forecasts. Also included are internal management measures, and control and monitoring of commitments (including forward commitments). 26 From the perspective of the DBM, such action is considered dysfunctional. However, the implementing agencies consider the same as a rational and appropriate reaction to the situation.

25
Zero coupon bonds. Recently, the Bureau of Treasury (BTr) issued 10-year zero coupon bonds (or 10-year zeroes) with a face value of P35 billion. With zero coupon bonds, investors’ interest earnings are imputed in the final payment. That is, the government does not pay the interest on a yearly basis for the zeroes that it issue, rather it makes a balloon payment equal to the face value of the zeroes at the maturity date. The government generated P10 billion in cash for this particular issue which was obtained at an annual interest rate of 12.87%.
On the one hand, coupon bonds and other long-term bonds issued by the government are important in helping establish the yield curve that is most essential in the development of the domestic bonds market. On the other hand, depending on how the interest payments are treated in the fiscal accounts, zero coupon bonds may create less pressure on the budget if interest payments are recognized when they are disbursed rather than when they accrue27 or if the interest payments that is implicitly part of the balloon payment are not even recognized as interest payments at all. As such, they may unduly weaken fiscal discipline either by shifting the burden of the interest payments to the future or by not recording the implicit interest payments above the line as they accrue (and therefore part of fiscal deficit) but rather below the line as amortization payments. At present, the P35 billion issue is by no means large enough to really make an impact on the fiscal accounts in a significant way. However, statements attributed by the media to key fiscal managers suggest that zero coupon bonds may account for a substantial portion of the borrowing requirements of the national government in 2002.
Securitization. Many proposals have been raised in various fora that call for
the securitization of future earnings from government assets (e.g., royalties that government expect to receive from the Malampaya, Subic, Clark). Contrary to the impression that may have been created in many public discussions, securitization is just another form of debt which needs to be paid back in the future and on which interest is paid. It provides the government with financing but not income. Thus, it does not reduce the fiscal deficit. It is just one way of financing the fiscal deficit.
In essence, securitization allows the government to spend now the stream of
income that it expects to earn in the future from its assets by borrowing from the market with said income stream as collateral. Securitization, thus, involves the issuance of asset-backed financial instrument. In the corporate sector, asset-backed securities are largely viewed as an enhancement that enables them to obtain financing at lower rates of interest. In this sense, securitization is the same as collateralized borrowing. However, from the perspective of the government, it is not clear that such added enhancement over and above the sovereign guarantee that is normally applied to government debt would matter or is necessary.
Build-operate-transfer (BOT) schemes, GOCC financing. Not sufficient funding is found in the President’s Budget for many of the programs that the GMA administration proposed in the State of the Nation Address (SONA). Most prominent in this list are infrastructure and housing. The present government proposes instead that these programs be funded outside of the national government budget. Two modes of financing are specifically mentioned. The first one is BOT for major
27 This is a feature that is not shared by non-zero coupon bonds.

26
infrastructure projects. The other one involves shedding the responsibility to government owned and controlled corporations (GOCCs). For instance, it is envisioned that P20 billion will be raised from housing bonds that will be issued by the Pag-ibig Fund, the Government Service Insurance System (GSIS), the Social Security System (SSS), and the National Home Mortgage Finance Corporation (NHMFC).28 Part of the proceeds of the bonds will be used for housing subsidies to the poor while the remainder will go to the development of housing projects for those who can afford. These proposals share a common feature. They both create contingent liabilities that government may have to shoulder in the future. It is interesting to note that the contingent liabilities associated with some BOT projects that were implemented in the not-so-distant past have already been realized. One example is the Metro Rail Transit (MRT) project for which the government shells out some P3 billion yearly in 2001-2002. There is widespread agreement that the total amount of outstanding contingent liabilities of the government is large. However, these guarantees are not disclosed in the national government accounting system and the amount of guarantees in default are only shown as “contingent” liabilities in the notes to the financial statements (SGV Consulting and Cowater International Inc. 1999).
In the case of the housing bonds, the concerned GOCCs will surely be generating losses equal to the subsidies that will be required for socialized housing. This will then necessitate transfers from the national government to the GOCCs in the near future. The question is: would it not be better if only the pure market-type activities are assigned to the GOCCs so that the national government avoids the return of an unmanageable GOCC sector that was prevalent in the early 1980s?
Moreover, the inclusion of the SSS and GSIS as issuers of the housing bonds
raises additional questions. Under normal circumstances, pension funds are the lenders (not borrowers) in the long-term bond market since they are precisely the institutions that have surplus long-term funds. For instance, in Singapore and Malaysia, their pension funds are the largest investors in government securities. However, under the proposal, the SSS and the GSIS stands to lose money by borrowing at market rates and lending below market rates. Eventually, these losses will have to be shouldered by the national government or the members of the SSS and GSIS themselves. A more prudent role for the SSS and GSIS in housing finance might be one where they buy or invest in long-term bonds issued by the national government (thereby matching the maturity structure of their assets with that of their liabilities). In this manner, the viability of the pension funds is not unnecessarily compromised.
28 Under normal circumstances, pension funds are the lenders (not borrowers) in the long-term bond market since they have surplus long-term funds. For instance, in Singapore and Malaysia, their pension funds are the largest investors in government securities. By borrowing at market rates and lending below market rates, the SSS and GSIS stands to lose money if the proposal for it to issue the housing bonds is implemented.

27
6. SUMMARY AND CONCLUSION
Analysis shows that the speed of fiscal consolidation that is envisioned in the President’s Budget for 2002 will not be achieved. It is projected that the fiscal deficit targets that are set in the proposed budget will be exceeded by P7.2 billion in 2001 and by P29.3 billion – P46.6 billion in 2002. This development is primarily an offshoot of the poor revenue forecasts, an issue which was tackled in the “Analysis of the President’s Budget for 2001.”
On the one hand, the present study shows that the fiscal difficulties faced by
the national government in 2001 and 2002 stem largely from its lackluster revenue performance. This is best indicated by the definite downward trend in the tax-to-GNP ratio of all major tax groups since 1997. A closer look at the problem suggests that many of the problems in the tax system are structural. In this regard, the paper supports the administration’s proposal to amend Republic Act 8240 to allow for the indexation of the excise tax on cigarettes and fermented liquour. However, the proposal of the administration to shift to gross income taxation and the proposal from Congress seeking the wholesale abolition of the VAT should be approached with caution. Both would not only tend to introduce risks in revenue generation but would also introduce greater inequity and inefficiency in the tax system.
In the near term, a number of initiatives likewise deserve to be supported: (1) conduct of price survey of tobacco and alcoholic products (as provided under RA 8240) to permit the reclassification of said products for excise tax purposes and provide temporary relief to the erosion of revenues; (2) issuance of DOF regulation refining the use of the term “automobile” so as obviate tax avoidance practices that results from the ambiguity in the definition that is currently being used; (3) expansion of the coverage of the withholding tax system to hard-to-tax groups (like the recent increase in the withholding tax rates on actors, actresses, etc.); (4) immediate issuance of the regulations imposing limitations on the deductions that can be claimed for income tax purposes as provided in the CTRP law; and (5) strengthening of the administration of the VAT, particularly with respect to the sales of services that were covered under the Expanded VAT law.
At the same time, the pressing need to improve tax administration cannot be
overemphasized. One concrete way to improve tax administration is for the BIR has to undertake further work on its computerization program so that the system supports the agency’s increased access to internal as well as external sources of information. This should enhance the BIR’s use of third party information and facilitate automated audit selection.
On the other hand, the fiscal bind also highlights the squeeze on national
government’s nonmandatory expenditures and the ensuing difficulties in providing for the budgetary requirements of economic growth and poverty alleviation. In spite of, or maybe because of this difficulty, the first budget of the Arroyo (GMA) administration appears to have provided unparalleled support to national defense and peace and order over all other sectors. At the same time, the GMA budget proposes to provide more resources for agricultural and agrarian reform after it has cut back on the allocation to these subsectors in the re-enacted 2001 budget. Thus, the President’s Budget for 2002 proposes to shift resources away from the social service sectors in

28
favor of the economic service sectors (notably agriculture) and military and police spending. Although the share of the social services sector in the net budget of the national government in 2002 will be maintained at the 1998-2000 levels, the increase in the allocation for the sector is not enough to allow expenditures in the sector to keep pace with inflation and population growth.
The hard budget constraint faced by the government and the equally critical
need to fund programs that will stimulate growth and promote poverty alleviation has shifted attention to the use of innovative forms of debt-finance like: (1) arrearages or the build up of accounts payables, (2) zero-coupon bonds, and (3) securitization of government assets. The analysis suggests that these new forms of financing tend to make the conventional measure of the fiscal deficit a less reliable measure of the actual change in the government’s liabilities and fiscal sustainability. Thus, to the extent that said measure no longer able to provide a realistic picture of the government’s fiscal position, the use of these new forms of financing suggest the need for a more careful analysis of the fiscal accounts.

29
References Anand, Ritu and Sweder Van Wijnbergen. 1989. Inflation and the Financing of
Government Expenditure: An Introductory Analysis with an Application to Turkey. The World Bank Economic Review 3(1):17-38.
Catsambas, Thanos and Miria Pigato. 1989. The Consistency of Government
Deficits with Macro Adjustments: An Application to Kenya and Ghana, Policy Planning and Research. PPR Working Paper Series 287. Country Economic Department.
Manasan, Rosario G. 2001. “Measuring Progress on the 20:20 Initiative and an
Analyses of Government Expenditure Towards Reducing Human Poverty, 1995-2000.” Report submitted to the UNDP.
Schiavo-Campo, Salvatore and Daniel Tommasi. 1999. Managing Government
Expenditure. Asian Development Bank: Manila. SGV Consulting and Cowater International Inc. 1999. “Assessment of National
Government Accounting System.” Final Report submitted to the UNDP, May. Tolentino, Bruce, Beulah dela Peña, et al. 2001. “101 Facts About Rice in the
Philippines,” Unpublished.

Annex Table 1Growth Rate of National Government Expenditures, By Sectoral Classification, 1975-2002
(%)
Average75-85 86-92 93-98 1996-97 1997-98 1998-99 1999-2k 2000-2001 2001-2002
GRAND TOTAL 15.66 18.07 13.09 18.18 9.28 7.99 17.59 2.55 11.56
Total Economic Services 14.05 8.03 11.29 25.12 -6.53 6.43 19.36 -23.29 12.38
Agriculture 9.84 13.51 10.62 37.37 -27.74 34.16 -8.73 -19.24 34.92 Agrarian Reform 3.72 29.22 17.43 44.92 10.37 1.45 36.42 42.19 28.70 Natural Resources 10.83 19.11 12.34 65.43 -30.02 -4.82 3.07 -3.21 37.71 Industry 18.90 3.98 15.02 2.06 29.40 -37.11 22.36 -9.20 29.39 Trade 2.76 -5.16 8.78 3.83 -14.45 31.39 36.93 -16.39 6.80 Tourism 8.54 21.10 22.22 28.48 17.26 -30.25 49.46 -37.12 39.02 Power & Energy -3.02 22.67 -2.40 120.59 -18.11 196.38 -41.58 10.66 -72.05 Water Resources Devt. 35.48 5.18 -7.87 18.57 -50.61 17.65 -24.37 217.04 -84.30 Transp. & Comm. 9.02 16.98 11.17 19.38 6.99 -1.77 33.52 -31.33 5.24 Other Econ. Services 38.95 -36.60 33.56 -15.59 -44.57 -13.31 76.96 -81.66 194.81
Total Social Services 15.60 19.52 17.86 21.84 8.94 6.61 8.11 1.37 6.61
Education 16.02 21.29 19.22 27.36 12.10 3.70 5.79 3.42 6.63 Health 14.45 20.64 4.41 25.87 -7.55 11.55 -1.71 -7.30 5.72 Social Welfare, Labor & Employment 7.63 22.34 24.99 10.97 1.22 17.74 24.47 11.59 8.85 Housing & Com. Devt. 25.75 -18.50 42.28 -47.18 18.13 39.87 39.36 -56.13 -9.79
National Defense 5.81 15.25 16.43 20.22 12.03 2.78 8.82 -11.62 33.16
Total Public Services 17.28 22.66 13.74 17.46 9.64 -1.60 15.23 0.57 11.67
Public Administration 13.89 23.89 13.18 19.19 8.92 -6.68 12.17 2.86 7.42 Peace and Order 30.73 20.01 15.05 13.74 11.26 9.59 20.98 -3.41 19.53
Others 17.90 22.33 25.73 22.32 11.92 26.12 19.05 8.13 8.76
Debt Service 36.21 27.34 3.85 1.89 27.99 6.51 32.56 28.89 12.48
MEMO ITEM:
IRA 18.61 29.19 24.86 25.54 8.29 23.85 19.92 6.56 10.38 Grand Total - Debt Service 13.77 15.25 16.24 21.85 5.76 8.33 14.23 -4.30 11.24 Grand Total - Debt Service - IRA 13.56 14.13 14.86 21.11 5.23 5.02 12.80 -7.21 11.50 Infrastructure 8.43 16.81 10.18 21.61 4.91 4.64 26.26 -28.13 -2.00 Defense and Peace and Order 9.32 16.89 15.92 17.76 11.75 5.26 13.44 -8.29 27.35

Annex Table 2National Government Expenditures as a Proportion of GNP, By Sectoral Classification, 1975-2002
(%)
Average75-85 86-92 93-98 1997 1998 1999 2000 2001P 2002F
GRAND TOTAL 15.16 18.88 18.94 19.45 19.18 18.51 19.55 18.22 18.51
Total Economic Services 6.24 4.55 4.02 4.33 3.65 3.47 3.73 2.60 2.66
Agriculture 0.79 0.75 0.69 0.93 0.60 0.72 0.59 0.44 0.54 Agrarian Reform 0.09 0.27 0.15 0.18 0.17 0.16 0.19 0.25 0.29 Natural Resources 0.25 0.29 0.27 0.37 0.24 0.20 0.19 0.16 0.20 Industry 0.31 0.16 0.12 0.11 0.13 0.07 0.08 0.07 0.08 Trade 0.05 0.01 0.01 0.01 0.01 0.01 0.01 0.01 0.01 Tourism 0.03 0.02 0.03 0.04 0.04 0.02 0.03 0.02 0.02 Power & Energy 0.77 0.31 0.18 0.10 0.07 0.20 0.10 0.10 0.03 Water Resources Devt. 0.14 0.08 0.04 0.05 0.02 0.02 0.01 0.04 0.01 Transp. & Comm. 2.73 2.16 2.29 2.35 2.26 1.99 2.38 1.49 1.43 Other Econ. Services 1.08 0.49 0.24 0.21 0.10 0.08 0.13 0.02 0.06
Total Social Services 3.17 3.97 4.34 4.94 4.86 4.63 4.49 4.14 4.02
Education 1.88 2.76 3.31 3.78 3.82 3.54 3.37 3.16 3.07 Health 0.57 0.68 0.46 0.53 0.44 0.44 0.39 0.33 0.31 Social Welfare, Labor & Employment 0.24 0.23 0.45 0.54 0.49 0.52 0.58 0.58 0.58 Housing & Com. Devt. 0.48 0.30 0.12 0.10 0.10 0.13 0.16 0.07 0.05
National Defense 1.79 1.32 1.41 1.48 1.49 1.37 1.34 1.08 1.31
Total Public Services 1.71 2.56 2.65 2.78 2.75 2.42 2.50 2.29 2.33
Public Administration 1.17 1.96 1.84 1.93 1.89 1.58 1.59 1.49 1.45 Peace and Order 0.54 0.60 0.81 0.85 0.86 0.84 0.91 0.80 0.87
Others 0.83 0.91 2.74 2.83 2.86 3.23 3.45 3.39 3.36
Debt Service 1.42 5.57 3.78 3.08 3.56 3.39 4.04 4.73 4.84
MEMO ITEM:
IRA 0.62 0.82 2.66 2.81 2.75 3.04 3.27 3.17 3.19 Grand Total - Debt Service 13.74 13.31 15.16 16.37 15.62 15.12 15.51 13.49 13.67 Grand Total-Debt Service-IRA 13.12 12.49 12.50 13.56 12.87 12.08 12.24 10.32 10.48 Infrastructure 3.64 2.56 2.52 2.49 2.36 2.21 2.50 1.63 1.46 Defense and Peace and Order 2.33 1.92 2.21 2.33 2.35 2.21 2.25 1.88 2.18

Annex Table 3Percent Distribution of National Government Expenditures, By Sectoral Classification, 1975-2002
(Percent)
Average75-85 86-92 93-98 1997 1998 1999P 2000 2001P 2002F
GRAND TOTAL 100.00 100.00 100.00 100.00 100.00 100.00 100.00 100.00 100.00
Total Economic Services 41.17 24.10 21.23 22.27 19.05 18.78 19.06 14.26 14.36
Agriculture 5.21 3.98 3.63 4.76 3.15 3.91 3.04 2.39 2.89 Agrarian Reform 0.56 1.43 0.80 0.90 0.91 0.85 0.99 1.37 1.58 Natural Resources 1.67 1.54 1.42 1.92 1.23 1.08 0.95 0.90 1.11 Industry 2.05 0.85 0.64 0.57 0.68 0.40 0.41 0.36 0.42 Trade 0.30 0.05 0.05 0.04 0.03 0.04 0.05 0.04 0.04 Tourism 0.21 0.12 0.17 0.19 0.21 0.13 0.17 0.10 0.13 Power & Energy 5.11 1.66 0.95 0.52 0.39 1.06 0.53 0.57 0.14 Water Resources Devt. 0.92 0.43 0.23 0.24 0.11 0.12 0.08 0.23 0.03 Transp. & Comm. 17.99 11.45 12.11 12.06 11.81 10.74 12.20 8.17 7.70 Other Econ. Services 7.14 2.58 1.24 1.06 0.54 0.43 0.65 0.12 0.31
Total Social Services 20.94 21.05 22.93 25.41 25.33 25.00 22.99 22.72 21.71
Education 12.42 14.64 17.49 19.42 19.93 19.13 17.22 17.36 16.59 Health 3.76 3.59 2.40 2.72 2.30 2.38 1.99 1.80 1.70 Social Welfare, Labor & Employment 1.62 1.21 2.39 2.76 2.55 2.79 2.95 3.21 3.13 Housing & Com. Devt. 3.14 1.61 0.65 0.50 0.55 0.71 0.84 0.36 0.29
National Defense 11.78 7.00 7.43 7.60 7.79 7.41 6.86 5.91 7.06
Total Public Services 11.27 13.54 14.00 14.29 14.34 13.07 12.80 12.56 12.57
Public Administration 7.71 10.36 9.74 9.90 9.87 8.53 8.13 8.16 7.86 Peace and Order 3.55 3.18 4.26 4.39 4.47 4.54 4.67 4.40 4.71
Others 5.47 4.81 14.44 14.57 14.92 17.43 17.64 18.60 18.14
Debt Service 9.38 29.49 19.97 15.85 18.57 18.31 20.65 25.95 26.16
MEMO ITEM:
IRA 4.09 4.34 14.04 14.45 14.32 16.42 16.75 17.40 17.22 Grand Total - Debt Service 90.62 70.51 80.03 84.15 81.43 81.69 79.35 74.05 73.84 Grand Total - Debt Service - IRA 86.54 66.17 65.99 69.70 67.12 65.27 62.61 56.65 56.62 Infrastructure 24.02 13.54209 13.28 12.82 12.30 11.92 12.80 8.97 7.88 Defense & Peace & Order 15.34 10.18 11.69 11.99 12.26 11.95 11.53 10.31 11.77

Annex Table 4Growth Rate of National Government Expenditures, by Economic Classification, 1975-2002
Average75-85 86-92 93-98 1996-97 1997-98 1998-99 1999-2k 2000-01 2001-02
TOTAL 15.66 18.07 13.09 18.18 9.28 7.99 17.59 2.55 11.56
I. Current Operating Expenditures 16.65 22.30 13.30 17.10 12.22 9.17 18.25 7.20 8.72
A. Personal Services 16.71 20.40 17.63 29.35 14.81 4.83 9.24 4.66 7.38
B. MOOE 16.61 23.46 10.49 9.08 10.22 12.69 25.03 8.88 9.56
a. Interests 36.21 27.34 3.85 1.88 27.99 6.51 32.69 28.77 12.56 b. Transfers 12.06 26.05 23.33 15.90 3.35 23.77 23.15 (1.93) 10.41 c. Loan Repayment & Sinking Fund Contrib. (2.38) (85.17) 487.41 (100.00) d. Other MOE 10.33 15.67 10.30 9.36 (2.24) 5.54 15.58 (8.29) (0.35)
II. Capital Outlay 13.98 5.57 11.88 23.83 (5.31) 1.05 13.40 (28.27) 39.70
A. Land, Land Improvements & Structure Outlays (0.08) 22.08 18.26 26.59 21.38 (4.80) 25.97 (33.33) 13.62
B. Buildings & Structures 18.48 6.78 7.06 (28.26) (19.11) 12.34 (16.09) (11.18)
C. Equipment (Others & Livestock & Eqpt. 13.97 13.61 2.46 42.44 (43.17) 51.44 (36.78) (40.28) 532.94 Outlay starting 1992)
D. Investment Outlay 9.89 (8.31) 8.79 33.62 (21.67) (54.33) 51.42 (67.75) 81.43
E. Loans Outlay 94.04 (16.84) (13.73) 18.53 (62.45) 321.08 (16.50) 46.66 (9.92)

Annex Table 5Percentage Distribution of National Government Expenditures, Obligation Basis, by Economic Classification, 1975-2002
Average1975-85 1986-92 1993-98 1997 1998 1999 2000 2001P 2002F
TOTAL 100.00 100.00 100.00 100.00 100.00 100.00 100.00 100.00 100.00
I. Current Operating Expenditures 65.13 80.46 83.74 83.23 85.47 86.40 86.89 90.83 88.51
A. Personal Services 27.05 29.25 33.25 36.38 38.22 37.10 34.47 35.18 33.86
B. MOOE 38.09 51.21 50.49 46.84 47.24 49.30 52.42 55.65 54.65
a. Interests 9.78 29.52 19.97 15.85 18.57 18.31 20.67 25.95 26.18 b. Transfers 8.28 8.32 18.46 18.57 17.56 20.12 21.08 20.15 19.95 1. to local government 4.46 4.58 14.91 15.23 14.74 16.86 17.33 17.95 17.74 2. to all government corporations 1.53 1.87 2.43 2.23 1.91 2.22 2.53 0.94 0.64 3. to others 2.29 1.87 1.12 1.11 0.90 1.04 1.22 1.27 1.56 c. Loan Repayment & Sinking Fund Contrib. 0.46 0.01 0.01 0.00 0.00 0.00 0.00 0.00 0.00
d. Other MOE 19.57 13.36 12.06 12.42 11.11 10.86 10.68 9.55 8.53
II. Capital Outlay 34.87 19.54 16.26 16.77 14.53 13.60 13.11 9.17 11.49
A. Land, Land Improvements & Structure Outlays 10.66 7.24 8.73 8.87 9.85 8.68 9.30 6.05 6.16
B. Buildings & Structures 4.02 4.15 3.34 3.57 2.34 1.75 1.67 1.37 1.09
C. Equipment (Others & Livestock & Eqpt. 1.85 1.71 1.91 2.44 1.27 1.78 0.95 0.56 3.15 Outlay starting 1992) D. Investment Outlay 12.99 2.44 1.55 1.12 0.81 0.34 0.44 0.14 0.22
a. to local government 0.00 0.01 0.00 0.02 0.00 0.00 0.03 0.00 0.01 b. to all government corporations 12.40 2.30 1.32 0.62 0.35 0.26 0.38 0.03 0.16 c. to others 0.58 0.13 0.23 0.48 0.45 0.08 0.03 0.10 0.06
E. Loans Outlay 5.35 4.00 0.73 0.78 0.27 1.04 0.74 1.06 0.86
a. to local government 0.01 0.09 0.06 0.08 0.04 0.09 0.09 0.05 0.07 b. to all government corporations 5.01 3.32 0.46 0.37 0.07 0.92 0.61 1.00 0.79 c. to others 0.33 0.58 0.21 0.32 0.15 0.04 0.04 0.00 0.00