Analysis of the oligopeptide transporter gene family in ... · Analysis of the oligopeptide...
43
Draft Analysis of the oligopeptide transporter gene family in Ganoderma lucidum: structure, phylogeny, and expression patterns Journal: Genome Manuscript ID gen-2016-0120.R2 Manuscript Type: Article Date Submitted by the Author: 28-Aug-2016 Complete List of Authors: xiang, quanju; Sichuan Agricultural University Shen, Keyu; Sichuan Agricultural University Yu, Xiumei; Sichuan Agricultural University Zhao, Ke; Sichuan Agricultural University Gu, Yunfu; Sichuan Agricultural University Zhang, Xiaoping; Sichuan Agricultural University Chen, Xiaoqiong; Sichuan Agricultural University Chen, Qiang; Sichuan Agricultural University Keyword: Expression patterns; Heavy metal stress; Gene structure https://mc06.manuscriptcentral.com/genome-pubs Genome
Transcript of Analysis of the oligopeptide transporter gene family in ... · Analysis of the oligopeptide...

Draft
Analysis of the oligopeptide transporter gene family in
Ganoderma lucidum: structure, phylogeny, and expression patterns
Journal: Genome
Manuscript ID gen-2016-0120.R2
Manuscript Type: Article
Date Submitted by the Author: 28-Aug-2016
Complete List of Authors: xiang, quanju; Sichuan Agricultural University
Shen, Keyu; Sichuan Agricultural University Yu, Xiumei; Sichuan Agricultural University Zhao, Ke; Sichuan Agricultural University Gu, Yunfu; Sichuan Agricultural University Zhang, Xiaoping; Sichuan Agricultural University Chen, Xiaoqiong; Sichuan Agricultural University Chen, Qiang; Sichuan Agricultural University
Keyword: Expression patterns; Heavy metal stress; Gene structure
https://mc06.manuscriptcentral.com/genome-pubs
Genome
Draft
1
Analysis of the oligopeptide transporter gene family in Ganoderma lucidum: structure,
phylogeny, and expression patterns
Quanju Xiang 1#, Keyu Shen
1#, Xiumei Yu
1, Ke Zhao
1, Yunfu Gu
1, Xiaoping Zhang
1,
Xiaoqiong Chen2 and Qiang Chen
1*
1 College of Resource, Sichuan Agricultural University, Chengdu, Sichuan, PR.China.
611130
2 Rice Research Institute of Sichuan Agricultural University , Chengdu, Sichuan, PR. China.
611130
# These authors contributed equally to this work.
∗Corresponding author: Qiang Chen, College of Resource, Sichuan Agricultural University,
Chengdu, Sichuan, P.R.China, Tel. number: 86-28-86920982, E-mail: [email protected]
Page 1 of 42
https://mc06.manuscriptcentral.com/genome-pubs
Genome

Draft
2
Abstract: Oligopeptide transporters (OPTs) are believed to transport broad-ranges of
substrates across the plasma membrane from the extracellular environment into the cell and
are thought to contribute to various biological processes. In the present study, 13 putative
OPTs (Gl-OPT1 to Gl-OPT13) were identified through extensive search of Ganoderma
lucidum genome database. Phylogenetic analysis with OPTs from other fungi and plants
indicates that these genes can be further divided into five groups. Motif compositions of
OPT members are highly conserved in each group, indicative of functional conservation.
Expression profile analysis of the 13 Gl-OPT genes indicated that, with the exception of
Gl-OPT7-9, for which no transcripts were detected, all paralogues were differentially
expressed, suggesting their potential involvement in stress response and functional
development of fungi. Overall, the analyses in this study provide a starting point for
elucidating the functions of OPT in G. lucidum, and for understanding the complexities of
metabolic regulation.
Keywords: Expression patterns; Heavy metal stress; Gene structure
Page 2 of 42
https://mc06.manuscriptcentral.com/genome-pubs
Genome

Draft
3
Introduction
Organisms must transport various organic and inorganic molecules across the cell
plasma membrane for use as nutrient sources. Intake of these substrates is vital for all living
organisms, and several types of transporters are involved in this process. Peptides are
transported into cells and hydrolyzed by peptidases into amino acids, which are used for
protein synthesis or as alternative sources of nitrogen and carbon. Based on sequence
similarity and mechanism of action, three peptide transporter families have been identified
in plants: the ABC-type transporter family, the nitrate transporter 1/peptide transporter
(NRT1/PTR) family, and the oligopeptide transporter family (OPT) (Rentsch et al. 2007;
Zhao et al. 2010; Léran et al. 2014), each of which recognizes and transports different types
of peptides and their derivatives across membranes in an energy-dependent manner.
The OPT family, favoring the transport of tetra- and pentapeptides and glutathione, was
first characterized in yeast (Lubkowitz et al. 1997). Other OPT genes have also been
identified in archaea, bacteria (Yen et al. 2001), fungi (Lubkowitz et al. 1998) and plants
(Koh et al. 2002), but not found in animals (Lubkowitz 2006). OPT proteins appear to have
diverse biological functions. OPT2 from the budding yeast, localized to the peroxisomes,
has been reported to associate with glutathione redox homeostasis and drug detoxification
(Elbaz‐Alon et al. 2014). The coding sequence of AtOPT4 was expressed in a
Saccharomyces cerevisiae sulfur amino acid auxotrophic mutant strain and the protein
conferred growth in the presence of GSH as the sole sulfur source as well as sensitivity to
[35
S]GSH (Zhang et al. 2015). CaOPT1 has been demonstrated to support the growth on
Page 3 of 42
https://mc06.manuscriptcentral.com/genome-pubs
Genome

Draft
4
tetrapeptide KLLG as the sole leucine and lysine source (Lubkowitz et al. 1997). AtOPT3
has been characterized in iron transport and play roles in long-distance iron transport and
partitioning (Wintz et al. 2003). Besides above mentioned biological functions, OPT genes
have been demonstrated to have differential expression profiles upon growth on medium
with different nitrogen sources and at different culture period (Hartmann et al. 2011;
Quan et al. 2016; Reuss and Morschhauser 2006; Skyba et al. 2016; Xiang et al. 2013).
Different biological functions and expression patterns of OPT may contribute to metabolic
regulation, growth development, and stress adaptation.
The substrate transfer abilities or expression profiles of several OPT homologs have
been partially described in plants and fungi, including Arabidopsis (Koh et al. 2002), rice
(Liu et al. 2012b; Vasconcelos et al. 2008), Candida albicans (Lubkowitz et al. 1997; Reuss
and Morschhauser 2006) and Panerochaete chrysosporium (Xiang et al. 2013). However,
there is limited information on the OPTs of macro-fungi such as Ganoderma lucidum. G.
lucidum produces various bioactive compounds that are involved in multiple therapeutic
activities (Boh et al. 2007), making this fungus in high demand in Traditional Chinese
medicines. More than 400 such compounds have been identified in G. lucidum so far (Shiao
2003). Like other white rot basidiomycetes, G. lucidum secretes enzymes that effectively
decompose cellulose, hemicellulose and lignin, which is useful for biomass utilization, fiber
bleaching, and organo-pollutant degradation (Ko et al. 2001).Owing to its importance in
medical and environmental areas, the genome of G. lucidum was recently sequenced and
annotated (Chen et al. 2012b; Liu et al. 2012a). Moreover, several transcriptomic analyses
Page 4 of 42
https://mc06.manuscriptcentral.com/genome-pubs
Genome

Draft
5
of the secondary metabolism and growth development of this fungus have been conducted
(Ren et al. 2013; Xu et al. 2012). Despite these studies, the secondary metabolisms of G.
lucidum, including the ganoderic acids (GAs) biosynthesis pathway (Xu and Zhong 2012),
are still poor understood.
Addition of methyl jasmonate induces GAs production in G. lucidum, corresponding
with the up-regulation of the OPT gene (TDF187) (Ren et al. 2013). This suggests that
OPTs may be involved in GAs biosynthesis. In this study, we first report the identification
and characterization of 13 putative OPT genes in G. lucidum following a genome-wide
search. Next, a detailed analysis of sequence homologies and gene organizations of Gl-OPT
genes are presented. In addition, conserved motifs and expression patterns under various
forms of environmental stress were also investigated. These results provide insights on the
molecular basis of peptide transport, which will be useful for further functional
investigations, facilitating a better understanding of molecular metabolic mechanisms in G.
lucidum.
Materials and methods
Identification of OPT genes in Ganoderma lucidum
Putative members of the OPT gene family were identified in the G. lucidum genome
using BLASTP. A reference OPT protein (SpISP4, Gene ID: 2540364) from
Schizosaccharomyces pombe was chosen as a query sequence for searching the G. lucidum
genome database (http://genome.jgi.doe.gov/Gansp1/Gansp1.home.html). Protein
sequences with an E-value lower than the cutoff of 1E-10 were selected as candidate
Page 5 of 42
https://mc06.manuscriptcentral.com/genome-pubs
Genome
Draft
6
proteins. Additional searches were also performed using a keyword query. Obtained
sequences were further confirmed using the CDD (Conserved Domain Database)
(Marchler-Bauer et al. 2009; Marchler-Bauer et al. 2011) and Pfam databases (Bateman et
al. 2004). The physical and chemical parameters of putative Gl-OPT proteins were
computed using ProtParam in the ExPASy Proteomics Server
(http://www.expasy.org/tools/%20protparam.html). The prediction of trans-membrane
helices was performed with TMHMM Server v. 2.0 (http://www.cbs.dtu.dk/services/
TMHMM/) (Krogh et al. 2001). Subcellular localizations were predicted using the
WoLFPSORT program (http://wolfpsort.org/) (Horton et al. 2007).
Phylogenetic analysis, gene structure, and conserved motif identification
Multiple sequence alignments of amino acid sequences were performed using the
program ClustalX (version 2.0) (Larkin et al. 2007). Phylogenetic analysis of the OPT
proteins was performed using the neighbor-joining method in MEGA v6 (Tamura et al.
2013). The exon/intron organizations of the OPT genes were analyzed online using the
Gene Structure Display Server (GSDS; http://gsds.cbi.pku.edu.cn/) by alignment of the
CDS of each gene with its corresponding genomic DNA sequence (Hu et al. 2014).
Structural motif annotation was performed using the MEME program (Bailey et al. 2015).
Strain and culture conditions
The wild domesticated variety of G. lucidum strain No.1 Rongbao was used in this
study. The fungus was grown on potato dextrose agar plates for 7 days at 30 °C. Three
mycelial discs from the actively growing peripheral region were inoculated into 50 mL
Page 6 of 42
https://mc06.manuscriptcentral.com/genome-pubs
Genome

Draft
7
basal medium (Fahraeus and Reinhammar 1967) or Potato Dextrose Agar medium (PDA).
The cultures were statically incubated at 30 °C in the dark. For nutrient stress studies, 2 g
glucose or 0.25 g asparagine was used in basal medium. For heavy metal treatments, 200
mM CdCl2 or Pb(NO3)2 were added to liquid PDA medium. For expression analysis of the
Gl-OPT genes, total RNA was extracted (see below) from samples after 15 and 30 days of
growth. The 30-day-old mycelia cultured by PDA medium were used to analyze the
transcript profiles of Gl-OPTs in mycelium growth stage. G. lucidum fruiting bodies were
obtained from Chengdu Rongbao Biological Science and Technology Development Co. Ltd
(http://www.scrongbao.com/).
RNA extraction and real-time RT-PCR analysis
Total RNA was extracted using the Trizol reagent (Invitrogen) according to the
manufacturer’s instructions. cDNA was synthesized from 1.5 µg of total RNA using a
reverse transcription kit (TaKaRa), and synthesized cDNAs were used as templates in the
following PCR reactions.
RT-PCR was performed in a 10 µL reaction volume containing 12.5 ng cDNA, 5µL
SsoFast™ EvaGreen® Supermix (Bio-Rad, USA), 400 nM of each primer, and
nuclease-free water to a final volume of 10 µL. Primers used in RT-PCR are shown in
Table S2. Reactions were carried under the following conditions: 95 °C for 2 min, followed
by 40 cycles of 95 °C for 15 s, 63 °C for 20 s and 72 °C for 26 s. A melting curve analysis
was performed to confirm that a single product was generated by each reaction. A negative
control (water) was included in each run. Thermal cycling, fluorescence data collection, and
Page 7 of 42
https://mc06.manuscriptcentral.com/genome-pubs
Genome

Draft
8
data analysis were carried out with the iCycler iQ5 thermocycler (Bio-Rad, USA) detection
system according to the manufacturer’s instructions. The relative expression level of each
Gl-OPT gene was standardized to the expression level of the G. lucidum constitutive gene
ribosomal protein L4 (RPL4) (Xu et al. 2014), with the formula Y = 10 –(∆Ct/3)
× 100%,
(Chen et al. 2014; Chen et al. 2012a), where ∆Ct is the differences in the cycle threshold
value of the target Gl-OPT gene and the control RPL4 products. Mean values were
obtained from three biological replicates.
Results
Identification of OPT genes in G. lucidum
In order to identify members of the OPT gene family in G. lucidum, we searched the
genome database of G. lucidum (http://genome.jgi.doe.gov/Gansp1/Gansp1.home. html)
using SpISP4 as a query. Keyword-searches were also conducted. The obtained sequences
were further confirmed to be OPTs using the CDD (Conserved Domain Database)
(Marchler-Bauer et al. 2009; Marchler-Bauer et al. 2011) and Pfam databases (Bateman et
al. 2004). As a result, a total of thirteen putative OPTs were identified in G. lucidum. These
were given the names Gl-OPT1- Gl-OPT13 (Table 1).
The Gl-OPT genes encode highly hydrophobic polypeptides (grand average
hydrophobicities of 0.267 to 0.508) ranging from 681 to 819 amino acids in length, with
predicted protein isoelectric points ranging from 5.31 to 8.8. These features are similar to
those of the OPT proteins of other fungi (Lubkowitz et al. 1998; Reuss and Morschhauser
2006; Xiang et al. 2013). The Gl-OPT proteins generally contain 12-16 transmembrane
Page 8 of 42
https://mc06.manuscriptcentral.com/genome-pubs
Genome
Draft
9
helices, with molecular weights ranging from 72 to 92 kDa. Protein subcellular localization
prediction revealed that, with the exception of Gl-OPT2 and Gl-OPT4, all candidate
Gl-OPT proteins exhibited a 100% probability of being localized to the plasma membrane.
Gl-OPT2 and Gl-OPT4 are likely localized to membranes such as the endoplasmic
reticulum or peroxisome.
Analysis of Gl-OPT phylogeny and gene structures
In order to examine the relationships among OPT genes, we created a phylogenetic
tree with sequences of Gl-OPT genes and those of OPT genes from other species. Some
fungi and plant OPT genes have been found experimentally to transport oligopeptides or
metal chelates (Fig. 1). The results show that OPT genes can be classified into five groups
according to their phylogenetic relationships, and these have been designated Groups 1-5.
Two OPT proteins from plants (OsOPT1 and AtOPT1) were grouped together (Group 2).
Group 3 includes OPTs from C. albicans and S. cerevisiae, which belong to the
basidiomycota. Most members in Group 3 have been demonstrated to be involved in
peptide transport (Hauser et al. 2000; Lubkowitz et al. 1997; Reuss and Morschhauser
2006). OPT proteins in the other three groups are those that originate from ascomycota and
basidiomycota.
Comparative analysis of gene structures may provide clues for understanding the
evolution of gene families. Thus, exon-intron boundaries for the 13 Gl-OPT genes were
compared. As shown in Fig. 2, with the exception of Gl-OPT4, which contains 33 exons,
Gl-OPT genes contain fewer than 20 exons. Our phylogenetic analysis indicates that genes
Page 9 of 42
https://mc06.manuscriptcentral.com/genome-pubs
Genome
Draft
10
that are grouped together usually possess similar gene structures. For example, the stretch
from the third to the fifth exons is identical in Gl-OPT3 and Gl-OPT5, as evidenced by
identical exons that are connected by slashes in Fig. 2b. Not only are intron positions
shared, but intron phases are also shared between some Gl-OPT genes. For example,
Gl-OPT 8 and Gl-OPT 13 share virtually identical introns positions and phases.
Conserved domains and motifs of OPT proteins
CCD analysis was used to identify structurally conserved domains in OPT proteins.
However, this type of analysis is unable to recognize smaller, individual motifs and those
with more divergent patterns. Thus, MEME (http://meme.sdsc.edu) (Bailey et al. 2015) was
used to study the diversification motifs in Gl-OPT proteins. As a result, ten distinct motifs
were identified in these proteins (Table 2) (Fig. 1). As mentioned above, phylogenetic
analysis divided OPT genes into five groups. Most of the closely related members in each
of these groups share common motif compositions, suggesting functional similarities
between group members (Fig. 1). Among the ten motifs, only motifs 1 and 2 are shared by
all OPT proteins. Members in Group 5 only possess these two motifs. With the exception of
PcOPT1, PcOPT3, and PcOPT4, all members in Group 1 possess all ten motifs. OPT
proteins in plants are divided into the PT and YSL subfamilies, each with specific motifs
(Cao et al. 2011). It is currently unknown whether the distinct motifs among the diverse
groups play unique functional roles. However, the fact that OPT proteins from the same
group possess similar conserved motifs provides additional support to the results of the
phylogenetic analysis. Moreover, differences in motif composition among different groups
Page 10 of 42
https://mc06.manuscriptcentral.com/genome-pubs
Genome
Draft
11
may point to functional diversification of OPT proteins.
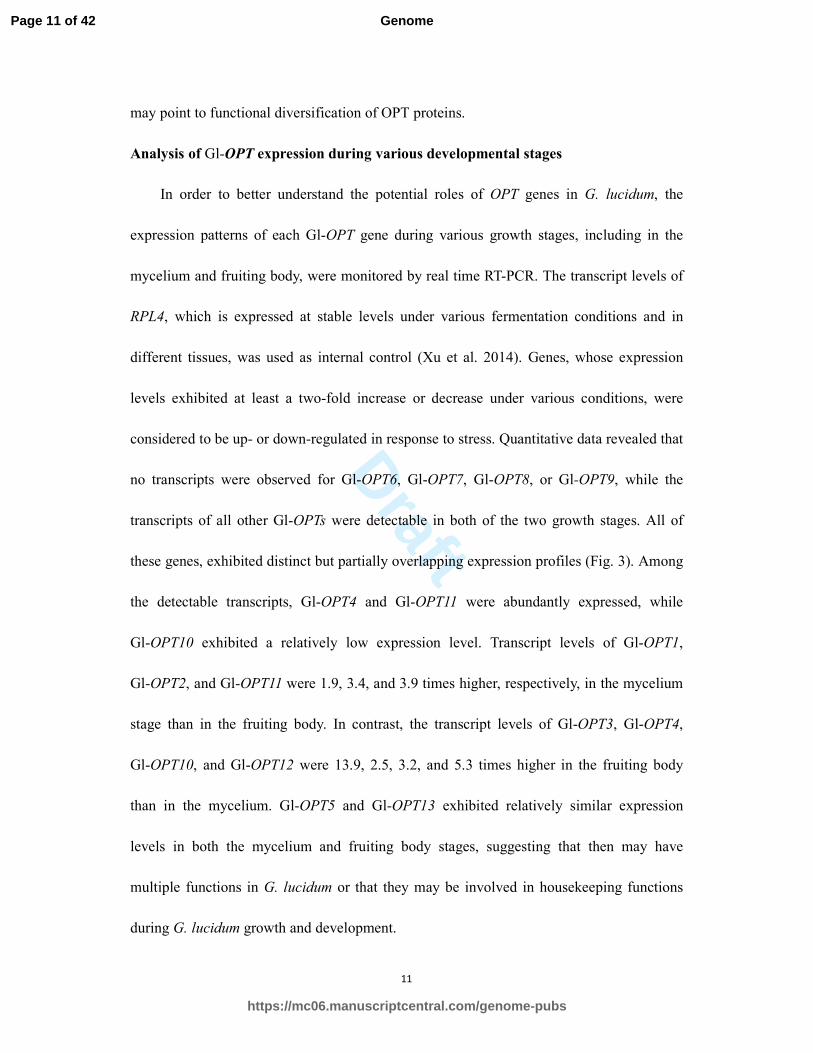
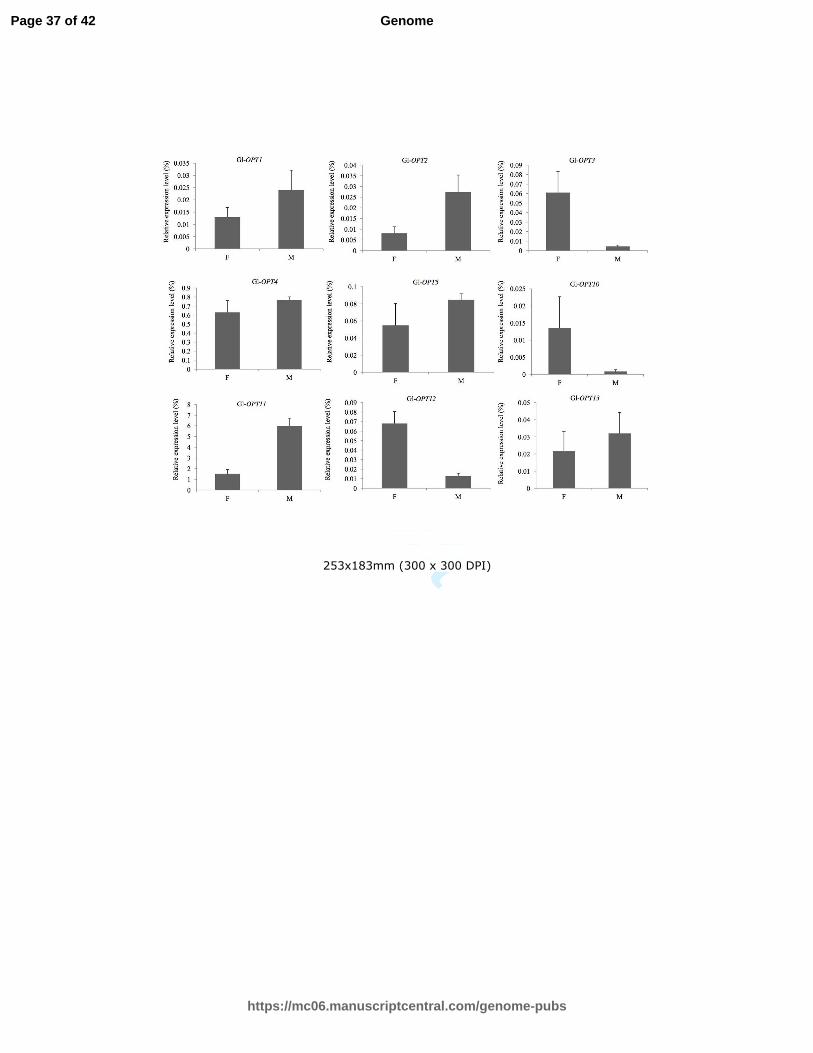
Analysis of Gl-OPT expression during various developmental stages
In order to better understand the potential roles of OPT genes in G. lucidum, the
expression patterns of each Gl-OPT gene during various growth stages, including in the
mycelium and fruiting body, were monitored by real time RT-PCR. The transcript levels of
RPL4, which is expressed at stable levels under various fermentation conditions and in
different tissues, was used as internal control (Xu et al. 2014). Genes, whose expression
levels exhibited at least a two-fold increase or decrease under various conditions, were
considered to be up- or down-regulated in response to stress. Quantitative data revealed that
no transcripts were observed for Gl-OPT6, Gl-OPT7, Gl-OPT8, or Gl-OPT9, while the
transcripts of all other Gl-OPTs were detectable in both of the two growth stages. All of
these genes, exhibited distinct but partially overlapping expression profiles (Fig. 3). Among
the detectable transcripts, Gl-OPT4 and Gl-OPT11 were abundantly expressed, while
Gl-OPT10 exhibited a relatively low expression level. Transcript levels of Gl-OPT1,
Gl-OPT2, and Gl-OPT11 were 1.9, 3.4, and 3.9 times higher, respectively, in the mycelium
stage than in the fruiting body. In contrast, the transcript levels of Gl-OPT3, Gl-OPT4,
Gl-OPT10, and Gl-OPT12 were 13.9, 2.5, 3.2, and 5.3 times higher in the fruiting body
than in the mycelium. Gl-OPT5 and Gl-OPT13 exhibited relatively similar expression
levels in both the mycelium and fruiting body stages, suggesting that then may have
multiple functions in G. lucidum or that they may be involved in housekeeping functions
during G. lucidum growth and development.
Page 11 of 42
https://mc06.manuscriptcentral.com/genome-pubs
Genome
Draft
12
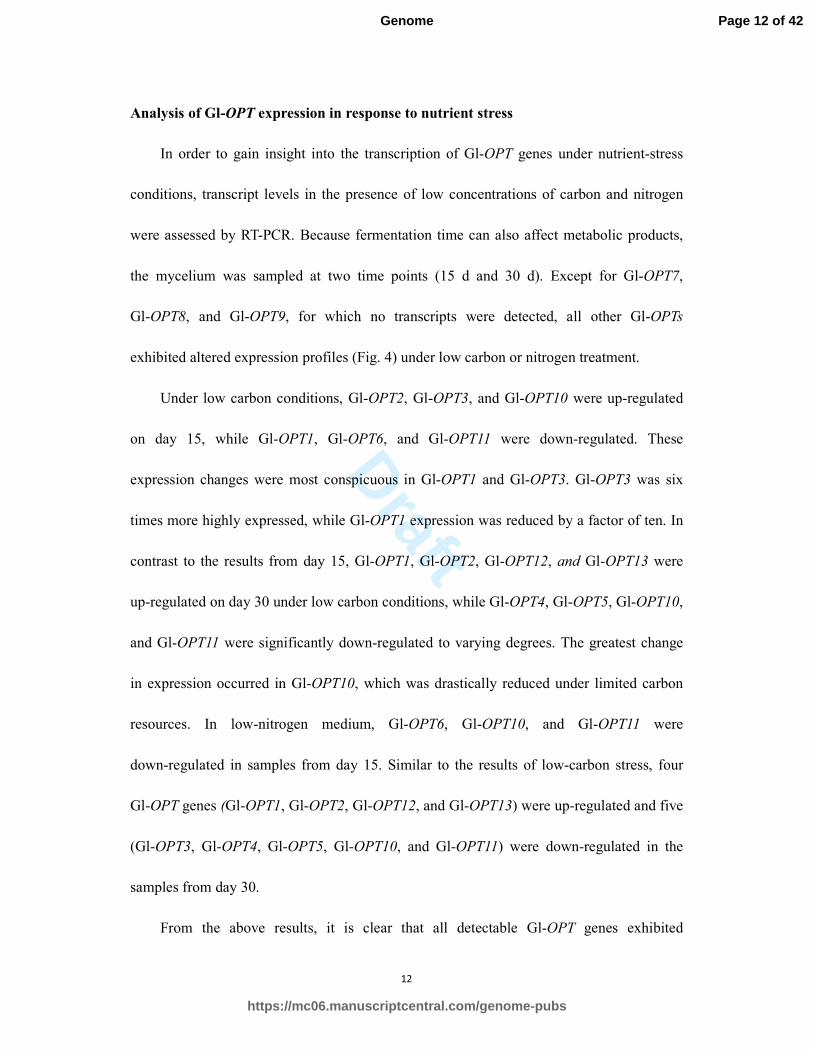
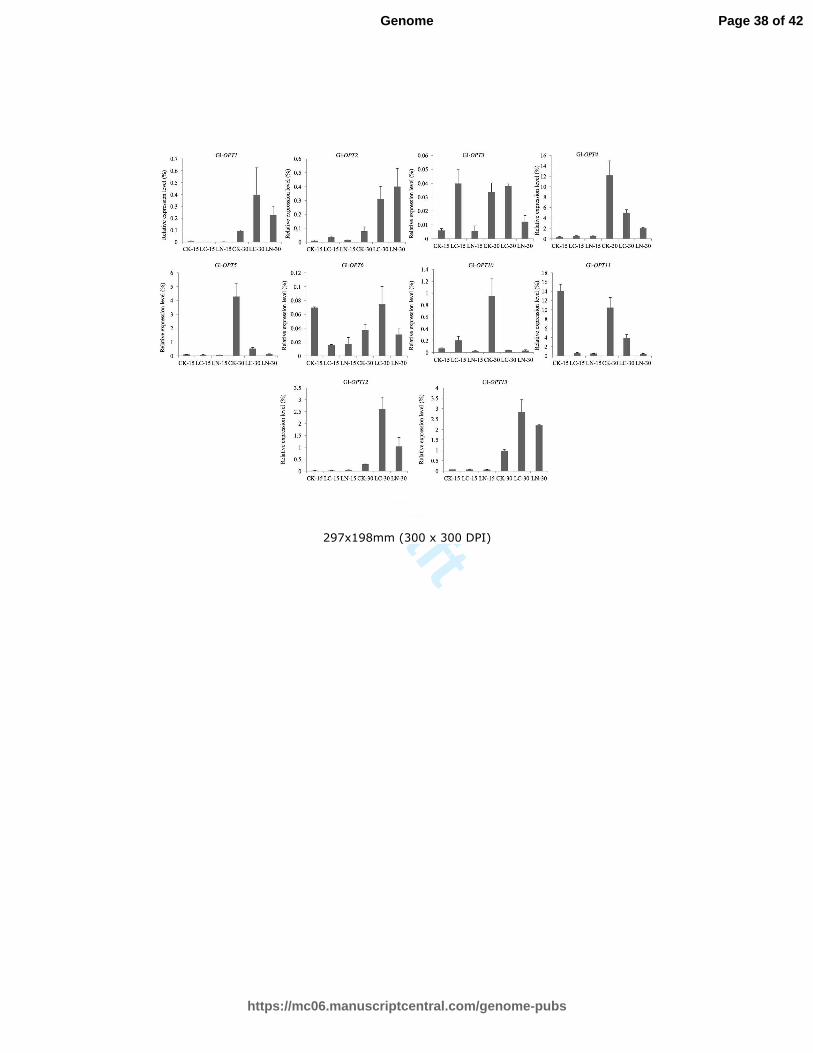
Analysis of Gl-OPT expression in response to nutrient stress
In order to gain insight into the transcription of Gl-OPT genes under nutrient-stress
conditions, transcript levels in the presence of low concentrations of carbon and nitrogen
were assessed by RT-PCR. Because fermentation time can also affect metabolic products,
the mycelium was sampled at two time points (15 d and 30 d). Except for Gl-OPT7,
Gl-OPT8, and Gl-OPT9, for which no transcripts were detected, all other Gl-OPTs
exhibited altered expression profiles (Fig. 4) under low carbon or nitrogen treatment.
Under low carbon conditions, Gl-OPT2, Gl-OPT3, and Gl-OPT10 were up-regulated
on day 15, while Gl-OPT1, Gl-OPT6, and Gl-OPT11 were down-regulated. These
expression changes were most conspicuous in Gl-OPT1 and Gl-OPT3. Gl-OPT3 was six
times more highly expressed, while Gl-OPT1 expression was reduced by a factor of ten. In
contrast to the results from day 15, Gl-OPT1, Gl-OPT2, Gl-OPT12, and Gl-OPT13 were
up-regulated on day 30 under low carbon conditions, while Gl-OPT4, Gl-OPT5, Gl-OPT10,
and Gl-OPT11 were significantly down-regulated to varying degrees. The greatest change
in expression occurred in Gl-OPT10, which was drastically reduced under limited carbon
resources. In low-nitrogen medium, Gl-OPT6, Gl-OPT10, and Gl-OPT11 were
down-regulated in samples from day 15. Similar to the results of low-carbon stress, four
Gl-OPT genes (Gl-OPT1, Gl-OPT2, Gl-OPT12, and Gl-OPT13) were up-regulated and five
(Gl-OPT3, Gl-OPT4, Gl-OPT5, Gl-OPT10, and Gl-OPT11) were down-regulated in the
samples from day 30.
From the above results, it is clear that all detectable Gl-OPT genes exhibited
Page 12 of 42
https://mc06.manuscriptcentral.com/genome-pubs
Genome

Draft
13
differential expression, under carbon or nitrogen stress. This suggests that G. lucidum does
indeed employ the OPT family under nutrient stress. In addition, the transcriptional profiles
of Gl-OPT genes changed significantly over time, which may be in response to the
changing concentrations of nutrients during the course of incubation. As the nutrient supply
decreases, relevant transport systems may be up- or down-regulated in order to the
environment.
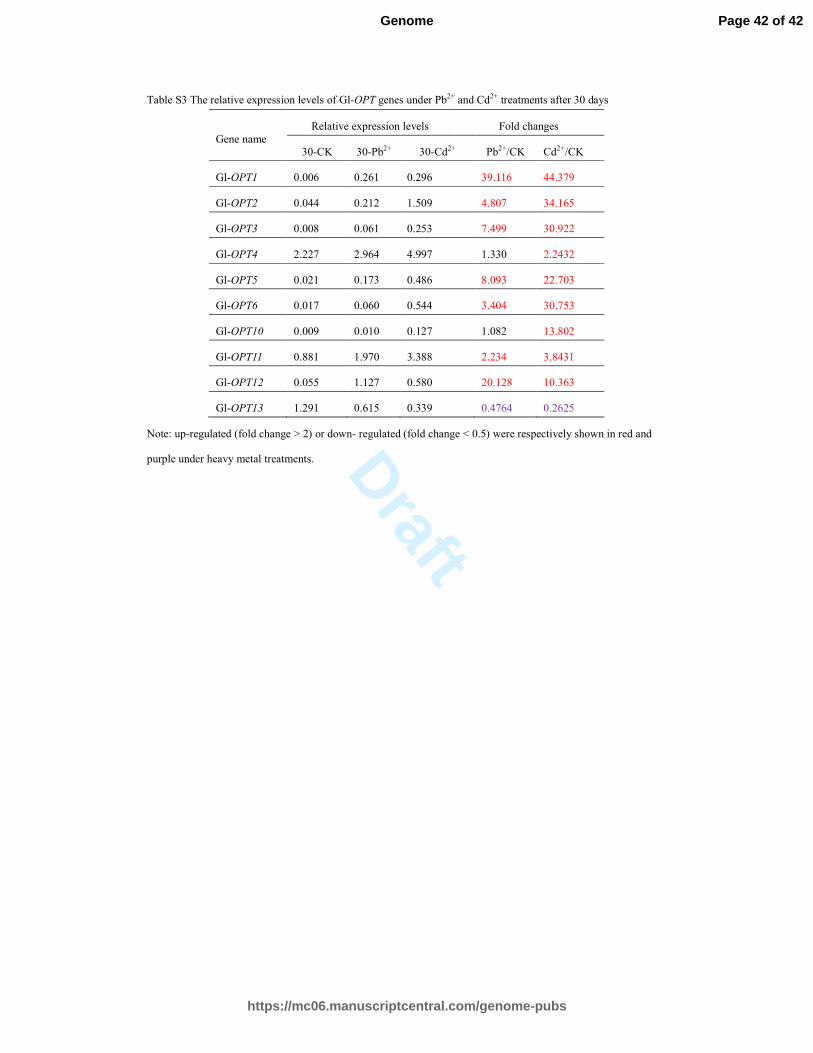
Analysis of Gl-OPT expression in response to heavy metals
OPT genes are suspected to play roles in long-distance heavy metal transport in fungi
and plants. To examine whether the expression of Gl-OPT family members is regulated by
heavy metal stress, G. lucidum hyphae were cultured in the presence of 200 mM CdCl2 and
Pb(NO3)2. Among the 13 Gl-OPT genes, ten genes exhibited differential expression patterns
under heavy metal stress treatment, while no transcripts were detected for three genes
(Gl-OPT7, Gl-OPT8 and Gl-OPT9) (Fig. 5, Table S3).
In response to lead treatment, the expression levels of four genes (Gl-OPT10,
Gl-OPT11, Gl-OPT12 and Gl-OPT13) were reduced in samples from day 15. In contrast,
with the exception of Gl-OPT10 and Gl-OPT13, lead stress enhanced the transcription of
all other detectable Gl-OPT genes in sample from day 30. Gl-OPT13 was down-regulated
and Gl-OPT10 expression remained stable under lead treatment in the samples from 30.
In response to cadmium treatment, the expression levels of seven genes (Gl-OPT1,
Gl-OPT4, Gl-OPT5, Gl-OPT10, Gl-OPT11, Gl-OPT12 and Gl-OPT13) were decreased and
that of one gene (Gl-OPT2) was increased in the samples from day 15, Cadmium stress lead
Page 13 of 42
https://mc06.manuscriptcentral.com/genome-pubs
Genome
Draft
14
to enhanced transcription of all Gl-OPT genes except Gl-OPT13 in samples from day 30.
Up-regulation of genes was more conspicuous in samples from day 30 than those from day
15, exhibiting increases of 2.2- (Gl-OPT4) to 44.4-fold (Gl-OPT1) over expression under
the normal conditions.
Discussion
A search of the G. lucidum genome database identified 13 putative OPT genes
(Gl-OPT1–Gl-OPT13). Sixteen and eight putative OPT genes have been identified in C.
albicans (Reuss and Morschhauser 2006) and P. chrysosporium (Xiang et al. 2013),
respectively. Although multiple mechanisms contribute to the evolution of multigene
families, comprehensive analysis of a phylogenetic tree, exon/intron gene structures, and
conserved motifs allow us to make certain predictions and generalizations about the
possible origin of OPTs, as well as the relationships among OPT. Phylogenetic analysis
suggests that OPT proteins from fungi and plants can be divided into five subgroups. OPT
proteins from plants cluster together and comprise Group 2. Group 3 consists of OPT
proteins from the ascomycota. The other three groups contain OPT proteins from both the
basidiomycota and ascomycota. Phylogenetic analyses can reveal evolutionary conservation
(Cao et al. 2011). The random distribution of Gl-OPT genes across the phylogenetic tree
suggests that the gene duplication events that gave rise to the Gl-OPT genes occurred
before the separation of C. albicans, P. chrysosporium, and G. lucidum from a common
ancestor. Genes with the same functions are often closely related (Afoufa-Bastien et al.
2010; Hu et al. 2010). Such a trend is also found in OPT genes. For example, Group 3,
Page 14 of 42
https://mc06.manuscriptcentral.com/genome-pubs
Genome
Draft
15
includes CaOPT and ScOPT2 proteins, most of which are involved in peptide transport
(Hauser et al. 2000; Lubkowitz et al. 1997).
Differences in the exon/intron structures between genes can be used, to some extent, to
determine the evolutionary history of gene families (Lecharny et al. 2003). In the present
work, comparative analysis of exon/intron boundaries in G. lucidum genes revealed that the
number and position of introns are highly conserved among some OPT genes in G. lucidum.
Gl-OPT8 and Gl-OPT13 share virtually identical exon/intron patterns. Based on analysis of
intron positions in orthologous genes from various eukaryotic lineages, it is inferred that the
common ancestor of animals and plants possessed an intron-rich genome (Rogozin et al.
2005). Thus, Gl-OPT4, which possesses the most introns, may be more closely represent
the ancestral OPT gene, while intron-loss may have occurred in other Gl-OPT genes.
However, more information, especially the chromosomal distribution of the G. lucidum
OPT genes, is necessary to more clearly understand the evolutionary history of G. lucidum
OPT genes.
OPT family members have been experimentally characterized in various fungi and
plants. OPT proteins do not share a common biological function and may be involved in
diverse functions such as oligopeptide transport (Reuss and Morschhauser 2006),
glutathione transport (Cagnac et al. 2004; Pike et al. 2009), heavy metal detoxification and
homeostasis (Lubkowitz et al. 1998; Victoria et al. 2012 ), long distance nitrogen allocation
(Koh et al. 2002). Our expression analysis of the Gl-OPT gene family showed that nine
genes exhibit transcript accumulation across two growth stages, suggesting that these genes
Page 15 of 42
https://mc06.manuscriptcentral.com/genome-pubs
Genome
Draft
16
may be involved in housekeeping functions during G. lucidum growth. Transcripts of
Gl-OPT7-9 were not detected under any condition in this study, and more researches should
be performed to make sure whether they are pseudogenes. OPT proteins have been shown
different profiles of transcriptional response to nutrient or heavy metal stress (Hartmann et
al. 2011; Xiang et al. 2013). However, little is known about the role of Gl-OPT genes in
response to stress. Based on the results of expression analysis, we gleaned some
understanding of the role of Gl-OPT genes in response to stress. Ten of the 13 Gl-OPT
genes exhibited differential expression in response to nutrient and heavy metal stress.
Transcriptional profiles of most Gl-OPT genes were changed under low glucose or
asparagines conditions. One possible explanation for this is that G. lucidum does employ
the function of this family to adapt nutrimental stress. Although Gl-OPT6 expression was
not detected under several normal growth conditions, this gene was specifically
up-regulated under cadmium treatment (Fig. 5). Interestingly, a lot of detectable Gl-OPT
genes were up-regulated under heavy metal treatment after 30 days, with only Gl-OPT13
being down-regulated. Transcriptional profile of Gl-OPT gene family did change greatly
during the later growth stage, which might a response to the changing concentrations of the
metals during the course of incubation. Although it is premature to conclude that these OPT
gens are involved in heavy metal stress in G. lucidum, the above results imply the action of
Gl-OPT genes in response to heavy metal stress.
Acknowledgments
This project is supported by grants from Education Office of Sichuan province (NO.
Page 16 of 42
https://mc06.manuscriptcentral.com/genome-pubs
Genome
Draft
17
15ZA0013) and Sichuan Mushroom Innovational Team of Industry Technology System of
Modern Agriculture.
Page 17 of 42
https://mc06.manuscriptcentral.com/genome-pubs
Genome
Draft
18
References
Afoufa Bastien, D., Medici, A., Jeauffre, J., Coutos-Thévenot, P., Lemoine, R., Atanassova,
R., and Laloi, M. 2010. The Vitis vinifera sugar transporter gene family: Phylogenetic
overview and macroarray expression profiling. BMC Plant Biol. 10: 245. doi:
10.1186/1471-2229-10-245.
Bailey, T.L., Johnson, J., Grant, C.E., and Noble, W.S. 2015. The meme suite. Nucleic
Acids Res. 43(w1): 39-49. doi: 10.1093/nar/gkv416.
Bateman, A., Coin, L., Durbin, R., Finn, R.D., Hollich, V., Griffiths Jones, S., Khanna, A.,
Marshall, M., Moxon, S., and Sonnhammer, E.L. 2004. The pfam protein families database.
Nucleic Acids Res. 32: D138-D141. doi: 10.1093/nar/gkh121.
Boh, B., Berovic, M., Zhang, J., and Zhi-Bin, L. 2007. Ganoderma lucidum and its
pharmaceutically active compounds. Biotech. Annu.Rev. 13: 265-301. doi: 10.1016/S1387
-2656(07)13010-6 .
Cagnac, O., Bourbouloux, A., Chakrabarty, D., Zhang, M.-Y., and Delrot, S. 2004. AtOPT6
transports glutathione derivatives and is induced by primisulfuron. Plant Physiol. 135(3):
1378-1387. doi: 10.1104/pp.104.039859.
Chen, A., Chen, X., Wang, H., Liao, D., Gu, M., Qu, H., Sun, S., and Xu, G. 2014.
Genome-wide investigation and expression analysis suggest diverse roles and genetic
redundancy of pht1 family genes in response to pi deficiency in tomato. BMC Plant Biol.
14: 61. doi: 10.1186/1471-2229-14-61.
Chen, A., He, S., Li, F., Li, Z., Ding, M., Liu, Q., and Rong, J. 2012. Analyses of the
Page 18 of 42
https://mc06.manuscriptcentral.com/genome-pubs
Genome

Draft
19
sucrose synthase gene family in cotton: Structure, phylogeny and expression patterns. BMC
Plant Biol. 12: 85. doi: 10.1186/1471-2229-12-85.
Cao, J., Huang, J., Yang, Y., and Hu, X. 2011. Analyses of the oligopeptide transporter gene
family in poplar and grape. BMC Genomics, 12: 465. doi: 10.1186/1471-2164-12-465.
Chen, S., Xu, J., Liu, C., Zhu, Y., Nelson, D.R., Zhou, S., Li, C., Wang, L., Guo, X., and
Sun, Y. 2012. Genome sequence of the model medicinal mushroom Ganoderma lucidum.
Nat.Commun. 3: 913. doi: 10.1038/ncomms1923.
Elbaz‐Alon, Y., Morgan, B., Clancy, A., Amoako, T.N., Zalckvar, E., Dick, T.P.,
Schwappach, B., and Schuldiner, M. 2014. The yeast oligopeptide transporter opt2 is
localized to peroxisomes and affects glutathione redox homeostasis. FEMS Yeast Res. 14:
1055-1067. doi: 10.1111/1567-1364.12196.
Fahraeus, G. and Reinhammar, B. 1967. Large scale production and purification of laccase
from cultures of the fungus polyporus versicolor and some properties of laccase A. Acta
Chem. Scand. 21(9): 2367-2378
Hartmann, T., Cairns, T.C., Olbermann, P., Morschhäuser, J., Bignell, E.M., and
Krappmann, S. 2011. Oligopeptide transport and regulation of extracellular proteolysis are
required for growth of Aspergillus fumigatus on complex substrates but not for virulence.
Mol.Microbiol. 82(4) : 917-935. doi: 10.1111/j.1365-2958.2011.07868.x.
Hauser, M., Donhardt, A.M., Barnes, D., Naider, F., and Becker, J.M. 2000. Enkephalins are
transported by a novel eukaryotic peptide uptake system. J.Biol.Chem. 275(5): 3037-3041.
doi: 10.1074/jbc.275.5.3037.
Page 19 of 42
https://mc06.manuscriptcentral.com/genome-pubs
Genome

Draft
20
Horton, P., Park, K.J., Obayashi, T., Fujita, N., Harada, H., Adams-Collier, C., and Nakai, K.
2007. Wolf psort: Protein localization predictor. Nucleic Acids Res. 35: W585-W587. doi:
10.1093/nar/gkm259.
Hu, B., Jin, J., Guo, A.Y., Zhang, H., Luo, J., and Gao, G. 2014. GSDS 2.0: An upgraded
gene feature visualization server. Bioinformatics. 31:1296–1297. doi: 10.1093/
bioinformatics /btu817.
Hu, R., Qi, G., Kong, Y., Kong, D., Gao, Q., and Zhou, G. 2010. Comprehensive analysis of
NAC domain transcription factor gene family in Populus trichocarpa. BMC Plant Biol. 10:
145. doi: 10.1186/1471-2229-10-145
Ko, E.M., Leem, Y.E., and Choi, H. 2001. Purification and characterization of laccase
isozymes from the white-rot basidiomycete Ganoderma lucidum. Appl. Microbiol. Biot. 57:
98-102. doi: 10.1007/s002530100727.
Koh, S., Wiles, A.M., Sharp, J.S., Naider, F.R., Becker, J.M., and Stacey, G. 2002. An
oligopeptide transporter gene family in Arabidopsis. Plant Physiol. 128(1): 21-29. doi:
10.1104/pp.010332.
Krogh, A., Larsson, B., Von Heijne, G., and Sonnhammer, E.L. 2001. Predicting
transmembrane protein topology with a hidden markov model: Application to complete
genomes. J.Mol.Biol. 305(3): 567-580. doi: 10.1006/jmbi.2000.4315.
Lubkowitz, M. 2006. The opt family functions in long-distance peptide and metal transport
in plants. Genet. Eng. 27: 35-55. doi: 10.1007/0 -387-25856-6_3.
Larkin, M.A., Blackshields, G., Brown, N., Chenna, R., McGettigan, P.A., McWilliam, H.,
Page 20 of 42
https://mc06.manuscriptcentral.com/genome-pubs
Genome

Draft
21
Valentin, F., Wallace, I.M., Wilm, A., and Lopez, R. 2007. Crustal w and Clustal x version
2.0. Bioinformatics, 23(21): 2947-2948. doi: 10.1093/bioinformatics/btm404.
Lecharny, A., Boudet, N., Gy, I., Aubourg, S., and Kreis, M. 2003. Introns in, introns out in
plant gene families: A genomic approach of the dynamics of gene structure. J. Struct. Funct.
Genomic. 3(111): 111-116. doi:10.1023/A:1022614001371.
Liu, D., Gong, J., Dai, W., Kang, X., Huang, Z., Zhang, H.-M., Liu, W., Liu, L., Ma, J., and
Xia, Z. 2012a. The genome of Ganoderma lucidum provides insights into triterpenes
biosynthesis and wood degradation. PloS one, 7(5): e36146. doi: 10.1371/journal.
Pone.0036146.s002.
Léran S., Varala K., Boyer J.C., Chiurazzi M., Crawford N., Daniel-Vedele F., David L.,
Dickstein R., Fernandez E., Forde B. et al. 2014. A unified nomenclature of NITRATE
TRANSPORTER 1/PEPTIDE TRANSPORTER family members in plants. Trends Plant
Sci. 19(1): 5-9. doi: 10.1016/j.tplants.2013.08.008.
Liu, T., Zeng, J., Xia, K., Fan, T., Li, Y., Wang, Y., Xu, X., and Zhang, M. 2012b.
Evolutionary expansion and functional diversification of oligopeptide transporter gene
family in rice. Rice, 5(12): 1-14. doi: 10.1186/1939-8433-5-12.
Lubkowitz, M.A., Barnes, D., Breslav, M., Burchfield, A., Naider, F., and Becker, J.M.
1998. Schizosaccharomyces pombe isp4 encodes a transporter representing a novel family
of oligopeptide transporters. Mol. Microbiol. 28(4): 729-741. doi: 10.1046/j.1365-
2958.1998.00827.x.
Lubkowitz, M.A., Hauser, L., Breslav, M., Naider, F., and Becker, J.M. 1997. An
Page 21 of 42
https://mc06.manuscriptcentral.com/genome-pubs
Genome
Draft
22
oligopeptide transport gene from Candida albicans. Microbiol. 143: 387-396.
doi: 10.1099/00221287-143-2-387.
Marchler-Bauer, A., Anderson, J.B., Chitsaz, F., Derbyshire, M.K., DeWeese-Scott, C.,
Fong, J.H., Geer, L.Y., Geer, R.C., Gonzales, N.R., and Gwadz, M. 2009. CDD: Specific
functional annotation with the conserved domain database. Nucleic Acids Res. 37:
D205-D210. doi: 10.1093/nar/gkn845.
Marchler-Bauer, A., Lu, S., Anderson, J.B., Chitsaz, F., Derbyshire, M.K., DeWeese-Scott,
C., Fong, J.H., Geer, L.Y., Geer, R.C., and Gonzales, N.R. 2011. CDD: A conserved domain
database for the functional annotation of proteins. Nucleic Acids Res. 39: D225-D229. doi:
10.1093/nar/gkq1189.
Pike, S., Patel, A., Stacey, G., and Gassmann, W. 2009. Arabidopsis OPT6 is an
oligopeptide transporter with exceptionally broad substrate specificity. Plant Cell Physiol.
50(11): 1923-1932. doi: 10.1093/pcp/pcp136.
Quan, X., Zeng, J., Ye, L., Chen, G., Han, Z., Shah, J.M., and Zhang, G. 2016.
Transcriptome profiling analysis for two tibetan wild barley genotypes in responses to low
nitrogen. BMC Plant Biol. 16(30): 1. doi: 10.1186/s12870-016-0721-8.
Ren, A., Li, M.J., Shi, L., Mu, D.S., Jiang, A.L., Han, Q., and Zhao, M.W. 2013. Profiling
and quantifying differential gene transcription provide insights into ganoderic acid
biosynthesis in Ganoderma lucidum in response to methyl jasmonate. PloS one. 8(6):
e65027. doi: 10.1371/journal.pone.006502.
Rentsch D., Schmidt S., and Tegeder M. 2007. Transporters for uptake and allocation of
Page 22 of 42
https://mc06.manuscriptcentral.com/genome-pubs
Genome

Draft
23
organic nitrogen compounds in plants. FEBS Let. 581(12): 2281–2289. doi:
10.1016/j.febslet.2007.04.013.
Reuss, O., and Morschhauser, J. 2006. A family of oligopeptide transporters is required for
growth of Candida albicans on proteins. Mol. Microbiol. 60(3): 795-812. doi:
10.1111/j.1365-2958.2006.05136.x.
Rogozin, I.B., Sverdlov, A.V., Babenko, V.N., and Koonin, E.V. 2005. Analysis of evolution
of exon-intron structure of eukaryotic genes. Briefings Bioinform. 6(2): 118-134. doi:
10.1093/bib/6.2.118.
Shiao, M.S. 2003. Natural products of the medicinal fungus Ganoderma lucidum:
Occurrence, biological activities, and pharmacological functions. Chem. Rec. 3(3): 172-180.
doi: 10.1002/tcr.10058.
Skyba, O., Cullen, D., Douglas, C.J., and Mansfield, S.D. 2016. Gene expression patterns
of wood decay fungi Postia placenta and Phanerochaete chrysosporium are influenced by
wood substrate composition during degradation. Appl. Environ. Microbiol. 82(19):
00134-16. doi: 10.1128/AEM.00134-16.
Tamura, K., Stecher, G., Peterson, D., Filipski, A., and Kumar, S. 2013. Mega6: Molecular
evolutionary genetics analysis version 6.0. Mol.Biology Evol. 30(12): 2725-2729. doi:
10.1093/molbev/mst197.
Vasconcelos, M.W., Li, G.W., Lubkowitz, M.A., and Grusak, M.A. 2008. Characterization
of the PT clade of oligopeptide transporters in rice. Plant Genome, 1(2): 77-88. doi:
10.3835/plantgenome2007.10.0540.
Page 23 of 42
https://mc06.manuscriptcentral.com/genome-pubs
Genome
Draft
24
Victoria, F.d.C.; Bervald, C.M.P.; da Maia, L.C.; de Sousa, R.O.; Panaud, O.; de Oliveira,
A.C., and Gustafson, P. 2012. Phylogenetic relationships and selective pressure on gene
families related to iron homeostasis in land plants. Genome, 55(12): 883-900. doi:10.1139/
gen-2012-0064.
Wintz, H., Fox, T., Wu, Y.Y., Feng, V., Chen, W.Q., Chang, H.S., Zhu, T., and Vulpe, C.
2003. Expression profiles of Arabidopsis thaliana in mineral deficiencies reveal novel
transporters involved in metal homeostasis. J. Biol. Chem. 278: 47644–47653. doi:
10.1074/jbc.M309338200.
Xiang, Q., Wang, Z., Zhang, Y., and Wang, H. 2013. An oligopeptide transporter gene
family in Phanerochaete chrysosporium. Gene, 522: 133-141. doi: 10.1016/j.gene.
2013.03.069.
Xu, J.W., Zhao, W., Xu, Y.N., and Zhong, J.J. 2012. Isolation and analysis of differentially
expressed genes during asexual sporulation in liquid static culture of Ganoderma lucidum
by suppression subtractive hybridization. Mol.Biol.Rep. 39(4): 3603-3610. doi: 10.1007/
s11033-011-1134-2.
Xu, J., Xu, Z., Zhu, Y., Luo, H., Qian, J., Ji, A., Hu, Y., Sun, W., Wang, B., and Song, J.
2014. Identification and evaluation of reference genes for qRT-PCR normalization in
Ganoderma lucidum. Curr. Microbiol. 68(1) : 120-126. doi: 10.1007/s00284-013-0442-2.
Xu, Y.N., and Zhong, J.J. 2012. Impacts of calcium signal transduction on the fermentation
production of antitumor ganoderic acids by medicinal mushroom Ganoderma lucidum.
Biotechnol.Adv. 30(6) : 1301-1308. doi: 10.1016/j.biotechadv.2011.10.001.
Page 24 of 42
https://mc06.manuscriptcentral.com/genome-pubs
Genome
Draft
25
Zhang, Z., Xie, Q., Jobe, T.O., Kau, A.R., Wang, C., Li, Y., Qiu, B., Wang, Q.,
Mendoza-Cózatl, D.G., and Schroeder, J.I. 2015. Identification of AtOPT4 as a plant
glutathione transporter. Mol. Plant. 9(3) : 481-484. doi: 10.1016/j.molp.2015.07.013.
Zhao X., Huang J., Yu H., Wang L., and Xie W. 2010. Genomic survey, characterization and
expression profile analysis of the peptide transporter family in rice (Oryza sativa L.). BMC
Plant Biol. 10: 92. doi: 10.1186/1471-2229-10-92.
1
Page 25 of 42
https://mc06.manuscriptcentral.com/genome-pubs
Genome

Draft
25
Table 1 Putative oligopeptide transporter genes identified in the Ganoderma lucidum genome
Gene name Genomic position CDS Protein
Length
Mol Wt
(kDa) †
pI‡ GRAVY§ TMs|| P.L¶
Gl-OPT1 scaffold_10:1696394-1699036 2175 724 81.62 6.46 0.412 14 plas: 26
Gl-OPT2 scaffold_1:1298969-1302665 2436 811 91.48 8.68 0.353 15 plas: 22, E.R.: 3
Gl-OPT3 scaffold_11:610059-613598 2298 765 86.25 7.96 0.372 12 plas: 25
Gl-OPT4 scaffold_5:2002661-2007294 2460 819 92.53 7.98 0.373 16 plas: 23, pero: 2
Gl-OPT5 scaffold_11:626013-628899 2337 778 87.67 7.94 0.355 15 plas: 26
Gl-OPT6 scaffold_3:2562431-2565761 2328 775 87.25 7.59 0.369 14 plas: 26
Gl-OPT7 scaffold_3:2359131-2362230 2088 695 74.23 8.93 0.508 13 plas: 26
Gl-OPT8 scaffold_7:834937-838016 2262 753 84.68 5.37 0.267 13 plas: 26
Gl-OPT9 scaffold_5:1721901-1725213 2253 750 83.46 8.36 0.335 16 plas: 26
Gl-OPT10 scaffold_14:542286-546000 2355 784 85.78 6.67 0.328 13 plas: 26
Page 26 of 42
https://mc06.manuscriptcentral.com/genome-pubs
Genome

Draft
26
Gl-OPT11 scaffold_12:1358955-1362067 2181 726 77.38 7.10 0.445 13 plas: 27
Gl-OPT12 scaffold_15:144626-147528 2046 681 72.68 5.63 0.492 15 plas: 26
Gl-OPT13 scaffold_9:954967-958114 2286 761 84.93 5.81 0.285 15 plas: 26
† Mol Wt: molecular weight; ‡ pI: protein isoelectric point; § GRAVY grand average of hydropathicity; || Number of transmembrane helices predicted
with TMHMM Server; ¶ P.L : PSORT predictions: Plas (plasma membrane), E.R. (endoplasmic reticulum), pero. (peroxysome).
Page 27 of 42
https://mc06.manuscriptcentral.com/genome-pubs
Genome

Draft
27
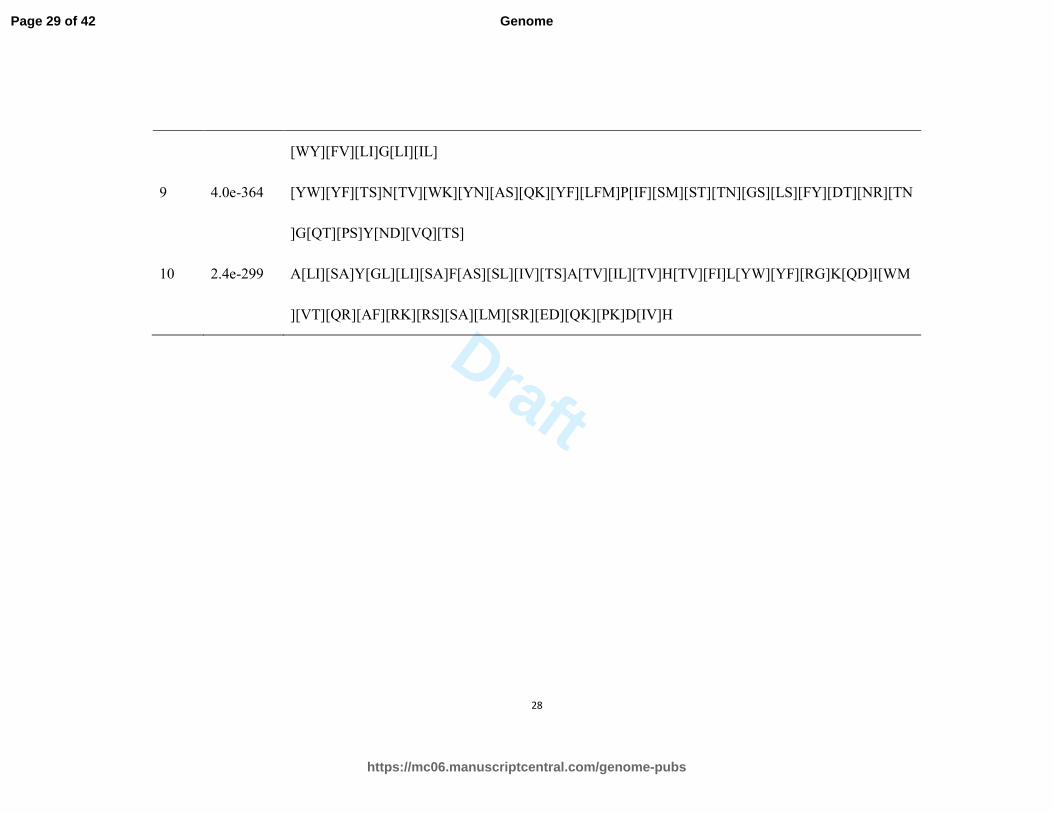
Table 2 Motif sequences identified by MEME
Motif E-value Multilevel consensus sequence
1 1.4e-574 [QT][AS][NT][FM][TL][SQ]D[LF]K[LT]G[HQ]Y[ML]K[IL]PPR[AV][MT]F[YV][VC]Q[LY][IL]
[GA]
2 1.8e-666 [VT][LM][SA][TS][QA][LF][IL]G[FY][GS][LI][AG]G[IL][LA]R[RK][FL][LV]Y[YW][PK][PT][SK]
[MA][IV][WY]P[SA][NT]L[VP][TV][CV][AT]L[FN][NQ] [TA]LH
3 1.8e-459 W[WF][TK]KYNY[YI]L[SA][AT][AG]L[DN][AG]G[TV][AQ][IV][SM][ST][IF][IL][FS]F[AC][VL]
4 6.7e-392 [LT]NPGP[FY][NT][IV]KE[HQ][VA][LI][IA][TS][IL][MF][AS][SN][VT][GA]
5 4.4e-334 [YE][FW][IV]P[GS][YF]F[PQ][AL]L[ST][GY][FY][NS][WI]VI[CT][WL][IA][VK][PQ][ND] [NS]
6 5.2e-245 [RK][LM]M[KS][KA]Y[PK][EQ]VP[ED]WWY[LA]
7 7.3e-410 [GS][LT]N[VQ][LI][TV][EQ][LM][IV][IX]G[YA][AV][LI]PG[RK]P[IV]A[NM][ML][YM][FI][KS][
TA][YW]G[YH]
8 8.5e-419 [SR][PN][YG][PE][EV][VA][RS][AS][AV][VL][SA][NP][TY]DDP[TS][ML]P[VA][NL]T[FL]R[AT]
Page 28 of 42
https://mc06.manuscriptcentral.com/genome-pubs
Genome
Draft
28
[WY][FV][LI]G[LI][IL]
9 4.0e-364 [YW][YF][TS]N[TV][WK][YN][AS][QK][YF][LFM]P[IF][SM][ST][TN][GS][LS][FY][DT][NR][TN
]G[QT][PS]Y[ND][VQ][TS]
10 2.4e-299 A[LI][SA]Y[GL][LI][SA]F[AS][SL][IV][TS]A[TV][IL][TV]H[TV][FI]L[YW][YF][RG]K[QD]I[WM
][VT][QR][AF][RK][RS][SA][LM][SR][ED][QK][PK]D[IV]H
Page 29 of 42
https://mc06.manuscriptcentral.com/genome-pubs
Genome
Draft
29
Figure captions:
Fig. 1 Phylogenetic relationships and motif compositions based on amino acid sequences of
OPT genes within G. lucidum and other species. (a) Phylogenetic tree was generated by
Mega6.0 using the neighbor-joining method. The five major groups are designated from Group
1 to 5. Groups with circles and triangles have been functionally demonstrated to transport
oligopeptides and metal compounds, respectively. (b) A schematic representation of conserved
motifs and P value (obtained by MEME) in OPT proteins. Detailed information of Gl-OPT
genes from G. lucidum are given in Table 1, and gi numbers of OPTs from other species are
given as: PcOPT1, gi|430007707|; PcOPT2, gi|430007709|; PcOPT3, gi|4300077011|; PcOPT4,
gi|4300077013|; PcOPT5, gi|4300077015|; PcOPT6, gi|4300077017|; PcOPT7, gi|4300077019|;
PcOPT8, gi|4300077022|; PcOPT9, gi|4300077024|; PcOPT10, gi|4300077026|; PcOPT11,
gi|4300077028|; PcOPT12, gi|4300077030|; PcOPT13, gi|4300077032|; PcOPT14,
gi|4300077034|; PcOPT15, gi|4300077036|; PcOPT16, gi|4300077038|; AtOPT1, gi|9758213|;
OsOPT1, gi|1002228577|; SpISP4, |19112445|;ScOPT1, gi|6322249|; ScOPT2, gi|6325452|;
CaOPT1, gi|51094117|; CaOPT2, gi| 87045960|; CaOPT3, gi| 87045962|; CaOPT4, gi|
87045966|; CaOPT5, gi| 87045970|; CaOPT6, gi| 87045972|; CaOPT7, gi| 87045976|; CaOPT8,
gi| 87045980|.
Page 30 of 42
https://mc06.manuscriptcentral.com/genome-pubs
Genome
Draft
30
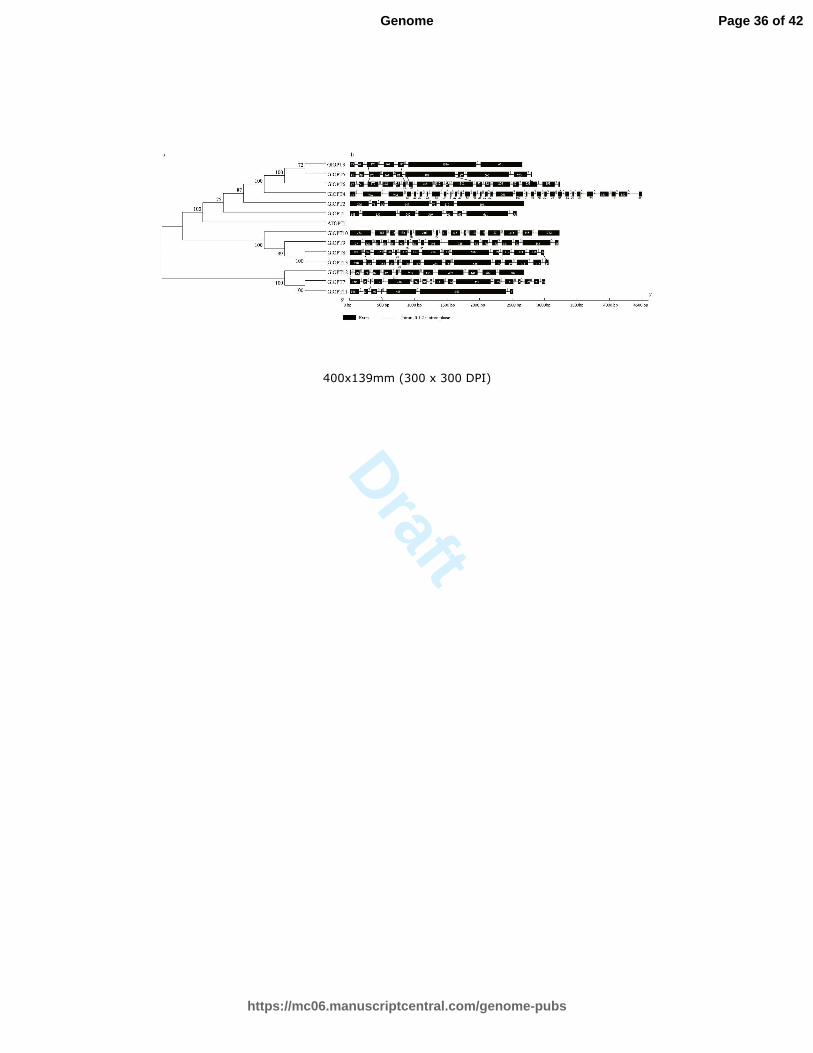
Fig. 2 Phylogenetic relationships and gene structure schematic of Gl-OPT genes. (a)
Phylogenetic tree drawn as described in Figure 1 using AtOPT1 as an outgroup. (b) Black
boxes represent exons and black lines represent introns. Intron phases are shown on top of
introns. Identical exons are connected with slashes.
Page 31 of 42
https://mc06.manuscriptcentral.com/genome-pubs
Genome

Draft
31
Fig. 3 Expression profiles of Gl-OPT genes during different developmental stages. qRT-PCR
analyses were used to assess Gl-OPT transcript levels in mycelium (M) and fruiting body (F).
The relative expression levels of each Gl-OPT gene was indicated as percentage to the
expression of internal control, the constitutively expressed RPL4. The value represents the
expression percentage of Gl-OPT gene accounts for the expression of RPL4. Data represent
means of three replicates and denote relative expression levels.
Page 32 of 42
https://mc06.manuscriptcentral.com/genome-pubs
Genome
Draft
32
Fig. 4 Expression profiles of Gl-OPT genes in response to nutrient stress. qRT-PCR analyses
were used to assess Gl-OPT transcript levels in response to low carbon and nitrogen
concentrations. CK-15, LC-15, and LN-15 refer to samples collected after 15 d under normal,
low carbon and low nitrogen conditions, respectively, while CK-30, LC-30, and LN-30 refer to
samples collected after 30 d under normal, low carbon, and low nitrogen conditions,
respectively. The relative expression levels of each Gl-OPT gene was indicated as percentage
to the expression of internal control, the constitutively expressed RPL4. The value represents
the expression percentage of Gl-OPT gene accounts for the expression of RPL4. Data represent
means of three replicates and denote relative expression levels.
Page 33 of 42
https://mc06.manuscriptcentral.com/genome-pubs
Genome
Draft
33
Fig. 5 Expression profiles of Gl-OPT genes in response to cadmium (Cd2+
) and lead (Pb2+
)
treatments. qRT-PCR analyses were used to assess Gl-OPT transcript levels in response to
Cd2+
and Pb treatments. CK-15, Cd2+
-15, and Pb2+
-15 refer to samples collected after 15 d
under normal, cadmium, and lead treatment conditions, respectively, while CK-30, Cd2+
-30,
and Pb2+
-30 refer to samples collected after 30 d under normal, cadmium, and lead treatment
conditions, respectively. The relative expression levels of each Gl-OPT gene was indicated as
percentage to the expression of internal control, the constitutively expressed RPL4. The value
represents the expression percentage of Gl-OPT gene accounts for the expression of RPL4.
Data represent means of three replicates and denote relative expression levels.
Page 34 of 42
https://mc06.manuscriptcentral.com/genome-pubs
Genome

Draft
650x300mm (300 x 300 DPI)
Page 35 of 42
https://mc06.manuscriptcentral.com/genome-pubs
Genome
Draft
400x139mm (300 x 300 DPI)
Page 36 of 42
https://mc06.manuscriptcentral.com/genome-pubs
Genome
Draft
253x183mm (300 x 300 DPI)
Page 37 of 42
https://mc06.manuscriptcentral.com/genome-pubs
Genome
Draft
297x198mm (300 x 300 DPI)
Page 38 of 42
https://mc06.manuscriptcentral.com/genome-pubs
Genome

Draft
281x175mm (300 x 300 DPI)
Page 39 of 42
https://mc06.manuscriptcentral.com/genome-pubs
Genome

Draft
Table S1 Identity matrix for the putative Ganoderma lucidum OPT genes
Nucleotide Identity (%)
Amino acid
identity (%)
Gl-OPT1 Gl-OPT2 Gl-OPT3 Gl-OPT4 Gl-OPT5 Gl-OPT6 Gl-OPT7 Gl-OPT8 Gl-OPT9 Gl-OPT10 Gl-OPT11 Gl-OPT12 Gl-OPT13
Gl-OPT1 55.97 59.35 53.58 59.12 58.41 42.59 47.22 46.29 46.51 44.54 41.55 48.22
Gl-OPT2 43.98 62.40 55.30 59.40 58.95 44.43 46.58 45.77 45.23 44.63 40.08 45.85
Gl-OPT3 44.85 51.55 64.65 79.34 75.62 46.24 49.14 49.07 49.28 48.42 44.48 49.44
Gl-OPT4 44.59 46.46 62.57 63.50 63.76 42.84 44.24 45.28 44.31 43.74 40.22 44.24
Gl-OPT5 45.07 49.20 77.75 62.58 72.70 45.91 48.22 46.93 47.43 46.87 42.83 48.40
Gl-OPT6 45.28 48.59 75.10 62.17 72.4 44.71 48.39 47.90 47.17 47.10 42.77 47.82
Gl-OPT7 17.89 17.55 14.65 15.14 16.22 16.56 41.09 39.63 42.00 74.21 43.03 42.01
Gl-OPT8 29.26 27.35 28.25 27.49 26.93 27.40 18.71 54.76 52.02 42.19 39.51 79.73
Gl-OPT9 29.31 27.82 27.38 26.69 27.11 27.02 16.59 44.41 49.03 39.80 38.99 53.85
Gl-OPT10 25.62 25.38 27.43 25.17 27.64 28.01 16.19 37.09 35.29 42.06 37.98 50.93
Gl-OPT11 18.14 19.66 16.92 16.72 17.13 17.63 78.76 18.11 16.14 16.10 43.57 42.81
Gl-OPT12 17.37 16.23 16.64 15.02 16.78 15.31 26.44 15.68 17.48 14.48 28.13 40.50
Gl-OPT13 28.97 25.83 28.13 26.33 26.46 25.95 18.23 85.92 43.80 37.90 17.60 15.08
Page 40 of 42
https://mc06.manuscriptcentral.com/genome-pubs
Genome

Draft
Table S2 Gene-specific primers used for Real-time RT-PCR amplification of Ganoderma lucidum OPT genes.
Gene name Forward Primer (5’-3’) Reverse Primer (5’-3’)
Gl-OPT1 TGGGCTCGTTCTTCTGGTTC ATTCCAAGGCCGCCAGATAC
Gl-OPT2 ACCATTTCTTCACT TCGCGC GTAAAACCAAGCGTGCGGAA
Gl-OPT3 TTCTTCGTCTTCCTCGGCTC GAAGAGCTGGTTGACGACGA
Gl-OPT4 TGCCCTTTGGTTGTCTGGTT GCGACAGGAAGCCGATCATA
Gl-OPT5 TTGACAAGGAGCTCGTCGTC TAGTGTTCACCGGCATGTCC
Gl-OPT6 AACTATGTACTGTCCGCGGC TAAAGGAGACGGTGTTGCCC
Gl-OPT7 TTGGACGCTCTACCGGATTG GATCGAGCCGCCAAAGAAAC
Gl-OPT8 GCCACAAACACTGCTCGTTT TGAATGGCCCAGGGTTGATC
Gl-OPT9 TGCTACAACTTCAGCCTGGG TGGGTCGTCGATATCTTGCG
Gl-OPT10 TCATCGCTCTTCTCCTTGGC AAGTAGAGGTTCGCAACGGG
Gl-OPT11 GGTGTGATCTTCGACTGGCA GGAGGCGTTGATACCGGAAA
Gl-OPT12 ATGGTCCTTTTCGCGGTTCT TTGAGGAACCCAATCGCGAA
Gl-OPT13 AGAAGAAAGCCGTGGATGGG AGACCTTGATCGCAACCTCG
RPL4 GTCAACAAGGGCGTTCTCTT GTCAACAAGGGCGTTCTCTT
Page 41 of 42
https://mc06.manuscriptcentral.com/genome-pubs
Genome
Draft
Table S3 The relative expression levels of Gl-OPT genes under Pb2+ and Cd2+ treatments after 30 days
Gene name
Relative expression levels Fold changes
30-CK 30-Pb2+ 30-Cd2+ Pb2+/CK Cd2+/CK
Gl-OPT1 0.006 0.261 0.296 39.116 44.379
Gl-OPT2 0.044 0.212 1.509 4.807 34.165
Gl-OPT3 0.008 0.061 0.253 7.499 30.922
Gl-OPT4 2.227 2.964 4.997 1.330 2.2432
Gl-OPT5 0.021 0.173 0.486 8.093 22.703
Gl-OPT6 0.017 0.060 0.544 3.404 30.753
Gl-OPT10 0.009 0.010 0.127 1.082 13.802
Gl-OPT11 0.881 1.970 3.388 2.234 3.8431
Gl-OPT12 0.055 1.127 0.580 20.128 10.363
Gl-OPT13 1.291 0.615 0.339 0.4764 0.2625
Note: up-regulated (fold change > 2) or down- regulated (fold change < 0.5) were respectively shown in red and
purple under heavy metal treatments.
Page 42 of 42
https://mc06.manuscriptcentral.com/genome-pubs
Genome


![Mrt, a Gene Unique to Fungi, Encodes an … a Gene Unique to Fungi, Encodes an Oligosaccharide Transporter and Facilitates Rhizosphere Competency in Metarhizium robertsii1[C][W] Weiguo](https://static.fdocuments.us/doc/165x107/5b0b28ff7f8b9a0b0f8cecc2/mrt-a-gene-unique-to-fungi-encodes-an-a-gene-unique-to-fungi-encodes-an-oligosaccharide.jpg)