Analysis of the effects of metformin administered alone or ...oro.open.ac.uk/49296/1/PhD thesis_...
156
Maria Valeria Maiorana Degree in Biotechnology Analysis of the effects of metformin administered alone or in combined treatments in colorectal cancer Thesis presented to The Open University of Milton Keynes for the Degree of Doctor of Philosophy Discipline: Life and Biomolecular Sciences Date of Submission: 31st January 2017 Affiliated Research Centre: Fondazione IRCCS “Istituto Nazionale dei Tumori”
Transcript of Analysis of the effects of metformin administered alone or ...oro.open.ac.uk/49296/1/PhD thesis_...

Maria Valeria Maiorana
Degree in Biotechnology
Analysis of the effects of metformin administered alone
or in combined treatments in colorectal cancer
Thesis presented to The Open University of Milton Keynes
for the Degree of Doctor of Philosophy
Discipline: Life and Biomolecular Sciences
Date of Submission: 31st January 2017
Affiliated Research Centre: Fondazione IRCCS “Istituto Nazionale dei Tumori”

1
TABLE OF CONTENTS
LIST OF FIGURES 6
LIST OF TABLES 8
ABBREVIATIONS 10
ABSTRACT 12
CHAPTER 1. INTRODUCTION 13
1.1 Colorectal cancer 13
1.1.1 Risk factors for colorectal cancer 13
1.1.2 Histopathological characteristics of colorectal cancer 14
1.1.3 Genetics of Colorectal cancer 16
1.1.3.1 Vogelgram – a progression model for colorectal
cancer
17
1.1.4 Colorectal cancer stem cells 19
1.1.5 Colorectal cancer stages 21
1.1.6 Treatments for Colorectal Cancer 23
1.1.6.1 Chemotherapy 23
1.1.6.2 Targeted therapies for colorectal cancer 24
1.1.6.2.1 New targeted therapies for colorectal
cancer
26
1.1.6.3 New frontiers: immunobased therapies 27
1.2 Metformin 28
1.2.1 Metformin as anticancer drug 28
1.2.1.1 Indirect or systemic effects of metformin on
cancer cells
29
1.2.1.2 Direct effects of metformin on cancer cells 30

2
1.2.2 Metformin in CRC 32
CHAPTER 2. AIM OF THE STUDY 34
CHAPTER 3. MATERIALS AND METHODS 35
3.1 Genetics characteristics of colorectal cancer cell lines and culture conditions
35
3.2 MTT viability assay 36
3.3 Colorectal cancer peritoneal carcinomatosis organoids 37
3.4 Trypan blue viability assay 38
3.5 Bromodeoxyuridine (BrdU) proliferation assay 38
3.6 Fluorescence-activated cell sorting (FACS) 39
3.7 RNA extraction from cells 39
3.8 Quantitative real-time PCR (qRT-PCR) 40
3.9 Cell Cycle analysis 40
3.10 Western Blotting analysis 40
3.11 Senescence-associated (SA)-β-galactosidase activity 43
3.12 Apoptosis assays 43
3.12.1 TUNEL (TdT-FITC) 43
3.12.2 Caspase-3 assay 44
3.13 Western blot for apoptotic control 44

3
3.14 Immunofluorescent staining and image analysis for autophagy 44
3.15 Clonogenic Assay 45
3.16 Viability assays in combinatorial treatments: chemotherapy
drugs and metformin
45
3.17 Drug synergy testing 47
3.18 Viability assays in combinatorial treatments: chemotherapy
regimens and metformin
47
3.19 Data analyses 49
CHAPTER 4. RESULTS 50
4.1 Effect of metformin on CRC cell lines and organoids 50
4.1.1 Identification of the concentrations of metformin to use in
CRC cell lines and organoids
50
4.1.2 Analysis of cell proliferation in CRC cell lines undergoing
metformin treatment
52
4.1.3 Evaluation of stem cell markers in CRC cell lines and
organoids
53
4.1.4 Metformin increases G0/G1 phase in HT29, HCT116,
HCT116P53-/- and organoids but not in DLD-1 cells
54
4.1.5 Treatment with metformin does not induce senescence,
apoptosis or autophagy
56
4.1.6 Metformin-induced inhibition of proliferation is reversible 60
4.1.7 Metformin transiently inhibits mTOR proliferation
pathway and reduces the activation of IGF1R
62
4.1.8 Summary of key findings 64
4.2 Effects of metformin in combination with chemotherapy 64
4
4.2.1 Analysis of combinatorial treatments with metformin and
single chemotherapeutic drugs
67
4.2.1.1 Analysis of combinatorial treatments with
metformin and 5-FU
67
4.2.1.2 Analysis of combinatorial treatments with
metformin and oxaliplatin
69
4.2.1.3 Analysis of combinatorial treatments with
metformin and irinotecan
71
4.2.2 Analysis of combinatorial treatments with metformin and
chemotherapeutic drugs administered as regimens
72
4.2.2.1 Analysis of combinatorial treatments with
metformin and oxaliplatin-5-FU regimen
73
4.2.2.2 Analysis of combinatorial treatments with
metformin and irinotecan-5-FU regimen
76
4.2.3 Summary of key findings 78
4.3 Analysis of combinatorial treatments with metformin and
targeted drugs
78
4.3.1 Analysis of changes in proteins from pathways
deregulated in CRC
83
4.3.1.1 Analysis of combinatorial treatments with
metformin and vemurafenib
83
4.3.1.2 Analysis of combinatorial treatments with
metformin and panitumumab
85
4.3.1.3 Analysis of combinatorial treatments with
metformin and dasatinib
86
4.3.1.4 Analysis of combinatorial treatments with
metformin and regorafenib
89
4.3.1.5 Analysis of combinatorial treatments with
metformin and trametinib
90
4.3.2 Cell cycle analysis on combinatorial treatments 92
4.3.3 Summary of key findings 95
CHAPTER 5. DISCUSSION 96

5
REFERENCES 106
SUPPLEMENTARY TABLES 136

6
LIST OF FIGURES Figure 1 Progression from polyp to cancer 15
Figure 2 Vogelgram 17
Figure 3 Wnt signalling pathway 18
Figure 4 Organization of the intestinal epithelium 20
Figure 5 Stages of colorectal cancer 21
Figure 6 Antineoplastic mechanisms of action of metformin. 30
Figure 7 Metformin mechanisms of actions 31
Figure 8 Experimental design of the treatments with metformin and
chemotherapy drugs
46
Figure 9 Experimental design of the combined treatments of metformin
with the chemotherapy regimens
48
Figure 10 Determination of the IC50 values for metformin in CRC cell
lines
50
Figure 11 Microscope images and viability analysis of organoids from
CRC-pc
52
Figure 12 Evaluation of the proliferation in CRC cell lines 53
Figure 13 Effects of metformin on the expression of the CRC stemness
markers CD44, CD133 and LGR5
54
Figure 14 Cell cycle analysis and expression of related protein in CRC
cell lines and in organoids
56
Figure 15 Analysis of senescence in CRC cell lines 57
Figure 16 Apoptosis assays in CRC cell lines and in the organoids 58
Figure 17 Autophagy detection in CRC cell lines and in the organoids 59
Figure 18 Clonogenic ability of the CRC cell lines 61
Figure 19 mTOR pathway and IGF1Rβ in CRC cell lines and in the
organoids
63
Figure 20 Determination of the IC50 values for the chemotherapy drugs in
CRC cell lines
66
Figure 21 Effects of 5-FU and metformin treatments on CRC cell viability 69
Figure 22 Effects of oxaliplatin and metformin treatments on cell viability 71
Figure 23 Effect of irinotecan (SN-38) and metformin treatments on cell
viability
72
Figure 24 Effect of oxaliplatin-5-FU (OXA-5-FU) regimen and
metformin treatments on cell viability
75

7
Figure 25 Effect of irinotecan-5-FU (IRI-5-FU) regimen and metformin
treatments on cell viability
77
Figure 26 Determination of the IC50 values for targeted drugs and
metformin in the BRAF-mutant cell lines
80-81
Figure 27 Effects of vemurafenib on cell signalling 85
Figure 28 Effects of panitumumab on cell signalling 86
Figure 29 Effects of dasatinib on cell signalling 88
Figure 30 Effects of regorafenib on cell signalling 90
Figure 31 Effects of trametinib on cell signalling 92
Figure 32 Cell cycle analysis in RKO and NCI-H508 cell lines treated
with targeted drugs
94

8
LIST OF TABLES
Table 1 TNM staging of colorectal cancer 22
Table 2 Targeted therapies in clinical development for
colorectal cancer
27
Table 3 Genetics characteristics of the cell lines 35
Table 4 BRAF and MSI status of the cell lines 36
Table 5 Genetics characterization of the tumour of origin
and of the derived CRC-pc organoids
37
Table 6 Antibodies used for immunoblotting analysis 41
Table 7 IC50 values of chemotherapy drugs in the CRC cell
lines analysed
67
Table 8 Combined concentrations of chemotherapy drugs
obtained by Compusyn software
73
Table 9 List of the target of drugs tested in combination with
metformin
79
Table 10
IC50 values of targeted drugs in the CRC cell lines
analysed
82
Table 11 Combined concentrations of targeted drugs and
metformin obtained by Compusyn software
82
Supplementary table 1 CI of oxaliplatin and 5-FU in HT29 136
Supplementary table 2 CI of oxaliplatin and 5-FU in HCT116 137
Supplementary table 3 CI of oxaliplatin and 5-FU in HCT116P53-/- 138
Supplementary table 4 CI of irinotecan and 5-FU in HT29 139
Supplementary table 5 CI of irinotecan and 5-FU in HCT116 140
Supplementary table 6 CI of irinotecan and 5-FU in HCT116P53-/- 141
Supplementary table 7 CI of dasatinib and metformin in NCI-H508 142
Supplementary table 8 CI of vemurafenib and metformin in HT29 143
Supplementary table 9 CI of vemurafenib and metformin in RKO 144
Supplementary table 10 CI of vemurafenib and metformin in NCI-H508 145
Supplementary table 11 CI of panitumumab and metformin in NCI-H508 146
Supplementary table 12 CI of dasatinib and metformin in HT29 147
Supplementary table 13 CI of dasatinib and metformin in RKO 148
Supplementary table 14 CI of regorafenib and metformin in HT29 149
Supplementary table 15 CI of regorafenib and metformin in RKO 150

9
Supplementary table 16 CI of regorafenib and metformin in NCI-H508 151
Supplementary table 17 CI of metformin and trametinib in RKO 152
Supplementary table 18 CI of metformin and trametinib in HT29 153
Supplementary table 19 CI of metformin and trametinib in NCI-H508 154

10
ABBREVIATIONS
4-OHT 4-hydroxytamoxifen 4E-BP1 4E-Binding Protein 1 5-FU 5-Fluorouracil ACC Acetyl-CoA Aarboxylase AMP Adenosine Monophosphate AMPK 5’-AMP-activated Protein Kinase APC Adenomatous Polyposis Coli ATM Ataxia Telangiectasia Mutated ATP Adenosine Triphosphate BrdU Bromodeoxyuridine CapeOx Capecitabine/oxaliplatin CI Combination Index CIN Chromosomal Instability CPT Camptothecin CRC Colorectal Cancer CRC-pc Colorectal Cancer-peritoneal carcinomatosis CSC Cancer Stem Cell Ctrl Control DCC Deleted in Colon Cancer DDR DNA Damage Repair EGFR Epidermal Growth Factor Receptor ERK Extracellular signal–Regulated Kinase FACS Fluorescence-Activated Cell Sorting FAP Familial Adenomatous Polyposis FAS Fatty Acid Synthase FDA Food and Drug Administration FFPE Formalin Fixed Paraffin Embedded FGFR Fibroblast growth factor receptor FOLFIRI 5-FU/LV/irinotecan FOLFOX 5-FU/LV/oxaliplatin FOLFOXIRI 5-FU/LV/oxaliplatin/irinotecan GLUT-4 Glucose Transporter 4 GSK3β Glycogen Synthase Kinase 3 beta HIF-1α Hypoxia-Inducible Factor 1 α HK2 Hexokinase 2 HNPCC Hereditary Non-Polyposis Colorectal Cancer IC50 Inhibitory Concentration 50 IGF1R Insulin-like Growth Factor 1 R IL Interleukin IRI Irinotecan ISH In Situ Hybridization LC3 Light Chain 3 Lgr5 Leucine-Rich Repeat Containing G Protein-Coupled Receptor 5 LKB1 Liver Kinase B1
11
LV Leucovirin mAb monoclonal Antibody MAPK Mitogen- Activated Protein Kinase mCRC metastatic Colorectal Cancer Met or MET Metformin MLH1 MutL Homolog 1 MMP Matrix Metalloproteinases MMR Mismatch Repair MSH2 MutS Homolog 2 MSI Microsatellite Instability mTOR mammalian Target Of Rapamycin MTT 3-[4,5-Dimethylthiazol-2-yl]-2,5-diphenyltetrazolium bromide NADH Nicotinamide Adenine Dinucleotide Hydride NCCN National Comprehensive Cancer Network NF-κB Nuclear Factor kappa B OCT1 Organic Cation Transporter 1 OS Overall Survival OXA Oxaliplatin PARP Poly (ADP-Ribose) polymerase protein PDGFR Platelet Derived Growth Factors Receptor PFS Progression Free Survival PI3KCA Phosphatidylinositol-4,5-Bisphosphate 3-Kinase Catalytic subunit Alpha PMS1 Postmeiotic Segregation increased 1 PTEN Phosphatase and Tensin homolog qRT-PCR Quantitative Real-Time PCR R Rescued REDD1 Regulated in Development and DNA Damage responses 1 ROS Reactive Oxygen Species RR Response Rate S6 40S ribosomal protein subunit S6 kinase SD Standard Deviation SMAD Small Mother Against Decapentaplegic TGFβ Transforming Growth Factor-β TGFβIIR TGF-β type II Receptor TNF-α Tumour Necrosis Factor α TSC Tuberous Sclerosis Complex TUNEL Terminal deoxynucleotidyl transferase dUTP Nick End Labeling VEGF Vascular Endothelial Growth Factor WT Wild Type

12
ABSTRACT
The aim of this project was to investigate the anticancer activity of the anti-diabetic drug
metformin, individually or combined in various settings with chemotherapy, on in vitro
models of colorectal cancer (CRC). I found that metformin reduced cell proliferation by
inducing cell cycle arrest in the G0/G1 phase, but did not lead to cell death. The anti-
proliferative action of metformin resulted mediated by the inactivation of the mTOR
pathway and of IGF1R protein. However, the drug only transiently arrested cell growth,
since its effects were reversed after drug removal.
When I combined the biguanide with the chemotherapy drugs commonly used to treat
CRC I observed different responses in the cell lines analysed that reflected their genetic
background and their different sensitivities to both the biguanide and chemotherapy. I
found that metformin added before chemotherapy drugs antagonised their effects in the
majority of the treatments. On the contrary, its administration after long chemotherapeutic
treatments significantly reduced the cell viability. I noted that metformin better inhibits cell
proliferation in cell lines with rapid growth.
I have also assessed the dual treatment combination of metformin with different drugs that
target specific genes or proteins (targeted therapies), focusing on BRAF-mutant cell lines.
For most of the tested treatments the simultaneous administration of metformin and target
drugs gave no advantages over the single drugs, and often resulted in antagonism.
Overall, our results show that although further investigations are still needed to elucidate
the results of the treaments including metformin, these data suggest that caution should be
used in administering chemotherapy to indviduals taking metformin.

13
CHAPTER 1
INTRODUCTION
1.1 Colorectal cancer
Colorectal cancer (CRC) is the third most common worldwide cancer in men,
after lung and prostate cancer, and the second in women, after breast cancer (Ferlay et al.,
2015). CRC is the fourth leading cause of cancer-related deaths with an estimated
incidence of 1.4 million new cases and a mortality of >690,000 deaths annually. The
incidence of the disease is influenced by several factors, such as geographical location and
ethnicity (for example, African Americans are the racial group with the highest incidence
of CRC in the United States and Ashkenazi Jews are the ethnic group with the highest risks
of CRC; American Cancer Society), gender (incidence rate in men is higher by 35-40%)
and age (more common in those over 50 years). The highest rates are found in Europe,
North America, Japan and Oceania. CRC is increasing rapidly in Latin America, Asia and
Eastern Europe (Torre et al., 2016), reflecting the adoption in these countries of western
lifestyles such as the intake of high-fat diets, physical inactivity and smoking. In the
United States, Oceania and Europe the introduction of established screening tests that
allow the early detection, and consequent removal, of precancerous lesions has decreased
incidence of CRC. On the contrary, in Central America, South America and Eastern
Europe, where screening procedures have not yet been adopted, CRC continues to
increase.
1.1.1 Risk factors for colorectal cancer
Risk factors for CRC can be divided into modifiable, which are part of the diet
and lifestyle (smoking, obesity, alcohol, physical inactivity and diabetes), and non-
modifiable, that include age, gender and genetic or hereditary factors.

14
Smokers and ex-smokers have an increased risk of incidence and mortality for CRC with
respect to non-smoker individuals. Alcohol abuse appears to be related to alterations of
mechanisms of DNA methylation, leading to changes in intestinal absorption, metabolism,
and renal excretion of folates.
As for obesity, in obese individuals the excess of adipose tissue can produce hormones
such as insulin or oestrogens, which may promote carcinogenic mechanisms. The high
consumption of fat and proteins (especially from animals), in particular the excessive
consumption of red or processed meat, increases the risk of CRC. In contrast, a diet rich in
fibers, mainly derived from fruits and vegetables, seems protective against CRC. Fibers
can absorb faecal carcinogens, reduce faecal transit time and increase the production of
short chain fatty acids (which increase the absorption of sodium and water in the colon), all
processes associated with a lower risk of neoplastic transformation. Finally, a physically
active lifestyle that improves immune functions, reduces inflammation and insulin levels
diminishes CRC risk. Taken together, changes in diet and lifestyle integrated with
preventive screenings represent potential prevention tools for CRC.
As regards the non-modifiable risk factors, CRC incidence and death rates increase with
age, and they are higher in men than in women (American Cancer Society).
1.1.2 Histopathological characteristics of colorectal cancer
The intestinal epithelium is formed by a one cell depth layer in many sites, and
this population of cells is in constant flux to maintain homeostasis of cell renewal process,
in which cell proliferation, differentiation and apoptosis of enterocytes is highly regulated
both spatially and temporally (Senda et al., 2007). Epithelial cells are anchored on a
basement membrane (basal lamina) that forms part of the extracellular matrix and is
assembled from proteins secreted by both epithelial and stromal cells, mostly fibroblast,
lying beneath the membrane. Other cell types including endothelial cells, which form the
walls of capillaries, lymphatic vessels and immune cells are also present. Beneath this

15
layer of stromal cells there is a thick layer of smooth muscles responsible for intestinal
peristalsis through periodic contractions (Weinberg 2007).
Most of the pathological changes associated with the development of colon cancer occur in
the epithelial layer, which undergoes transformation through a series of intermediate steps
from carcinoma, where it is possible to observe a variety of tissue states with different
degrees of abnormality, to mildly deviant tissues and high malignancy state, and later into
multiple metastatic growths (Figure 1).
Figure 1. Progression from polyp to cancer (modified from John Hopkins Medicine Colorectal Cancer http://www.hopkinscoloncancercenter.org).
Focusing on the histopathological alterations of the colonic epithelium, there are some
hyperplastic areas where epithelial cell proliferation is unusually high although the
individual cells have normal phenotype. Other areas are characterized by growth with
abnormal histologies and it is not possible to identify the well-ordered cell layer typical of
the normal colonic epithelium and where the morphology of the individual cells is
deviating from that of normal cells.
During further stages of progression deviant growth that forms adenoma is observed
(Weinberg 2007). All these forms are considered benign until they pass through the basal
membrane and invade the underlying tissues and cells switch into a malignant direction
and the deeper they penetrate into the stromal layers, the higher is the risk that they can
migrate to anatomically distant sites in the body, and metastasize.

16
1.1.3 Genetics of colorectal cancer
About 70-75% of CRCs are sporadic (i.e. occurs following the acquisition of
somatic mutations), and the remaining 20-25% can be familial (if the affected individuals
are in close degree) or hereditary (if germline mutations are present and can be transmitted
between generations). Hereditary factors that increase CRC risk include a personal or
family history of CRC and/or polyps, a personal history of inflammatory bowel disease,
and different inherited genetic conditions. About 5% of all CRCs present a hereditary
origin, the most common types are Hereditary Non-Polyposis Colorectal Cancer (HNPCC,
also named Lynch syndrome) and familial adenomatous polyposis (FAP). HNPCC, the
most common form of hereditary colorectal cancer (3-4% of all cases), is an autosomal
dominant disease caused by germline mutations in the DNA mismatch repair (MMR)
genes, mainly MSH2 and 6, MLH1 and 3 and PMS1 and 2, leading to microsatellite
instability (MSI; Fearon 2011). HNPCC patients may also develop endometrial, ovarian,
stomach, small intestine, pancreas, brain and upper urinary tract tumours. FAP is an
autosomal dominant disease characterized by the development of hundreds to thousands of
colonic adenomas (polyps) of different sizes that can evolve to CRC when not treated. FAP
is caused by germline mutations in the tumour suppressor gene Adenomatous Polyposis
Coli (APC) that regulates the degradation of β-catenin in the Wnt pathway. Loss of APC
function increases the transcription of β-catenin target genes, including c-MYC, resulting in
cell proliferation, which increases the probability of transformation of polyps into
cancerous polyps.
Familial CRC is probably related to inheritance, but the genetic loci responsible for the risk
genotype are mainly unknown. It is likely to be caused by alterations in genes that are less
penetrant, but more common that those associated with the familiar syndromes.
Polymorphisms in genes that regulate metabolism or in genes regulated by environmental
factors could be related to familiar predisposition to CRC. Sibling studies and studies with

17
parent/child pairs have estimated that up to 35% of all CRC cases can be attributed to
genetic susceptibility (Lichtenstein et al., 2000).
1.1.3.1 Vogelgram – a progression model for colorectal cancer
The adenoma-carcinoma transition is a model of CRC development in which
specific somatic mutations promoting tumorigenesis were acquired. Sporadic tumours can
be caused by chromosomal instability (CIN, an unbalance in chromosome number
provoked by amplifications or losses of chromosomal regions) present in 80-85% of cases
of CRC, follow the model proposed by Fearon and Vogelstein (Vogelgram) according to
which any transition from normal mucosa to carcinoma involves specific and well-defined
alterations in oncogenes or tumour suppressor genes (Fearon et Vogelstein, 1990; Figure
2).
Figure 2. Vogelgram. Transformation of normal colon epithelium into malignant carcinoma by step-wise accumulation of genetic aberrations. Adapted from Markowitz and Bertagnolli 2009. The Vogelgram suggests that the adenoma to carcinoma sequence is initiated by alterations
in the APC gene, followed by mutations in KRAS or BRAF genes, PI3KCA or PTEN,
mutations or loss of TTP53 gene and of SMAD family member 4 (SMAD4).
Two mutations in APC are required for the initiation of colorectal carcinogenesis, in
agreement with the hypothesis of the "two-hits" of Knudson (Knudson, 1993). Loss of

18
APC gene, which also controls cell growth, leads to the formation of the typical small
benign polyps. The best-known role of the APC protein is to regulate the levels of β-
catenin in the Wnt pathway, where APC is part of multi protein complex APC-axin-
GSK3β that interacts with β-catenin causing its phosphorylation, ubiquitination and
consequent degradation in the proteasome (Barker, 2008; Figure 3 left panel). Mutations in
APC gene prevent the formation of the APC-axin-GSK3β complex, allowing β-catenin to
accumulate in the cytoplasm and then translocate to the nucleus. In the nucleus β-catenin
can interact with several transcription factors of the T-Cell Factor Family, promoting the
transcription of genes that regulate cell cycle and proliferation such as cyclin D and c-
MYC, and genes related to tumour progression as metalloproteinases MMP7 and MMP26
(Figure 3 right panel).
Figure 3. Wnt signalling pathway. In absence of Wnt ligand β-catenin can be phosphorylated for proteasome degradation (left panel). In the presence of Wnt ligand or of inactivating mutations on APC protein, Wnt signalling is activated and the oncoprotein β-catenin regulates genes involved in cancer progression (Fearon, 2011). Other mutations that lead to cancer progression are found in the KRAS and BRAF genes.
In normal cells RAS and BRAF proteins are activated in response to extracellular signals
and act as molecular switch in the cell proliferation, specifically by activating the MAPK

19
pathway. KRAS mutations, that constitutively activate the gene and cause adenomas
progression, were detected in about 50% of CRCs, BRAF mutations in 5-10 % of CRCs.
Other somatic mutations can occur in PI3KCA gene and lead to activation of PI3K
signalling. The deregulation of this pathway can also occur after loss of the tumour
suppressor gene PTEN that acts as inhibitor of PI3K signalling (Markowitz and Bertagnolli
2009).
The progression to carcinoma continues as a result of inactivation or loss of tumour
suppressor gene TP53, which suppresses cell division or induces apoptosis in response to
stress damage, driving progression to carcinoma (Kinzler and Vogelstein, 2002).
Finally the loss of some genes mapping on chromosome 18q has an oncogenic effect in the
gastrointestinal system (Taketo et al., 2000). Among the lost genes, DCC encodes for a
transmembrane protein acting as receptor for netrins (factors involved in axonal guidance
in the nervous system) involved in the regulation of apoptosis (Arakawa, 2004). Other
tumour suppressor genes on chromosome 18q are SMAD2 and SMAD4, which act as signal
transducers in the Transforming Growth Factor β (TGF-β) signalling pathway
(Montgomery et al., 2001). Moreover, inactivating mutations in the TGF-β type II receptor
(TGFβIIR) are found in one third of CRCs (Markowitz et al., 1995).
1.1.4 Colorectal cancer stem cells
Stem cells, present in adult tissues, are characterised by self-renewal and multipotency.
Lineage tracing experiments have shown that in the intestinal epithelium the stem cells
reside at the bottom of the crypts (the base of glands) and symmetrically divide from a
single clone (Winton et al., 1988); they are constantly renewed and migrate from the crypt
base, towards the crypt-villus axis and (Snippert al al., 2010). Stem cells can be traced
using endogenous molecular markers such as leucine-rich repeat (LRR)-containing G-
protein-coupled receptor 5 (Lgr5) gene they express (Barker et al., 2007; Figure 4).

20
Figure 4. Organization of the intestinal epithelium. The intestinal epithelium consists of repetitions of villus-crypt units (left panel). At the crypt base Lgr5 positive cells represent the stem component and are intercalated with Paneth cells. Lgr5-expressing stem cells lead to the production of highly proliferative progenitors of differentiated cells that migrate along the crypt-villus axis (right panel). Adapted from de Lau et al., 2014. The identification of Lgr5 positive cells as intestinal stem cells was provided by in vivo
Lgr5-based lineage tracing experiments (Barker et al., 2007). Through this technique
candidate stem cells are marked and the cells descendants, inheriting the same marker, can
be visualised. Because the marker was present in all epithelial cells, Lgr5-positive cells
have been established as self-renewing and multipotent population of adult intestinal stem
cells. Moreover it was demonstrated that single Lgr5-positive cells can generate and
maintain the stem-cell hierarchy in in vitro matrigel culture systems (Sato et al., 2009).
Lgr5 is encoded by a Wnt target gene and constitutes a facultative component of the Wnt
receptor complex (de Wetering et al., 2002, de Fllier et al., 2007, de Lau et al., 2011). The
Wnt signalling plays indeed a pivotal role in stem cells maintenance and its deregulation in
the stem compartment can lead to adenoma formation (Barker et al., 2009).
Other well established CRC stemness markers are CD133 and CD44, both related to Wnt
pathway: CD133 positive cells express high levels of β-catenin (Kawamoto et al., 2010)
and CD44 is a gene targeted by β-catenin (Wielenga et al., 1999).

21
CD133 is a transmembrane glycoprotein with yet unclear function. In CRC it can promote
tumour growth with self-renewal capability (O’Brien et al., 2007, Ricci et al., 2007). CD44
is a transmembrane glycoprotein involved in cell-cell and cell-matrix interaction (Sahlberg
et al., 2014). Dalerba et al. demonstrated that in human CRC xenografts, tumours derived
from CD44 positive cells maintained a differentiated phenotype and reproduced the
morphology and phenotype of their parental lesions (Dalerba et al., 2007).
1.1.5 Colorectal cancer stages
The classification of cancer lesions is the most important prognostic predictor of
the clinical outcome in patients with CRC. The staging system used for CRC is the
American Joint Committee on Cancer (AJCC) TNM system. The TNM system is based on
tumour infiltration degree and discriminates to which of the intestinal wall layer tumour
has arrived (T), if it has spread to regional lymph nodes (N) and/or it has invaded other
organs resulting in metastases (M; American Cancer Society).
The transition from carcinoma in situ (Tis), in which the tumour does not exceed the
lamina propria, to stage T1 invasive carcinoma occurs when the tumour comes to the
submucosa. Following the sequential invasion of muscularis and subserosal mucosa, the
progression to the next stages T2 and T3 happens. Finally, the T4 stage occurs when the
cancer invades other organs and / or perforates visceral peritoneum (Figure 5).
Figure 5. Stages of colorectal cancer. Image from National Institute of Health (NIH) and National Cancer Institute (NCI).

22
The detection of any positive lymph node is critical to predict the outcome of patients. It is
therefore necessary to examine an adequate number of regional lymph nodes (at least 7-
14). The TNM staging system for lymph nodes start from N0, classification for which the
lymph nodes are metastases free. In N1 stage metastases are detected in 1-3 lymph nodes,
in N2 metastases are found in 4 or more regional lymph nodes. Although CRC can
metastasize in almost all organs, the liver and the lungs are the most common sites but it is
usual to detect metastases in other segments of the colon, small intestine and peritoneum.
The TNM staging for metastases has M0 and M1 values, indicating the presence or
absence of metastases respectively. The TNM categories are combined in stage groups,
ranging from 0 (in situ tumour) to IV (distant metastasis; Table 1).
Table 1. TNM staging of colorectal cancer
TNM stage T N M
0 Tis N0 M0
I T1- T2 N0 M0
IIA T3 N0 M0
IIB T4 N0 M0
IIIA T1-T2 N1 M0
IIIB T3-T4 N1 M0
IIIC any T N2 M0
IV any T any N M1
The staging degree is inversely proportional to the probability of survival. In fact, the
survival rate at 5 years passes from 75-80% in individuals with stage I diagnosis to 15% in
individuals with stage IIIC diagnosis (Gunderson et al., 2010). In stage IV the 5-year
survival after diagnosis is less than 5%.

23
1.1.6 Treatments for Colorectal Cancer
Four key approaches are currently used for the treatment of CRC: surgery,
chemotherapy, radiotherapy and targeted therapies. Treatment for colon cancer is based
largely on the stage (extent) of the cancer, and people with early stage disease (stage I and
II) usually have surgery as the main or first treatment, in some cases followed by adjuvant
chemo or radiation therapies. Adjuvant therapy is the standard of care for patients with
stage III disease, which have a high survival benefit. Patients with metastatic disease (stage
IV) require chemotherapy or targeted therapies combined with surgery, where appropriate.
1.1.6.1 Chemotherapy
Chemotherapeutic agents include fluoropyrimidines (5-Fluorouracil (5-FU) and
capecitabine), oxaliplatin and irinotecan (Meyerhardt et Mayer, 2005, Koopman et al.,
2007, Seymour et al., 2007, Kelly and Cassidy 2007).
5-FU remains the most widely used chemotherapeutic agent for the treatment of CRC.
Following metabolic activation to 5-fluoro-2′-deoxyuridylate, this fluorinated pyrimidine
combines with methylenetetrahydrofolate to form a ternary complex with thymidylate
synthase, an enzyme involved in pyrimidines synthesis, thus interfering with DNA
synthesis by inhibiting the conversion of deoxyuridylate to thymidylate. 5-FU is often
given with Leucovirin (LV, also called folinic acid) to improve the effect of the
chemotherapy drug. Capecitabine is a precursor of 5-FU that is converted to 5-FU through
three sequential enzymatic reactions. The final enzyme in the pathway, thymidine
phosphorylase (TP), is believed to be present at very high levels in tumour tissue, thus
increasing both the efficacy and tolerability of the agent through targeted delivery.
Oxaliplatin, a platinum analogue, forms intra- and inter-strand DNA adducts, leading to
inhibition of DNA replication and transcription.
Irinotecan is a semi-synthetic derivative of the natural alkaloid camptothecin, which
inhibits the activity of Topoisomerase I, a nuclear enzyme involved in DNA synthesis.

24
During DNA replication, Topoisomerase I relaxes the supercoiled DNA helix with
reversible and transient single-stranded DNA breaks. The active metabolite of irinotecan
(SN-38) stabilizes the DNA–topoisomerase complex, resulting in replication arrest and
apoptosis.
Current international guidelines (National Comprehensive Cancer Network, NCCN)
suggest the use of these chemotherapy agents alone or in combinations (NCCN guidelines
2015). According to NCCN guidelines the drugs, to increase their effectiveness, can be
combined in the following regimens: FOLFOX (5-FU/LV/oxaliplatin), FOLFIRI (5-
FU/LV/irinotecan), CapeOx (Capecitabine/oxaliplatin) and FOLFOXIRI (5-
FU/LV/oxaliplatin/irinotecan). In fact, patients treated with regimens seem to have an
increase in overall survival (OS) and in progression free survival (PFS), compared with
patients treated with single chemotherapeutic agents (Rodrigues et al., 2016, Doullard et
al., 2000, Grothey et al., 2004).
1.1.6.2 Targeted therapies for colorectal cancer
Targeted cancer therapies include drugs or other substances that block the growth
and spread of cancer by interfering with specific molecules ("molecular targets") that are
involved in the growth, progression and spread of cancer. Targeted therapies are often
cytostatic. Used alone or in combination with chemotherapy, these therapies have been
proven to increase the OS in patients with metastatic CRC (mCRC). Many targeted cancer
therapies have been approved by the Food and Drug Administration (FDA) to treat specific
types of cancer. As for mCRC, the current FDA-approved targeted therapies can be
divided into three groups: inhibitors of angiogenesis targeting Vascular Endothelial
Growth Factor (VEGF) or its receptors, monoclonal antibodies (mAbs) against Epidermal
Growth Factor Receptor (EGFR) and inhibitors of kinases involved in various signalling
cascades [VEGF receptors, RET, KIT, Platelet Derived Growth Factors Receptor
(PDGFR), and Raf kinases]. Others are being studied in clinical trials, and many more are

25
in preclinical testing.
VEGF is the most important factor regulating tumour angiogenesis (Ferrara et al., 2003).
The drug developed to inhibit the VEGF signalling processes is Bevacizumab, a
recombinant humanised mAb that specifically targets circulating VEGF-A, which is
synthesised during tumour growth. Bevacizumab prevents VEGF from interacting with
appropriate receptors in vascular endothelial cells, resulting in diminished cell signalling
pathways that enhance angiogenesis (Ferrara et al., 2004). The mAb, when administered in
combination with chemotherapy increases the activity of any active cytotoxic regimen and
improves OS, response rate (RR) and PFS in patients with mCRC (Saltz et al., 2008,
Bennouna et al., 2013).
Cetuximab and panitumumab are two EGFR antagonists, chimeric and fully humanized
mAbs respectively. Both antibodies prevent EGFR auto-phosphorylation by binding to the
extracellular domain and thus inhibiting activation of the downstream cell signalling
pathways of MAPK and PI3K/Akt involved in proliferation and cell survival respectively
(Ciardiello and Tortora 2008). Cetuximab and panitumumab are active in different lines of
treatment and in various combinations and patients treated with anti-EGFR mAbs
administered with FOLFOX or FOLFIRI regimens show a significantly improved RR, OS
and PFS (Venook et al., 2006, Douillard et al., 2010, Bokemeyer et al., 2014). However
their benefit, either as a single agent or in combination with any chemotherapy regimen, is
limited to patients in whom a RAS mutation is excluded. KRAS oncogenic mutations, seen
in 35-45% of CRCs, occurring prevalently in the codons 12 and 13 of exon 2, exclude
patients from cetuximab/panitumumab therapies. In fact, the anti-EGFR drugs are
currently indicated only in patients with wild type RAS (Lievre et al., 2006, De Roock et
al., 2010, Van Cutsem et al., 2015). An ‘expanded RAS’ analysis that also includes
additional mutations in exons 3 and 4 of the KRAS gene and in exons 2–4 of NRAS gene
that reduce the efficacy of anti-EGFR treatments has improved the efficacy of the
treatment (Bokemeyer et al., 2014).

26
Regorafenib is a multikinase inhibitor that blocks the activity of multiple protein kinases
involved in the regulation of angiogenesis (VEGFR-1, -2, -3, angiopoietin-1 receptor),
oncogenesis (KIT, RET, BRAF, including BRAF V600E) and of tumour
microenvironment (PDGFR-β, Fibroblast growth factor receptor (FGFR; Wilhelm et al.,
2011). In patients with mCRC refractory to standard chemotherapy, treatment with
regorafenib increased median RR, OS and PFS (Grothey et al., 2013).
1.1.6.2.1 New targeted therapies for colorectal cancer
Although patients are eligible for the therapies described, not all respond to them.
To fill up this gap, increasing new targeted therapies for CRC are emerging, concurrently
to the identification of biological markers that can predict the response to therapy.
BRAF, involved in EGFR signalling, is mutated in 5-10% of CRC (Tol et al., 2009). The
most common mutation V600E leads to constitutively activation of the kinase protein,
conferring a very poor prognosis. Clinical results with the selective BRAF V600E inhibitor
vemurafenib as single agent in CRC have been disappointing, although the inhibitor is very
effective for melanoma treatment (Flaherty et al., 2010, Chapman et al., 2011, Sosman et
al., 2012, Kopets et al., 2015). It has been observed that in CRC the inhibition of BRAF
V600E caused a rapid feedback activation of the EGFR signalling pathway, through ERK
activation, which is inhibited in melanoma. Therefore, combinatorial treatments with
BRAF V600E and EGFR inhibitors appear a rational strategy and already seem to provide
clinical benefits (Corcoran et al., 2012, Prahallad et al., 2012, Yaeger et al., 2015, Elez et
al., 2015, Van Cutsen et al., 2015).
Recently, other BRAF mutations have been found at codons 594 or 596, which occur in
<1% of CRCs. These mutations identify a molecular subtype unexplored with clinical and
pathological features different from BRAF V600E mutated cases and characterised by a
longer OS. BRAF 594 and 596 mutations cause only modest and indirect activation of the
27
MAPK pathway and preclinical and clinical data are suggestive of their potential
sensitivity to anti-EGFR treatment (Cremolini et al., 2015).
Much attention has recently been directed to the inhibition of downstream components of
the RAS/RAF/MAPK/MEK/ERK pathway. Different MEK 1/2 inhibitors, such as
trametinib, and selumetinib, have already been approved for the treatment of mCRC. MEK
inhibitors alone do not seem to be effective, but their combination with BRAF inhibitors
can produce clinical benefits in metastatic patients with mutations in BRAF (Corcoran et
al., 2015).
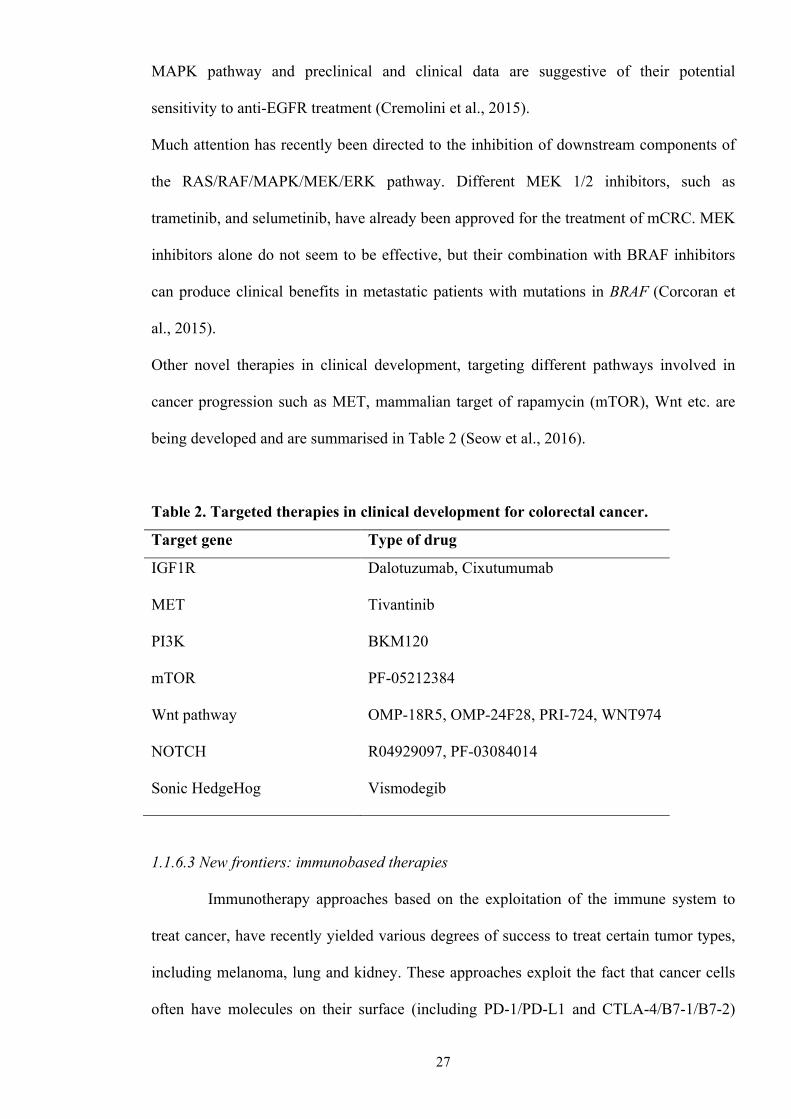
Other novel therapies in clinical development, targeting different pathways involved in
cancer progression such as MET, mammalian target of rapamycin (mTOR), Wnt etc. are
being developed and are summarised in Table 2 (Seow et al., 2016).
Table 2. Targeted therapies in clinical development for colorectal cancer.
Target gene Type of drug
IGF1R Dalotuzumab, Cixutumumab
MET Tivantinib
PI3K BKM120
mTOR PF-05212384
Wnt pathway OMP-18R5, OMP-24F28, PRI-724, WNT974
NOTCH R04929097, PF-03084014
Sonic HedgeHog Vismodegib
1.1.6.3 New frontiers: immunobased therapies
Immunotherapy approaches based on the exploitation of the immune system to
treat cancer, have recently yielded various degrees of success to treat certain tumor types,
including melanoma, lung and kidney. These approaches exploit the fact that cancer cells
often have molecules on their surface (including PD-1/PD-L1 and CTLA-4/B7-1/B7-2)

28
that can be detected by the immune system and prevent immune T cells from killing
cancer. When these proteins are blocked, T cells are able to kill cancer cells better. As
shown by Le et al. in CRC immunotherapy seems to be effective only in the subset of
MSI-high tumours that present an increased mutational load due to DNA mismatch-repair
deficiencies that stimulates the immune system. Indeed, patients with mismatch repair-
deficient CRC had better clinical response to PD-1 blockade by pembrolizumab than those
whose CRC did not have mismatch-repair deficiencies (Le et al., 2015).
1.2 Metformin
The biguanide metformin (1,1-dimethylbiguanide hydrochloride) is a widely
prescribed oral anti-hyperglycaemic agent used as first line treatment for patients with type
2 diabetes mellitus. In diabetic patients metformin can reduce the hepatic gluconeogenesis
and increases glucose uptake and use in skeletal muscle. Compared to other anti-diabetic
drugs metformin is well tolerated, it does not induce hypoglycaemia and has a low risk of
causing lactic acidosis. Metformin is also used to treat polycystic ovarian syndrome,
metabolic syndrome and for diabetes prevention (Pierotti et al., 2013).
1.2.1 Metformin as anticancer drug
Different retrospective studies showed that patients with type 2 diabetes treated
with metformin have lower cancer incidence and/or reduced cancer mortality (Evans et al.,
2005, Libby et al., 2009, Noto et al., 2012, Zhang et al., 2013), focusing the interest in
metformin as anticancer agent. The mechanisms through which metformin seems to
promote anticancer effects can be either indirect or systemic, that modulate metabolic
whole body physiology, or direct, which acts directly on cancer cells inhibiting cancer
progression.

29
1.2.1.1 Indirect or systemic effects of metformin on cancer cells
The liver, exposed to high levels of the drug after oral administration, is
considered the main target organ of metformin. In fact, hepatocytes express high levels of
the cell surface organic cation transporter 1 (OCT1), necessary for the active transport of
metformin (which is positively charged) into the cells (Gong et al., 2012). Inside the cell,
mitochondria seem to be the primary target of metformin (El-Mir et al., 2000), in which
the drug inhibits the respiratory complex I causing reduction of the synthesis of ATP and
oxidation of NADH. The depletion of ATP production and the concomitant increase in the
levels of AMP induces the activation of the cell energy sensor 5’-AMP-activated protein
kinase (AMPK; Zhou et al., 2000). When activated, AMPK down-regulates the processes
that require ATP, such as protein synthesis, and promotes catabolic pathways that generate
ATP. This energy stress leads to a decrease of hepatic gluconeogenesis (Minassian et al.,
1998) with a consequent reduction of the circulating glucose and insulin levels. The
reduction of haematic levels of glucose is also a consequence of increase of sugar uptake in
skeletal muscle caused by the metformin-induced membrane translocation of the glucose
transporter GLUT-4 specifically expressed in this tissue (Fischer et al., 1995). Because
elevated serum levels of insulin and insulin-like growth factor-1 (IGF-1) are often
necessary to sustain the growth and survival of cells in different cancer types, the systemic
reduction of these hormones can impair malignant growth (Pollak, 2012; Figure 6).

30
Figure 6. Antineoplastic mechanisms of action of metformin. Metformin indirect (left) and direct (right) effects are shown. Adapted from Daugan et al., 2016.
1.2.1.2 Direct effects of metformin on cancer cells
The direct anticancer effects of metformin can be differentiated in AMPK-
dependent and AMPK-independent. AMPK can be directly activated by the previously
described increase of AMP/ATP ratio, or indirectly, through its upstream regulator
serine/threonine liver kinase B1 (LKB1; Woods et al., 2003). The activated form of AMPK
suppresses the mammalian target of rapamycin (mTOR) pathway either through the
phosphorylation and activation of tuberous sclerosis complex 2 (TSC2) that in turn inhibits
the mTOR activator Rheb (Inoki et al., 2003) or by phosphorylation of Raptor, a positive
regulator of mTOR (Gwinn et al., 2008). The block of mTOR inhibits the activation of its
downstream target 40S ribosomal protein subunit S6 kinase (S6K or S6) and of the
translational repressor 4E-binding protein 1 (4E-BP1), inactivated by mTOR mediated
phosphorylation (Pierotti et al., 2013; Figure 7).
Metformin can also inhibit mTOR signalling independently from AMPK activation by
suppressing the Ragulatory complex, consisting of the RAG family of GTPases (Kalender

31
et al., 2010), or by activating the negative regulator of mTOR regulated in development
and DNA damage responses 1 (REDD1; Ben Sahra et al., 2011; Figure 7).
Figure 7. Metformin mechanisms of actions. AMPK dependent mechanisms are marked as red lines, AMPK-independent mechanisms as blue lines. Adapted from Pierotti et al., 2013.
The inhibition of protein synthesis via mTOR is only one of the mechanisms by which
metformin can reduce cancer growth (Figure 6). Metformin exerts an inhibitory effect on
glucose metabolism; in fact it can revert the Warburg effect, present in most cancer cells,
either through the decrease of the glycolytic enzyme hexokinase 2 (HK2; Salani et al.,
2014) or through the suppression of oncogenes such as c-Myc, Akt and hypoxia-inducible
factor 1 α (HIF-1α that support the glycolytic phenotype (Daugan et al., 2016). The

32
metformin-induced AMPK activation can reduce enzymes involved in fatty acids
biosynthesis as acetyl-CoA carboxylase (ACC) and fatty acid synthase (FAS), reducing
energy supply and counteracting tumour progression (Algire et al., 2010, Lettieri et al.,
2014). The biguanide can also promote cell cycle arrest through AMPK-mediated
activation of TP53 and reduction of cyclin D1 expression (Ben Sahra et al., 2008, Zhuang
et al., 2008, Alimova et al., 2009, Fujihara et al., 2015). It has also been reported that
metformin can reduce the risk of mutagenesis in cancer cells, that can be escaped either by
the inhibition of reactive oxygen species (ROS) in the mitochondria production or through
the activation of ataxia telangiectasia mutated (ATM) protein, a tumour suppressor
involved in DNA repair (Algire et al., 2012, Vazquez-Martin et al., 2011). Metformin can
also inhibit the inflammatory signalling that promotes carcinogenesis by suppressing
different pro-inflammatory cytokines such as tumour necrosis factor αTNF-α, nuclear
factor kappa B (NF-κB) and interleukin 6 (IL-6; Takemura et al., 2007, Hirsch et al.,
2013). The anti-angiogenetic effect of metformin is linked to reduction of the main factors
involved in vascular remodelling such as VEGF and HIF-1α (Joe et al., 2015, Tadakawa et
al., 2015). Finally it was also observed that metformin treatment can selectively target
cancer stem cells (CSCs), a tumour sub-population characterised by self-renewal capacity,
resistance to chemotherapy and increase in cancer recurrence (Hirsch et al., 2009,
Vazquez-Martin et al., 2010, Song et al., 2012, Bao et al., 2012, Shank et al., 2012, Hirsch
et al., 2013, Kim et al., 2014).
1.2.2 Metformin in CRC
Several studies have shown that metformin can be used for the treatment of CRC.
Epidemiological evidences showed that patients with type 2 diabetes taking metformin had
a lower risk of cancer incidence when compared with patients treated with other anti-
diabetic drugs (Libby et al., 2009, Zhang et al., 2011, Garrett et al., 2012, Lee et al., 2012,
Spillane et al., 2013). In vitro studies demonstrated that metformin can inhibit the

33
proliferation of CRC cells through AMPK activation (Zakikhani et al., 2008). In vivo
models showed that metformin suppressed the development of intestinal polyps in in APC
Min/+ mice, a model of FAP (Tomimoto et al., 2008) and also inhibited the formation of
intestinal aberrant crypt foci in a chemical carcinogen-induced mouse model (Hosono et
al., 2010). Buzzai et al. demonstrated that metformin can selectively inhibit tumour growth
and increase apoptosis in a mouse model of TTP53 deficient CRC (Buzzai et al., 2007).
Finally, Algire et al. showed that in mice fed with a high-energy diet metformin inhibited
the growth of colon carcinomas and reduced insulin levels (Algire et al., 2010).
As regards the risk to develop CRC in non-diabetic patients, Hosono et al. demonstrated
that the short term treatment with metformin administered at low doses (250 mg/day)
suppressed the formation of rectal aberrant crypt foci (a surrogate marker for CRC) and
decreased the proliferation of the colonic epithelium (Hosono et al., 2010).
Different studies combined metformin with other drugs in CRC. Nangia-Makker et al.
demonstrated that metformin in combination with 5-FU and oxaliplatin promotes cell death
in chemotherapy resistant CRC cell lines and inhibits their growth in an in vivo model
(Nangia-Makker et al., 2014). Another study reported that combined treatment with
metformin and 5-FU can reduce cell proliferation in chemo resistant CRC cell lines (Corti
et al., 2015). Li et al. reported that combined use of metformin and vitamin D3 exerts a
chemo-preventive effect reducing the number of rectal aberrant crypt foci in mice and rats
(Li et al., 2015). Metformin in combination with 5-aminosalicylic acid increased apoptosis
and inhibited inflammatory and metastatic pathways in CRC cell lines (Saber et al., 2015).
Finally several clinical trials combining metformin with chemotherapy drugs are ongoing,
for example: metformin plus irinotecan for refractory CRC (NCT01930864), metformin
and 5-FU for refractory CRC (NCT01941953) and metformin in association with
chemoradiotherapy for locally advanced rectal cancer (NCT02473094; Zhang et al., 2016).

34
CHAPTER 2
AIM OF THE STUDY
The aim of this thesis was to investigate the possible anticancer activity of metformin in in
vitro models of CRC. In fact, although previous studies have shown that the drug inhibits
the proliferation of CRC cells, its underlying mechanisms of action on CRC are still
unclear.
I initially investigated the effects of metformin on four CRC cell lines characterized by
different mutations at LKB1, BRAF, KRAS and TP53 genes, and on 3D-organoids derived
from a patient’s peritoneal carcinomatosis. I evaluated: the proliferative potential of cells
undergoing metformin treatment, changes in the expression of CRC stemness markers, cell
cycle modifications, activation of modes of cellular death that could be induced by the
drug, clonogenic capacity of the cells after metformin treatment and changes in the main
biochemical pathways that could be targeted by the drug.
Then I studied the effects of metformin in combined settings with the standard
chemotherapeutics drugs used in CRC: 5-FU, oxaliplatin and irinotecan. In particular I
assessed if any combination of the biguanide with chemotherapeutic drugs could overcome
the transient effect of metformin on cell proliferation I observed in the first part of the
project.
Finally, I analyzed the biochemical effects of metformin and changes in the cell cycle in
combination with different targeted drugs on BRAF-mutant CRC cell lines. BRAF-mutant
tumours are characterised by a high proliferation rate, poor sensitivity to standard
treatments, early development of resistance to targeted therapies and worse prognosis.
Among the new therapeutic approaches, the combination of novel therapies for CRC with
regulators of metabolism seems to be a promising strategy, to overcome resistance to the
targeted therapies in BRAF-mutant CRC. For this reason, I studied the effects of the
combination of metformin with targeted drugs on BRAF-mutant cell lines.
TRANSLATION

35
CHAPTER 3
MATERIALS AND METHODS
3.1 Genetics characteristics and culture conditions of the colorectal
cancer cell lines
The cellular models used for the analysis of the effects of metformin in CRC were four cell
lines characterised by different mutations frequently identified in CRC at BRAF, KRAS and
TP53 genes (all involved in CRC progression) and at LKB1 gene (the main AMPK
activator). HCT116P53-/- cells derived from the HCT116 cell line and carry a deletion of
the region of chromosome 17 where TP53 gene maps. The specific genetic features of the
cell lines are summarised in Table 3.
Table 3. Genetic characteristics of the cell lines LKB1 BRAF KRAS TP53
HT29 WT V600E WT R273H HCT116 partially methylated WT G13D WT HCT116P53-/- partially methylated WT G13D null DLD-1 methylated WT G13D S241F
The analysis of the effects of metformin combined with the standard regimens was
conducted on HT29 cells and on the two HCT116 cell lines.
Finally, three BRAF-mutant cell lines, differing for the type o BRAF mutation or for their
mismatch repair activity, were used for the studing metformin in combination with the
targeted therapies (Table 4). BRAF tumours carrying the common V600E mutation display
a more aggressive phenotype than tumours with the rare G596R mutation. Indeed
differences in MSI status seem to be associated with a different response to the therapies.

36
Table 4. BRAF and MSI status of the cell lines BRAF MSI
HT29 V600E MSS RKO V600E MSI NCI-H508 G596R MSS
The cell lines HT29, HCT116, DLD-1, RKO and NCI-H508 were obtained from the
collection available at IFOM (Istituto FIRC di Oncologia Molecolare, Milano). The
HCT116P53-/- isogenic cell line, in which the TP53 gene was inactivated by homologous
recombination, was kindly provided by Professor Bert Vogelstein (Johns Hopkins
University, Baltimore, USA). Each cell line was grown in a specific medium: HT29,
HCT116 and HCT116P53-/- cell lines in McCoy's 5A medium (Modified) GlutaMAXTM
Supplement (Gibco) + 10% fetal bovine serum + 1% Penicillin-Streptamycin (Gibco);
DLD-1 cells in RPMI (Gibco) + 10% fetal bovine serum + 1% Glutamine + 1% Penicillin-
Streptamycin; RKO cells in MEM (Gibco) + 10% fetal bovine serum + 1% NEAA (MEM
Non Essential Amino acids) + 1% Sodium Pyruvate + 1% Penicillin-Streptamycin; NCI-
H508 cells in RPMI + 10% fetal bovine serum + 1% Glutamine + 1% Penicillin-
Streptamycin. All cells were maintained as a monolayer in a humidified incubator at 37°C
with a supply of 5% CO2.
3.2 MTT viability assay
To test the cell viability, CRC cell lines were seeded into a 96 well plate (1500 -
3000 cells per well) in six replicates. After 24 hours cells were exposed to different
concentrations of drugs: 0.16 - 20 mM for metformin (Sigma Aldrich); 0.3 - 64 µM for 5-
FU (TEVA); 0.064 - 8 µM for oxaliplatin (Fresenius Kabi); 0.004 - 4 µM for
irinotecan/SN-38 (Sigma Aldrich); 30 nM – 100 µM for dasatinib and regorafenib
(Selleckchem); 0.007 nM – 0.12 µM for trametinib (Selleckchem); 7.75 nM - 20 µM for

37
vemurafenib (Selleckchem); 0.003 nM – 10 µM for panitumumab (Amgen). After the time
points set for each experiment (72 hours for detection of the Inhibitory Concentration 50
(IC50) and of the best concentrations combination of drugs; 96 – 144 hours for the
sequential treatments with chemotherapy drugs) the cell proliferation rate was measured
using an MTT (3-[4,5-Dimethylthiazol-2-yl]-2,5-diphenyltetrazolium bromide) assay, a
colorimetric test for measuring the activity of enzymes produced by viable metabolically
active cells that reduce MTT substrate to formazan, giving a purple colour. MTT powder
(Sigma) was dissolved in the growth medium at the concentration of 1 mg/2 ml. After
removal of the original medium, 100 µl of MTT solution were added to each well and
incubated at 37°C. After two-three hours 100 µl of lysis buffer (10% SDS, HCl 0.01 M)
was added to the MTT solution to dissolve the formazan crystals. Plates were then re-
incubated at 37°C overnight under light protected conditions and the following day were
read on a micro-plate reader (Infinite M200 TECAN) at a wavelength of 570 nm.
3.3 Colorectal cancer organoids derived from a peritoneal carcinomatosis
Organoids were derived from a peritoneal carcinomatosis (pc) obtained from a metastasis
of a patient with stage IV, grade 3 CRC (a written informed consent to donate the tissues
left over after the diagnostic procedures at Istituto Nazionale dei Tumori was provided).
The fresh aseptic surgical sample was minced into fragments and incubated with
collagenase (Sigma) for three hours, after which the cell suspension was filtered through a
70 µM nylon mesh, treated with ACK (Ammonium-Chloride-Potassium) Lysing Buffer
(Thermo Fisher), washed with RPMI medium supplemented with 0.5% BSA and seeded in
a 100 x 200 mm tissue culture dish in DMEM/F-12 GlutaMAXTM media (Gibco) + 1%
Penicillin-Streptamycin. Approximately 15 days after seeding, spheroid cellular aggregates
could be isolated and propagated. Organoids were maintained as suspension culture in a
humidified incubator at 37°C with a supply of 5% CO2.

38
Organoids culture was mainly composed of round-shaped cellular aggregates in which the
cells exhibited adhesion loss and were organized in ring and/or ribbon-like structures. The
corresponding tumour sample from which they were derived showed solid nests of poorly
differentiated cells. Organoids showed a high expression of Ki-67 and the in situ
hybridization (ISH) of Lgr5 marker showed that it was very focally expressed by some
apical and peripheral cells.
Moreover, the mutation pattern of organoids in formalin fixed paraffin embedded (FFPE)
sections reflected that in the original tumour sample (Table 5).
3.4 Trypan blue viability assay
Organoids were disaggregated and seeded in triplicates into a 6 well plate (3-4 ×
105 cells per well). After 24 hours they were treated with 5 mM metformin for 120 hours
or left untreated. Fresh medium added with metformin was replaced every 24 hours. Cells
were pelleted and disaggregated by vigorous pipetting in trypsin for 5-10 minutes.
Disaggregated cells were put on ice and 50 ul in triplicate were added with an equal
volume of trypan blue and loaded on a burker chamber for counting.
3.5 Bromodeoxyuridine (BrdU) proliferation assay
CRC cells were seeded at a concentration of 1 × 10⁴ directly on 13 mm diameter
coverslips (ThermoFisher Scientific). After 24 hours HT29, HCT116 and HCT116P53-/-
cell lines were treated with 5 mM metformin and DLD-1 cells with 10 mM metformin,
Table 5. Genetics characterization of the origin tumour and of the derived CRC-pc organoids
LKB1 BRAF KRAS TP53
Surgical sample N.D. V600E WT R273H CRC-pc organoids WT V600E WT R273H N.D. not detected

39
dissolved in medium or left untreated for 24, 48 or 72 hours. Cells were incubated with 33
µM BrdU (Sigma Aldrich) dissolved in medium. After 2 hours coverslips were washed
twice in 1X PBS and stored at 4oC. Cells were incubated 45 minutes with anti-BrdU
primary antibody (BD Bioscience) diluted 1:5, and then they were treated 45 minutes with
secondary antibody FITC-conjugated (Jackson Immuno Research) at 1:50 dilution. To
visualize the nuclei, cells were treated with DAPI (4',6-diamidino-2-phenylindole; Sigma
Aldrich) diluted 1:3000 in 1 X PBS. Images were acquired with an Olympus BX-61
automated upright microscope (Shinjuku).
3.6 Fluorescence-activated cell sorting (FACS)
Cells were plated in 10 mm Petri dishes (2 x 10⁵ cells/well) and after 24 hours
treated with metformin or left untreated for 72 or 120 hours. Cells were harvested, and
washed with 0.5% BSA and 2 mM EDTA and dissolved in PBS. Then, 5 x 10⁵ cells were
suspended in 50 µl of buffer containing 1 X PBS, 0.5% BSA and 2 mM EDTA followed
by the addition of 1µl of fluorescent dye-conjugated monoclonal antibody CD133-PE or
CD44-PE (Myltenyi Biotec). Cells were incubated for two hours in the dark at 4°C,
washed and suspended in 200 µl of the buffer described above and analyzed using a
FACSCanto II (Becton Dickinson).
3.7 RNA extraction from cells
Total RNA was extracted from cells using the Trizol reagent (Invitrogen). After
adding 500 µl of this reagent and 100 µl of chloroform, the samples were left at RT for 5
min. Subsequently, samples were centrifuged at 12000 rpm for 15 min at 4°C and the
supernatant was transferred into a new tube where the same amount of isopropanol was
added. After adding 5 µl of glycogen (5mg/mL, Ambion), the samples were left at RT for
15 min and then centrifuged again at 12000 rpm for 15 min at 4°C. The supernatant was
removed, 400 µl of ice cold 75% ethanol was added to the aqueous phase and the mixture

40
was centrifuged at 13200 rpm for 10 min at 4°C. After removing the supernatant, the pellet
was dried and resuspended with RNAse-free water.
3.8 Quantitative real-time PCR (qRT-PCR)
TaqMan gene expression assays were used for qRT-PCR. Briefly, 500 ng of total
RNA in a final volume of 20 µl were reverse transcribed to cDNA using High-Capacity
cDNA Reverse Transcription Kit according to the manufacturer’s instructions
(ThermoFisher). qRT-PCR was performed using the FAST chemistry (ThermoFisher) with
the manufacturer provided gene-specific assay (CD44 Hs00153304_m1 and LGR5
Hs00173664_m1) in ABI PRISM 7900 HT Real-Time PCR system (ThermoFisher). The
expression levels of each assay were normalized to that of GAPDH (Hs99999905_m1).
Data analysis was done using the Sequence Detector version, SDS 2.1.
3.9 Cell Cycle analysis
Cells were plated in 10 mm Petri dishes (5×10⁵ cells/well) and after 24 hours
treated with metformin, targeted drugs (alone or in combination with metformin) or left
untreated for 72 or 120 hours. Cells were scraped, rinsed twice with 1 X PBS and fixed in
ice-cold 70% ethanol. For total DNA content 106 cells were stained with a solution
containing 50 µg/ml propidium iodide and 250 µg/ml RNase I (Roche Diagnostics) and left
overnight at 4°C. Cell cycle distribution was evaluated by flow-cytometric analysis of
cellular DNA content via FACS instrument (Beckton & Dickinson).
3.10 Western Blotting analysis
Logarithmically growing cells were treated with metformin or targeted drugs
(alone or in combination with metformin) or left untreated for 72 or 120 hours. Then cells
were washed twice with ice-cold PBS, collected by trypsinisation and resuspended in 300

41
μl of 1X SDS sample buffer (50 mM Tris, pH 8.0, 50 mM NaCl, 0.5% Triton X-100, 0.1%
sodium deoxycholate, 0.25% sodium dodecyl sulphate (SDS)) supplemented with protease
inhibitors (Calbiochem), and phosphatase inhibitor cocktail (PhosSTOP Roche). The
suspensions were then sonicated for 5 seconds (two cycles) to shear DNA and reduce
viscosity. For each sample 40 μg of protein lysate were precipitated using 100% cold
acetone for 20 minutes at -20°C, then centrifuged at 8000 rpm for 7 minutes and dried in a
speed vacuum for 10 minutes. Protein quantification was performed using the BCA protein
assay (Thermo Scientific). The pellets were resuspended in 20μl of 1X loading buffer (200
mM Tris HCl pH 6.8, 8% SDS, 0.4% Bromophenol blue, 40% Glycerol) and then boiled at
98°C for 5 minutes. Samples were loaded onto to 8-12% polyacrylamide gels. Proteins
were then transferred on Nitrocellulose membranes (Whatman PROTRAN) with porosity
of 0.2 µm or 0.45 µm depending on the size of the protein being detected. Membranes
were blocked with 5% non-fat dry milk in Tris-buffered saline with 0.1% Tween-20 and
incubated with primary antibodies. The primary antibodies used for Western blotting are
showed in Table 6. Immmunoreactive proteins were visualized using chemiluminescence
(SuperSignal West Dura Chemiluminescent Substrate, Thermo Scientific) and protein level
quantification was performed using the software Imagelab©.
Table 6. Antibodies used for immunoblotting analysis.
Antigen Antibody Type Species Dilution Supplier
phospho-Rb (Ser780)
(C84F6) #3590 Monoclonal Rabbit 1:1000 Cell Signaling
Cyclin D1 (H-295) sc-753 Polyclonal Rabbit 1:500 Santa Cruz
Biotechnology
Cyclin E1 (HE12) #4129 Monoclonal Mouse 1:1000 Cell Signaling
c-Myc (D84C12) #5605 Monoclonal Rabbit 1:1000 Cell Signaling
cleaved-PARP (Asp214)
(Human Specific) #9541 Polyclonal Rabbit 1:1000 Cell Signaling
LC3B #2775 Polyclonal Rabbit 1:1000 Cell Signaling
AMPKα #2793 Monoclonal Mouse 1:1000 Cell Signaling

42
phospho-AMPKα
(Thr172) (40H9)
#2535 Monoclonal Rabbit 1:1000 Cell Signaling
S6 Ribosomal Protein
(54D2) #2317 Monoclonal Mouse 1:1000 Cell Signaling
Phospho-S6 Ribosomal
Protein (Ser240/244) #2215 Polyclonal Rabbit 1:1000 Cell Signaling
4E-BP1(53H11) #9644 Monoclonal Rabbit 1:1000 Cell Signaling
phospho-4E-BP1
(Thr37/46) #9455 Polyclonal Rabbit 1:1000 Cell Signaling
mTOR #2972 Polyclonal Rabbit 1:1000 Cell Signaling
phospho-mTOR
(Ser2448) (D9C2) XP #5536 Monoclonal Rabbit 1:1000 Cell Signaling
IGF-1 Receptor β #3027 Polyclonal Rabbit 1:1000 Cell Signaling
phospho –IGF-1 Receptor β (Tyr1135/1136)/Insulin Receptor
#3024 Monoclonal Rabbit 1:1000 Cell Signaling
p44/42 MAPK (Erk1/2) #9102 Polyclonal Rabbit 1:1000 Cell Signaling
Phospho-p44/42 MAPK
(Erk1/2) Thr202/Tyr204)
(20G11)
#4376 Monoclonal Rabbit 1:1000 Cell Signaling
Akt (pan) (40D4) #2920 Monoclonal Mouse 1:2000 Cell Signaling
phospho-Akt (Ser473)
(D9E) XP #4060 Monoclonal Rabbit 1:2000 Cell Signaling
Src (36D10) #2109 Monoclonal Rabbit 1:1000 Cell Signaling
phospho-Src Family
(Tyr416) #2101 Polyclonal Rabbit 1:1000 Cell Signaling
EGFR (1005) sc-03 Polyclonal Rabbit 1:1000 Santa Cruz
Biotechnology
phospho-EGFR (Tyr1068)
(D7A5) XP #3777 Monoclonal Rabbit 1:1000 Cell Signaling
Vinculin V9131 Monoclonal Mouse 1:5000 Sigma-
Aldrich
β-actin A2066 Polyclonal Rabbit 1:5000 Sigma-
Aldrich

43
3.11 Senescence-associated (SA)-β-galactosidase activity
CRC cell lines were seeded in a 35 mm multi-well plate (3.75 – 30 × 104
cells/well) and treated with 5 mM metformin dissolved in medium or left untreated. After
72 hours the SA-β-galactosidase activity was detected using the Senescence β-
galactosidase staining kit (Cell Signaling Technology) in accordance with the
manufacturer's instructions. Cell images were acquired under reflected light using an
Olympus IX81 motorized inverted microscope (Shinjuku). Positive control for β-
galactosidase assay was obtained as described in Vizioli et al., 2014.
3.12 Apoptosis assays
For all the apoptosis assays the adherent cells were collected by trypsinization and
then pooled together with the detached cells from the same sample.
3.12.1 TUNEL (TdT-FITC)
TUNEL assay was performed using the In Situ Cell Death Detection Kit
Fluorescein (Roche) for detection of single and double stranded DNA breaks that occur at
the late stages of apoptosis. Cells were seeded at concentration of 5 × 10⁵ and, after 24
hours, treated with metformin or left untreated for 72 hours. Cells were harvested, washed
with 1X PBS, fixed in 1% formaldehyde for 20 minutes on ice. Subsequently, the cells
were washed with buffer (1 X PBS, 1% BSA) and fixed in ice-cold 70% ethanol. Cells
were washed with buffer and incubated with the TdT (Terminal deoxynucleotidyl
Transferase) enzyme and label solution (fluorescein-dUTP) for 1 hour at 37oC. After
washing with PBS containing 1% BSA, the label incorporated was visualized on a
FACSCanto II (Becton Dickinson).

44
3.12.2 Caspase-3 assay
Cells were seeded at the density of 5 × 10⁵ cells and after 24 hours treated with
metformin or left untreated for 72 hours. Cells were harvested, washed with 1 X PBS,
fixed in 1% formaldehyde dissolved in 1 X PBS for 20 minutes on ice. Cells were washed
with buffer and fixed in ice-cold 70% ethanol. After another washing cells were
resuspended in 1 X PBS, 0.1% Triton X-100 and incubated for 10 minutes at RT. Cells
were washed in buffer and resuspended in 1 X PBS, 10% normal goat serum for 30
minutes. Cells were resuspended in 100 µl buffer containing antibody anti caspase-3 (Cell
Signaling Technology) diluted 1:50 and incubated for 1 hour at RT. This was followed by
a second staining with a rabbit anti FITC (fluorescein) polyclonal antibody (Cell Signaling
Technology) diluted 1:50 and incubated for 1 hour at RT in the dark. Cells were analyzed
on a FACSCanto II (Becton Dickinson).
3.13 Western blot for apoptotic control
Logarithmically growing HL-60 cells were treated with camptothecin (CPT) 0.1
µM or left untreated for 8 hours. Protein extraction and immunoblot protocol were
performed as preliminary reported.
3.14 Immunofluorescent staining and image analysis for autophagy
CRC cell lines were seeded at the density range of 2.5 – 10 × 104 cells directly on
13 mm diameter coverslip. After 24 hours cells were treated with 5 mM metformin
dissolved in medium or left untreated. After 72 hours cells were fixed in 4%
paraformaldehyde, permeabilized with ice-cold 100% methanol and blocked with 1 X PBS,
5% normal goat serum and 0.3% Triton X-100. After blocking, the coverslips with cells
were incubated with anti-LC3B antibody, used 1:400 in dilution buffer (1 X PBS, 1% BSA,
0.3% Triton X-100), overnight at 4°C in the dark. Coverslips were incubated with

45
secondary antibody for 2 hours in the dark at RT. To visualize the nuclei, cells were treated
for 2 min with DAPI (4',6-diamidino-2-phenylindole) and diluted 1:3000 in 1 X PBS.
Finally the coverslips were placed on a support in presence of mowiol mounting solution
overnight at RT in the dark. Images were acquired with Olympus BX-61 automated
upright microscope (Shinjuku).
Hela cells were used as positive control for the autophagy assay. Cells were seeded at the
density of 12.5 × 10⁴ cells directly on 13 mm diameter coverslip (Fisher Scientific). After
24 hours cells were treated for 24 hours with 50 µM chloroquine dissolved in medium or
left untreated.
3.15 Clonogenic Assay
CRC cells were seeded in 35 mm multi-well plates (102 cells/well) and treated
with 5 mM metformin dissolved in medium or left untreated for 6, 12 and 18 days. Every 3
days medium was refreshed. To verify their ability to restart their growth after prolonged
treatments with metformin, cells were treated with metformin for 6, 12 and 18 days and
allowed to grow for 6, 12 and 18 days respectively in fresh medium in absence of the drug.
At the end of treatments, the wells were rinsed with PBS and stained with Crystal Violet
(Sigma Aldrich) for 2 min. Only the clearly visible colonies were counted under the
microscope.
3.16 Viability assays in combinatorial treatments: chemotherapy drugs
and metformin
To assess the effects of chemotherapy drugs in combination with metformin,
MTT viability assays were performed as previously described. The drugs were tested alone
or combined in different settings. For each drug the concentration administered was its
IC50; metformin was used at the concentration of 5 mM. The cells were exposed to

46
individual drugs alone or to their combined treatment for 96 hours or in different
sequences, metformin at first or vice versa (where metformin and the chemotherapy drugs
were given for 72 and 24 hours, respectively). Cells were also exposed to longer treatments
where chemotherapy drugs were administered for 3 days and then the medium was
replaced with metformin for 3 more days and vice versa (at first metformin and then
chemotherapy drugs). For each treatment the medium was refreshed every 48 hours.
The experimental design showing the different sequences of the treatments administered is
summarised in Figure 8.
Figure 8. Experimental design of the treatments with metformin and chemotherapy drugs. The cells were left untreated (CTRL, white arrows) or treated with metformin (MET, black arrows) and chemotherapy drugs, 5-FU, Oxaliplatin and irinotecan - (CHEMO, grey arrows), given alone or administered simultaneously (CHEMO-MET, grey/black arrows) for 96 hours. The cells were also exposed to drugs in different sequences: metformin at first or vice versa; where metformin was always administered for 72 hours (replaced in fresh medium after 48 hours) and the chemotherapy drugs were given for 24 (METàCHEMO or CHEMOàMET) or 72 hours (METàCHEMO3 or CHEMO3àMET). In CTRL, MET, CHEMO and CHEMO-MET treatments fresh medium (with or without drugs) was replaced every 48 hours. In CHEMOàMET treatment the medium with chemotherapeutics drugs was added for 24 hours and then replaced for 72 hours with medium containing metformin (fresh medium with metformin was added after 48 hours); in METàCHEMO treatment the cells were treated with metformin for 72 hours (fresh medium with metformin was added after 48 hours) and then for 24 hours with new medium containig chemotherapeutic drugs. In CHEMO3àMET treatment the cells were treated with chemotherapeutic drugs for three days (chemotherapeutics drugs were added at the beginning of treatment and after 48 hours) then for 72 hours with metformin (replaced after 48 hours); in METàCHEMO3 treatment the cells were treated with

47
metformin for 72 hours (metformin was added at the beginning of treatment and replaced after 48 hours), then for 72 hours with chemotherapeutic drugs (replaced after 48 hours). Because in CHEMOàMET and METàCHEMO treatments the chemotherapeutic drugs were administered once, while in the other treatments they were administered twice, a treatment with chemotherapeutic drugs administered for 24 hours would be added as control. 3.17 Drug synergy testing
Analyses for the detection of drug interactions among chemotherapy drugs (5-FU
and oxaliplatin and 5-FU and irinotecan) or among metformin and targeted drugs were
performed. Starting from the IC50 value of the drugs previously obtained, I conducted MTT
viability assays at 72 hours with combination of multiples and submultiples for each IC50:
from 6.25% to 2 times of the IC50.
Effects of the drug interactions were analysed using the CompuSyn software (Compusyn
Inc), which determines the dose-effect of each drug. This software is based on Chou and
Talalay method (Chou and Talalay, 1984) and can determine synergism and antagonism
between drugs through the combination index (CI) theorem: CI =1 is considered additive
effect, CI<1 synergism and CI>1 antagonism.
3.18 Viability assays in combinatorial treatments: chemotherapy
regimens and metformin
To assess the effect of chemotherapy regimens in combination with metformin,
MTT viability assays were performed as previously described. The drugs were tested alone
or combined in different sequences as previously described, as reported in Figure 9. The
concentrations of regimens used in the experiments were determined using the Compusyn
software; metformin was used at the concentration of 5 mM.

48
Figure 9. Experimental design of the combined treatments of metformin with the chemotherapy regimens. The cells were left untreated (CTRL, white arrows) or treated with metformin (MET, black arrows) and chemotherapy regimens (REGIMEN, grey arrows) given alone or administered simultanoeulsy (REGIMEN-MET, grey/black arrows) for 96 hours. The cells were also exposed to drugs in different sequences: metformin at first or vice versa; where metformin was always administered for 72 hours (replaced in fresh medium after 48 hours) and the chemotherapy regimen were given for 24 (METàREGIMEN or REGIMENàMET) or 72 hours (METàREGIMEN3 or REGIMEN3àMET). The regimens investigated are: oxaliplatinum-5-FU (OXA-5-FU) and irinotecan-5-FU (IRI-5-FU). For each condition medium was replaced every 48 hours: In CTRL, MET, REGIMEN and REGIMEN -MET treatments fresh (with or without drugs) was replaced every 48 hours. In REGIMENàMET treatment the medium with chemotherapeutics drugs was added for 24 hours and then replaced for 72 hours with medium containing metformin (fresh medium with metformin was added after 48 hours); in METà REGIMEN treatment the cells were treated with metformin for 72 hours (fresh medium with metformin was added after 48 hours) and then for 24 hours with new medium containig chemotherapeutic drugs. In CHEMO3àMET treatment the cells were treated with chemotherapeutic drugs for three days (drugs were added at the beginning of treatment and after 48 hours) then for 72 hours with metformin (replaced after 48 hours); in METà REGIMEN3 treatment the cells were treated with metformin for 72 hours (metformin was added at the beginning of treatment and replaced after 48 hours), then for 72 hours with chemotherapeutic drugs (replaced after 48 hours). Because in REGIMENàMET and METàREGIMEN treatments the chemotherapeutic drugs were administered once, while in the other treatments they were administered twice, a treatment with chemotherapeutic drugs administered for 24 hours would be added as control.

49
3.19 Data analyses
Data analyses were done using the GraphPad Prism software. The data are
presented as mean values ± standard deviation (SD) and statistically compared between
groups using one-way analysis of variance followed by Student’s t-test. A P-value of <0.05
was considered statistically significant.
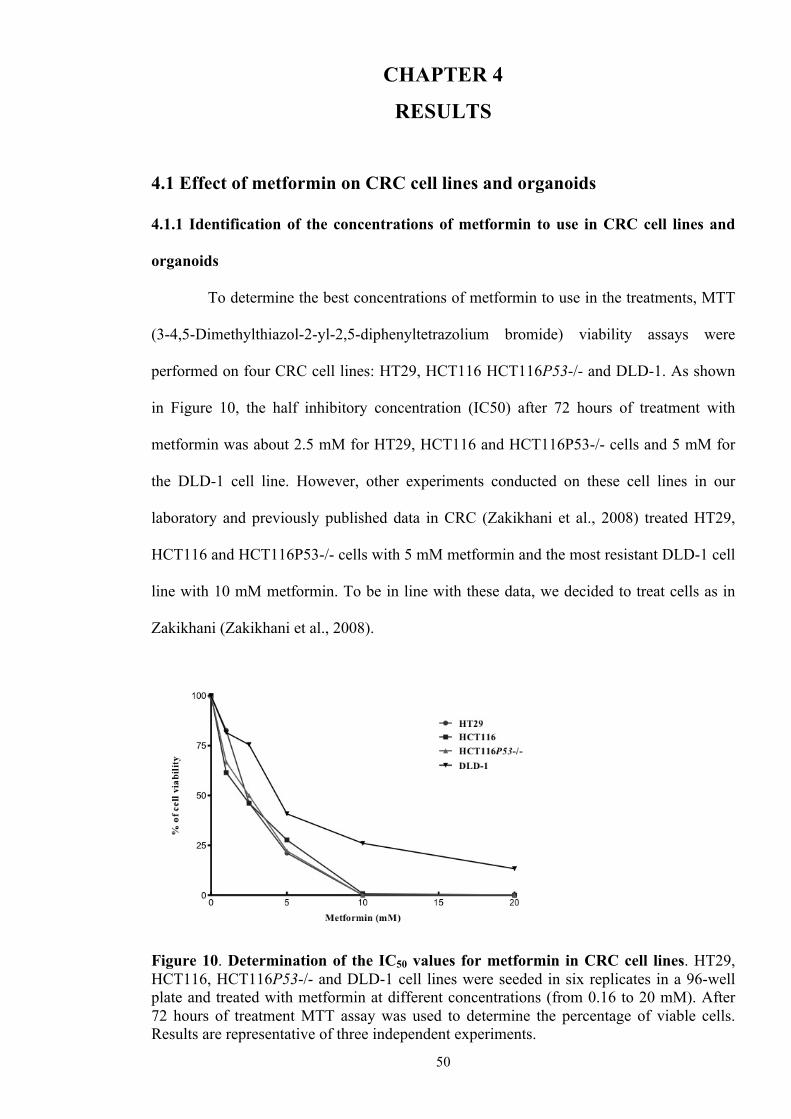
50
CHAPTER 4
RESULTS
4.1 Effect of metformin on CRC cell lines and organoids
4.1.1 Identification of the concentrations of metformin to use in CRC cell lines and
organoids
To determine the best concentrations of metformin to use in the treatments, MTT
(3-4,5-Dimethylthiazol-2-yl-2,5-diphenyltetrazolium bromide) viability assays were
performed on four CRC cell lines: HT29, HCT116 HCT116P53-/- and DLD-1. As shown
in Figure 10, the half inhibitory concentration (IC50) after 72 hours of treatment with
metformin was about 2.5 mM for HT29, HCT116 and HCT116P53-/- cells and 5 mM for
the DLD-1 cell line. However, other experiments conducted on these cell lines in our
laboratory and previously published data in CRC (Zakikhani et al., 2008) treated HT29,
HCT116 and HCT116P53-/- cells with 5 mM metformin and the most resistant DLD-1 cell
line with 10 mM metformin. To be in line with these data, we decided to treat cells as in
Zakikhani (Zakikhani et al., 2008).
Figure 10. Determination of the IC50 values for metformin in CRC cell lines. HT29, HCT116, HCT116P53-/- and DLD-1 cell lines were seeded in six replicates in a 96-well plate and treated with metformin at different concentrations (from 0.16 to 20 mM). After 72 hours of treatment MTT assay was used to determine the percentage of viable cells. Results are representative of three independent experiments.

51
In the clinics, metformin is typically administered at doses of 0.5-1g/day, and its median
plasma concentration is 330 µM (Foretz et al., 2014). In vitro inhibition of cancer cell
proliferation, however, has been reported for millimolar concentrations (Lonardo et al.,
2013) and the concentration used in our and other CRC in vitro studies is therefore higher
than the therapeutic one. However, metformin accumulates in tissues at concentrations that
are several times those found in blood (Foretz et al., 2014), and drug concentrations in the
gut are higher than in the rest of the body (Pernicova et al., 2014). In addition CRC cells
express high levels of the main metformin transporter OCT1, which may increase their
uptake of metformin (Zhang et al., 2006). These observations may justify testing the use of
higher metformin concentrations to treat CRC. MTT viability assay was not applicable to
3D-organoids derived from a CRC mestastasis to the peritoneum (peritoneal
carcinomatosis CRC-pc), because the 3D structure of organoids renders difficult to
metabolize MTT. As shown in Figure 11 A, the best concentration to use for their
treatment (5 mM) was determined by giving to organoids increasing concentrations of
metformin (from 1 to 20 mM) and following their growth over time, until they were
disaggregated (120 hours). Trypan Blue assay confirmed a reduction in cell viability when
organoids were treated with 5mM metformin for 120 hours (Figure 11 B).

52
Figure 11. Microscope images and viability analysis of organoids from CRC-pc. (A) Micrographs of organoids before and after metformin treatment for 120 hours at different drug concentrations. Metformin treatments induced a marked morphological change in organoids, resulting in a loss of their original spheroid organization. Magnifications: 10X. Scale bars = 50 µm. (B) Organoids were treated with 5 mM metformin for 120 hours. The percentage of cell death was determined by Trypan Blue assay. Data are measured percentage of cell death and expressed as the mean ± SD.
4.1.2 Analysis of cell proliferation in CRC cell lines undergoing metformin treatment
A BrdU incorporation assay confirmed that 5 mM metformin inhibited growth in
HT29, HCT116 and HCT116P53-/- cells after 24 hours of treatment, but the effect became
more significant after 72 hours (from 54% to 23% in HT29, from 78% to 44% in HCT116
and from 50% to 26% in HCT116P53-/- cells; Figure 12 A, B, C). In DLD-1 cells a slight
reduction in proliferation was observed after 24 hours of treatment (from 61% to 52%), but
not after 48 and 72 hours (from 57% to 54% and from 46% to 43% respectively; Figure 12
D).

53
Figure 12. Evaluation of the proliferation in CRC cell lines. Cell proliferation in HT29 (A), HCT116 (B), HCT116P53-/- (C) and DLD-1 (D) cell lines was evaluated in vitro by means of BrdU incorporation in absence (Ctrl) or presence of 5 mM for HT29, HCT116 and HCT116P53-/- or 10 mM metformin for DLD-1 after 24, 48 and 72 hours of treatment. Metformin inhibits proliferation in HT29, HCT116 and HCT116P53-/- cell lines at all time points. In DLD-1 cells the reduction is observed only after 24 hours of treatment. Results, derived from three independent experiments, are represented as the mean ± SD compared with the untreated control group (*P < 0.05, **P < 0.01, ****P < 0.0001).
4.1.3 Evaluation of stem cell markers in CRC cell lines and organoids
The expression of the CRC stem cell markers CD44, CD133 and of Lgr5 was
evaluated on the four CRC cell lines and on the organoids. As shown in Figure 13,
treatment with metformin significantly decreased the expression of CD133 (not expressed
in HCT116P53 -/- cells), CD44 and Lgr55 (which was expressed only in HT29 cells (Chen
et al., 2014) and in the organoids).
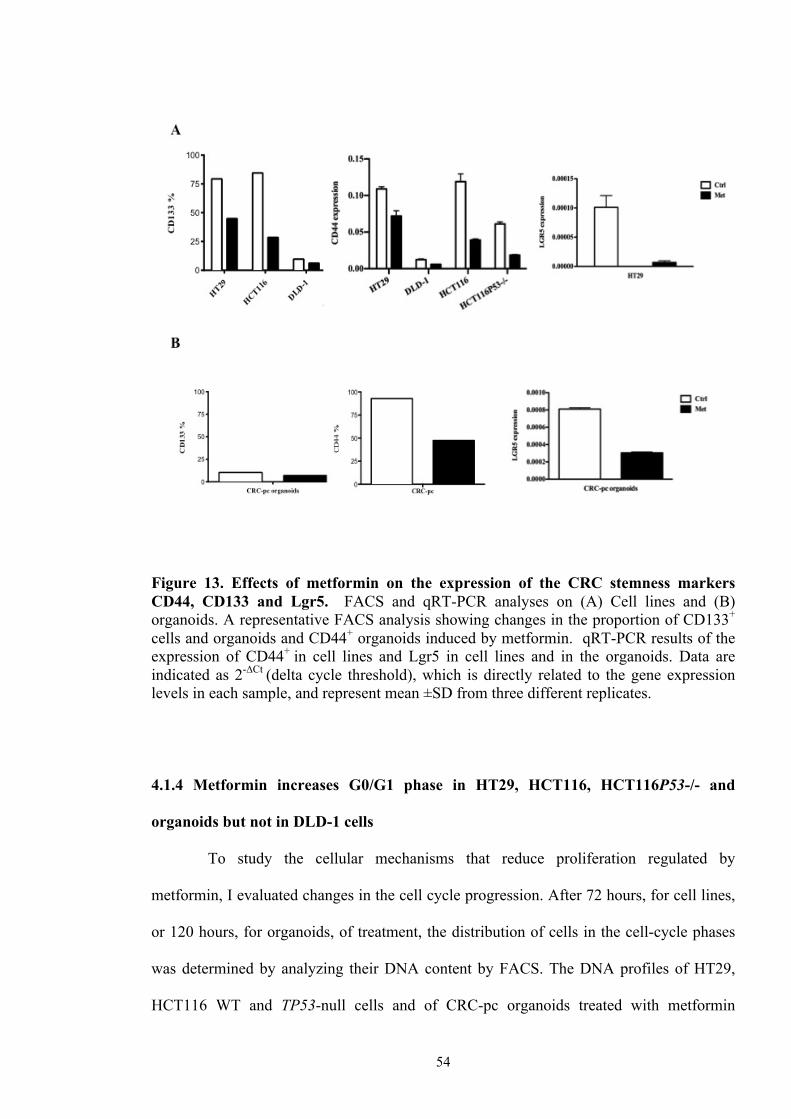
54
Figure 13. Effects of metformin on the expression of the CRC stemness markers CD44, CD133 and Lgr5. FACS and qRT-PCR analyses on (A) Cell lines and (B) organoids. A representative FACS analysis showing changes in the proportion of CD133+ cells and organoids and CD44+ organoids induced by metformin. qRT-PCR results of the expression of CD44+ in cell lines and Lgr5 in cell lines and in the organoids. Data are indicated as 2-∆Ct (delta cycle threshold), which is directly related to the gene expression levels in each sample, and represent mean ±SD from three different replicates.
4.1.4 Metformin increases G0/G1 phase in HT29, HCT116, HCT116P53-/- and
organoids but not in DLD-1 cells
To study the cellular mechanisms that reduce proliferation regulated by
metformin, I evaluated changes in the cell cycle progression. After 72 hours, for cell lines,
or 120 hours, for organoids, of treatment, the distribution of cells in the cell-cycle phases
was determined by analyzing their DNA content by FACS. The DNA profiles of HT29,
HCT116 WT and TP53-null cells and of CRC-pc organoids treated with metformin

55
compared to that of untreated cells (or organoids) showed a slight accumulation of cells in
G0/G1 phase (from 50% to 63% in HT29, from 49% to 64% in HCT116, from 36% to
46% in HCT116P53-/- cells and from 56% to 70% in the organoids; Figure 14 A). A
corresponding decrease in the percentage of the G2/M phase fraction (from 7% to 5.5% in
HT29, from 16% to 13% in HCT116 and from 29% to 22% in HCT116P53-/- cells)
respect to the untreated cells was observed. Organoids treated with metformin showed a
decrease of cells in S phase (from 31% to 17%), while DLD-1 cells had no changes in the
cell cycle.
To confirm that metformin treatment induced an increase of cells in the G0/G1 phase I
evaluated the expression of two cyclins, cyclin D1 and cyclin E, which are involved in the
progression through G1 phase (cyclin D1) and the transition from G1 to S phase (cyclin E).
Decrease in their levels could be associated with cell cycle arrest. Western blot analysis
showed that cyclin D1 (expressed at low levels in HT29 cells) was downregulated in all the
cell lines tested, included DLD-1 cells, and even in CRC-pc organoids, which support the
cell cycle arrest in the G0/G1 phase observed (Figure 14 B). In line with the inactivation of
cyclin D1, metformin decreased the phosphorylation of its downstream target
retinoblastoma protein (pRb; Ser780) in all the cell lines; the organoids did not express this
protein. Cyclin E (not expressed in the organoids) had no change of expression in HT29,
HCT116 and HCT116P53-/- but decreased in DLD-1 cells (Figure 14 B). The strong
reduction of the expression of c-Myc confirmed the decrease of cells in S phase.

56
Figure 14. Cell cycle analysis and expression of related protein in CRC cell lines and in organoids. (A) Proliferating colorectal cancer cell lines and CRC-pc were treated with metformin, Met, (+) or left untreated (-) for 72 hours (cell lines) or 120 hours (organoids). The cell cycle profiles were analysed by flow cytometry; an increase in G0/G1 fraction was observed in HT29, HCT116 WT and TP53-null cells and in the organoids. (B) Immunoblotting of pRb, cyclin D1, cyclin E and c-Myc in the CRC cell lines and in organoids treated with metformin (+) or left untreated (-) at the same times reported above. Cyclin D1, pRb and c-Myc, when expressed, are downregulated in all the cell lines, cyclin E decreased only in DLD-1 cell line. β-actin was used as loading control. The presented data derive from one of the three independent experiments performed.
4.1.5 Treatment with metformin does not induce senescence, apoptosis or autophagy
To investigate the biological mechanisms by which metformin appears to inhibit
cell cycle progression, I assessed its ability to induce a permanent cell cycle arrest
(senescence) or trigger cell death programs (apoptosis or autophagy) in the four cell lines.
As regards the organoids, which grow as 3D structures, I could only evaluate protein
changes by western blotting since most the assays I used are designed for disaggregated

57
cells that grow as monolayer. Cellular senescence is an irreversible form of cell cycle
arrest in which cells change their morphology, become flat and display a pH-dependent β-
galactosidase activity. Using a commercial system that detects the β-galactosidase activity
of senescent cells, I observed no changes in morphology and β-galactosidase staining of
cells after treatment with metformin in all of the tested cell lines, thus excluding activation
of senescence (Figure 15).
Figure 15. Analysis of senescence in CRC cell lines. Senescence was measured using the senescence-associated β-galactosidase (SA-β-Gal) activity assay. The cells were treated with metformin (+) or left untreated (-) for 72 hours. The images were acquired at 20x magnification. As shown in the images, no induction of senescence was reported in all cell lines. The positive control for the experiment is shown on the bottom panel: human primary thyrocytes carrying ER:RAS vector were left untreated (-) or treated (+) with 200 nM 4-hydroxytamoxifen (4-OHT) for 7 days (magnification 40x). Data are from a representative experiment out of the three done independently.

58
Apoptosis, a programmed mechanism of cellular self-killing, was evaluated by FACS
analysis for Caspase-3 and TUNEL (Terminal deoxynucleotidyl transferase dUTP Nick
End Labeling) assay, two different methods that detect the early and the late phases of
apoptosis, respectively. Both assays showed no induction of apoptosis after 72 hours of
treatment for all the tested cell lines (Figure 16 A-B). The absence of apoptosis was also
confirmed by the lack of increase in cleavage of Poly (ADP-Ribose) polymerase protein
(PARP; Asp214), a marker for late-stage apoptotic events, both in cell lines and in the
organoids (Figure 16 C).
Figure 16. Apoptosis assays in CRC cell lines and in the organoids. (A) Flow cytometric detection of cells containing active caspase-3, (B) TUNEL analysis on the cell lines and (C) protein detection of cleaved-PARP of the cell lines and of organoids treated with metformin (+) or left untreated (-) for 72 hours (cell lines) or 120 hours (organoids). The HL-60 cell line (bottom panel) was used as positive control: cells were treated with camptothecin (CPT +) or left untreated (-) for 8 hours. No apoptosis was reported in all the experiments. β-actin was used as loading controls. Results are representative of three independent experiments.

59
As regards autophagy, I monitored the conversion of the autophagy marker microtubule-
associated protein light chain 3 (LC3) from LC3-I to LC3-II, which is related to the
presence of autophagosomes, double-membrane vesicles assembled during autophagy.
Western blotting analysis of the ratio between LC3-I and LC3-II, as well as
immunofluorescence for LC3B, were not significantly different after treatment with
metformin, thus excluding the induction of autophagy in all cell lines and also in CRC-pc
organoids (Figure 17).
Figure 17. Autophagy detection in CRC cell lines and in the organoids. (A) Immunofluorescence staining of LC3B in the cell lines treated with metformin (+) or left untreated (-) for 72 hours (magnification 20x). The positive control is in the panel on the right: Hela cells treated with 50 mM chloroquine (+) or left untreated (-) for 24 hours (magnification 40x). (B) Immunoblotting determination of LC3B protein in the cell lines and in the organoids treated with metformin (+) or left untreated (-) for 72 or 120 hours. β-actin was used as loading control. No autophagy was detected in both the experiments. The presented data derives from one of the three independent experiments performed.

60
4.1.6 Metformin-induced inhibition of proliferation is reversible
To clarify the absence of induction of cell death after administration of metformin I
examined the clonogenic capacity of the cell lines in the presence of the biguanide.
Clonogenic cell survival assay defines the ability of a single cell to proliferate and form a
large colony. I evaluated as metformin can stop the proliferation of CRC cells and also if
the cells previously treated with metformin and then maintained on growth without the
drug (here and after named “rescued cells”, R), are able to restore their proliferation
capacity in each time of treatment. Treatment for 6 days with metformin significantly
reduced both the number and size of colonies compared to the untreated controls in HT29,
HCT116 and HCT116P53-/- (Figure 18 A). This result was confirmed after 12 days and
was maintained up to 18 days of treatment (Figure 18 B-C). At this last time, colonies of
untreated and rescued cells were larger and thicker than the other times. The confluence of
the cells on these plates caused a massive detachment of the colonies during the treatment
with crystal violet.

61
Figure 18. Clonogenic ability of the CRC cell lines. The cells were grown for 6 (A), 12 (B) and 18 (C) days in the presence (Met, or +) or absence (Ctrl, or-) of metformin. The rescued colonies (R) were obtained after growth of cells treated with metformin for 6, 12 or 18 days for further 6, 12 or 18 days respecitively in fresh complete medium without metformin. The graphic representation of the results is shown on the right side of the figure. Metformin reversibly inhibits colony formation of all the cell lines analysed. The bars indicate the mean value ± SD of three independent experiments (*P < 0.05, **P < 0.01, ***P < 0.001, ****P < 0.0001).

62
At all time points of treatment rescued cells resumed their proliferation capacity, although
the recovery was less evident in HCT116 TP53-null cells. This effect does not seem to
depend on TTP53 status, which is also mutated in HT29 cells. These results are in
agreement with the absence of cell death observed, and highlight that the inhibitory effect
of metformin on proliferation of HT29, HCT116 WT and TP53-null cells is transient, and
may be overcome after the removal of the drug.
In accordance with the absence of cell cycle arrest observed in the DLD-1 cells,
differences in the ability of forming colonies did not occur in DLD-1 cells at the three time
points analysed.
Although MTT assay demonstrated that the concentration of metformin I used for DLD-1
cells (i.e. 10 mM) was sufficient to stop the growth of 50% of the cells, the results I
obtained by testing different mechanisms known as modulated by metformin are
controversial and do not fully support an effect of the biguanide on DLD-1 cells, at least at
the concentration used. In fact, the DLD-1 cells had a slight decrease in proliferation
(BrdU assay) only after 24 hours of treatment with metformin and did not show cell cycle
arrest, despite the decrease of c-Myc and cyclins D1 and E.
Most likely the hypermethylation of both alleles of the LKB1 gene, which plays a critical
role in activating AMPK, limits the effects of metformin on these cells and makes more
difficult understanding the mechanisms modulated by metformin in CRC. This is why I
decided to study in details only the other three models of CRC, which all carry a functional
LKB1 gene.
4.1.7 Metformin transiently inhibits mTOR proliferation pathway and reduces the
activation of IGF1R
To investigate the molecular mechanisms by which metformin may inhibit the
proliferation of CRC cells, I assessed by western blotting analysis changes of activation of
the Insulin-like growth factor 1 β (IGF1Rβ) protein and of proteins from the

63
AMPK/mTOR pathway on HT29, HCT116 and HCT116P53-/- cells and on the organoids.
The inhibition of phosphorylation of mTOR (Serine2448) and of its downstream targets S6
(Ser 240/244) and 4E-BP1 (Thr 37/46) was observed in all cell lines tested after treatment
with metformin (Figure 19).
Figure 19. mTOR pathway and IGF1Rβ in CRC cell lines and in the organoids. Cell lines and CRC-pc organoids were treated with metformin (+) or left untreated (-) for 72 hours (cell lines) or 120 hours (CRC-pc organoids). The “rescued” cells (R) were grown for 72 hours (cell lines) or 120 hours (CRC-pc organoids) with metformin and for a further 72 or 120 hours in fresh complete medium without the drug. Metformin reversibly inhibits the activity of proteins from the mTOR pathway and of IGF1Rβ. β-actin and vinculin were used as loading controls. The results are representative of at least three independent experiments.
However AMPK resulted phosphorylated (Thr172) only in the HT29 cell line and in the
organoids, suggesting the presence of alternative mechanisms for the inactivation of this
pathway in both HCT116 cell lines. After treatment with metformin, I also observed

64
reduction of IGF1Rβ protein phosphorylation (Tyr1135/36) in the three cell lines analysed,
suggesting a reduced activity of the receptor. Expression of IGF1Rβ was very weak in
organoids and its phosphorylation did not change after the addition of metformin.
In all cases the phosphorylation profile of the rescued cells was similar to that of the
untreated cells confirming what was observed in the colony formation assays and
supporting the hypothesis that the inhibitory effect of the drug on cell proliferation is only
transient.
4.1.8 Summary of key findings
Treatment with metformin:
• reduces cell proliferation and induces block in G0/G1 phase
• acts on the cancer stem cell component
• induces a transient and reversible block of cell proliferation
• transiently inhibits the mTOR pathway and IGF1R activation
4.2 Effects of metformin in combination with chemotherapy
The experiments with metformin on the cell lines and on the organoids highlight
its cytostatic effect on CRC, and set the bases for testing the biguanide together with other
drugs, to identify possible cytotoxic combinations. To this aim I have explored the effects
of metformin in combination with the standard chemotherapy drugs used for CRC
treatment, (5-FU), oxaliplatin (OXA) and irinotecan (IRI), which interfere with DNA
synthesis. The effects of these drugs are different: 5-FU blocks thymidine synthesis and
stops DNA replication; OXA forms cross links in DNA, preventing DNA replication and
transcription, and IRI inhibits the topoisomerase I, leading to block of both DNA
replication and transcription. In our hypothesis their combination with metformin could
enhance the effects of chemotherapy and result in increased cell death.

65
We focused on the CRC cell lines, for which there are data in the literature on the
sensitivity or resistance to standard chemotherapy, and also because organoids are difficult
to treat with the compounds commonly used for viability assays (for example MTT).
In the literature there are several reports on the IC50 for 5-FU, OXA and IRI for the three
CRC cell lines that I am using, even though they give different concentrations. This is
because different protocols to determine cell viability (e.g. sulphorhodamine B assay,
CellTiter 96 Non-Radioactive Cell Proliferation Assay and MTT) as well as various times
of exposure to drugs (e.g. 1, 24 or 72 hours) have been used. Several IC50s have been
proposed for 5-FU (4.2 µM, 5.2 µM, 8.2 µM, 20 µM and 112 µM), OXA (0.33 µM, 9 µM,
24 µM) and IRI (1 µM, 7.8 µM, 13.8 µM, 550 µM) in HT29 cells. The published IC50
concentrations of chemotherapy drugs in HCT116 were 0.7 µM and 4.3 µM for 5-FU, 0.3
µM, 2.2 µM and 38 µM for OXA, 2.2 µM and 3.2 µM for IRI; in HCT116P53-/- the
identified IC50 were 19.7 µM for 5-FU, 1.7 µM for OXA and 3.1 µM for IRI (Barone et al.,
2007, Boyer et al., 2004, Flis et al., 2009, Guichard et al., 2001, Guichard et al., 1998,
Mans et al., 1999, Mariadason et al., 2003, Nannizzi et al., 2010). Starting from data from
the literature, I determined for each cell line the IC50 value after 72 hours of treatment with
various concentrations of the drugs using an MTT viability assay. I established a range of
concentrations for each drug (8 points/treatment) that was applicable to all the cell lines:
from 0.3 µM to 64 µM for 5-FU, from 0.064 µM to 8 µM for OXA and from 0.004 µM to
4 µM for IRI. The viability plots and the IC50 identified are shown in Figure 20 and Table
7 respectively. The IC50 values obtained have been used for the further experiments, also in
combination with metformin which was used at the concentration of 5 mM.

66
Figure 20. Determination of the IC50 values for the chemotherapy drugs in CRC cell lines. HT29, HCT116 and HCT116P53-/- cell lines were seeded in six replicates in a 96-well plate and treated with chemotherapy drugs at different concentrations: 0.3 - 64 µM for 5-Fluoro Uracil (5-FU), 0.064 - 8 µM for oxaliplatin (OXA) and 0.004 - 4 µM for irinotecan (IRI). After 72 hours MTT assay was used to determine the cell viability. Table 4 summarizes the IC50 values of the drugs obtained for each cell line. Results are representative of two independent experiments.

67
Table 7. IC50 values of chemotherapy drugs in the CRC cell lines analysed
HT29 HCT116 HCT116P53-/-
5-FU 10 µM 6.8 µM 7.2 µM
OXA 0.9 µM 0.77 µM 3.2 µM
IRI 0.2 µM 0.024 µM 0.130 µM
4.2.1 Analysis of combinatorial treatments with metformin and single
chemotherapeutic drugs
Because of the various time-serial combinations of metformin with
chemotherapeutic drugs we had to analyse, we decided to use a comparison of cell viability
(i.e. a cell viability assay) than the analysis with the combination index method. To assess
whether combined treatments with metformin and chemotherapy drugs were more
effective than individual treatments to induce a decrease in cell viability, the IC50
concentrations selected for 5-FU, OXA, IRI and metformin were tested alone or combined
in different settings: chemotherapy and metformin administered simultaneously (for 96
hours) or in different sequences, metformin at first or vice versa (where metformin and the
drugs were given for 72 and 24 hours, respectively). I also exposed the cells to longer
treatments with the administration of chemotherapy drugs for 3 days and then the
replacement of the medium with metformin for three more days and vice versa (at first
metformin and then chemotherapy drugs). The experimental design showing the different
sequences of administered treatments is summarised in Figure 8 of the Material and
Methods chapter.
4.2.1.1 Analysis of combinatorial treatments with metformin and 5-FU
As shown in Figure 21 A, metformin (MET) and 5-FU given alone reduced cell
viability in HT29 cells, and the effect was greater for 5-FU (MET vs 5FU, P value <

68
0.0001). The addition of MET to 5-FU (5FU-MET) had almost the same effect of the
treatment with 5FU alone, in terms of cell viability. On the contrary, the administration of
5-FU both for short (1 day) or longer (3 days) times before MET (5FUàMET and
5FU3àMET) increased cell viability (5FU vs 5FUàMET, P value < 0.0001; 5FU vs
5FU3àMET, P value = 0.0005), which is suggestive of an inhibitory effect of MET on 5-
FU. The administration of MET before 5-FU, both for short (1 day) or longer (3 days)
times (METà5FU and METà5FU3), had no effects on the viability of the cells, which
was similar to that observed in the untreated control.
In the two HCT116 cell lines (TP53-WT and TP53-null) MET was more effective than 5-
FU in reducing cell viability (MET vs 5FU in HCT116, P value = 0.0385; in HCT116P53-
/- cells, P value < 0.0001), both when given alone and in combination with chemotherapy
and the effect was stronger for the TP53-null cells (5FU vs 5FU-MET, in HCT116 P value
= 0.0003; in HCT116P53-/- cells, P value < 0.0001; Figure 21 B and C). Sequential
treatment given for a short time (5FUàMET and METà5FU) had more efficacy than
treatments at longer times (5FUàMET vs 5FU3àMET in HCT116, P value < 0.0001, in
HCT116P53-/-, P value = 0.0002) and the strongest effect was achieved when MET was
administered before 5-FU (5FUàMET vs METà5FU in HCT116, P value < 0.0001; in
HCT116P53-/- cells, P value = 0.0084). In HCT116 cells the longer exposure to 5-FU,
both before and after MET (5FU3àMET and METà5FU3), had the lowest effect on the
reduction of cell viability, while in HCT116P53-/- cells treatments for longer times had the
same effects of 5-FU alone.

69
Figure 21. Effects of 5-FU and metformin treatments on CRC cell viability. The cells were seeded in six replicates in a 96-well plate and treated with metformin and/or 5-FU at their respective IC50 values. The cell proliferation rate was measured using the MTT assay. The bars indicate the mean value ± SD of three independent experiments (*P < 0.05, **P < 0.01, ***P < 0.001, ****P < 0.0001). O.D.= optical density.
In summary, metformin has little effect on the viability of HT29 cells and, when given
before 5-FU, it diminishes the efficacy of the chemotherapy. On the contrary, the
biguanide strongly reduces the viability of the two HCT116 cell lines; however, its
combination with 5-FU does not enhance the reduction of cell viability.
4.2.1.2 Analysis of combinatorial treatments with metformin and oxaliplatin
Similarly to what was observed for the treatment with 5-FU, MET and OXA
given alone reduced viability in HT29 cells, and the effect was stronger for OXA (MET vs
OXA, P value < 0.0001), while addition of MET to OXA (OXA-MET) gave similar results
as treatment with OXA alone (Figure 22 A). Sequential treatments were less effective and

70
the administration of OXA before MET both for short and longer times (OXAàMET and
OXA3àMET) reduced the viability of cells better than the opposite sequences of the
drugs (METàOXA and METàOXA3; OXAàMET vs METàOXA and OXA3àMET
vs METàOXA3, P value < 0.0001).
In the two HCT116 cell lines the administration of MET and OXA as single drugs
markedly reduced the cell viability (Figure 22 B-C) and OXA-MET combination was even
more effective (OXA vs OXA-MET in HCT116, P value < 0.0001; in HCT116P53-/-
cells, P value = 0.0472). In HCT116 cells the synergistic effect of the two drugs was
confirmed when OXA was administered sequentially with MET and for short times
(OXAàMET and METàOXA; OXA vs OXAàMET, P value = 0.0078; OXA vs
METàOXA, P value = 0.0103; Figure 20 B). Longer exposure to OXA (OXA3àMET
and METàOXA3) was the treatment less effective. These results were not confirmed in
the HCT116 TP53-null cells where OXAàMET, METàOXA and OXA3àMET
treatments gave similar results to single treatment with MET, and the sequence
METàOXA3 had the lowest reduction of cell viability.
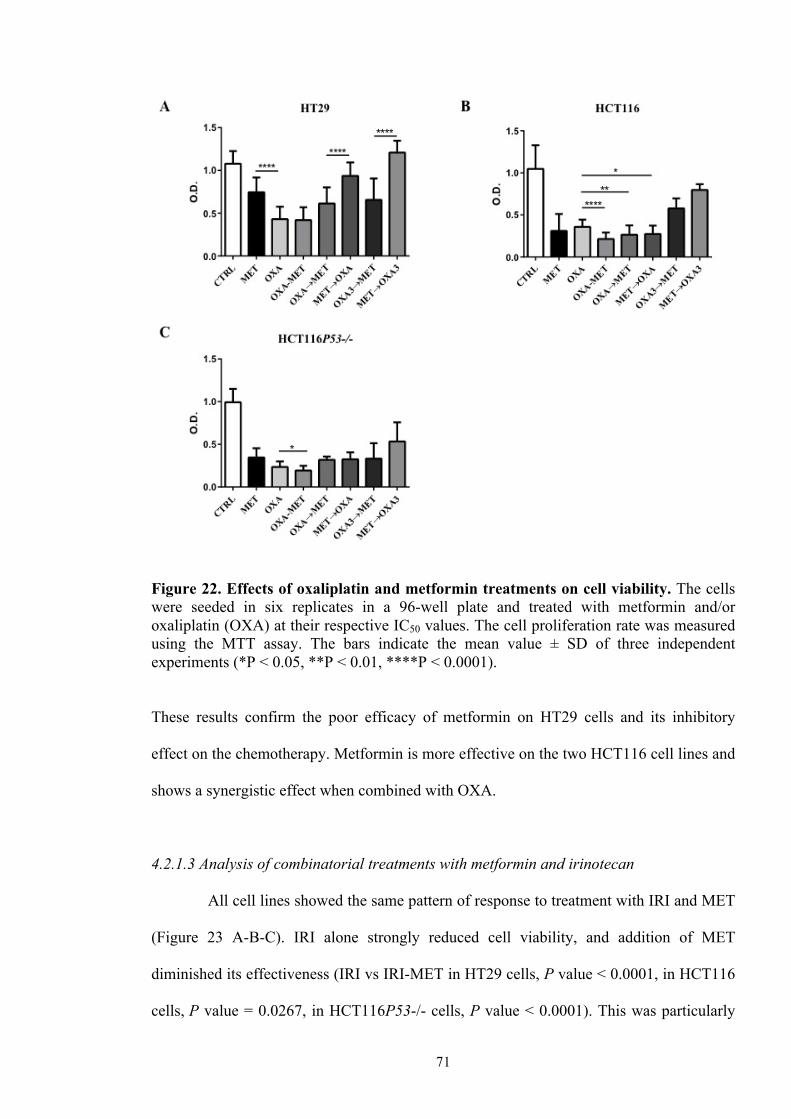
71
Figure 22. Effects of oxaliplatin and metformin treatments on cell viability. The cells were seeded in six replicates in a 96-well plate and treated with metformin and/or oxaliplatin (OXA) at their respective IC50 values. The cell proliferation rate was measured using the MTT assay. The bars indicate the mean value ± SD of three independent experiments (*P < 0.05, **P < 0.01, ****P < 0.0001).
These results confirm the poor efficacy of metformin on HT29 cells and its inhibitory
effect on the chemotherapy. Metformin is more effective on the two HCT116 cell lines and
shows a synergistic effect when combined with OXA.
4.2.1.3 Analysis of combinatorial treatments with metformin and irinotecan
All cell lines showed the same pattern of response to treatment with IRI and MET
(Figure 23 A-B-C). IRI alone strongly reduced cell viability, and addition of MET
diminished its effectiveness (IRI vs IRI-MET in HT29 cells, P value < 0.0001, in HCT116
cells, P value = 0.0267, in HCT116P53-/- cells, P value < 0.0001). This was particularly

72
evident for the sequential treatments in which MET was added before IRI (METàIRI and
METàIRI3), where I observed the highest cell viability, which was almost similar to that
obtained for MET in single treatment. On the contrary, treatment with IRI for 3 days,
followed by MET was the most effective (IRI vs IRI3àMET in HT29 cells, P value =
0.0060, in HCT116 cells, P value < 0.0001, in HCT116P53-/- cells, P value = 0.0154).
These data suggest that metformin could act as antagonist for IRI.
Figure 23. Effect of irinotecan (SN-38) and metformin treatments on cell viability. The cells were seeded in six replicates in a 96-well plate and treated with metformin and/or irinotecan (IRI) at their respective IC50 values. The cell proliferation rate was measured using MTT assay. The bars indicate the mean value ± SD of three independent experiments (*P < 0.05, **P < 0.01, ***P < 0.001, ****P < 0.0001). 4.2.2 Analysis of combinatorial treatments with metformin and chemotherapeutic
drugs administered as regimens
After having determined the effects of metformin in combination with
chemotherapy drugs used for the treatment of CRC, I evaluated the effects of the biguanide
in combination with standard chemotherapy regimens used for the first-line treatment of

73
CRC. These regimes combine 5-FU, folic acid, administered to enhance the effect of
chemotherapy drugs, and OXA (FOLFOX) or IRI (FOLFIRI). I combined different
concentration of the drugs and I have identified the best dose-effect concentration using the
Compusyn software (Chou and Talalay, 1984; Supplementary tables 1-6). The
concentrations of 5-FU combined with OXA and IRI I have selected are shown in Table 8.
Table 8. Combined concentration of chemotherapy drugs obtained by Compusyn
software
HT29 HCT116 HCT116P53-/-
OXA + 5-FU 0.1 µM + 2.5 µM 0.385 µM + 0.85 µM 1.6 µM + 0.9 µM
IRI + 5-FU 0.1 µM + 0.625 µM 0.048 µM + 0.425 µM 0.0325 µM + 0.45 µM
Metformin was used at a concentration of 5 mM. Similarly to what was done for the
experiments where metformin was combined with single drugs, I have tested different
sequences of combined treatments with metformin, whose design is shown in Figure 9 of
the Material and Methods chapter.
4.2.2.1 Analysis of combinatorial treatments with metformin and oxaliplatin-5-FU regimen
I observed that in the cell line HT29 the combination OXA-5FU reduced the
viability of cells better than metformin administered alone (MET vs OXA-5FU, P value =
0.0351) and the simultaneous administration of the regimen and metformin (OXA-5FU-
MET) was even more effective (OXA-5FU vs OXA-5FU-MET, P value = 0.0425; Figure
24 A). When OXA-5FU regimen was administered prior metformin, for short or longer
times (OXA-5FUàMET, (OXA-5FU)3àMET), the reduction of cell growth was
comparable to that observed for treatment with only metformin (MET). Similarly to what
was observed in the combined treatment of metformin with 5-FU and OXA (Figure 21 A

74
and 22 A), when metformin was administered before the chemotherapy drug regimens
(METàOXA-5FU and METà(OXA-5FU)3) reduction of cell viability was less evident.
Metformin confirmed to be very effective in the HCT116 cell line. The biguanide was
more efficient that chemotherapy in reducing cell viability and its administration alone,
along with regimen (OXA-5FU-MET) or before regimen (METàOXA-5FU) was the most
effective treatment in reducing cell viability (MET vs OXA-5FU, P value < 0.0001; Figure
24 B). On the contrary, the regimen OXA-5FU administered before metformin, both for
short or longer time reduced the effectiveness of the biguanide. Finally, the administration
of OXA-5FU for three days after metformin had the same reduction in cell viability as the
regimen alone, confirming the greater sensitivity of HCT116 cells to metformin that to the
regimen.
In HCT116P53-/- cells the OXA-5FU regimen was more effective than metformin
administered alone (OXA-5FU vs MET, P value = 0.0132) and the combination OXA-
5FU-MET (OXA-5FU vs OXA-5FU-MET, P value = 0.0011; Figure 24 C). Indeed,
administration of the regimen before metformin, at short and longer times (OXA-
5FUàMET and (OXA-5FU)3àMET) reduced cell viability more than the opposite
treatments (METàOXA-5FU and METà(OXA-5FU)3 and OXA-5FUàMET vs
METàOXA-5FU, P value = 0.0002; (OXA-5FU)3àMET vs METà(OXA-5FU)3, P
value < 0.0001). Exposure to the regimen for 3 days before metformin ((OXA-
5FU)3àMET) was the most effective treatment (OXA-5FU vs (OXA-5FU)3àMET, P
value < 0.0001).

75
Figure 24. Effect of oxaliplatin-5-FU (OXA-5-FU) regimen and metformin treatments on cell viability. The cells were seeded in six replicates in a 96-well plate and treated with metformin and/or OXA-5FU regimen. Metformin was administered at a 5mM concentration in all the treatments. The regimen concentrations administered have been determined using the Compusyn software: 0.1 µM (OXA) + 2.5 µM (5-FU) for HT29 cells, 0.385 µM (OXA) + 0.85 µM (5-FU) for the HCT116 cell line and 1.6 µM (OXA) + 0.9 µM (5-FU) for HCT116P53-/- cells. The cell proliferation rate was measured using the MTT assay. The bars indicate the mean value ± SD of three independent experiments (*P < 0.05, **P < 0.01, ****P < 0.0001).
In conclusion, metformin combined with regimen was the most effective treatment in
reducing viability of HT29 cells, indicating a likely synergism. HCT116 cells were highly
sensitive to metformin administered alone or in combination with the regimen and its
effect was maintained also after one day exposition to the regimen. In HCT116P53-/- cells
the regimen better reduced cell viability than metformin and the combinatorial treatment
with the biguanide.
76
4.2.2.2 Analysis of combinatorial treatments with metformin and irinotecan-5-FU regimen
I found that the regimen including irinotecan was very efficient in reducing the
viability of HT29 cells, and the addition of metformin administered in combination with
IRI-5-FU or after 1 day of treatment with the regimen, did not increase the effectiveness of
the treatment (Figure 25 A). However, a prolonged exposure to IRI-5-FU followed by
treatment with metformin ((IRI-5FU)3àMET) was the most effective treatment (IRI-5FU
vs (IRI-5FU)3àMET, P value < 0.0001), while administration of metformin before IRI-
5FU greatly reduced the effects of the regimen.
The cell line HCT116 was very sensitive both to metformin and IRI-5-FU regimen (Figure
25 B). However, the addition of metformin to the regimen did not further reduce cell
viability. The administration of metformin followed by longer exposure to chemotherapy
regimen (METà(IRI-5FU)3) had the lowest reduction of viability. Although in
HCT116P53-/- cell line the number or viable cells for all the tested treatment was higher
than in HCT116 cells, a similar trend of response to the different treatments was observed.
Moreover, in the TP53 null cell line the regimen administered for longer time before
metformin (IRI-5FU vs (IRI-5FU)3àMET, P value = 0.0002; Figure 25 C) was the most
effective treatment.

77
Figure 25. Effect of irinotecan-5-FU (IRI-5-FU) regimen and metformin treatments on cell viability. The cells were seeded in six replicates in a 96-well plate and treated with metformin and/or IRI-5FU regimen. Metformin was administered at a 5mM concentration in all the treatments. The regimen concentrations administered have been determined using the Compusyn software: 0.1 µM (IRI) + 0.625 µM (5-FU) for HT29 cells, 0.048 µM (IRI) + 0.425 µM (5-FU) for the HCT116 cell line and 0.0325 µM (IRI) + 0.45 µM (5-FU) for HCT116P53-/- cells. The cell proliferation rate was measured using the MTT assay. The bars indicate the mean value ± SD of three independent experiments (**P < 0.01, ***P < 0.001, ****P < 0.0001).
In the HT29 cell line the addition of metformin increased the effects of the regimen only
when it was administered after a long treatment with IRI-5FU. Both metformin and
regimen, alone and in all the combinations, strongly affected cell viability of HCT116 cells
and the sequential exposure to regimen and metformin for longer times was the most
effective treatment. A similar trend was observed in the HCT116P53-/- cell line, although
with a lower reduction of viability.

78
4.2.3 Summary of key findings
• metformin is very effective in reducing viability of the HCT116 cell lines
• administration of irinotecan (single or as regimen) for 3 days followed by
metformin is the most effective treatment in all the cell lines (probably because
they overexpress IRI target), while the opposite treatment is the worst
• in HCT116 cell lines metformin and oxaliplatin administered together act
synergistically on reducing viability
• combined treatments of metformin with chemotherapeutic drugs can be more
effective than the single biguanide only in some settings and cell lines
4.3 Analysis of combinatorial treatments with metformin and targeted
drugs
I also combined metformin with selective inhibitors of specific proteins expressed
in CRC. I decided to focus on in vitro models of BRAF-mutant CRC because this tumour
type has worse prognosis and is poorly sensitive to standard treatments (Kopets et al.,
2015). The fact that BRAF-mutant CRCs are highly proliferating supports a possible action
of metformin on blocking their growth. I selected three CRC cell lines, differing for their
MMR activity, that when is defective can give microsatellite instability, or carrying
different BRAF mutations: HT29 (microsatellite stable, MSS) and RKO (with defective
MMR activity, microsatellite instable, MSI), both carrying the typical BRAF V600E
mutation, and NCI-H508 cells (MSS) that are characterised by the rare BRAF G596R
mutation, for which there are no specific treatments reported. I chose to use two CRC cell
lines with the same mutation (BRAF V600E) but different in their MMR status because it
has been recently demonstrated an association between MMR activity and clinical
response: patients with MSI tumours are more responsive to immune checkpoint blockade
than patients with MSS tumours (Le et al., 2015). I have treated the three cell lines with

79
metformin in combination with vemurafenib, a selective inhibitor for BRAF V600E
mutation, panitumumab (selective inhibitor for EGFR), dasatinib (Bcr-Abl and Src
inhibitor), regorafenib (a multi-kinase inhibitor) and trametinib (MEK inhibitor; Table 9).
Table 9. List of the target of drugs tested in combination with metformin
Type of drug Target gene
Vemurafenib BRAF
Panitumumab EGFR
Dasatinib Bcr-Abl and Src
Regorafenib VEGFR-1, -2, -3, TIE-1, KIT, RET, BRAF, PDGFR-β, FGFR
Trametinib MEK1, MEK2
Similarly to what I have done for testing the effects of the chemotherapy drugs on CRC
cells, to identify the best concentration of the targeted drugs to administer in combination
with metformin, I conducted MTT viability assays and treated each cell line for 72 hours
with different concentrations of the drugs.
For each cell line, I designed a specific concentration range of vemurafenib for the MTT
test analysis, based on the data of Yang et al. in which HT29 cells were defined highly-
sensitive, RKO intermediate-sensitive and NCI-H508 low-sensitive to the drug (Yang et
al., 2012). The concentration ranges that I selected were as follows: 7.75 nM – 0.248 µM
for HT29 and 0.156 – 20 µM for RKO and NCI-H508. Similarly, HT29 and RKO cells
(carrying the BRAF V600E mutation) are classified as resistant to anti-EGFR treatment,
and NCI-H508 (BRAF G596R) as sensitive (Medico et al., 2015) and the concentration
ranges I chose for the MTT analysis were: 0.54 nM - 10 µM for HT29 and RKO cells and
0.01 nM – 0.34 nM for NCI-H508 cells. As expected, treatment with panitumumab did not
change the viability of HT29 and RKO cells even at the highest concentrations, confirming
their resistance to the drug. For dasatinib, regorafenib and trametinib I established the
concentrations to test based on those recommended by their leaflet and I drew the
following concentration ranges: 30 nM – 100 µM for dasatinib and regorafenib and 0.007

80
nM – 0.12 µM for trametinib. Finally, I performed MTT assays to evaluate the
concentrations of metformin to use for RKO and NCI-H508 cell lines and tested a
concentration range of 0.16 – 20 mM. The viability plots and the IC50 values identified are
shown on Figure 26 and Table 10.
Figure 26. Determination of the IC50 values for targeted drugs and metformin in the BRAF-mutant cell lines. HT29, RKO and NCI-H508 cell lines were seeded in six replicates in a 96-well plate and treated with targeted drugs at different concentrations:7.75 nM - 20 µM for vemurafenib, 0.003 - 10 µM for panitumumab, 30 nM – 100 µM for dasatinib and regorafenib, 0.007 nM – 0.12 µM for trametinib. The concentration range used for determining the IC50 values for metformin in RKO and NCI-H508 cells was 0.16 - 20 mM. After 72 hours MTT assay was used to determine the cell viability. Results are representative of two independent experiments.

81
Figure 26. Determination of the IC50 values for targeted drugs and metformin in the BRAF-mutant cell lines. HT29, RKO and NCI-H508 cell lines were seeded in six replicates in a 96-well plate and treated with targeted drugs at different concentrations:7.75 nM - 20 µM for vemurafenib, 0.003 - 10 µM for panitumumab, 30 nM – 100 µM for dasatinib and regorafenib, 0.007 nM – 0.12 µM for trametinib. The concentration range used for determining the IC50 values for metformin in RKO and NCI-H508 cells was 0.16 - 20 mM. After 72 hours MTT assay was used to determine the cell viability. Results are representative of two independent experiments.

82
Table 10. IC50 values of targeted drugs in the CRC cell lines analysed.
HT29 RKO NCI-H508
vemurafenib 0.12 µM 7.5 µM 10 µM
panitumumab - - 0.17 nM
dasatinib 12.2 nM 12.5 µM 2.5 µM
regorafenib 1.5 µM 3.12 µM 12.5 µM
trametinib 0.5 nM 32 nM 0.5 nM
metformin 5 mM 10 mM 5 mM
Using the CompuSyn software, I studied the effects of the interactions of the different
combinations of the drugs and metformin and identified the concentrations of each drug to
administer to the different cell lines. The combined concentrations of targeted drugs and
metformin with CI<1 I selected are shown in Table 11. All the combinations dasatinib-
metformin tested on NCI-H508 cells showed only antagonism (CI>1; supplementary table
7).
Table 11. Combined concentrations of targeted drugs and metformin obtained by Compusyn software.
HT29 RKO NCI-H508
vemurafenib + metformin 0.062 µM + 2.5 mM 7.5 µM + 5 mM 1.25 µM + 2.5 mM
panitumumab + metformin - - 0.02 nM + 2.5 mM
dasatinib + metformin 3.05 nM + 5 mM 6.25 µM + 2.5 mM -
regorafenib + metformin 0.0976 µM + 1.25 mM 1.56 µM + 2.5 mM 1.56 µM + 1.25 mM
trametinib + metformin 0.5 nM + 10 mM 8 nM + 5 mM 1 nM + 5 mM

83
To evaluate the contribution of metformin in combinatorial therapies with these drugs I
conducted biochemical analyses of the cells treated at the concentrations listed in table 10
and 11, focusing on the specific proteins targeted by the drugs used.
4.3.1 Analysis of changes in proteins from pathways deregulated in CRC
4.3.1.1 Analysis of combinatorial treatments with metformin and vemurafenib
In the HT29 cell line the concentrations of vemurafenib and metformin used in the
combined treatment were lower than those used in the single treatments (the IC50 value
obtained for each drug). In fact, I used 50% and a 25% of the IC50 concentrations of
vemurafenib and of metformin respectively, obtaining 40% of cell death (Supplementary
table 8). For RKO cells, where the mortality observed in the combined treatment was
almost 90%, I maintained the IC50 concentration of vemurafenib and used 50% of the IC50
concentration of metformin (Supplementary table 9). In NCI-H508 I used 12.5% and 50%
of the IC50 concentrations of vemurafenib and metformin respectively, obtaining more than
70% of cell death (Supplementary table 10).
In the HT29 cell line metformin treatment decreased the phosphorylation of ERK1/2
(Thr202/Tyr204) and blocked that of S6 protein (Ser240/244), while treatment with
vemurafenib had a weak effect on the activity of ERK1/2 and S6 protein (Figure 27 A).
Combined treatment including metformin and vemurafenib showed a reduction of ERK1/2
and S6 protein activity but an increase of Akt phosphorylation (Ser473). It has been
reported that inhibition of the active BRAF-mutant (V600E) causes a feedback activation
of EGFR in CRC (Corcoran et al., 2012; Prahallad et al., 2012) and for this reason I also
evaluated the effects of vemurafenib on EGFR and found that vemurafenib administered
alone reduced EGFR activity, while the concomitant addition of metformin increased
EGFR phosphorylation.

84
Metformin alone markedly reduced the phosphorylation of ERK1/2, Akt and of S6 protein
in RKO cells, while vemurafenib administered alone reduced the expression and activity of
ERK1/2 and Akt (Figure 27 B). The combined treatment of vemurafenib with metformin
reduced the activity of ERK1/2, Akt and of S6 protein; however, single treatment with
metformin was more effective on all of them. RKO cells present low constitutive EGFR
phosphorylation and for this reason I could not verify possible changes in this protein
induced by the treatments.
Metformin administered alone only reduced the activation of S6 protein in the NCI-H508
cell line (Figure 27 C). Treatment with vemurafenib slightly reduced Akt and S6 protein
activity and combined treatment of vemurafenib with metformin markedly decreased the
phosphorylation of S6 protein, as a result of metformin treatment. As regards EGFR, both
treatments reduced its phosphorylation and metformin seemed more effective than
vemurafenib.
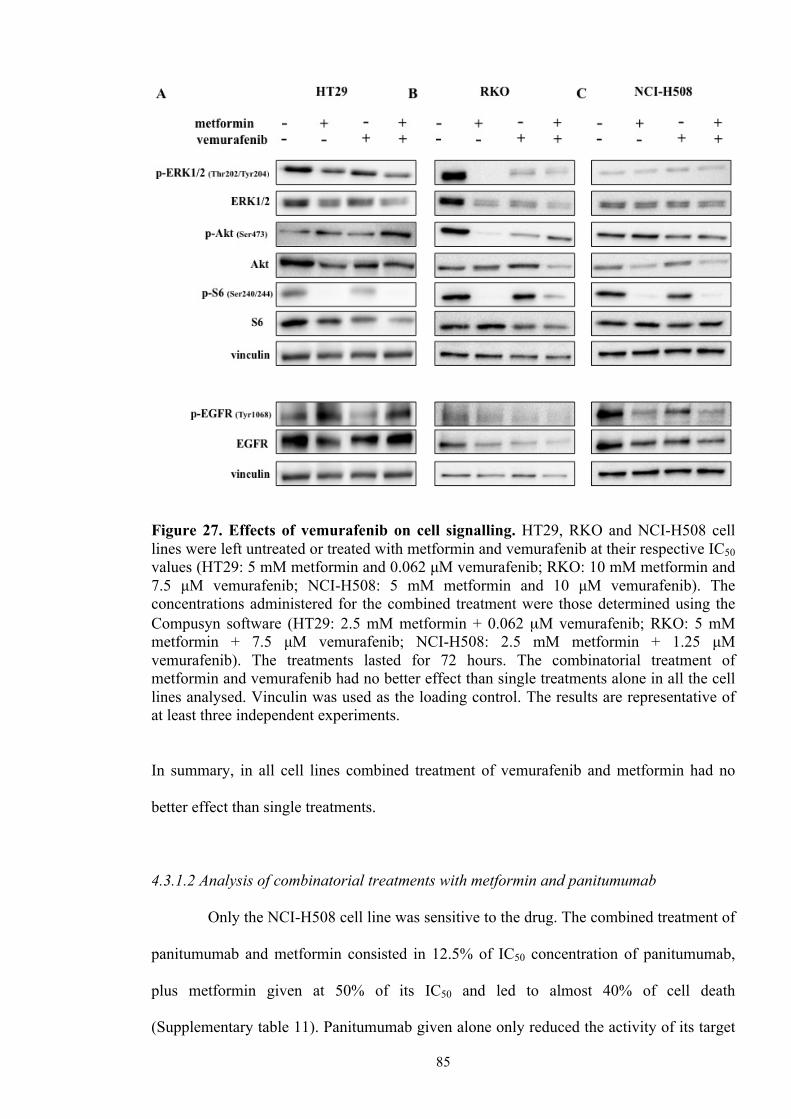
85
Figure 27. Effects of vemurafenib on cell signalling. HT29, RKO and NCI-H508 cell lines were left untreated or treated with metformin and vemurafenib at their respective IC50 values (HT29: 5 mM metformin and 0.062 µM vemurafenib; RKO: 10 mM metformin and 7.5 µM vemurafenib; NCI-H508: 5 mM metformin and 10 µM vemurafenib). The concentrations administered for the combined treatment were those determined using the Compusyn software (HT29: 2.5 mM metformin + 0.062 µM vemurafenib; RKO: 5 mM metformin + 7.5 µM vemurafenib; NCI-H508: 2.5 mM metformin + 1.25 µM vemurafenib). The treatments lasted for 72 hours. The combinatorial treatment of metformin and vemurafenib had no better effect than single treatments alone in all the cell lines analysed. Vinculin was used as the loading control. The results are representative of at least three independent experiments.
In summary, in all cell lines combined treatment of vemurafenib and metformin had no
better effect than single treatments.
4.3.1.2 Analysis of combinatorial treatments with metformin and panitumumab
Only the NCI-H508 cell line was sensitive to the drug. The combined treatment of
panitumumab and metformin consisted in 12.5% of IC50 concentration of panitumumab,
plus metformin given at 50% of its IC50 and led to almost 40% of cell death
(Supplementary table 11). Panitumumab given alone only reduced the activity of its target

86
EGFR (Figure 28). Interestingly, also metformin reduced EGFR activity. The sumiltaneous
administration of panitumumab and metformin blocked the activity of S6 protein (as result
of treatment with metformin) and, most of all, of EGFR for which the two drugs seemed to
have synergistic effect.
Figure 28. Effects of panitumumab on cell signalling. NCI-H508 cell lines were left untreated or treated with metformin and panitumumab at their respective IC50 values (5 mM metformin and 0.17 nM panitumumab). The concentrations administered for the combined treatment were those determined using the Compusyn software (2.5 mM metformin + 0.02 nM panitumumab). The treatments lasted for 72 hours. The combinatorial treatment of metformin and panitumumab reduced EGFR activation. Vinculin was used as the loading control. The results are representative of at least three independent experiments.
4.3.1.3 Analysis of combinatorial treatments with metformin and dasatinib
In combined treatments including dasatinib and metformin HT29 and RKO cells
were treated with 25% and 50% of the concentrations of dasatinib and with 50% and 25%

87
of that of metformin used for the single treatments respectively, and treatment resulted in
50% and 60% of cell death (Supplementary tables 12 and 13).
Metformin reduced the growth of HT29 cells and decreases the expression of all the
proteins analysed (Figure 29 A). The biguanide strongly diminished the phosphorylation of
ERK1/2 and Src and blocked that of S6 protein. Dasatinib administered alone only resulted
in a slight reduction of Akt activation, but not of Src, one of its known targets. Combined
treatment of dasatinib and metformin maintained the reduction of ERK1/2 and of S6
protein activity induced by metformin, but did not reduce Src phosphorylation, suggesting
that dasatinib antagonises the effect of metformin on Src. Similarly, metformin seemed to
antagonise the reduction of Akt phosphorylation induced by dasatinib.
In RKO cells metformin alone markedly reduced the phopshorylation of all the proteins
analysed (Figure 29 B). Treatment with dasatinib decreased the activation of ERK1/2 and,
even if with weaker intensity, of Akt and S6 protein. Block of Src phosphorylation was
stronger than that obtained with metformin. This block was maintained when cells were
treated with both the drugs; however, reduction of ERK1/2, Akt and S6 protein activity,
seen with metformin alone, were not observed.

88
Figure 29. Effects of dasatinib on cell signalling. HT29 and RKO cell lines were left untreated or treated with metformin and dasatinib at their respective IC50 values (HT29: 5 mM metformin and 12.2 nM dasatinib; RKO: 10 mM metformin and 12.5 µM dasatinib). The concentrations administered for the combined treatment were those determined using the Compusyn software (HT29: 5 mM metformin + 3.05 nM dasatinib; RKO: 2.5 mM metformin + 6.25 µM dasatinib). The treatments lasted for 72 hours. The combinatorial treatment of metformin and dasatinib reduced ERK activation in HT29. Vinculin was used as the loading control. The results are representative of at least three independent experiments.
In HT29 cells the combination of dasatinib and metformin seemed to have better effect of
the single treatments in reducing ERK1/2 phosphorylation, while in RKO cells the
combined treatment did not reduce protein activity better than either drugs administered
alone.
89
4.3.1.4 Analysis of combinatorial treatments with metformin and regorafenib
Regorafenib and metformin administered together were given to HT29 cells at
6.25% and 12.5% of the concentration s used in the individual treatments and resulted in
40% cell death (Supplementary table 14). Similarly, RKO cells received 50% and 25% of
the concentrations of regorafenib and metformin administered in the single treatments,
with almost 70% of cell mortality (Supplementary table 15). As for NCI-H508 cells, they
were treated with 12.5% and 25% of the concentrations of regorafenib and metformin
given alone and the treatment gave more than 40% of cell death (Supplementary table 16).
I have not been able to evaluate the effects of the combined treatment on the specific
proteins targeted by regorafenib. I tested the expression of PDGFR-β and KIT, two target
proteins of regorafenib, but the three cell lines I used do not express them. Thus, I assessed
the effects of this combinatorial treatment by considering only changes in the activity of
ERK1/2, Akt and S6 protein. Regorafenib did not affect the phosphorylation of ERK1/2,
Akt and S6 protein in the HT29 cell line (Figure 30 A) and when combined with
metformin it only reduced the activity of S6 protein, which was caused by the addiction of
the biguanide (indeed, treatment with metformin alone inhibited S6 phosphorylation).
Regorafenib did not change the activity of ERK1/2, Akt and S6 protein in RKO cells and
when used in combination with metformin antagonised the effects of the biguanide,
maintaining the phosphorylation of Akt and S6 protein (Figure 30 B). In NCI-H508 cells
regorafenib reduced the phosphorylation of ERK1/2, Akt and also of S6 protein although
the decrease of S6 protein activity was less than that observed with metformin (Figure 30
C). Combined treatment with the two drugs significantly increased ERK1/2 activation,
while phosphorylation of Akt and of S6 protein was similar to that of treatment with
regorafenib.

90
Figure 30. Effects of regorafenib on cell signalling. HT29, RKO and NCI-H508 cell lines were left untreated or treated with metformin and regorafenib at their respective IC50 values (HT29: 5 mM metformin and 1.5 µM regorafenib; RKO: 10 mM metformin and 3.12 µM regorafenib; NCI-H508: 5 mM metformin and 12.5 µM regorafenib). The concentrations administered for the combined treatment were those determined using the Compusyn software (HT29: 1.25 mM metformin + 0.0976 µM regorafenib; RKO: 2.5 mM metformin + 1.56 µM regorafenib; NCI-H508: 1.25 mM metformin + 1.56 µM regorafenib). The treatments lasted for 72 hours. The combinatorial treatment of metformin and regorafenib was less effective than single treatments alone in all the cell lines. However treatemtn with regorafenib administered alone reduced the activation of ERK, Akt and S6 in NCI-H508 cells. Vinculin was used as the loading control. The results are representative of at least three independent experiments.
In conclusion, in all cell lines analysed the combined treatment of regorafenib and
metformin did not give a better effect than either drug alone.
4.3.1.5 Analysis of combinatorial treatments with metformin and trametinib
Trametinib in combination with metformin was administered to RKO cells using
50% of the concentrations of both the drugs given in single treatments and led to more than
70% cell death (Supplementary table 17). The concentrations used for the other two cell
lines were still higher than the values administered in the individual treatments. HT29 cells
received the same concentration of trametinib and two times that of metformin used for

91
individual treatments, while the NCI-H508 cells were treated with double the
concentration of trametinib and with the same concentration of metformin given as a single
treatment. Cell death was almost 80% for the HT29 cells and more than 50% for the cell
line NCI-H508 (Supplementary tables 18 and 19).
Trametinib reduced the activity of its target ERK1/2 and Akt in HT29 cells. Similar results
were obtained when metformin was added, and the biguanide reduced the activity of S6
protein (Figure 31 A). I also evaluated changes in the expression of c-Myc, a downstream
target of ERK1/2: single treatment with trametinib reduced c-Myc expression, but its
reduction was stronger in presence of metformin. Combined treatment gave similar results
as the treatment with metformin.
In the RKO cell line trametinib given alone reduced the activity of ERK1/2 and c-Myc
expression but increased S6 phosphorylation (Figure 31 B). Combined treatment with
trametinib and metformin abolished ERK1/2 activity and decreased c-Myc expression,
however I observed a marked increase of Akt activity and no reduction of S6 protein
activity.
Trametinib slightly reduced the activity of ERK1/2 but increased S6 protein
phosphorylation in NCI-H508 cells (Figure 31 C). The simultaneous administration of
trametinib and metformin abolishes ERK1/2 activity, suggesting that it has a synergistic
effect on the reduction of ERK1/2 phosphorylation. Block of the activity of S6 protein,
caused by metformin, was also observed. Interestingly, no changes in c-Myc expression,
even for treatment with metformin, were observed.

92
Figure 31. Effects of trametinib on cell signalling. HT29, RKO and NCI-H508 cell lines were left untreated or treated with metformin and trametinib at their respective IC50 values (HT29: 5 mM metformin and 0.5 nM trametinib; RKO: 10 mM metformin and 32 nM trametinib; NCI-H508: 5 mM metformin and 0.5 nM trametinib). The concentrations administered for the combined treatment were those determined using the Compusyn software (HT29: 10 mM metformin + 0.5 nM trametinib; RKO: 5 mM metformin 8 nM trametinib; NCI-H508: 5 mM metformin and 1 nM trametinib). The treatments lasted for 72 hours. The combinatorial treatment of metformin and trametinib reduced ERK activation in NCI-H508 cells. Vinculin was used as the loading control. The results are representative of at least three independent experiments.
In conclusion, combined treatment of trametinib and metformin was more effective than
single treatments only in NCI-H508 cells, where it provoked the suppression of ERK1/2
activation.
4.3.2 Cell cycle analysis on combinatorial treatments
I observed that the administration of metformin in combination with vemurafenib,
dasatinib and trametinib to RKO cells, as well as that of metformin given together with
vemurafenib in NCI-H508 cells strongly decreased cell viability. In fact, after 72 hours of
treatment, metformin given in combination with vemurafenib, dasatinib and trametinib

93
reduced viability of more than 80%, about 60% and more than 70% respectively in RKO
cells. In the NCI-H508 cell line the combinatorial treatment vemurafenib-metformin
caused more than 70% of cell death.
To investigate the cellular mechanisms that reduce viability, I decided to evaluate the
changes in cell cycle progression induced by treatments including these drugs. In RKO
cells, metformin treatment for 72 hours induced an accumulation of cells in the S phase (on
average of 11.5%, specifically from 26.8% to 39.55% in the experiment with vemurafenib;
from 29.23% to 43.40% in the experiment with dasatinib and from 20.85% to 28.74% in
the experiment with trametinib; Figure 32 A-B-C) and in the G2/M phase (from 9.14% to
19.11% in the experiment with vemurafenib; on average of 10.24%, from 10.36% to
22.28% in the experiment with dasatinib and from 16.85% to 25.32% in the experiment
with trametinib; Figure 32 A-B-C) respect to the untreated cells.
Addition of vemurafenib, both alone and in combination with metformin, did not induced
substantial variations in the cell cycle profiles (Figure 32 A).
The DNA profiles of RKO cells treated with dasatinib alone or combined with metformin
showed an increase in S phase (from 29.23% to 36.14% when dasatinib was administered
alone and from 29.23% to 39.56% in the combined treatment; Figure 32 B).
Treatments with trametinib caused a marked accumulation of cells in G0/G1 phase (from
62.3% to 84.25% when trametibin was administered as single drug and from 62.3% to
73.78% in combined treatment trametinib-metformin; Figure 32 C). Moreover when
trametinib was administered as single treatment I observed a reduction in the percentage of
the G2/M phase fraction (from 16.85% to 6.43%).
In the NCI-H508 cell line treatment with metformin only resulted in a slight accumulation
of cells in the S phase (from 24.63% to 30.79%), that I also observed after treatment with
vemurafenib (from 24.63% to 33.24%) and which was confirmed in cells that had the
combined treatment (from 24.63% to 34.73%; Figure 32 D).

94
Figure 32. Cell cycle analysis in RKO and NCI-H508 cell lines treated with targeted drugs. The two cell lines were left untreated or treated with metformin and targeted drugs at their respective IC50 values (RKO: 10 mM metformin, 7.5 µM vemurafenib, 12.5 µM dasatinib and 32 nM trametinib; NCI-H508: 5 mM metformin and 10 µM vemurafenib). The concentrations administered for the combined treatment were those determined using the Compusyn software (RKO: 5 mM metformin + 7.5 µM vemurafenib; 2.5 mM metformin + 6.25 µM dasatinib; 5 mM metformin + 8 nM trametinib. NCI-H508: 2.5 mM metformin + 1.25 µM vemurafenib). The treatments lasted for 72 hours. In RKO cells metformin induced an accumulation in S and G2/M phases. Vemurafenib, alone or combined with metformin, did not induce changes in cell cycle profile. Treatment with Dasatinib caused an S phase increase, while Trametinib strongly increased G0/G1 phase. In NCI-H508 cells all treatments resulted in a slight accumulation of cells in S phase. Vinculin was used as the loading control. The results are representative of at least three independent experiments.
In conclusion metformin seems to determine a block in S phase of RKO cell lines. The
stronger effect of targeted drugs on cell cycle was observed, always in RKO, after
trametinib treatments where the drug, alone or in combination with metformin, leads to a
cells accumulation in G0/G1 phase.

95
4.3.3 Summary of key findings
The combination of metformin with targeted drugs does not represent an advantage for
treatment of BRAF-mutant CRC cell lines.
In addition, I observed that:
• metformin seems to be more effective in cells with high proliferation rate (RKO
and HCT116) than those with slow growth (NCI-H508)
• tumours with BRAF G596R mutation could benefit from treatment with
regorafenib

96
CHAPTER 5
DISCUSSION
We investigated the role of metformin alone or in combination with other drugs as
potential anticancer therapy in CRC by analysing its effects on four cell lines (HT29,
HCT116, HCT116P53-/- and DLD-1) and on 3D-organoids we derived from a peritoneal
carcinomatosis. Although previous studies have shown that metformin inhibits the
proliferation of CRC cells (Zakikhani et al., 2008), the drug’s underlying mechanisms of
action on CRC are still unclear. We found that metformin had a cytostatic effect, also on
the stem component of the cells, but did not induce cell death. In addition, its effects were
reversed after drug removal. In line with the observations in other types of cancer (Pierotti
et al., 2013), the cytostatic effect of metformin appears to be determined by a reduction of
cell proliferation, an increased accumulation of cells in G0/G1 phase, a decrease in the
expression of proteins that regulate cell cycle progression such as cyclin D1 and c-Myc,
and inhibited phosphorylation of the downstream target of cyclin D1, pRb.
The results we obtained for the DLD-1 cell line were controversial. In these cells
metformin caused reduction of cyclin D1, c-Myc, cyclin E expression and of
phosphorylation of pRb; however there was only a very weak decrease of the cell
proliferation after 24 hours of treatment and, most of all, changes in the cell cycle were not
observed. The fact that both the alleles of LKB1 gene, the main activator of AMPK, are
methylated in DLD-1 cells (Esteller et al., 2000) could, at least in part, explain these
results. In fact, it has been demonstrated that LKB1 activity is required for cell cycle arrest
in DLD-1 cells (Scott et al., 2007). Most of all, several studies have suggested that
metformin can also act via activation of LKB1/AMPK-TSC1/TSC2 pathway and loss of
LKB1 functions avoid the suppression of the mTOR-signaling pathway (Carretero et al.,
2007). Finally, a recent study, in which the addiction of metformin to DLD-1 cells grown

97
under glucose-deprived conditions caused inhibition of cell growth (Miyo et al., 2016),
suggests that in this cell line metformin requires low glucose conditions to suppress tumour
growth.
We investigated whether the blockade of the cell cycle observed in the remaining cell lines
and in the organoids could result in a permanent exit from the cell cycle or lead to cell
death. Although in other types of cancer metformin promotes senescence, apoptosis or
autophagy (Williams et al., 2013, Yi et al., 2013, Malki et al., 2011, Gao et al., 2016,
Queiroz et al., 2014, Feng et al., 2014, Tomic et al., 2011), all the cell lines and the
organoids analysed showed no permanent cytostatic effects or induction of cell death.
Autophagy is a cellular process induced by deprivation of nutrients and growth factors,
while we cultured the cells in complete media containing growth factors and nutrients that
may have influenced the effects of metformin on our models. We used a standard culture
medium containing 17 mM glucose; although several reports show that the biguanide
induces apoptosis in this medium, there are data in breast cancer suggesting that metformin
increases apoptotic cell death only in glucose deprivation conditions, while the presence of
glucose causes cell cycle arrest (Wahdan-Alaswad et al., 2013, Menendez et al., 2012). As
for CRC, Buzzai et al. reported that under nutrients deprivation, metformin can promote
autophagy in CRC cell lines with wild type TP53, while it can induce apoptosis in TP53-
deficient cells (Buzzai et al., 2007). The cell lines and the organoids we used were either
TP53 wild-type (HCT116 cells) or mutant (HT29 and DLD-1 cells and also organoids) and
HCT116P53-/- cells had deletion of both the alleles of the gene, but we did not observe
changes in the regulation of cell death related to the TP53 status of the cell lines. Most
likely, the presence of nutrients could have exceeded the effects of metformin on these
cells.
It has also been suggested that metformin may induce apoptosis when cells are seeded
almost at confluence (Silvestri et al., 2015). We worked under low-density conditions
(5×10⁴ cells/cm2) because it is required for carrying out drug sensitivity assays. In addition,

98
the drug induced a high degree of acidosis (a decrease in pH from 8 to 6.5) at a higher
density (1.5×10⁵ cells/cm2), which may interfere with its effects. However, we did not
observe apoptosis even under acidosis conditions (data not shown).
As for the effects of metformin on cell senescence, they have not yet been clarified and
conflicting literature data have reported. In fact it has been demonstrated that metformin
can induce TP53-dependent senescence in hepatoma cells (Yi et al., 2013) and in a triple
negative breast cancer model (Williams et al., 2013), while Moiseeva et al., reported that
metformin reduced the expression of pro-inflammatory cytokines implicated in the
senescence process (Moiseeva et al., 2013).
A clonogenic assay showed that in HT29, HCT116 and HCT116P53-/- cells the cytostatic
effect of metformin was transient and that cells treated with metformin even for 18 days,
were still able to form new colonies in fresh complete medium after drug removal.
HCT116P53-/- cells made more effort to revert this transient effect, thus suggesting that
metformin is more effective in the absence of TTP53. As for DLD-1 cells, their clonogenic
capacity was similar at all the time points analysed, which is in agreement with the absence
of cell cycle arrest observed. However, it seems to contradict the immunoblotting data for
cyclins D1 and E and for c-Myc, as well as pRB phosphorylation, which are all decreased
by the treatment. These results suggest that metformin is only partially effective on these
cells and acts only on some routes, which are offset from others and finally result in cell
growth. The fact that DLD-1 cells have both the alleles of LKB1 gene inactivated (which
is one of the targets of metformin) could contribute to give the observed results. Overall,
the results we obtained on DLD-1 cells do not fully support an effect of the biguanide on
them, at least at the concentrations used, and for this reason we decided to examine in
more detail the effect of metformin only on the other cell lines and on the organoids.
The anti-proliferative action of metformin observed in HT29 and HCT116 and
HCT116P53-/- cells and organoids seems to be mainly mediated by the inactivation of the
mTOR pathway and IGF1R protein (Pierotti et al., 2013), both playing a critical role in cell

99
growth, and that are often deregulated in patients with various cancers (including CRC).
Metformin reduced the phosphorylation of mTOR, of its downstream effectors (ribosome
protein S6 and 4E-BP1) and of IGF1R. Interestingly, the inhibition of mTOR was also
observed in the HCT116 and HCT116P53-/- cells in which AMPK was not activated, thus
suggesting that metformin arrests cell growth in CRC cells through mechanisms different
than activation of AMPK. There are in fact other pathways, such as RAG GTPase or
REDD1 that are known to inhibit mTOR signalling after treatment with metformin
(Kalender et al., 2010, Ben Sahra et al., 2011). Metformin may also reversibly inhibit
complex I of the mitochondrial respiratory chain and stimulate the production of ROS,
which induce cell cycle arrest (Marchi et al., 2012), thus providing an alternative
mechanism to AMPK activation (Bridges et al., 2014, Biswas et al., 2006, Mackenzie et
al., 2013).
The reversible effect of metformin on cell proliferation observed in the clonogenic assays
was confirmed by the finding that mTOR pathway and IGF1R were completely restored
after metformin removal and growth in fresh complete medium, without the drug.
The results obtained show that metformin can transiently inhibit the growth and
proliferation of CRC, thus suggesting that it is not suitable for the treatment of cancer.
Therefore we decided to design strategies that combine metformin with other drugs that
can benefit from the inhibition of cell growth functions induced by the biguanide and
promote cell death.
The majority of the chemotherapeutic drugs currently used for the treatment of CRC
function damaging cells during the S phase of the cell cycle: the antimetabolite 5-FU
interferes with DNA synthesis, the alkylating agent oxaliplatin directly damages DNA and
the topoisomerase inhibitor irinotecan blocks DNA replication. We designed settings in
which metformin and the chemotherapeutic drugs (given alone or in regimen combination)
were administered in different combinations and for different times. We also tested longer

100
exposures to chemotherapy that can mimic the typical environment of patients undergoing
prolonged treatment planning.
The addition of metformin to chemotherapy is controversial and in some cases appears to
potentiate (Dong et al., 2012, Kim et al., 2014, Illiopulos et al., 2011), in others to
antagonise (Janjetovic et al., 2011), the effects of chemotherapeutic drugs.
Irinotecan significantly decreased the viability in all the cell lines and its administration
before metformin, especially for longer times, was the most effective treatment. The fact
that topoisomerase I, the direct target of the drug, is highly expressed in CRC (Boonsong et
al., 2002) may explain the sensitivity of these cells to the drug. Because of its cytostatic
effect on CRC, metformin added after irinotecan may prevent the repair of the DNA breaks
induced by the drug, driving damaged cells to death. In addition, in CRC the treatment
with irinotecan appears to be associated with reduction of the stem cells markers CD44,
CD166 and Lgr5 (Dylla et al., 2008, Emmink et al., 2011), which are also targeted by
metformin. Since the stem component of tumours is considered the chemo-resistant
fraction of cancer, its eradication could explain the high response of these cells to the drug.
On the contrary, metformin given before irinotecan seems to antagonise the
chemotherapeutic drug. Most likely, the cytostatic effect of metformin lasts after its
removal and prevents irinotecan to function. The same conclusions can be achieved when
metformin is added before longer exposure to most of treatments including 5-FU or
oxaliplatin.
Other differences observed reflect the individual sensitivity of the cells to the
chemotherapeutic drugs. Metformin co-administered with 5-FU or oxaliplatin has a
synergistic effect in HCT116 and HCT116P53-/- cell lines, while the oxaliplatin-5-FU
regimen gives opposite results. In fact, HCT116 cells are more sensitive to metformin than
to oxaliplatin-5-FU regimen, suggesting that the biguanide drives reduction of cell viability
in the combinatorial treatment. This result is supported by the finding that oxaliplatin-5-FU
regimen given before metformin cannot induce growth arrest. On the contrary,

101
HCT116P53-/- cells are more sensitive to oxaliplatin-5-FU regimen than to metformin and
a longer administration of the regimen before the biguanide better reduces cell
proliferation. Maybe these differences could be related to apoptosis induction.
The different response obtained with chemotherapy can be also attributed to the different
status of TP53. It was reported that gain of function mutation on TP53, such as R273H
present in HT29, or loss of TP53 gene (in HCT116P53-/- cells) can confer resistance to
different chemotherapeutic drugs including anti-metabolites, DNA cross-linking agents
and topoisomerase inhibitors (Lowe et al., 1993, O’Connor et al., 1997, Boyer et al., 2004,
Brosh et al., 2009, Fan et al., 1994, Blandino et al., 1999, Chang et al., 2001, Cabelguenne
et al., 2000), although other authors showed that mutant TP53 displays sensitivity to
chemotherapy (Fan et al., 1995, Bradford et al., 2003, Jackson et al., 2013). Our data
highlight that the TP53 status could be linked to different responses to chemotherapy. As
shown in table 7, TP53-mutant HT29 cells are less sensitive to 5-FU and irinotecan. In
accordance with Boyer et al. in our experiment HCT116P53-/- cells were the most
resistant to oxaliplatin (Boyer et al., 2004). HCT116 cells (TP53 WT) were the most
sensitive for all the drugs tested and it has been reported that sensitivity to 5-FU and
oxaliplatin was a characteristic of TP53 WT CRC cells (Boyer et al., 2004, Toscano et al.,
2007, Bunz et al., 1999). This can be explained considering that most of the
chemotherapeutic drugs are anti-apoptotic agents and mutations in the apoptosis pathway,
in which TP53 protein is one of the main players, can protect cancer cells from death.
Our data highlight that HCT116 and HCT116P53-/- are very sensitive to metformin; both
cells have a fast growth and the biguanide may better exert its cytostatic function. In
combined treatments metformin added after chemotherapy increases cell death, most likely
because its cytostatic effect avoids the repair of DNA damage. The most effective
treatment consists of metformin combined with irinotecan. Indeed trials that will establish
the clinical relevance of metformin plus irinotecan combination in CRC patients
(NCT01930864, on refractory CRC) have been already activated.

102
Finally we tested metformin in combination with targeted drugs on BRAF-mutant cell
lines. Although at first these drugs show a great response rate, resistance develops in a
short period of time. Among novel potential therapeutic options, the association of targeted
drugs with regulators of the metabolism could be a promising strategy to overcome the
inevitable resistance.
The analysis of changes in proteins from pathways deregulated in CRC, and potentially
target of the drugs tested, showed that the combination of metformin with vemurafenib
(which inhibits V600E-mutant BRAF) increased the phosphorylation of Akt and of EGFR
in HT29 and RKO cells, suggesting antagonism between the two drugs. The drug made no
protein alterations in NCI-H508 cells (G596R-mutant BRAF) and the reduced activity of
EGFR and of S6 protein observed in the combined treatment was driven by metformin.
Furthermore, dual treatment induced no modifications of the cell cycle phases in any of the
tested cell lines (RKO and NCI-H508). It has been shown that the combination with
metformin and vemurafenib inhibits mTOR signalling, induces cell cycle arrest in G1
phase and apoptosis in BRAF V600E-mutant melanoma cell lines, and in vivo results in
tumour regression (Niehr et al., 2011, Yuan et al., 2013). Similar findings were also
obtained in BRAF V600E-mutant thyroid cancer cell lines (Hanly et al., 2015). One
possible explanation of our results may be that HT29 and RKO cell lines are mutated in the
PIK3CA gene (Ikenoue et al., 2005) and resistance to vemurafenib in BRAF V600E-
mutant CRC cells has been associated with the presence of PIK3CA mutations that hyper-
activate the PI3K/Akt pathway (Mao et al., 2013). Although metformin strongly inhibited
Akt activation in RKO cells, its administration with vemurafenib hampers this effect.
Metformin combined with the EGFR inhibitor panitumumab in NCI-H508 cell line
abolished the phosphorylation of EGFR, but maintained active the downstream proteins
Akt and ERK1/2.
Combinatorial treatment with the Src inhibitor dasatinib and metformin reduced the
activation of ERK1/2 but increased Src phosphorylation in HT29 cells. As for the RKO

103
cell line, the drug administered with metformin slightly increased the S phase of the cell
cycle, but the two drugs given together only showed reduction of EGFR activity. Lin et al.
reported that metformin synergizes with dasatinib in head and neck squamous cell
carcinoma cells, through AMPK-mediated energy stress (Lin et al., 2014). Further analyses
of this pathway on our cells could help in understanding the effects of the dual treatment in
CRC.
As for the combinatorial treatment with metformin and the multi-kinase inhibitor
regorafenib, it had no advantages compared to the individual drugs in all the cell lines. In a
recent paper on non-small cell lung cancer, in which metformin was combined with
sorafenib (another multi-kinase inhibitor), the authors report a synergistic growth
inhibition induced by AMPK activation and inhibition of mTOR pathway (Groenendijk et
al., 2015). This is in agreement with our observation that the combined treatment reduced
activation of the S6 protein in HT29 and NCI-H508 cells. Regorafenib administered alone
also reduced ERK1/2 and Akt activation in NCI-H508 cells; however, the combinatorial
treatment with metformin antagonizes this effect.
The combination of metformin with trametinib, a MAPK inhibitor, had a synergistic
effects only in NCI-H508 cells, where it suppressed the activation of ERK1/2 and of S6
protein. Similar results were reported in NRAS-mutant cell lines from melanoma, lung
cancer and neuroblastoma, where also phosphorylation of Akt was reduced (Vujic et al.,
2015). The reduction of cell viability we observed in RKO cells was similar to that
described by these authors and is in line with the increase of G0/G1 phase we observed.
These results suggest that in BRAF-mutant CRC cells the combined therapy does not
provide advantages over the one with the individual drugs. We found that RKO cells are
very sensitive to metformin, most likely because of their fast growth that, as for HCT116
and HCT116P53-/- cells, may be targeted the biguanide. On the contrary, the fact that
NCI-H508 cells grow very slowly could explain their weak response to metformin. As for
NCI-H508 cells, the rare BRAF mutation they carry results in CRCs with different

104
characteristics compared to V600E-mutant tumours and for which there are no specific
treatment recommendations (Cremolini et al., 2015). We have confirmed that treatment
with anti-EGFR drugs reduced EGFR activity (Misale et al., 2014); however panitumumab
did not diminished Akt and ERK1/2 phosphorylation. Instead our data have shown
sensitivity of NCI-H508 cells to regorafenib, which decreases the phosphorylation of
ERK1/2, Akt and of S6 protein.
Overall, our results show that metformin is cytostatic on CRC cells. They have different
responses to treatment with the biguanide, administered either in single or in combined
treatments, which are mainly related to their molecular and physiological characteristics.
The experiments with the standard chemotherapy drugs highlight that the efficacy of
combined treatments strongly hangs on the sequence in which the drugs are given and that,
in some settings the biguanide can even antagonise the effects of chemotherapy.
Antagonism has been observed also when metformin has been simultaneously
administered with target drugs. Although further investigations are still needed to elucidate
the results of the treatments including metformin, these data suggest that caution should be
used in administering chemotherapy to indviduals taking metformin.
Summary of novel findings
The novel findings emerged from this work can be summarised in three main points:
• the effect of metformin on the block of cell proliferation is only temporary and
does not make the drug suitable for the treatment of CRC
• the effectiveness of the combinatorial treatments with metformin and
chemotherapeutic drugs depends on the characteristics of the cells and on the
sequence in which the drugs are administered. This result suggests that caution
should be used in administering chemotherapy in patients taking metformin
• the combination of metformin with targeted drugs do not represent an advantage
105
for the treatment of BRAF-mutant CRC and the assessment of the mutational status
and of the proliferation rate of a tumor could help design effective therapeutic
strategies
Summary of future directions
• study of the molecular mechanisms through which metformin induces cell growth
arrest
• analysis of variations in the molecular pathways altered by metformin and standard
chemotherapy and regimens (i.e. activation/inhibition of apoptosis or DDR?)
• In vivo experiments to examine response to the best combinatorial treatments
identified in vitro.

106
REFERENCES
Algire C, Amrein L, Zakikhani M, Panasci L, Pollak M. Metformin blocks the
stimulative effect of a high-energy diet on colon carcinoma growth in vivo and is
associated with reduced expression of fatty acid synthase. Endocr Relat Cancer
2010;17:351–60.
Algire C, Moiseeva O, Deschênes-Simard X, Amrein L, Petruccelli L, Birman E,
Viollet B, Ferbeyre G, Pollak MN. Metformin reduces endogenous reactive oxygen species
and associated DNA damage, Cancer Prev. Res. 5(April (4)) (2012) 536–543.
Alimova IN, Liu B, Fan Z, Edgerton SM, Dillon T, Lind SE, Thor AD. Metformin
inhibits breast cancer cell growth, colony formation and induces cell cycle arrest in vitro.
Cell Cycle 2009; 8: 909–915.
Arakawa H "Netrin-1 and its receptors in tumorigenesis". Nat Rev Cancer. 2004
Dec;4(12):978-87.
Bao B, Wang Z, Ali S, Ahmad A, Azmi AS, Sarkar SH, Banerjee S, Kong D, Li
Y, Thakur S, Sarkar FH. Metformin inhibits cell proliferation, migration and invasion by
attenuating CSC function mediated by deregulating miRNAs in pancreatic cancer cells,
Cancer Prev. Res. (Phila.) 5 2012, 355–364.
Barker N, van Es JH, Kuipers J, Kujala P, van den Born M, Cozijnsen M,
Haegebarth A, Korving J, Begthel H, Peters PJ, Clevers H. Identification of stem cells in
small intestine and colon by marker gene Lgr5. Nature. 2007 Oct 25;449(7165):1003-7.

107
Barker N. The canonical Wnt/beta-catenin signalling pathway. Methods Mol Biol.
2008;468:5-15.
Barker N, Ridgway RA, van Es JH, van de Wetering M, Begthel H, van den Born
M, Danenberg E, Clarke AR, Sansom OJ, Clevers H. Crypt stem cells as the cells-of-origin
of intestinal cancer. Nature. 2009 Jan 29;457(7229):608-11.
Barone C, Landriscina M, Quirino M, Basso M, Pozzo C, Schinzari G, Di
Leonardo G, D'Argento E, Trigila N, Cassano A. Schedule-dependent activity of 5-
fluorouracil and irinotecan combination in the treatment of human colorectal cancer: in
vitro evidence and a phase I dose-escalating clinical trial. Br J Cancer. 2007 Jan
15;96(1):21-8.
Ben Sahra I, Laurent K, Loubat A, Giorgetti-Peraldi S, Colosetti P, Auberger P,
Tanti JF, Le Marchand-Brustel Y, Bost F. The antidiabetic drug metformin exerts an
antitumoral effect in vitro and in vivo through a decrease of cyclin D1 level, Oncogene
2008;27(25):3576-86.
Ben Sahra I, Regazzetti C, Robert G, Laurent K, Le Marchand-Brustel Y,
Auberger P Tanti JF, Giorgetti-Peraldi S, Bost F. Metformin, independent of AMPK,
induces mTOR inhibition and cell cycle arrest through REDD1. Cancer Res 2011; 71:
4366–4372.
Bennouna, J, Sastre J, Arnold D, Österlund P, Greil R , Van Cutsem E, von Moos
R, Viéitez JM, Bouché O, Borg C, Steffens CC, Alonso-Orduña V, Schlichting C, Reyes-
Rivera I, Bendahmane B, André T, Kubicka S; ML18147 Study Investigators.
Continuation of bevacizumab after first progression in metastatic colorectal cancer

108
(ML18147): a randomised phase III trial. Lancet Oncol 2013 14: 29–37.
Biswas S, Chida AS, Rahman I. Redox modifications of protein-thiols: emerging
roles in cell signaling. Biochem Pharmacol 2006;71(5):551-64.
Blandino G, Levine AJ, Oren M. Mutant TP53 gain of function: differential
effects of different TP53 mutants on resistance of cultured cells to chemotherapy.
Oncogene (1999) 18:477–485.
Bokemeyer C, Köhne CH, Ciardiello F, Lenz HJ, Heinemann V, Klinkhardt U,
Beier F, Duecker K, van Krieken JH, Tejpar S. FOLFOX4 plus cetuximab treatment and
RAS mutations in colorectal cancer. Eur J Cancer. 2015 Jul;51(10):1243-52.
Bokemeyer C, Van Cutsem E, Rougier P, Ciardiello F, Heeger S, Schlichting M,
Celik I, Köhne CH. Addition of cetuximab to chemotherapy as first-line treatment for
KRAS wild-type metastatic colorectal cancer: pooled analysis of the CRYSTAL and
OPUS randomised clinical trials. Eur J Cancer. 2012;48(10):1466–1475.
Boonsong A, Curran S, McKay JA, Cassidy J, Murray GI, McLeod HL.
Topoisomerase I protein expression in primary colorectal cancer and lymph node
metastases. Hum Pathol 2002; 33: 1114–1119.
Boyer J, McLean EG, Aroori S, Wilson P, McCulla A, Carey PD, Longley DB,
Johnston PG. Characterization of TP53 wild-type and null isogenic colorectal cancer cell
lines resistant to 5-fluorouracil, oxaliplatin, and irinotecan. Clin Cancer Res. 2004 Mar
15;10(6):2158-67.

109
Bradford CR, Zhu S, Ogawa H, Ogawa T, Ubell M, Narayan A, Johnson G, Wolf
GT, Fisher SG, Carey TE. TP53 mutation correlates with cisplatin sensitivity in head and
neck squamous cell carcinoma lines. Head Neck (2003) 25:654–661.
Brosh R, Rotter V. When mutants gain new powers: news from the mutant TP53
field. Nat Rev Cancer (2009) 9:701–713.
Bunz F, Hwang PM, Torrance C, Waldman T, Zhang Y, Dillehay L, Williams J,
Lengauer C, Kinzler KW, Vogelstein B. Disruption of TP53 in human cancer cells alters
the responses to therapeutic agents. J Clin Invest 1999; 104: 263-269.
Bridges HR, Jones AJ, Pollak MN, Hirst J. Effects of metformin and other
biguanides on oxidative phosphorylation in mitochondria. Biochem J 2014;462(3):475-87.
Buzzai M, Jones RG, Amaravadi RK, Lum JJ, DeBerardinis RJ, Zhao F, Viollet
B, Thompson CB. Systemic treatment with the antidiabetic drug metformin selectively
impairs TP53-deficient tumor cell growth. Cancer Res 2007; 67: 6745–6752.
Cabelguenne A, Blons H, de Waziers I, Carnot F, Houllier AM, Soussi T, Brasnu
D, Beaune P, Laccourreye O, Laurent-Puig P. TP53 alterations predict tumor response to
neoadjuvant chemotherapy in head and neck squamous cell carcinoma: a prospective
series. J Clin Oncol (2000) 18:1465–1473.
Carretero J, Medina PP, Blanco R, Smit L, Tang M, Roncador G, Maestre L,
Conde E, Lopez-Rios F, Clevers HC, Sanchez-Cespedes M. Dysfunctional AMPK activity,
signalling through mTOR and survival in response to energetic stress in LKB1-deficient
lung cancer. Oncogene 2007; 26: 1616–25.

110
Chang FL, Lai MD. Various forms of mutant TP53 confer sensitivity to cisplatin
and doxorubicin in bladder cancer cells. J Urol (2001) 166:304–310.
Chapman PB, Hauschild A, Robert C, Haanen JB, Ascierto P, Larkin J, Dummer
R, Garbe C, Testori A, Maio M, Hogg D, Lorigan P, Lebbe C, Jouary T, Schadendorf D,
Ribas A, O'Day SJ, Sosman JA, Kirkwood JM, Eggermont AM, Dreno B, Nolop K, Li J,
Nelson B, Hou J, Lee RJ, Flaherty KT, McArthur GA; BRIM-3 Study Group. Improved
survival with vemurafenib in melanoma with BRAF V600E mutation. N Engl J Med
2011;364:2507-16.
Chen X, Wei B, Han X, Zheng Z, Huang J, Liu J, Huang Y, Wei H. LGR5 is
required for the maintenance of spheroid-derived colon cancer stem cells. Int J Mol Med.
2014 Jul;34(1):35-42.
Chou TC, Talalay P. Quantitative analysis of dose-effect relationships: the
combined effects of multiple drugs or enzyme inhibitors. Adv Enzyme Regul. 1984; 22:27-
55.
Ciardiello F and Tortora G.“EGFR antagonists in cancer treatment,” The New
England Journal of Medicine, vol. 358, no. 11, pp. 1160–1174, 2008.
Corcoran RB, Atreya CE, Falchook GS, Kwak EL, Ryan DP, Bendell JC, Hamid
O, Messersmith WA, Daud A, Kurzrock R, Pierobon M, Sun P, Cunningham E, Little S,
Orford K, Motwani M, Bai Y, Patel K, Venook AP, Kopetz S. Combined BRAF and MEK
Inhibition With Dabrafenib and Trametinib in BRAF V600-Mutant Colorectal Cancer. J
Clin Oncol. 2015 Dec 1;33(34):4023-31.

111
Corcoran RB, Ebi H, Turke AB, Coffee EM, Nishino M, Cogdill AP, Brown RD,
Della Pelle P, Dias-Santagata D, Hung KE, Flaherty KT, Piris A, Wargo JA, Settleman J,
Mino-Kenudson M, Engelman JA. EGFR-mediated re-activation of MAPK signaling
contributes to insensitivity of BRAF mutant colorectal cancers to RAF inhibition with
vemurafenib. Cancer Discov. 2012 Mar;2(3):227-35.
Cremolini C, Bartolomeo MD, Amatu A, Antoniotti C, Moretto R, Berenato R,
Perrone F, Tamborini E, Aprile G, Lonardi S, Sartore-Bianchi A, Fontanini G, Milione M,
Lauricella C, Siena S, Falcone A, de Braud F, Loupakis F, Pietrantonio F.BRAF codons
594 and 596 mutations identify a new molecular subtype of metastatic colorectal cancer at
favorable prognosis. Ann Oncol. 2015; 26: 2092-2097.
Dalerba P, Dylla SJ, Park IK, Liu R, Wang X, Cho RW, Hoey T, Gurney A,
Huang EH, Simeone DM, Shelton AA, Parmiani G, Castelli C, Clarke MF. Phenotypic
characterization of human colorectal cancer stem cells. Proc Natl Acad Sci U S A. 2007
Jun 12;104(24):10158-63.
Daugan M, Dufaÿ Wojcicki A, d'Hayer B, Boudy V. Metformin: An anti-diabetic
drug to fight cancer. Pharmacol Res. 2016 Nov;113(Pt A):675-685.
de Lau W, Barker N, Low TY, Koo BK, Li VS, Teunissen H, Kujala P,
Haegebarth A, Peters PJ, van de Wetering M, Stange DE, van Es JE, Guardavaccaro D,
Schasfoort RB, Mohri Y, Nishimori K, Mohammed S, Heck AJ, Clevers H. Lgr5
homologues associate with Wnt receptors and mediate R-spondin signalling. Nature. 2011
Jul 4;476(7360):293-7.

112
de Lau W, Peng WC, Gros P, Clevers H. The R-spondin/Lgr5/Rnf43 module:
regulator of Wnt signal strength. Genes Dev. 2014 Feb 15;28(4):305-16.
De Roock W, Claes B, Bernasconi D, De Schutter J, Biesmans B, Fountzilas G,
Kalogeras KT, Kotoula V, Papamichael D, Laurent- Puig P, Penault-Llorca F, Rougier P,
Vincenzi B, Santini D, Tonini G, Cappuzzo F, Frattini M, Molinari F, Saletti P, De Dosso
S, Martini M, Bardelli A, Siena S, Sartore-Bianchi A, Tabernero J, Macarulla T, Di Fiore
F, Gangloff AO, Ciardiello F, Pfeiffer P, Qvortrup C, Hansen TP, Van Cutsem E,
Piessevaux H, Lambrechts D, Delorenzi M, Tejpar S. Effects of KRAS, BRAF, NRAS,
and PIK3CA mutations on the efficacy of cetuximab plus chemotherapy in chemotherapy-
refractory metastatic colorectal cancer: a retrospective consortium analysis. Lancet Oncol
2010; 11: 753-762.
Denise C, Paoli P, Calvani M, Taddei ML, Giannoni E, Kopetz S, Kazmi SM, Pia
MM, Pettazzoni P, Sacco E, Caselli A, Vanoni M, Landriscina M, Cirri P, Chiarugi P. 5-
fluorouracil resistant colon cancer cells are addicted to OXPHOS to survive and enhance
stem-like traits. Oncotarget. 2015 Dec 8;6(39):41706-21.
Dong L, Zhou Q, Zhang Z, Zhu Y, Duan T, Feng Y. Metformin sensitizes
endometrial cancer cells to chemotherapy by repressing glyoxalase I expression. J. Obstet.
Gynaecol. Res. 2012 38, 1077–1085.
Douillard JY, Cunningham D, Roth AD, Navarro M, James RD, Karasek P,
Jandik P, Iveson T, Carmichael J, Alakl M, Gruia G, Awad L, Rougier P. Irinotecan
combined with fluorouracil compared with fluorouracil alone as first-line treatment for
metastatic colorectal cancer: a multicentre randomised trial. Lancet 2000; 355: 1041-1047.

113
Douillard JY, Siena S, Cassidy J, Tabernero J, Burkes R, Barugel M, Humblet Y,
Bodoky G, Cunningham D, Jassem J, Rivera F, Kocákova I, Ruff P, Błasińska-Morawiec
M, Šmakal M, Canon JL, Rother M, Oliner KS, Wolf M, Gansert J.Randomized, phase III
trial of panitumumab with infusional fluorouracil, leucovorin, and oxaliplatin (FOLFOX4)
versus FOLFOX4 alone as first-line treatment in patients with previously untreated
metastatic colorectal cancer: the PRIME study. J Clin Oncol. 2010;28(31):4697–4705.
Dylla SJ, Beviglia L, Park IK, Chartier C, Raval J, Ngan L, Pickell K, Aguilar J,
Lazetic S, Smith-Berdan S, Clarke MF, Hoey T, Lewicki J, Gurney AL. Colorectal cancer
stem cells are enriched in xenogeneic tumors following chemotherapy. PLoS ONE
2008;3:e2428.
El-Mir MY, Nogueira V, Fontaine E, Avéret N, Rigoulet M, Leverve X.
Dimethylbiguanide inhibits cell respiration via an indirect effect targeted on the respiratory
chain complex I. J Biol Chem. 2000; 275(1):223–228.
Elez E, Schellens J, van Geel R, Bendell J, Spreafico A, Schuler M, Yoshino T,
Delord J-P, Yamada Y, Lolkema M, Faris JE, Eskens F,Sharma S, Yaeger R, Lenz H-J,
Wainberg Z, Avsar E, Chatterjee A,Jaeger S, Demuth T, Tabernero J.Results of a phase 1b
study of the selective BRAF V600 inhibitor encorafenib in combination with cetuximab
alone or cetuximab + alpelisib for treatment of patients with advanced BRAF-mutant
metastatic colorectal cancer. Ann. Oncol. 26 (Suppl. 4), iv120 (2015).
Emmink BL, Van Houdt WJ, Vries RG, Hoogwater FJ, Govaert KM, Verheem A,
Nijkamp MW, Steller EJ, Jimenez CR, Clevers H, Borel Rinkes IH, Kranenburg O.
Differentiated human colorectal cancer cells protect tumor-initiating cells from irinotecan.
Gastroenterology. 2011 Jul;141(1):269-78.

114
Esteller M, Avizienyte E, Corn PG, Lothe RA, Baylin SB, Aaltonen LA, Herman
JG. Epigenetic inactivation of LKB1 in primary tumors associated with the Peutz-Jeghers
syndrome. Oncogene. 2000 Jan 6;19(1):164-8.
Evans JM, Donnelly LA, Emslie-Smith AM, Alessi DR, Morris AD. Metformin
reduced risk of cancer in diabetic patients. BMJ. 2005;330(7503):1304–1305.
Fan S, el-Deiry WS, Bae I, Freeman J, Jondle D, Bhatia K, Fornace AJ Jr,
Magrath I, Kohn KW, O’Connor PM. TP53 gene mutations are associated with decreased
sensitivity of human lymphoma cells to DNA damaging agents. Cancer Res (1994)
54:5824–5830.
Fan S, Smith ML, Rivet DJ 2nd, Duba D, Zhan Q, Kohn KW, Fornace AJ Jr,
O’Connor PM. Disruption of TP53 function sensitizes breast cancer MCF-7 cells to
cisplatin and pentoxifylline. Cancer Res 1995 55:1649–1654.
Fearon ER. Molecular genetics of colorectal cancer. Annu Rev Pathol.
2011;6:479-507.
Fearon ER, Vogelstein B. A genetic model for colorectal tumorigenesis. Cell
1990; 61: 759-767.
Feng Y, Ke C, Tang Q, Dong H, Zheng X, Lin W, Ke J, Huang J, Yeung SC,
Zhang H. Metformin promotes autophagy and apoptosis in esophageal squamous cell
carcinoma by downregulating Stat3 signaling. Cell Death Dis. 2014 Feb 27;5:e1088.

115
Ferrara N, Gerber H and LeCouter J. The biology of VEGF and its receptors. Nat
Med 2003 9:669–676.
Ferrara N , Hillan K, Gerber H and Novotny W. Discovery and development of
bevacizumab, an anti-VEGF antibody for treating cancer. Nat Rev Drug Discov 2004 3:
391–400.
Fischer Y, Thomas J , Rosen P and Kammermeier H. Action of metformin on
glucose transport and glucose transporter GLUT1 and GLUT4 in heart muscle cells from
healthy and diabetic rats. Endocrinology 136, 412–420 (1995).
Flaherty KT, Puzanov I, Kim KB, Ribas A, McArthur GA, Sosman JA, O'Dwyer
PJ, Lee RJ, Grippo JF, Nolop K, Chapman PB. Inhibition of mutated, activated BRAF in
metastatic melanoma. N Engl J Med 2010;363:809-19.
Flis S, Spłwiński J. Inhibitory effects of 5-fluorouracil and oxaliplatin on human
colorectal cancer cell survival are synergistically enhanced by sulindac sulfide. Anticancer
Res. 2009 Jan;29(1):435-41.
Foretz M, Guigas B, Bertrand L, Pollak M, Viollet B. Metformin: from
mechanisms of action to therapies. Cell Metab 2014;20(6):953-66.
Fujihara S, Kato K, Morishita A, Iwama H, Nishioka T, Chiyo T, Nishiyama N,
Miyoshi H, Kobayashi M, Kobara H, Mori H, Okano K, Suzuki Y, Masaki T. Antidiabetic
drug metformin inhibits esophageal adenocarcinoma cell proliferation in vitro and in vivo,
Int. J. Oncol. 46 (2015) 2172–2180.

116
Gao ZY, Liu Z, Bi MH, Zhang JJ, Han ZQ, Han X, Wang HY, Sun GP, Liu H.
Metformin induces apoptosis via a mitochondria-mediated pathway in human breast cancer
cells in vitro. Exp Ther Med. 2016 May;11(5):1700-1706.
Garrett CR, Hassabo HM, Bhadkamkar NA, Wen S, Baladandayuthapani V, Kee
BK, Eng C, Hassan MM. Survival advantage observed with the use of metformin in
patients with type II diabetes and colorectal cancer. Br J Cancer 2012;106(8):1374-8.
Gong L, Goswami S, Giacomini KM, Altman RB and Klein TE. Metformin
pathways: pharmacokinetics and pharmacodynamics. Pharmacogenet. Genomics (2012)
22, 820–827.
Groenendijk FH1, Mellema WW, van der Burg E, Schut E, Hauptmann M,
Horlings HM, Willems SM, van den Heuvel MM, Jonkers J, Smit EF, Bernards R.
Sorafenib synergizes with metformin in NSCLC through AMPK pathway activation. Int J
Cancer. 2015 Mar 15;136(6):1434-44.
Grothey A, Sargent D, Goldberg RM, Schmoll HJ. Survival of patients with
advanced colorectal cancer improves with the availability of fluorouracil-leucovorin,
irinotecan, and oxaliplatin in the course of treatment. J Clin Oncol 2004; 22: 1209-1214.
Grothey A, Van Cutsem E, Sobrero A, Siena S, Falcone A, Ychou M, Humblet Y,
Bouché O, Mineur L, Barone C, Adenis A, Tabernero J, Yoshino T, Lenz HJ, Goldberg
RM, Sargent DJ, Cihon F, Cupit L, Wagner A, Laurent D. Regorafenib monotherapy for
previously treated metastatic colorectal cancer (CORRECT): an international, multicentre,
randomised, placebo-controlled, phase 3 trial. Lancet 2013; 381: 303-312.

117
Guichard S, Arnould S, Hennebelle I, Bugat R, Canal P. Combination of
oxaliplatin and irinotecan on human colon cancer cell lines: activity in vitro and in vivo.
Anticancer Drugs. 2001 Oct;12(9):741-51.
Guichard S, Hennebelle I, Bugat R, Canal P. Cellular interactions of 5-
fluorouracil and the camptothecin analogue CPT-11 (irinotecan) in a human colorectal
carcinoma cell line. Biochem Pharmacol. 1998 Mar 1;55(5):667-76.
Gunderson LL, Jessup JM, Sargent DJ, Greene FL, Stewart AK. Revised TN
categorization for colon cancer based on national survival outcomes data. J Clin Oncol.
2010 Jan;28(2):264-71.
Gwinn DM, Shackelford DB, Egan DF, Mihaylova MM, Mery A, Vasquez DS,
Turk BE, Shaw RJ. AMPK phosphorylation of raptor mediates a metabolic checkpoint.
Mol Cell 2008; 30: 214–226.
Hanly EK, Bednarczyk RB, Tuli NY, Moscatello AL, Halicka HD, Li J, Geliebter
J, Darzynkiewicz Z, Tiwari RK. mTOR inhibitors sensitize thyroid cancer cells to
cytotoxic effect of vemurafenib. Oncotarget. 2015 Nov 24;6(37):39702-13.
Hirsch HA, Iliopoulos D, Tsichlis PN, Struhl K. Metformin selectively targets
cancer stem cells, and acts together with chemotherapy to block tumor growth and prolong
remission. Cancer Res 2009; 69: 7507–7511.
Hirsch HA, Iliopoulos D and & Struhl K. Metformin inhibits the inflammatory
response associated with cellular transformation and cancer stem cell growth. Proc. Natl
Acad. Sci. USA 110, 972–977 (2013).

118
Hosono K, Endo H, Takahashi H, Sugiyama M, Uchiyama T, Suzuki K Nozaki Y,
Yoneda K, Fujita K, Yoneda M, Inamori M, Tomatsu A, Chihara T, Shimpo K, Nakagama
H, Nakajima A. Metformin suppresses azoxymethane-induced colorectal aberrant crypt
foci by activating AMP-activated protein kinase. Mol Carcing 2010; 49: 662–671.
Hosono K, Endo H, Takahashi H, Sugiyama M , Sakai E, Uchiyama T, Suzuki K,
Iida H, Sakamoto Y, Yoneda K, Koide T, Tokoro C, Abe Y, Inamori M, Nakagama H,
Nakajima A. Metformin suppresses colorectal aberrant crypt foci in a short-term clinical
trial. Cancer Prev. Res. (Phila.) 2010 3, 1077–1083.
Ikenoue T, Kanai F, Hikiba Y, Obata T, Tanaka Y, Imamura J, Ohta M, Jazag A,
Guleng B, Tateishi K, Asaoka Y, Matsumura M, Kawabe T, Omata M. Functional analysis
of PIK3CA gene mutations in human colorectal cancer. Cancer Res. 2005 Jun
1;65(11):4562-7.
Iliopoulos D, Hirsch HA, Struhl K. Metformin decreases the dose of
chemotherapy for prolonging tumor remission in mouse xenografts involving multiple
cancer cell types, Cancer Res. (2011) 71:3196–3201.
Jackson JG, Pant V, Li Q, Chang LL, Quintas-Cardama A, Garza D, Tavana O,
Yang P, Manshouri T, Li Y, El-Naggar AK, Lozano G. TP53-mediated senescence impairs
the apoptotic response to chemotherapy and clinical outcome in breast cancer. Cancer Cell
(2013) 21:793–806.
Janjetovic K, Vucicevic L, Misirkic M, Vilimanovich U, Tovilovic G, Zogovic N,
Nikolic Z, Jovanovic S, Bumbasirevic V, Trajkovic V, Harhaji-Trajkovic L. Metformin

119
reduces cisplatin-mediated apoptotic death of cancer cells through AMPK-independent
activation of Akt. Eur. J. Pharmacol. 2011 651, 41–50.
Joe SG, Yoon YH, Choi JA, Koh J-Y. Anti-angiogenic effect of metformin in
mouse oxygen-induced retinopathy is mediated by reducing levels of the vascular
endothelial growth factor receptor Flk-1, PLoS One 10 (3) (2015) e0119708.
Inoki K, Zhu T, Guan KL. TSC2 mediates cellular energy response to control cell
growth and survival. Cell 2003; 115: 577–590.
Kalender A, Selvaraj A, Kim SY, Gulati P, Bruˆ le´ S, Viollet B, Kemp BE,
Bardeesy N, Dennis P, Schlager JJ, Marette A, Kozma SC, Thomas G. Metformin,
independent of AMPK, inhibits mTORC1 in a rag GTPase-dependent manner. Cell Metab
2010; 11: 390–401.
Kawamoto H, Yuasa T, Kubota Y, Seita M, Sasamoto H, Shahid JM, Hayashi T,
Nakahara H, Hassan R, Iwamuro M, Kondo E, Nakaji S, Tanaka N, Kobayashi N.
Characteristics of CD133(+) human colon cancer SW620 cells. Cell Transplant.
2010;19(6):857-64. 29.
Kelly C, Cassidy J. Chemotherapy in metastatic colorectal cancer. Surg Oncol.
2007 Jul;16(1):65-70.
Kim TH, Suh DH, Kim MK, Song YS. Metformin against cancer stem cells
through the modulation of energy metabolism: special considerations on ovarian cancer,
Biomed. Res. Int. 2014 (2014).

120
Kinzler, KW and Vogelstein B. 2002. Colorectal tumors. In Vogelstein, B., and
Kinzler, K. W., eds., The Genetic Basis of Human Cancer (2nd edition)., pp. 583–612.
McGraw-Hill, New York., ed.
Knudson AG. 1993. Antioncogenes and human cancer. Pro.Natl.Acad.Sci. USA
90:10914-10921.
Koopman M, Antonini NF, Douma J, Wals J, Honkoop AH, Erdkamp FL, de Jong
RS, Rodenburg CJ, Vreugdenhil G, Loosveld OJ, van Bochove A, Sinnige HA, Creemers
GJ, Tesselaar ME, Slee PH, Werter MJ, Mol L, Dalesio O, Punt CJ. Sequential versus
combination chemotherapy with capecitabine, irinotecan, and oxaliplatin in advanced
colorectal cancer (CAIRO): a phase III randomised controlled trial. Lancet 370, 135–142
(2007).
Kopetz, S Desai J, Chan E, Hecht JR, O'Dwyer PJ, Maru D, Morris V, Janku F,
Dasari A, Chung W, Issa JP, Gibbs P, James B, Powis G, Nolop KB, Bhattacharya S, Saltz
L. Phase II pilot study of vemurafenib in patients with metastatic BRAF-mutated colorectal
cancer. J. Clin. Oncol. 33, 4032–4038 (2015).
Le DT, Uram JN, Wang H, Bartlett BR, Kemberling H, Eyring AD, Skora AD,
Luber BS, Azad NS, Laheru D, Biedrzycki B, Donehower RC, Zaheer A, Fisher GA,
Crocenzi TS, Lee JJ, Duffy SM, Goldberg RM, de la Chapelle A, Koshiji M, Bhaijee F,
Huebner T, Hruban RH, Wood LD, Cuka N, Pardoll DM, Papadopoulos N, Kinzler KW,
Zhou S, Cornish TC, Taube JM, Anders RA, Eshleman JR, Vogelstein B, Diaz LA Jr. PD-
1 Blockade in Tumors with Mismatch-Repair Deficiency. N Engl J Med. 2015 Jun
25;372(26):2509-20.

121
Lee JH, Kim TI, Jeon SM, Hong SP, Cheon JH, Kim WH. The effects of
metformin on the survival of colorectal cancer patients with diabetes mellitus. Int J Cancer
2012;131(3):752-9.
Lettieri Barbato D, Vegliante R, Desideri E, Ciriolo MR. Managing lipid
metabolism in proliferating cells: new perspective for metformin usage in cancer therapy,
Biochim. Biophys. Acta (BBA): Rev. Cancer 1845 (April (2))(2014) 317–324.
Li R, Sutphin PD, Schwartz D, Matas D, Almog N, Wolkowicz R, Goldfinger N,
Pei H, Prokocimer M, Rotter V. Mutant TP53 protein expression interferes with TP53-
independent apoptotic pathways. Oncogene (1998) 16:3269–3277.
Li W, Wang Q-L, Liu X, Dong S-H, Li H-X, Li C-Y, Guo L-S, Gao J-M, Berger
NA, Li L, Ma L, Wu Y-J. Combined use of Vitamin D3 and metformin exhibits synergistic
chemopreventive effects on colorectal neoplasia in rats and mice. Cancer Prev Res 2015,
8(2):139–148.
Libby G, Donnelly LA, Donnan PT, Alessi DR, Morris AD, Evans JMM. New
users of metformin are at low risk of incident cancer: a cohort study among people with
type 2 diabetes. Diabetes Care 2009;32:1620–5.
Lichtenstein P, Holm NV, Verkasalo PK, Iliadou A, Kaprio J, Koskenvuo M,
Pukkala E, Skytthe A, Hemminki K. Environmental and heritable factors in the causation
of cancer - Analyses of cohorts of twins from Sweden, Denmark, and Finland. New
England Journal of Medicine, 2000. 343(2): p. 78-85.
Lievre A, Bachet JB, Le Corre D, Boige V, Landi B, Emile JF, Côté JF, Tomasic

122
G, Penna C, Ducreux M, Rougier P, Penault-Llorca F, Laurent-Puig P. KRAS mutation
status is predictive of response to cetuximab therapy in colorectal cancer. Cancer Res.
2006;66(8):3992–3995.
Lin YC, Wu MH, Wei TT, Lin YC, Huang WC, Huang LY, Lin YT, Chen CC.
Metformin sensitizes anticancer effect of dasatinib in head and neck squamous cell
carcinoma cells through AMPK-dependent ER stress. Oncotarget. 2014 Jan 15;5(1):298-
308.
Lonardo E, Cioffi M, Sancho P, Sanchez-Ripoll Y, Trabulo SM, Dorado J , Balic
A, Hidalgo M, and Heeschen C. Metformin targets the metabolic achilles heel of human
pancreatic cancer stem cells. PLoS ONE. 2013; 8: e76518.
Lowe SW, Ruley HE, Jacks T, Housman DE. TP53-dependent apoptosis
modulates the cytotoxicity of anticancer agents. Cell 1993; 74: 957-967.
Malki A, Youssef A. Antidiabetic drug metformin induces apoptosis in human
MCF breast cancer via targeting ERK signaling. Oncol Res. 2011;19(6):275-85.
Mans DR, Grivicich I, Peters GJ, Schwartsmann G. Sequence-dependent growth
inhibition and DNA damage formation by the irinotecan-5-fluorouracil combination in
human colon carcinoma cell lines. Eur J Cancer. 1999 Dec;35(13):1851-61.
Mao M, Tian F, Mariadason JM, Tsao CC, Lemos R Jr, Dayyani F, Gopal YN,
Jiang ZQ, Wistuba II, Tang XM, Bornman WG, Bollag G, Mills GB, Powis G, Desai J,
Gallick GE, Davies MA, Kopetz S. Resistance to BRAF inhibition in BRAF-mutant colon
cancer can be overcome with PI3K inhibition or demethylating agents. Clin Cancer Res.
2013 Feb 1;19(3):657-67.
123
Mariadason JM, Arango D, Shi Q, Wilson AJ, Corner GA, Nicholas C, Aranes
MJ, Lesser M, Schwartz EL, Augenlicht LH. Gene expression profiling-based prediction
of response of colon carcinoma cells to 5-fluorouracil and camptothecin. Cancer Res. 2003
Dec 15;63(24):8791-812.
Markowitz S, Wang J, Myeroff L, Parsons R, Sun L, Lutterbaugh J, Fan RS,
Zborowska E, Kinzler KW, Vogelstein B, et al. Inactivation of the type II TGF-beta
receptor in colon cancer cells with microsatellite instability. Science. 1995 Jun
2;268(5215):1336-8.
Markowitz SD, Bertagnolli MM. Molecular origins of cancer: Molecular basis of
colorectal cancer. N Engl J Med. 2009 Dec 17;361(25):2449-60.
Mackenzie RM, Salt IP, Miller WH, Logan A, Ibrahim HA, Degasperi A Dymott
JA, Hamilton CA, Murphy MP, Delles C, Dominiczak AF. Mitochondrial reactive oxygen
species enhance AMP-activated protein kinase activation in the endothelium of patients
with coronary artery disease and diabetes. Clin Sci (Lond) 2013;124(6):403-11.
Marchi S, Giorgi C, Suski JM, Agnoletto C, Bononi A, Bonora M, De Marchi E,
Missiroli S, Patergnani S, Poletti F, Rimessi A, Duszynski J, Wieckowski MR, Pinton P.
Mitochondria-ros crosstalk in the control of cell death and aging. J Signal Transduct
2012;2012:329635.
Medico E, Russo M, Picco G, Cancelliere C, Valtorta E, Corti G, Buscarino M,
Isella C, Lamba S, Martinoglio B, Veronese S, Siena S, Sartore-Bianchi A, Beccuti M,
Mottolese M, Linnebacher M, Cordero F, Di Nicolantonio F, Bardelli A. The molecular
landscape of colorectal cancer cell lines unveils clinically actionable kinase targets. Nat

124
Commun. 2015 Apr 30;6:7002.
Menendez JA, Oliveras-Ferraros C, Cufi S, Corominas-Faja B, Joven J, Martin-
Castillo B, Vazquez-Martin A. Metformin is synthetically lethal with glucose withdrawal
in cancer cells. Cell Cycle 2012;11(15):2782-92.
Meyerhardt JA and Mayer RJ. Systemic therapy for colorectal cancer. N. Engl. J.
Med. 352, 476–487 (2005).
Minassian C, Tarpin S, Mithieux G. Role of glucose-6 phosphatase,glucokinase,
and glucose-6 phosphate in liver insulin resistance and its correction by metformin,
Biochem. Pharmacol. 55 (April (8)) (1998)1213–1219.
Misale S, Arena S, Lamba S, Siravegna G, Lallo A, Hobor S, Russo M, Buscarino
M, Lazzari L, Sartore-Bianchi A, Bencardino K, Amatu A, Lauricella C, Valtorta E,Siena
S, Di Nicolantonio F, Bardelli A. Blockade of EGFR and MEK intercepts heterogeneous
mechanisms of acquired resistance to anti-EGFR therapies in colorectal cancer. Sci Transl
Med. 2014 Feb 19;6(224):224ra26.
Miyo M, Konno M, Nishida N, Sueda T, Noguchi K, Matsui H, Colvin H,
Kawamoto K, Koseki J, Haraguchi N, Nishimura J, Hata T, Gotoh N, Matsuda F, Satoh T,
Mizushima T, Shimizu H, Doki Y, Mori M, Ishii H. Metabolic Adaptation to Nutritional
Stress in Human Colorectal Cancer. Scientific Reports 6, Article number: 38415 (2016).
Moiseeva O, Deschênes-Simard X, St-Germain E, Igelmann S, Huot G, Cadar
AE, Bourdeau V, Pollak MN, Ferbeyre G. Metformin inhibits the senescence-associated
secretory phenotype by interfering with IKK/NF-κB activation. Aging Cell. 2013
Jun;12(3):489-98.

125
Montgomery E, Goggins M, Zhou S, Argani P, Wilentz R, Kaushal M, Booker S,
Romans K, Bhargava P, Hruban R, Kern S. Nuclear localization of Dpc4 (Madh4, Smad4)
in colorectal carcinomas and relation to mismatch repair/transforming growth factor-beta
receptor defects. Am J Pathol. 2001 Feb;158(2):537-42.
Nangia-Makker P, Yu Y, Vasudevan A, Farhana L, Rajendra SG, Levi E,
Majumdar AP. Metformin: a potential therapeutic agent for recurrent colon cancer. PLoS
One. 2014 Jan 20;9(1):e84369.
Nannizzi S, Veal GJ, Giovannetti E, Mey V, Ricciardi S, Ottley CJ, Del Tacca M,
Danesi R. Cellular and molecular mechanisms for the synergistic cytotoxicity elicited by
oxaliplatin and pemetrexed in colon cancer cell lines. Cancer Chemother Pharmacol. 2010
Aug;66(3):547-58.
NCCN Clinical Practice Guidelines in Oncology (NCCNGuidelines5) Colon
Cancer, Version 22016, 2015.
Niehr F, von Euw E, Attar N, Guo D, Matsunaga D, Sazegar H, Ng C, Glaspy JA,
Recio JA, Lo RS, Mischel PS, Comin-Anduix B, Ribas A. Combination therapy with
vemurafenib (PLX4032/RG7204) and metformin in melanoma cell lines with distinct
driver mutations. J Transl Med. 2011 May 24;9:76.
Noto H, Goto A, Tsujimoto T, Noda M. Cancer risk in diabetic patients treated
with metformin: a systematic review and meta-analysis. PLoS One. 2012; 7(3):e33411.

126
O'Brien CA, Pollett A, Gallinger S, Dick JE.A human colon cancer cell capable of
initiating tumour growth in immunodeficient mice. Nature. 2007 Jan 4;445(7123):106-10.
O’Connor PM, Jackman J, Bae I, Myers TG, Fan S, Mutoh M, Scudiero DA,
Monks A, Sausville EA, Weinstein JN, Friend S, Fornace AJ Jr, Kohn KW.
Characterization of the TP53 tumor suppressor pathway in cell lines of the National Cancer
Institute anticancer drug screen and correlations with the growth-inhibitory potency of 123
anticancer agents. Cancer Res (1997) 57:4285–4300.
Pernicova I, Korbonits M. Metformin--mode of action and clinical implications
for diabetes and cancer. Nat Rev Endocrinol 2014;10(3):143-56.
Pierotti MA, Berrino F, Gariboldi M , Melani C , Mogavero A , Negri T , Pasanisi
P , Pilotti S. Targeting metabolism for cancer treatment and prevention: metformin, an old
drug with multi-faceted effects. Oncogene 32, 1475–1487 (2013).
Pollak M. The insulin and insulin-like growth factor receptor family in neoplasia:
an update. Nat Rev Cancer. 2012;12(3):159–169.
Prahallad A, Sun C, Huang S, Di Nicolantonio F, Salazar R, Zecchin D,
Beijersbergen RL, Bardelli A, Bernards R. Unresponsiveness of colon cancer to
BRAF(V600E) inhibition through feedback activation of EGFR. Nature. 2012 Jan 26;
483(7387):100-3.
Queiroz EA, Puukila S, Eichler R, Sampaio SC, Forsyth HL, Lees SJ, Barbosa
AM, Dekker RF, Fortes ZB, Khaper N. Metformin induces apoptosis and cell cycle arrest
mediated by oxidative stress, AMPK and FOXO3a in MCF-7 breast cancer cells. PLoS

127
One. 2014 May 23;9(5):e98207.
Ricci-Vitiani L, Lombardi DG, Pilozzi E, Biffoni M, Todaro M, Peschle C, De
Maria R. Identification and expansion of human colon-cancer-initiating cells. Nature. 2007
Jan 4;445(7123):111-5.
Rodrigues D, Longatto-Filho A, Martins SF. Predictive Biomarkers in Colorectal
Cancer: From the Single Therapeutic Target to a Plethora of Options. Biomed Res Int.
2016;2016:6896024.
Saber MM, Galal MA, Ain-Shoka AA, Shouman SA. Combination of metformin
and 5-aminosalicylic acid cooperates to decrease proliferation and induce apoptosis in
colorectal cancer cell lines. BMC Cancer. 2016 Feb 19;16:126.
Sahlberg SH, Spiegelberg D, Glimelius B, Stenerlow B, Nestor M. Evaluation of
cancer stem cell markers CD133, CD44, CD24: association with AKT isoforms and
radiation resistance in colon cancer cells. PLoS One 2014;9(4):e94621.
Salani B, Rio AD, Marini C, Sambuceti G, Cordera R, Maggi D. Metformin,
cancer and glucose metabolism, Endocr. Relat. Cancer 21 (2014) R461–R471.
Saltz L, Clarke S, Diaz-Rubio E, Scheithauer W, Figer A, Wong R Koski S,
Lichinitser M, Yang TS, Rivera F, Couture F, Sirzén F, Cassidy J. Bevacizumab in
combination with oxaliplatin-based chemotherapy as first-line therapy in metastatic
colorectal cancer: a randomized phase III study. J Clin Oncol. 2008 Apr 20;26(12):2013-9.

128
Sato T, Vries RG, Snippert HJ, van de Wetering M, Barker N, Stange DE, van Es
JH, Abo A, Kujala P, Peters PJ, Clevers H. Single Lgr5 stem cells build crypt-villus
structures in vitro without a mesenchymal niche. Nature. 2009 May 14;459(7244):262-5.
Scott KD, Nath-Sain S, Agnew MD, Marignani PA. LKB1 catalytically deficient
mutants enhance cyclin D1 expression. Cancer Res. 2007 Jun 15;67(12):5622-7.
Senda T, Iizuka-Kogo A, Onouchi T, Shimomura A.Adenomatous polyposis coli
(APC) plays multiple roles in the intestinal and colorectal epithelia. Med Mol Morphol,
2007. 40(2): p. 68-81.
Seow HF, Yip WK, Fifis T. Advances in targeted and immunobased therapies for
colorectal cancer in the genomic era. Onco Targets Ther. 2016 Mar 31;9:1899-920.
Seymour MT Maughan TS, Ledermann JA, Topham C, James R, Gwyther SJ,
Smith DB, Shepherd S, Maraveyas A, Ferry DR, Meade AM, Thompson L, Griffiths GO,
Parmar MK, Stephens RJ; FOCUS Trial Investigators; National Cancer Research Institute
Colorectal Clinical Studies Group. Different strategies of sequential and combination
chemotherapy for patients with poor prognosis advanced colorectal cancer (MRC
FOCUS): a randomised controlled trial. Lancet 370, 143–152 (2007).
Silvestri A, Palumbo F, Rasi I, Posca D, Pavlidou T, Paoluzi S, Castagnoli L,
Cesareni G. Metformin Induces Apoptosis and Downregulates Pyruvate Kinase M2 in
Breast Cancer Cells Only When Grown in Nutrient-Poor Conditions. PLoS One 2015;
10:e0136250.

129
Shank JJ, Yang K, Ghannam J, Cabrera L, Johnston CJ, Reynolds RK,
Buckanovich RJ. Metformin targets ovarian cancer stem cells in vitro and in vivo,
Gynecol. Oncol. 127 (November (2)) (2012) 390–397.
Snippert HJ, van der Flier LG, Sato T, van Es JH, van den Born M, Kroon-
Veenboer C, Barker N, Klein AM, van Rheenen J, Simons BD, Clevers H. Intestinal crypt
homeostasis results from neutral competition between symmetrically dividing Lgr5 stem
cells. Cell. 2010; 143:134-44.
Song CW, Lee H, Dings RPM, Williams B, Powers J, Santos TD, Choi B-H, Park
HJ. Metformin kills and radiosensitizes cancer cells and preferentially kills cancer stem
cells, Sci. Rep. 2 (2012) 362.
Sosman JA, Kim KB, Schuchter L, Gonzalez R, Pavlick AC, Weber JS, McArthur
GA, Hutson TE, Moschos SJ, Flaherty KT, Hersey P, Kefford R, Lawrence D, Puzanov I,
Lewis KD, Amaravadi RK, Chmielowski B, Lawrence HJ, Shyr Y, Ye F, Li J, Nolop KB,
Lee RJ, Joe AK, Ribas A. Survival in BRAF V600-mutant advanced melanoma treated
with vemurafenib. N Engl J Med 2012; 366:707-14.
Spillane S, Bennett K, Sharp L, Barron TI. A cohort study of metformin exposure
and survival in patients with stage I-III colorectal cancer. Cancer Epidemiol Biomarkers
Prev 2013;22(8):1364-73.
Sui X, Xu Y, Yang J, Fang Y, Lou H, Han W, Zhang M, Chen W, Wang K, Li D,
Jin W, Lou F, Zheng Y, Hu H, Gong L, Zhou X, Pan Q, Pan H, Wang X, He C. Use of
metformin alone is not associated with survival outcomes of colorectal cancer cell but

130
AMPK activator AICAR sensitizes anticancer effect of 5-fluorouracil through AMPK
activation. PLoS One. 2014 May 21;9(5):e97781.
Tadakawa M, Takeda T, Li B, Tsuiji K, Yaegashi N. The anti-diabetic drug
metformin inhibits vascular endothelial growth factor expression via the mammalian target
of rapamycin complex 1/hypoxia-inducible factor-1 α signaling pathway in ELT-3 cells,
Mol. Cell. Endocrinol. 2015, 399: 1–8.
Takemura Y, Osuga Y, Yoshino O, Hasegawa A, Hirata T, Hirota Y, Nose E,
Morimoto C, Harada M, Koga K, Tajima T, Yano T, Taketani Y. Metformin suppresses
interleukin (IL)-1beta-induced IL-8 production, aromatase activation, and proliferation of
endometriotic stromal cells, J. Clin.Endocrinol. Metab. 92 (August (8)) (2007) 3213–3218.
Taketo MM, Takaku K. Gastro-intestinal tumorigenesis in Smad4 mutant mice.
Cytokine Growth Factor Rev. 2000 Mar-Jun;11(1-2):147-57.
Tol J, Nagtegaal ID, Punt CJ. BRAF mutation in metastatic colorectal cancer. N
Engl J Med. 2009;361(1):98–99.
Tomic T, Botton T, Cerezo M, Robert G, Luciano F, Puissant A, Gounon P,
Allegra M, Bertolotto C, Bereder JM, Tartare-Deckert S, Bahadoran P, Auberger P,
Ballotti R, Rocchi S. Metformin inhibits melanoma development through autophagy and
apoptosis mechanisms. Cell Death Dis. 2011 Sep 1;2:e199.
Tomimoto A, Endo H, Sugiyama M, Fujisawa T, Hosono K, Takahashi H,
Nakajima N, Nagashima Y, Wada K, Nakagama H, Nakajima A. Metformin suppresses
intestinal polyp growth in ApcMin/. mice. Cancer Sci 2008; 99: 2136–2141.

131
Torre LA, Siegel RL, Ward EM, Jemal A. Global Cancer Incidence and Mortality
Rates and Trends--An Update. Cancer Epidemiol Biomarkers Prev. 2016 Jan; 25(1):16-27.
Toscano F, Parmentier B, Fajoui ZE, Estornes Y, Chayvialle JA, Saurin JC,
Abello J. TP53 dependent and independent sensitivity to oxaliplatin of colon cancer cells.
Biochem Pharmacol. 2007;74(3):392-406.
Van Cutsem, E Lenz HJ, Köhne CH, Heinemann V, Tejpar S, Melezínek I, Beier
F, Stroh C, Rougier P, van Krieken JH, Ciardiello F. Fluorouracil, leucovorin, and
irinotecan plus cetuximab treatment and RAS mutations in colorectal cancer. J. Clin.
Oncol. 33, 692–700 (2015).
Van Cutsem E, Atreya CE, Bendell JC, Andre T, Schellens JHM, Gordon MS,
McRee AJ, O'Dwyer PJ, Muro K, Tabernero J, van Geel R, Sidhu R, Greger JG, Rangwala
FA, Motwani M, Wu Y, Orford KW, Corcoran RB. Updated results of the MEK inhibitor
trametinib (T), BRAF inhibitor dabrafenib (D), and anti-EGFR antibody panitumumab (P)
in patients (pts) with BRAF V600E mutated (BRAFm) metastatic colorectal cancer
(mCRC). Ann. Oncol. 26 (Suppl. 4), iv119 (2015).
van de Wetering M, Sancho E, Verweij C, de Lau W, Oving I, Hurlstone A, van
der Horn K, Batlle E, Coudreuse D, Haramis AP, Tjon-Pon-Fong M, Moerer P, van den
Born M, Soete G, Pals S, Eilers M, Medema R, Clevers H. The beta-catenin/TCF-4
complex imposes a crypt progenitor phenotype on colorectal cancer cells. Cell. 2002 Oct
18;111(2):241-50.

132
Van der Flier LG, Sabates-Bellver J, Oving I, Haegebarth A, De Palo M, Anti M,
Van Gijn ME, Suijkerbuijk S, Van de Wetering M, Marra G, Clevers H. The Intestinal
Wnt/TCF Signature. Gastroenterology. 2007 Feb;132(2):628-32.
Vazquez-Martin A, Oliveras-Ferraros C, Cufí S, Del Barco S, Martin-Castillo B,
Menendez JA. Metformin regulates breast cancer stem cell ontogeny by transcriptional
regulation of the epithelial-mesenchymal transition (EMT) status. Cell Cycle (2010)
9(18):3831–3838.
Vazquez-Martin A, Oliveras-Ferraros C, Cufı´ S, Martin-Castillo B, Menendez
JA. Metformin activates an Ataxia Telangiectasia Mutated (ATM)/Chk2-regulated DNA
damage-like response. Cell Cycle 2011; 10: 1499–1501.
Venook A, Niedzwiecki D, Hollis D, Sutherland S, Goldberg R, Alberts S,
Benson A, Wade J, Schilsky R, Mayer R. Phase III study of irinotecan/5FU/LV
(FOLFIRI) or oxaliplatin/5FU/LV (FOLFOX){+/-} cetuximab for patients (pts) with
untreated metastatic adenocarcinoma of the colon or rectum (MCRC):CALGB 80203
preliminary results. J Clin Oncol. 2006;24(18 Suppl):3509.
Vizioli MG, Santos J, Pilotti S, Mazzoni M, Anania MC, Miranda C, Pagliardini
S, Pierotti MA, Gil J, Greco A. Oncogenic RAS-induced senescence in human primary
thyrocytes: molecular effectors and inflammatory secretome involved. Oncotarget. 2014
Sep 30;5(18):8270-83.
Vujic I, Sanlorenzo M, Posch C, Esteve-Puig R, Yen AJ, Kwong A, Tsumura A,
Murphy R, Rappersberger K, Ortiz-Urda S. Metformin and trametinib have synergistic

133
effects on cell viability and tumor growth in NRAS mutant cancer. Oncotarget. 2015 Jan
20;6(2):969-78.
Wahdan-Alaswad R, Fan Z, Edgerton SM, Liu B, Deng XS, Arnadottir SS, Richer
JK, Anderson SM, Thor AD. Glucose promotes breast cancer aggression and reduces
metformin efficacy. Cell Cycle 2013;12(24):3759-69.
Weinberg RA. The biology of cancer. 2007, New York, NY: Garland Science. 1
v. (various pages).
Wielenga VJ, Smits R, Korinek V, Smit L, Kielman M, Fodde R, Clevers H, Pals
ST. Expression of CD44 in Apc and Tcf mutant mice implies regulation by the WNT
pathway. Am J Pathol. 1999 Feb;154(2):515-23.
Wilhelm SM, Dumas J, Adnane L, Lynch M, Carter CA, Schütz G, Thierauch
KH, Zopf D. Regorafenib (BAY 73-4506): a new oral multikinase inhibitor of angiogenic,
stromal and oncogenic receptor tyrosine kinases with potent preclinical antitumor activity.
Int J Cancer 2011; 129: 245-255.
Williams CC, Singleton BA, Llopis SD, Skripnikova EV. Metformin induces a
senescence-associated gene signature in breast cancer cells. J Health Care Poor
Underserved. 2013 Feb;24(1 Suppl):93-103.
Winawer SJ, Zauber AG, Ho MN, O'Brien MJ, Gottlieb LS, Sternberg SS, Waye
JD, Schapiro M, Bond JH, Panish JF, Ackroyd F, Shike M, Kurtz RC, Hornsby-Lewis L,
Gerdes H, Stewart ET, the National Polyp Study Workgroup. Prevention of colorectal
cancer by colonoscopic polypectomy. The National Polyp Study Workgroup. N Engl J

134
Med. 1993 Dec;329(27):1977-81.
Winton D.J., Blount M.A., Ponder B.A. A clonal marker induced by mutation in
mouse intestinal epithelium. Nature, 333 (1988), pp. 463–466
Woods A, Johnstone SR, Dickerson K, Leiper FC, Fryer LG, Neumann D,
Schlattner U, Wallimann T, Carlson M, Carling D. LKB1 is the upstream kinase in the
AMP-activated protein kinase cascade. Curr Biol. 2003;13(22):2004-8.
Yaeger, R. Cercek A, O'Reilly EM, Reidy DL, Kemeny N, Wolinsky T, Capanu
M, Gollub MJ, Rosen N, Berger MF, Lacouture ME, Vakiani E, Saltz LB. Pilot trial of
combined BRAF and EGFR inhibition in BRAF-mutant metastatic colorectal cancer
patients. Clin. Cancer Res. 21, 1313–1320 (2015).
Yang H, Higgins B, Kolinsky K, Packman K, Bradley WD, Lee RJ, Schostack K,
Simcox ME, Kopetz S, Heimbrook D, Lestini B, Bollag G, Su F. Antitumor activity of
BRAF inhibitor vemurafenib in preclinical models of BRAF-mutant colorectal cancer.
Cancer Res. 2012 Feb 1;72(3):779-89.
Yi G, He Z, Zhou X, Xian L, Yuan T, Jia X, Hong J, He L, Liu J. Low
concentration of metformin induces a TP53-dependent senescence in hepatoma cells via
activation of the AMPK pathway. Int J Oncol. 2013 Nov;43(5):1503-10.
Yuan P, Ito K, Perez-Lorenzo R, Del Guzzo C, Lee JH, Shen CH, Bosenberg
MW, McMahon M, Cantley LC, Zheng B. Phenformin enhances the therapeutic benefit of
BRAF(V600E) inhibition in melanoma. Proc Natl Acad Sci U S A. 2013 Nov
5;110(45):18226-31.

135
Zakikhani M, Dowling RJ, Sonenberg N, Pollak MN. The effects of adiponectin
and metformin on prostate and colon neoplasia involve activation of AMP activated
protein kinase. Cancer Prev Res (Phila) 2008; 1: 369–375.
Zhang HH, Guo XL. Combinational strategies of metformin and chemotherapy in
cancers. Cancer Chemother Pharmacol. 2016 Jul;78(1):13-26.
Zhang P, Li H, Tan X, Chen L, Wang S. Association of metformin use with
cancer incidence and mortality: A meta-analysis. Cancer Epidemiol. 2013; 37(3):207–218.
Zhang S, Lovejoy KS, Shima JE, Lagpacan LL, Shu Y, Lapuk A, Chen Y,
Komori T, Gray JW, Chen X, Lippard SJ, Giacomini KM. Organic cation transporters are
determinants of oxaliplatin cytotoxicity. Cancer Res. 2006 Sep 1;66(17):8847-57.
Zhang ZJ, Zheng Z, Kan H, Song Y, Cui W, Zhao G, Kip KE. Reduced Risk of
Colorectal Cancer With Metformin Therapy in Patients With T2DM. A meta-analysis.
Diabetes Care 2011;34:2323-8.
Zhou G, Myers R, Li Y, Chen Y, Shen X, Fenyk-Melody J, Wu M, Ventre J,
Doebber T, Fujii N, Musi N, Hirshman MF, Goodyear LJ, Moller DE. Role of AMP-
activated protein kinase in mechanism of metformin action. J. Clin. Invest. 108, 1167–
1174 (2001).
Zhuang Y, Miskimins WK. Cell cycle arrest in Metformin treated breast cancer
cells involves activation of AMPK, downregulation of cyclin D1, and requires p27Kip1 or
p21Cip1. J Mol Signal 2008; 3: 1

136
SUPPLEMENTARY TABLES
Supplementary table 1. CI of oxaliplatin (OXA) and 5-FU in HT29 OXA (µM) 5FU (µM) Effect CI
0.05625 0.625 0.09564 1.96317 0.1125 0.625 0.16982 1.03385 0.225 0.625 0.22237 0.99194 0.45 0.625 0.39984 0.88434 0.9 0.625 0.54912 1.20393 1.8 0.625 0.66040 1.90164
0.05625 1.25 0.23311 0.99213 0.1125 1.25 0.28289 0.83941 0.225 1.25 0.32710 0.88088 0.45 1.25 0.46769 0.86205 0.9 1.25 0.56914 1.21982 1.8 1.25 0.66752 1.91018
0.05625 2.5 0.39873 0.70364 0.1125 2.5 0.40192 0.78356 0.225 2.5 0.41970 0.89883 0.45 2.5 0.51196 0.93700 0.9 2.5 0.62016 1.18816 1.8 2.5 0.79140 1.46732
0.05625 5 0.46309 0.94442 0.1125 5 0.45345 1.07502 0.225 5 0.51032 0.97346 0.45 5 0.55096 1.10541 0.9 5 0.60396 1.43681 1.8 5 0.66711 0.89847
0.05625 10 0.54966 1.15697 0.1125 10 0.57032 1.10821 0.225 10 0.59374 1.11731 0.45 10 0.59651 1.36476 0.9 10 0.64948 1.57457 1.8 10 0.68355 2.29212
0.05625 20 0.64491 1.33933 0.1125 20 0.63015 1.5162 0.225 20 0.64917 1.48603 0.45 20 0.66258 1.61732 0.9 20 0.66765 2.03844 1.8 20 0.70982 2.5537

137
Supplementary table 2. CI of oxaliplatin (OXA) and 5-FU in HCT116 OXA (µM) 5FU (µM) Effect CI 0.04813 0.425 0.13023 1.71477 0.09625 0.425 0.12901 1.95370 0.1925 0.425 0.19850 1.38384 0.385 0.425 0.36670 0.94079 0.77 0.425 0.45496 0.85006 1.54 0.425 0.74689 0.94602 0.04813 0.85 0.28469 0.93977 0.09625 0.85 0.35163 0.73143 0.1925 0.85 0.35959 0.87814 0.385 0.85 0.42651 0.80087 0.77 0.85 0.47975 1.14181 1.54 0.85 0.73619 1.01544 0.04813 1.7 0.50129 1.19280 0.09625 1.7 0.42165 0.89477 0.1925 1.7 0.46137 0.86871 0.385 1.7 0.40472 1.43658 0.77 1.7 0.53039 1.29635 1.54 1.7 0.75114 1.01771 0.04813 3.4 0.44143 1.41429 0.09625 3.4 0.40778 1.76489 0.1925 3.4 0.44354 1.60674 0.385 3.4 0.52458 1.31171 0.77 3.4 0.59761 1.31450 1.54 3.4 0.74859 1.14545 0.04813 6.8 0.59737 1.21952 0.09625 6.8 0.58927 1.32015 0.1925 6.8 0.57553 1.51528 0.385 6.8 0.60801 1.46091 0.77 6.8 0.68104 1.29712 1.54 6.8 0.80451 1.03865 0.04813 13.6 0.71813 1.18423 0.09625 13.6 0.70558 1.31512 0.1925 13.6 0.70254 1.40653 0.385 13.6 0.72687 1.33398 0.77 13.6 0.77568 1.18271 1.54 13.6 0.80725 1.32269

138
Supplementary table 3. CI of oxaliplatin (OXA) and 5-FU inHCT116P53-/-
OXA (µM) 5FU (µM) Effect CI 0.2 0.45 0.12132 0.94304 0.4 0.45 0.14612 1.16563 0.8 0.45 0.26093 1.0702 1.6 0.45 0.48535 0.90065 3.2 0.45 0.75327 0.69611 6.4 0.45 0.78022 1.22498 0.2 0.9 0.15712 1.05066 0.4 0.9 0.27193 0.74527 0.8 0.9 0.34036 0.89162 1.6 0.9 0.57905 0.70383 3.2 0.9 0.70937 0.84828 6.4 0.9 0.80048 1.12485 0.2 1.8 0.15742 1.72681 0.4 1.8 0.21458 1.43821 0.8 1.8 0.32843 1.16485 1.6 1.8 0.50682 0.99238 3.2 1.8 0.65657 1.07909 6.4 1.8 0.80001 1.14943 0.2 3.6 0.28606 1.36099 0.4 3.6 0.38728 0.98223 0.8 3.6 0.40973 1.16085 1.6 3.6 0.54791 1.03123 3.2 3.6 0.66030 1.16355 6.4 3.6 0.74436 1.53901 0.2 7.2 0.50150 0.92604 0.4 7.2 0.52230 0.94060 0.8 7.2 0.54544 1.02854 1.6 7.2 0.64052 0.95218 3.2 7.2 0.67003 1.31016 6.4 7.2 0.75270 1.60488 0.2 14.4 0.63110 0.97826 0.4 14.4 0.66501 0.89064 0.8 14.4 0.64558 1.10379 1.6 14.4 0.71850 0.97392 3.2 14.4 0.73184 1.2836 6.4 14.4 0.77277 1.67595

139
Supplementary table 4. CI of irinotecan (IRI) and 5-FU in HT29
IRI (µM) 5FU (µM) Effect CI 0.0125 0.625 0.20188 1.19559 0.025 0.625 0.28624 0.87777 0.05 0.625 0.38511 0.76966 0.1 0.625 0.52384 0.67709 0.2 0.625 0.57480 0.98324 0.4 0.625 0.69722 1.0373
0.0125 1.25 0.32059 0.89699 0.025 1.25 0.33358 0.99866 0.05 1.25 0.43342 0.79309 0.1 1.25 0.47239 1.00814 0.2 1.25 0.44486 1.94979 0.4 1.25 0.56899 2.0199
0.0125 2.5 0.36885 1.21428 0.025 2.5 0.43050 0.96919 0.05 2.5 0.45364 1.05001 0.1 2.5 0.43364 1.58445 0.2 2.5 0.41019 2.71896 0.4 2.5 0.61622 1.75518
0.0125 5.0 0.53050 0.94344 0.025 5.0 0.53238 1.00175 0.05 5.0 0.54587 1.05994 0.1 5.0 0.49741 1.68143 0.2 5.0 0.48411 2.4706 0.4 5.0 0.57960 2.42407
0.0125 10.0 0.45335 2.76143 0.025 10.0 0.42683 3.30226 0.05 10.0 0.40344 4.00003 0.1 10.0 0.36839 5.43853 0.2 10.0 0.38619 5.97202 0.4 10.0 0.34178 10.2121
0.0125 20.0 0.64975 1.82307 0.025 20.0 0.64208 1.9488 0.05 20.0 0.62245 2.27395 0.1 20.0 0.62426 2.4292 0.2 20.0 0.63367 2.64479 0.4 20.0 0.63833 3.24495

140
Supplementary table 5. CI of irinotecan (IRI) and 5-FU in HCT116
IRI (µM) 5FU (µM) Effect CI 0.0015 0.425 0.18575 1.40433 0.0030 0.425 0.21204 1.36419 0.0060 0.425 0.28993 1.05359 0.012 0.425 0.43334 0.71247 0.024 0.425 0.55286 0.66790 0.048 0.425 0.73619 0.45101 0.0015 0.85 0.28469 1.03905 0.0030 0.85 0.35163 0.75232 0.0060 0.85 0.35959 0.92276 0.012 0.85 0.45496 0.76590 0.024 0.85 0.50129 0.98058 0.048 0.85 0.75114 0.44058 0.0015 1.7 0.42651 0.71657 0.0030 1.7 0.42165 0.81362 0.0060 1.7 0.46137 0.75473 0.012 1.7 0.40472 1.39465 0.024 1.7 0.53039 1.00151 0.048 1.7 0.74859 0.51883 0.0015 3.4 0.44143 1.23593 0.0030 3.4 0.40778 1.61735 0.0060 3.4 0.44354 1.41777 0.012 3.4 0.52458 1.03164 0.024 3.4 0.59761 0.89586 0.048 3.4 0.80451 0.41527 0.0015 6.8 0.59737 0.88341 0.0030 6.8 0.58927 0.96249 0.0060 6.8 0.57553 1.11849 0.024 6.8 0.77568 0.59720 0.048 6.8 0.62574 0.84855 0.012 6.8 0.60801 1.01727 0.024 13.6 0.68104 0.76945 0.0015 13.6 0.71813 0.73401 0.0030 13.6 0.70558 0.82485 0.0060 13.6 0.70254 0.87619 0.012 13.6 0.72687 0.78068 0.048 13.6 0.80725 0.56754

141
Supplementary table 6. CI of irinotecan (IRI) and 5-FU in HCT116P53-/-
IRI (µM) 5FU (µM) Effect CI 0.008125 0.45 0.17644 1.48995 0.01625 0.45 0.30111 0.88533 0.0325 0.45 0.43565 0.64213 0.065 0.45 0.46080 1.01865 0.13 0.45 0.49643 1.55827 0.26 0.45 0.54184 2.27398
0.008125 0.9 0.25272 0.97661 0.01625 0.9 0.29725 1.08331 0.0325 0.9 0.41959 0.80505 0.065 0.9 0.51143 0.79968 0.13 0.9 0.48701 1.72407 0.26 0.9 0.51213 2.81766
0.008125 1.8 0.31988 0.92245 0.01625 1.8 0.37022 0.90663 0.0325 1.8 0.43893 0.88565 0.065 1.8 0.52520 0.84941 0.13 1.8 0.50276 1.68777 0.26 1.8 0.55133 2.29115
0.008125 3.6 0.43879 0.82109 0.01625 3.6 0.46062 0.85509 0.0325 3.6 0.50465 0.86022 0.065 3.6 0.54128 0.98549 0.13 3.6 0.53956 1.55871 0.26 3.6 0.55448 2.44694
0.008125 7.2 0.45113 1.41969 0.01625 7.2 0.51210 1.14761 0.0325 7.2 0.47562 1.58389 0.065 7.2 0.48736 1.88778 0.13 7.2 0.51106 2.34088 0.26 7.2 0.55698 2.80721
0.008125 14.4 0.60565 1.3135 0.01625 14.4 0.62484 1.23561 0.0325 14.4 0.58862 1.57857 0.065 14.4 0.57567 1.90519 0.13 14.4 0.57027 2.41896 0.26 14.4 0.59789 2.84657

142
Supplementary table 7. CI of dasatinib (DAS) and metformin (MET) in NCI-H508
DAS (µM) MET Effect CI
0.1565 0.3125 0.16166 0.39302 0.3125 0.3125 0.13435 0.87186 0.625 0.3125 0.02366 13.2395 1.25 0.3125 0.14549 3 2.5 0.3125 0.33563 1.66 5.0 0.3125 0.57831 1.06
0.1565 0.625 0.03837 2.16 0.3125 0.625 0.24120 0.49199 0.625 0.625 0.08332 3.1 1.25 0.625 0.31138 1.04 2.5 0.625 0.40310 1.26 5.0 0.625 0.58898 1.05
0.1565 1.25 1.0E-5 25208.4 0.3125 1.25 0.01335 13.69 0.625 1.25 1.0E-5 100635 1.25 1.25 0.08731 5.86 2.5 1.25 0.33488 1.86 5.0 1.25 0.47889 1.81
0.1565 2.5 0.09680 1.49 0.3125 2.5 0.13610 1.54 0.625 2.5 0.13067 2.40 1.25 2.5 0.26000 1.8 2.5 2.5 0.29602 2.52 5.0 2.5 0.47414 2.06
0.1565 5.0 0.21914 1.47 0.3125 5.0 0.32408 1.26 0.625 5.0 0.32716 1.46 1.25 5.0 0.39520 1.53 2.5 5.0 0.40354 2.07 5.0 5.0 0.48768 2.36
0.1565 10.0 0.61281 1.40 0.3125 10.0 0.62666 1.39 0.625 10.0 0.59069 1.54 1.25 10.0 0.63911 1.50 2.5 10.0 0.62626 1.75 5.0 10.0 0.69454 1.77

143
Supplementary table 8. CI of vemurafenib (VEM) and metformin (MET) in HT29
VEM (µM) MET Effect CI 0.00775 0.625 0.08410 0.22357 0.0155 0.625 0.11584 0.29471 0.031 0.625 0.18937 0.41582 0.062 0.625 0.34926 0.60948 0.124 0.625 0.39064 1.09996 0.248 0.625 0.51469 1.90565
0.00775 1.25 0.05157 0.40257 0.0155 1.25 0.20119 0.34405 0.031 1.25 0.18864 0.51169 0.062 1.25 0.30976 0.71340 0.124 1.25 0.42971 1.12861 0.248 1.25 0.54107 1.92094
0.00775 2.5 0.12484 0.52979 0.0155 2.5 0.23666 0.50135 0.031 2.5 0.32204 0.58397 0.062 2.5 0.40377 0.78716 0.124 2.5 0.48307 1.20158 0.248 2.5 0.59613 1.93811
0.00775 5.0 0.24987 0.76086 0.0155 5.0 0.30921 0.76865 0.031 5.0 0.38270 0.83123 0.062 5.0 0.48409 0.98005 0.124 5.0 0.52456 1.39727 0.248 5.0 0.65038 2.04627
0.00775 10.0 0.40462 1.17715 0.0155 10.0 0.45752 1.16633 0.031 10.0 0.49979 1.22793 0.062 10.0 0.56300 1.36476 0.124 10.0 0.63354 1.67552 0.248 10.0 0.71699 2.28235
0.00775 20.0 0.69129 1.61766 0.0155 20.0 0.70492 1.63571 0.031 20.0 0.73308 1.6647 0.062 20.0 0.74518 1.82002 0.124 20.0 0.79068 2.04457 0.248 20.0 0.84160 2.51547

144
Supplementary table 9. CI of vemurafenib (VEM) and metformin (MET) in RKO
VEM (µM) MET Effect CI 0.46875 0.625 0.41893 0.57519 0.9375 0.625 0.48005 0.59736 1.875 0.625 0.43184 1.26809 3.75 0.625 0.51202 1.41167 7.5 0.625 0.61877 1.39345 15.0 0.625 0.95259 0.06829
0.46875 1.25 0.34719 1.31258 0.9375 1.25 0.41480 1.17664 1.875 1.25 0.37563 2.15231 3.75 1.25 0.45555 2.21457 7.5 1.25 0.61605 1.53534 15.0 1.25 0.94402 0.09498
0.46875 2.5 0.63387 0.50475 0.9375 2.5 0.66130 0.49529 1.875 2.5 0.71810 0.43529 3.75 2.5 0.75384 0.46746 7.5 2.5 0.82736 0.38528 15.0 2.5 0.99999 9.85E-7
0.46875 5.0 0.68793 0.69633 0.9375 5.0 0.68875 0.74359 1.875 5.0 0.71502 0.72004 3.75 5.0 0.83131 0.36846 7.5 5.0 0.87812 0.29635 15.0 5.0 0.91392 0.25703
0.46875 10.0 0.83887 0.47127 0.9375 10.0 0.84904 0.44179 1.875 10.0 0.88255 0.32664 3.75 10.0 0.90723 0.25857 7.5 10.0 0.95114 0.12566 15.0 10.0 0.99891 0.00110
0.46875 20.0 0.90615 0.43901 0.9375 20.0 0.91736 0.37542 1.875 20.0 0.91584 0.39424 3.75 20.0 0.95765 0.16806 7.5 20.0 0.94714 0.24234 15.0 20.0 0.97748 0.09058

145
Supplementary table 10. CI of vemurafenib (VEM) and metformin (MET) in NCI-H508
VEM (µM) MET Effect CI 0.625 0.3125 0.22475 2.62875 1.25 0.3125 0.13503 8.32378 2.5 0.3125 0.25716 2.07034 5.0 0.3125 0.21873 3.24244 10.0 0.3125 0.59140 0.59297 20.0 0.3125 0.86567 0.47039 0.625 0.625 0.25416 3.85292 1.25 0.625 0.23645 4.65866 2.5 0.625 0.01504 1256.53 5.0 0.625 0.17763 9.46419 10.0 0.625 0.36691 2.12244 20.0 0.625 0.73167 0.77016 0.625 1.25 0.41558 1.96152 1.25 1.25 0.59316 0.56032 2.5 1.25 0.49434 1.19979 5.0 1.25 0.51622 1.16856 10.0 1.25 0.49802 1.58693 20.0 1.25 0.77412 0.72361 0.625 2.5 0.76688 0.23948 1.25 2.5 0.73987 0.33069 2.5 2.5 0.71295 0.46175 5.0 2.5 0.61772 1.05014 10.0 2.5 0.59657 1.43945 20.0 2.5 0.79149 0.76092 0.625 5.0 0.68764 0.95440 1.25 5.0 0.71096 0.80168 2.5 5.0 0.65018 1.38014 5.0 5.0 0.56273 2.78266 10.0 5.0 0.60023 2.35962 20.0 5.0 0.73742 1.2731 0.625 10.0 0.61642 3.37811 1.25 10.0 0.59286 4.08566 2.5 10.0 0.53161 6.54596 5.0 10.0 0.59472 4.20161 10.0 10.0 0.58914 4.61295 20.0 10.0 0.78729 1.30486

146
Supplementary table 11. CI of panitumumab (PAN) and metformin (MET) in NCI-H508
PAN (nM) MET Effect CI 0.01071 0.3125 0.03958 3.29196 0.02143 0.3125 0.06185 3.51799 0.04285 0.3125 0.21925 1.10097 0.08571 0.3125 0.36566 0.85992 0.17141 0.3125 0.52316 0.73658 0.34283 0.3125 0.61458 0.88023 0.01071 0.625 0.18798 0.52511 0.02143 0.625 0.25892 0.55687 0.04285 0.625 0.27747 0.84143 0.08571 0.625 0.37114 0.91328 0.17141 0.625 0.44314 1.1665 0.34283 0.625 0.56037 1.22781 0.01071 1.25 0.25277 0.55913 0.02143 1.25 0.25857 0.7375 0.04285 1.25 0.31366 0.86377 0.08571 1.25 0.28728 1.59603 0.17141 1.25 0.40372 1.5647 0.34283 1.25 0.52849 1.56551 0.01071 2.5 0.29897 0.82498 0.02143 2.5 0.38253 0.79118 0.04285 2.5 0.27351 1.38762 0.08571 2.5 0.37862 1.34297 0.17141 2.5 0.43877 1.62288 0.34283 2.5 0.56816 1.55569 0.01071 5.0 0.32081 1.44885 0.02143 5.0 0.34892 1.49183 0.04285 5.0 0.36905 1.62982 0.08571 5.0 0.46410 1.57662 0.17141 5.0 0.54067 1.63998 0.34283 5.0 0.60301 1.83376 0.01071 10.0 0.59040 1.97411 0.02143 10.0 0.62138 1.92595 0.04285 10.0 0.64644 1.90733 0.08571 10.0 0.71220 1.7912 0.17141 10.0 0.68805 1.99798 0.34283 10.0 0.81715 1.63635

147
Supplementary table 12. CI of dasatinib (DAS) and metformin (MET) in HT29
DAS (nM) MET (mM) Effect CI
0.76 0.625 0.17735 1.04 1.52 0.625 0.18933 1 3.05 0.625 0.24009 0.81628 6.1 0.625 0.16803 1.76 12.2 0.625 0.21675 1.89 24.4 0.625 0.33370 2.23 0.76 1.25 0.36713 0.45598 1.52 1.25 0.37823 0.48317 3.05 1.25 0.38080 0.59066 6.1 1.25 0.34141 0.96293 12.2 1.25 0.41218 1.16 24.4 1.25 0.49408 1.69 0.76 2.5 0.37250 0.82488 1.52 2.5 0.39520 0.77024 3.05 2.5 0.42527 0.75353 6.1 2.5 0.22607 2.96 12.2 2.5 0.45283 1.26 24.4 2.5 0.50521 1.82 0.76 5.0 0.47017 0.86248 1.52 5.0 0.49743 0.77860 3.05 5.0 0.50379 0.84429 6.1 5.0 0.46872 1.22 12.2 5.0 0.55005 1.18 24.4 5.0 0.66557 1.37 0.76 10.0 0.48286 1.55 1.52 10.0 0.52052 1.27 3.05 10.0 0.53566 1.25 6.1 10.0 0.52281 1.53 12.2 10.0 0.57962 1.47 24.4 10.0 0.67279 1.56 0.76 20.0 0.66235 0.96566 1.52 20.0 0.68987 0.83052 3.05 20.0 0.68963 0.90046 6.1 20.0 0.70961 0.92048 12.2 20.0 0.72169 1.11 24.4 20.0 0.79719 1.18

148
Supplementary table 13. CI of dasatinib (DAS) and metformin (MET) in RKO
DAS (µM) MET Effect CI
0.78 0.625 0.36741 0.66116 1.56 0.625 0.36873 1.14 3.12 0.625 0.37623 1.97 6.25 0.625 0.59943 0.43827 12.5 0.625 0.67605 0.37057 25.0 0.625 0.99999 3.90E-6 0.78 1.25 0.25265 2.47 1.56 1.25 0.30780 2.37 3.12 1.25 0.34580 2.88 6.25 1.25 0.43518 2.21 12.5 1.25 0.73648 0.23316 25.0 1.25 0.9999 5.94E-5 0.78 2.5 0.38235 1.03 1.56 2.5 0.38841 1.39 3.12 2.5 0.51404 0.82131 6.25 2.5 0.59735 0.65865 12.5 2.5 0.76000 0.25588 25.0 2.5 0.999 9.05E-4 0.78 5.0 0.45957 1.11 1.56 5.0 0.51047 0.99901 3.12 5.0 0.58314 0.81252 6.25 5.0 0.65576 0.65323 12.5 5.0 0.82186 0.25068 25.0 5.0 0.98748 0.01705 0.78 10.0 0.51629 1.61 1.56 10.0 0.64366 1 3.12 10.0 0.56934 1.5 6.25 10.0 0.70615 0.84953 12.5 10.0 0.78520 0.58729 25.0 10.0 0.90419 0.23508 0.78 20.0 0.63820 1.97 1.56 20.0 0.68249 1.66 3.12 20.0 0.69429 1.61 6.25 20.0 0.81692 0.87869 12.5 20.0 0.86543 0.63823 25.0 20.0 0.9999 9.50E-4

149
Supplementary table 14. CI of regorafenib (REG) and metformin (MET) in HT29
REG (µM) MET Effect CI
0.0976 0.625 0.19536 2.08 0.195 0.625 0.20173 2.01 0.39 0.625 0.24625 1.43 0.78 0.625 0.24933 1.62 1.56 0.625 0.42127 0.96768 3.12 0.625 0.56860 1.17
0.0976 1.25 0.37682 0.86633 0.195 1.25 0.32079 1.36 0.39 1.25 0.31438 1.53 0.78 1.25 0.32493 1.61 1.56 1.25 0.37799 1.53 3.12 1.25 0.59242 1.20
0.0976 2.5 0.37196 1.74 0.195 2.5 0.35990 1.95 0.39 2.5 0.28355 3.65 0.78 2.5 0.35251 2.34 1.56 2.5 0.36945 2.46 3.12 2.5 0.55516 1.55
0.0976 5.0 0.45474 1.91 0.195 5.0 0.46038 1.87 0.39 5.0 0.44966 2.10 0.78 5.0 0.47495 1.93 1.56 5.0 0.46730 2.33 3.12 5.0 0.60431 1.66
0.0976 10.0 0.55684 1.86 0.195 10.0 0.56316 1.81 0.39 10.0 0.56316 1.88 0.78 10.0 0.57351 1.89 1.56 10.0 0.63125 1.55 3.12 10.0 0.69462 1.52
0.0976 20.0 0.73660 0.92910 0.195 20.0 0.73188 0.99371 0.39 20.0 0.76577 0.78269 0.78 20.0 0.75290 0.97277 1.56 20.0 0.79241 0.88217 3.12 20.0 0.83850 0.94254

150
Supplementary table 15. CI of regorafenib (REG) and metformin (MET) in RKO
REG (µM) MET Effect CI
0.195 0.625 0.19052 0.59543 0.39 0.625 0.15836 0.99607 0.78 0.625 0.41852 0.49227 1.56 0.625 0.49489 0.65820 3.12 0.625 0.73191 0.52018 6.25 0.625 0.9999 0.00116 0.195 1.25 0.30707 0.54803 0.39 1.25 0.31679 0.65531 0.78 1.25 0.31266 0.92855 1.56 1.25 0.56003 0.60744 3.12 1.25 0.51253 1.24 6.25 1.25 0.74911 0.96741 0.195 2.5 0.37286 0.73753 0.39 2.5 0.42951 0.68235 0.78 2.5 0.53679 0.58577 1.56 2.5 0.66108 0.52950 3.12 2.5 0.54246 1.29 6.25 2.5 0.91709 0.34859 0.195 5.0 0.51356 0.81198 0.39 5.0 0.45137 1.1 0.78 5.0 0.37193 1.69 1.56 5.0 0.61995 0.86780 3.12 5.0 0.74396 0.75174 6.25 5.0 0.87308 0.58466 0.195 10.0 0.57473 1.24 0.39 10.0 0.64475 0.99170 0.78 10.0 0.70957 0.82252 1.56 10.0 0.75928 0.75999 3.12 10.0 0.82909 0.66801 6.25 10.0 0.86342 0.77210 0.195 20.0 0.78763 0.96501 0.39 20.0 0.74501 1.22 0.78 20.0 0.76885 1.14 1.56 20.0 0.76905 1.24 3.12 20.0 0.79085 1.29 6.25 20.0 0.89738 0.79878

151
Supplementary table 16. CI of regorafenib (REG) and metformin (MET) in NCI-H508
REG (µM) MET Effect CI
0.78 0.3125 0.16102 0.83768 1.56 0.3125 0.18448 1.39 3.12 0.3125 0.28676 1.56 6.25 0.3125 0.36335 2.20 12.5 0.3125 0.56444 1.93 25.0 0.3125 0.98210 0.09484 0.78 0.625 0.28842 0.42759 1.56 0.625 0.19152 1.36 3.12 0.625 0.23296 2.09 6.25 0.625 0.31177 2.78 12.5 0.625 0.50957 2.42 25.0 0.625 0.86981 0.76305 0.78 1.25 0.26515 0.52318 1.56 1.25 0.42261 0.49617 3.12 1.25 0.31699 1.42 6.25 1.25 0.35417 2.34 12.5 1.25 0.66917 1.28 25.0 1.25 0.97280 0.15695 0.78 2.5 0.22856 0.72369 1.56 2.5 0.35938 0.71172 3.12 2.5 0.41425 1.02 6.25 2.5 0.44233 1.70 12.5 2.5 0.51806 2.44 25.0 2.5 0.99265 0.05809 0.78 5.0 0.34739 0.61387 1.56 5.0 0.42932 0.69668 3.12 5.0 0.52666 0.80438 6.25 5.0 0.59208 1.08 12.5 5.0 0.62803 1.68 25.0 5.0 0.91884 0.54579 0.78 10.0 0.58685 0.55841 1.56 10.0 0.62694 0.60709 3.12 10.0 0.60537 0.84187 6.25 10.0 0.70180 0.90249 12.5 10.0 0.78027 1.02 25.0 10.0 0.9999 0.01775

152
Supplementary table 17. CI of metformin (MET) and trametinib (TRA) in RKO
MET (mM) TRA (nM) Effect CI 0.625 2.0 0.24210 2.72152406 1.25 2.0 0.34713 1.03152596 2.5 2.0 0.47174 0.59930 5.0 2.0 0.55458 0.63599 10.0 2.0 0.71681 0.43285 20.0 2.0 0.64300 1.39152916 0.625 4.0 0.33743 1.49152145 1.25 4.0 0.46960 0.50611 2.5 4.0 0.51410 0.53260 5.0 4.0 0.60225 0.50321 10.0 4.0 0.91032 0.05936 20.0 4.0 100152000 3.5E-10 0.625 8.0 0.42636 1.02152311 1.25 8.0 0.48238 0.68799 2.5 8.0 0.60236 0.34373 5.0 8.0 0.76069 0.16988 10.0 8.0 0.86936 0.10970 20.0 8.0 0.97170 0.02089 0.625 16.0 0.53030 0.63604 1.25 16.0 0.61106 0.32742 2.5 16.0 0.68025 0.23292 5.0 16.0 0.88048 0.04974 10.0 16.0 0.91001 0.06068 20.0 16.0 0.96988 0.02292 0.625 32.0 0.60790 0.51529 1.25 32.0 0.69671 0.21775 2.5 32.0 0.68529 0.31326 5.0 32.0 0.73851 0.27082 10.0 32.0 0.77601 0.32286 20.0 32.0 0.84216 0.31008 0.625 64.0 0.49855 3.23152353 1.25 64.0 0.62810 0.82466 2.5 64.0 0.51672 2.92152760 5.0 64.0 0.86104 0.08004 10.0 64.0 0.91223 0.06202 20.0 64.0 0.95836 0.03741

153
Supplementary table 18. CI of metformin (MET) and trametinib (TRA) in HT29
MET (mM) TRA (nM) Effect CI 0.625 0.03125 0.41507 0.80448 1.25 0.03125 0.52401 0.53584 2.5 0.03125 0.57145 0.64205 5.0 0.03125 0.57090 1.24153662 10.0 0.03125 0.61752 1.51153799 20.0 0.03125 0.71779 0.97323 0.625 0.0625 0.44215 0.69274 1.25 0.0625 0.49612 0.75593 2.5 0.0625 0.55138 0.82868 5.0 0.0625 0.55843 1.45153817 10.0 0.0625 0.63689 1.27153227 20.0 0.0625 0.76038 0.58516 0.625 0.125 0.43324 0.89727 1.25 0.125 0.49221 0.90188 2.5 0.125 0.49490 1.52153862 5.0 0.125 0.51207 2.39153871 10.0 0.125 0.59746 1.98153893 20.0 0.125 0.71808 1.04153345 0.625 0.25 0.47761 0.88563 1.25 0.25 0.49999 1.07153622 2.5 0.25 0.53262 1.29153554 5.0 0.25 0.57217 1.54153051 10.0 0.25 0.62977 1.58153328 20.0 0.25 0.75232 0.77529 0.625 0.5 0.61798 0.68677 1.25 0.5 0.64310 0.67941 2.5 0.5 0.67272 0.67984 5.0 0.5 0.72337 0.60454 10.0 0.5 0.77905 0.50090 20.0 0.5 0.84648 0.33030 0.625 1.0 0.63518 1.18153862 1.25 1.0 0.61774 1.37153510 2.5 1.0 0.65044 1.30153581 5.0 1.0 0.69646 1.17153092 10.0 1.0 0.76280 0.89800 20.0 1.0 0.89004 0.32497

154
Supplementary table 19. CI of metformin (MET) and trametinib (TRA) in NCI-H508
MET (mM) TRA (nM) Effect CI 0.3125 0.0625 0.04260 9.35154192 0.625 0.0625 0.22093 0.30234 1.25 0.0625 0.14097 1.12154756 2.5 0.0625 0.40646 0.37297 5.0 0.0625 0.30580 1.19154793 10.0 0.0625 0.58227 0.68411
0.3125 0.125 0.02378 8.39154222 0.625 0.125 0.04440 1.68154014 1.25 0.125 0.12378 1.82154050 2.5 0.125 0.18880 1.39154003 5.0 0.125 0.53749 0.41850 10.0 0.125 0.79147 0.23306
0.3125 0.25 0.21125 0.43317 0.625 0.25 0.27354 0.30013 1.25 0.25 0.28934 0.42289 2.5 0.25 0.37957 0.44887 5.0 0.25 0.48944 0.52146 10.0 0.25 0.75697 0.28849
0.3125 0.5 0.26436 0.37632 0.625 0.5 0.27588 0.41633 1.25 0.5 0.31201 0.44000 2.5 0.5 0.37876 0.48638 5.0 0.5 0.46674 0.59062 10.0 0.5 0.69549 0.40413
0.3125 1.0 0.37835 0.19518 0.625 1.0 0.30553 0.48253 1.25 1.0 0.40109 0.29910 2.5 1.0 0.44844 0.37175 5.0 1.0 0.55915 0.39889 10.0 1.0 0.72695 0.34388
0.3125 2.0 0.15152 7.31154300 0.625 2.0 0.20735 2.87154569 1.25 2.0 0.15761 7.03154876 2.5 2.0 0.27059 1.75154582 5.0 2.0 0.55628 0.42584 10.0 2.0 0.72134 0.35777

155
CI Sinergy
< 0.1 very strong synergy
0.1-0.3 strong synergy
0.3-0.7 moderate synergy
0.7-0.85 slight synergy
0.85-1 additivity > 1 antagonism