Analysis of the 2004 Presidential Election Exit Poll … · No matter how one calculates it, the...
30
ElectionArchive.org Page 1 4/12/05 US Count Votes' National Election Data Archive Project Analysis of the 2004 Presidential Election Exit Poll Discrepancies http://electionarchive.org/ucvAnalysis/US/Exit_Polls_2004_Mitofsky-Edison.pdf Response to the Edison/Mitofsky Election System 2004 Report http://exit-poll.net/election-night/EvaluationJan192005.pdf March 31, 2005 Updated April 12, 2005 Authors and Endorsers Ron Baiman, Ph.D. Institute of Government and Public Affairs, University of Illinois at Chicago Kathy Dopp, MS mathematics, USCountVotes, President Steven F. Freeman, Ph.D. Visiting Scholar & Affiliated Faculty, Center for Organizational Dynamics, University of Pennsylvania Brian Joiner, Ph.D. Professor of Statistics and Director of Statistical Consulting (ret), University of Wisconsin Victoria Lovegren, Ph.D. Lecturer, Department of Mathematics, Case Western Reserve University Josh Mitteldorf, Ph.D. Temple University Statistics Department Campbell B. Read, Ph.D. Professor Emeritus, Department of Statistical Science, Southern Methodist University Richard G. Sheehan, Ph.D. Professor, Department of Finance, University of Notre Dame Jonathan Simon, J.D. Alliance for Democracy Frank Stenger, Ph.D. Professor of Numerical Analysis, School of Computing, University of Utah Paul F. Velleman, Ph.D. Associate Professor, Department of Statistical Sciences, Cornell University Bruce O'Dell, USCountVotes, Vice President This report has been reviewed via USCountVotes’ email discussion list for statisticians, mathematicians and pollsters. Press Contact: Kathy Dopp, USCountVotes, President [email protected]
Transcript of Analysis of the 2004 Presidential Election Exit Poll … · No matter how one calculates it, the...
ElectionArchive.org Page 1 4/12/05
US Count Votes'
National Election Data Archive Project
Analysis of the 2004 Presidential Election Exit
Poll Discrepancies
http://electionarchive.org/ucvAnalysis/US/Exit_Polls_2004_Mitofsky-Edison.pdf
Response to the Edison/Mitofsky Election System 2004 Report http://exit-poll.net/election-night/EvaluationJan192005.pdf
March 31, 2005
Updated April 12, 2005
Authors and Endorsers
Ron Baiman, Ph.D. Institute of Government and Public Affairs, University of Illinois at Chicago
Kathy Dopp, MS mathematics, USCountVotes, President Steven F. Freeman, Ph.D. Visiting Scholar & Affiliated Faculty, Center for Organizational Dynamics,
University of Pennsylvania
Brian Joiner, Ph.D. Professor of Statistics and Director of Statistical Consulting (ret), University of Wisconsin Victoria Lovegren, Ph.D. Lecturer, Department of Mathematics, Case Western Reserve University
Josh Mitteldorf, Ph.D. Temple University Statistics Department
Campbell B. Read, Ph.D. Professor Emeritus, Department of Statistical Science, Southern Methodist
University
Richard G. Sheehan, Ph.D. Professor, Department of Finance, University of Notre Dame
Jonathan Simon, J.D. Alliance for Democracy
Frank Stenger, Ph.D. Professor of Numerical Analysis, School of Computing, University of Utah
Paul F. Velleman, Ph.D. Associate Professor, Department of Statistical Sciences, Cornell University
Bruce O'Dell, USCountVotes, Vice President
This report has been reviewed via USCountVotes’ email discussion list for statisticians, mathematicians and
pollsters.
Press Contact: Kathy Dopp, USCountVotes, President [email protected]

ElectionArchive.org Page 2 4/12/05
Table of Contents
Introduction...................................................................................................................4
Importance of Exit Polls ...................................................................................................................... 4
Background ...................................................................................................................4
ANALYSIS ....................................................................................................................6
I. Explanation #One - Random Error.........................................................................6
II. Explanation #Two - Exit Poll Error.......................................................................7
A. Exit Poll Science .......................................................................................................................... 7
B. Exit Poll Discrepancies Rise with Concentration of Bush Voters............................................... 9
C. Implausible Exit Poll Participation Patterns Are Needed to Satisfy E/M's data........................ 11
Implausible Patterns of Exit Poll Participation as a Proportion of Those Asked to Take the Polls
Are Needed to Satisfy E/M's data. ................................................................................................. 13
Very Implausible Patterns of Exit Poll Participation Are Required to Satisfy E/M's data in 80-
100% Bush Precincts. .................................................................................................................... 14
Even When Using Assumptions that Minimize the Differences between Bush and Kerry
Response Rates, Participation Patterns Remain Implausible......................................................... 15
D. The Same Exit Polls More Accurately Projected the Senate Races .......................................... 16
E. Other Possible Reasons for Exit Poll Bias................................................................................. 17
III. Explanation #Three - Inaccurate Election Results ...........................................18
IV. Misleading Use of Adjusted Exit Poll Data........................................................19
Summary......................................................................................................................22
Appendix A: Voter Response Rate Calculations .....................................................23
Appendix B: WPE and Differential Partisan Response..........................................26
Appendix C: Jonathan Simon Exit Poll Data .........................................................28
Appendix D: Calculation of National Exit Sample Odds........................................30
ElectionArchive.org Page 3 4/12/05
Abstract
What is the Main Cause of the Discrepancies between the Official Election Results and the Exit
Polls?
The exit pollster of record for the 2004 election was the Edison/Mitofsky1 consortium. Their national
poll results projected a Kerry victory by 3.0%, whereas the official count had Bush winning by 2.5%.2
Several methods have been used to estimate the probability that the national exit poll results would be as different as they were from the national popular vote by random chance. These estimates range from 1 in 16.5 million to 1 in 1,240
3. No matter how one calculates it, the discrepancy cannot be attributed to
chance.
Edison/Mitofsky disavowed the results of their own poll, saying that the data cannot be construed as evidence that the official vote count was corrupted, and hypothesized that Kerry voters were more amenable to completing the poll questionnaire than Bush voters.
However, Edison/Mitofsky's own exit poll data does not support their theory that a higher exit poll response rate by Kerry voters accounted for the discrepancies between the exit polls and the presidential election results. Using Edison/Mitofsky’s data tables we demonstrate that the “reluctant Bush responder” hypothesis is implausible because it is inconsistent with the combination of high response rates and high discrepancy rates among the precincts with the highest percentage for Bush.
There are Three Primary Explanations for the Discrepancies:
1. Statistical Sampling Error – or Chance
We agree with Edison/Mitofsky that the first possible cause, random statistical sampling error, can be
ruled out.
2. Inaccurate Exit Polls
This is the theory that Edison/Mitofsky put forth. They hypothesize that the reason the exit polls were so
biased towards Kerry was because Bush voters were more reluctant to respond to exit polls than Kerry
voters. Edison/Mitofsky did not come close to justifying this position, however, even though they have
access to the raw, unadjusted, precinct-specific data set. The data that Edison/Mitofsky did offer in their
report show how implausible this theory is.
3. Inaccurate Election Results
Edison/Mitofsky did not even consider this hypothesis, and thus made no effort to contradict it. Some of
Edison/Mitofsky's exit poll data may be construed as affirmative evidence for inaccurate election
results. We conclude that the hypothesis that the voters’ intent was not accurately recorded or counted
cannot be ruled out and needs further investigation.
1 Edison Media Research and Mitofsky International
2 p. 20 "Evaluation of Edison/Mitofsky Election System 2004 report by Edison/Mitofsky Jan. 19, 2005
3 See Appendix D for the 1 in 16.5 million calculation based on Edison/Mitofsky "Methods Statement - National Election
Pool Exit Polls". The probability 1 in 959,000 in the affadavit in Bill Moss vs. George Bush et al. OH Case by Ron
Baiman, Ph.D. Economics http://uscountvotes.net/docs_pdf/analysis/OH/Affidavit_04-21_ver2.pdf was based on the
sample size for the nationwide poll (state polls are different) given by Edison/Mitofsky on election night. The probability
was later revised to 1 in 455,600 based on a new sample size of 12,219 given by Edison/Mitofsky with a "clustering
adjustment" of 1.3. Even using the most conservative value of 80% to factor for design effect - an estimate of the additional
variance that would have been missed by clustered sampling as opposed to random sampling, the probability of this much
discrepancy in the national poll is calculated as 1 in 1,240.
ElectionArchive.org Page 4 4/12/05
Introduction After last November’s presidential election, there were thousands of reports of irregularities. Reported problems
4 included:
• voting machine shortages
• ballots counted and recounted in secret
• lost, discarded, and improperly rejected registration forms and absentee ballots
• touch-screen machines that registered “Bush” when voters pressed “Kerry”
• precincts in which there were more votes recorded than registered voters
• precincts in which the reported participation rate was less than 10%
• high rates of “spoiled” ballots and under-votes in which no choice for president was recorded
• a sworn affidavit by a Florida computer programmer who claims he was hired to develop a voting program with a “back door” mechanism to undetectably alter vote tallies
These problems arose in the context of vote recording and counting systems developed, provided, and maintained primarily by a handful of private vendors with partisan ties, and where nonauditable voting equipment which cannot provide assurance that votes are counted as cast, tallied about 30% of the national vote
5. The crucial question is whether these problems were part of a larger pattern. Were these
issues collectively of sufficient magnitude to reverse the outcome of the election, or were they isolated incidents, procedurally disturbing but of little overall consequence?
Importance of Exit Polls
Under such circumstances we must rely on indirect evidence - such as exit polls, or analysis of election result data - as a check of the overall integrity of the official election results. Without auditability or transparency in our election systems, the role of exit polls as a trigger for further scrutiny is of paramount importance.
Background
The 2004 exit polls were conducted by Edison Media Research and Mitofsky International (Edison/Mitofsky, or E/M) on contract with major national press and TV news services, operating collectively as the National Election Pool. Edison/Mitofsky conduct exit polls in every state plus a nationwide exit poll. Confidential exit poll data showing John Kerry ahead of George Bush in several key “battleground states” was disclosed to the general public on the afternoon of November 2. Immediately following the election, the national exit polls showed that Kerry had won the popular
4 Reports were recorded by non-partisan organizations Vote Watch, Vote Protect, and Voters Unite:
www.votewatch.us voteprotect.org www.votersunite.org and by the U.S. House Committee on the
Judiciary, “Preserving Democracy: What Went Wrong in Ohio” (January 5, 2005) 5 Simon, J. and Baiman, R., “The 2004 presidential Election: Who Won The Popular Vote?
An Examination of the Comparative Validity of Exit Poll and Vote Count Data” , January 1, 2005, p. 5-6
http://freepress.org/images/departments/PopularVotePaper181_1.pdf
ElectionArchive.org Page 5 4/12/05
vote by a margin of 3.0%.6 However, by the morning of November 3
rd, the official vote counts showed
Bush defeating Kerry by 2.5% in the popular vote. This discrepancy between exit polls and the official election results has triggered a controversy which has yet to be resolved. Shortly after the exit poll disparity was noted, the Edison/Mitofsky group took the position that their own projections could not be taken as an indication of error in the official vote count. The theory they put forward to explain the disparity was that more of the Bush voters had declined to be interviewed for the exit polls, while more of the Kerry voters had completed the poll questionnaire.
7
Immediately after the election, those skeptical of Edison/Mitofsky’s explanation tried to obtain the precinct-level unadjusted exit poll data to independently test Edison/Mitofsky's explanation, but the raw data has not, to this day, been released. In the absence of raw data, analyses were done using “screen captures” of data published to the Internet on election night
8. One such analysis of unadjusted exit poll
data was done by Ron Baiman9. Baiman found that statistically significant discrepancies of exit poll
results from reported election outcomes were concentrated in five states, four of which were key battleground states. Is this merely a coincidence? How much of a coincidence was it? Baiman concluded that the probability that these discrepancies would simultaneously occur in just the most critical states of Ohio, Florida, and Pennsylvania (rather than in any other randomly selected group of three states), is less than 1/330,000. This analysis agrees with an earlier calculation by Steven Freeman showing that the probability that random chance accounted for simultaneous exit poll discrepancies in Florida, Pennsylvania and Ohio was well outside of the realm of statistical plausibility.
10
On January 19, 2005, Edison Media Research and Mitofsky International released a 77-page report
“Evaluation of Edison/Mitofsky Election System 2004". The Edison/Mitofsky report acknowledged
widespread discrepancies between their exit polls and official counts, admitted that the differences
were far greater than can be explained by sampling error, and asserted that this disparity was “most
likely due to Kerry voters participating in the exit polls at a higher rate than Bush voters” (p. 3).
6 p. 20,"Evaluation of Edison/Mitofsky Election System 2004" prepared by Edison Media Research and Mitofsky
International for the National Election Pool (NEP) Jan. 19, 2005 7 Election survey analysts ordinarily assume that official election results are the objective standard against which their own
findings must be weighed, and perhaps found wanting. Edison/Mitofsky’s willingness to find fault with their own methods
and results is consistent with professional norms and practices. 8 See Appendix B
9 Affidavit in Bill Moss vs. George Bush et al. Ohio Case by Ron Paul Baiman, Ph.D. Economics, posted at
http://electionarchive.org 10
Freeman, S.F., “The Unexplained Exit Poll Discrepancy" A Research Report from the University of Pennsylvania,
Graduate Division, School of Arts & Sciences, Center for Organizational Dynamics. December 29, 2004
http://center.grad.upenn.edu/center/get.cgi?item=exitpollp (originally published as a Working Paper on November 12,
2004).
ElectionArchive.org Page 6 4/12/05
Did Edison/Mitofsky's January 19th
report support their assertion that Bush voters were more reluctant
to participate in exit poll surveys than Kerry voters? Did their analysis confirm the “Reluctant Bush
Responder” hypothesis?
ANALYSIS
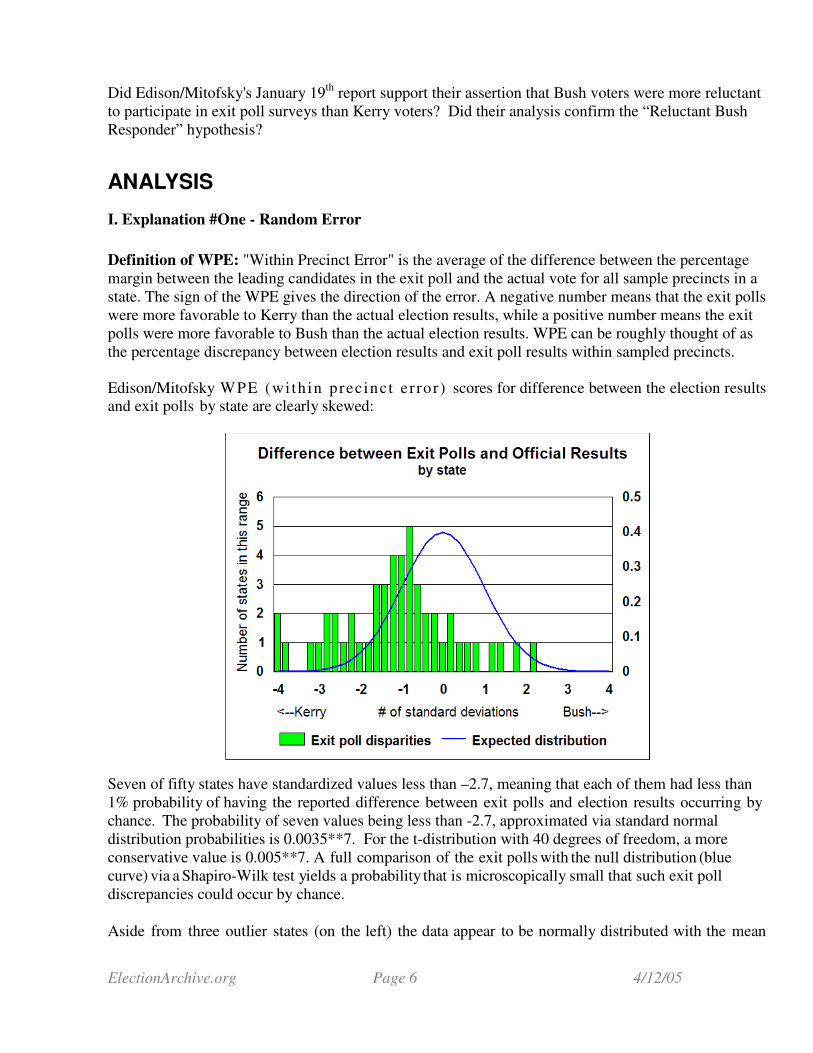
I. Explanation #One - Random Error
Definition of WPE: "Within Precinct Error" is the average of the difference between the percentage
margin between the leading candidates in the exit poll and the actual vote for all sample precincts in a
state. The sign of the WPE gives the direction of the error. A negative number means that the exit polls
were more favorable to Kerry than the actual election results, while a positive number means the exit
polls were more favorable to Bush than the actual election results. WPE can be roughly thought of as
the percentage discrepancy between election results and exit poll results within sampled precincts.
Edison/Mitofsky WPE (wi th in prec inct e r ror ) scores for difference between the election results and exit polls by state are clearly skewed:
Seven of fifty states have standardized values less than –2.7, meaning that each of them had less than
1% probability of having the reported difference between exit polls and election results occurring by
chance. The probability of seven values being less than -2.7, approximated via standard normal
distribution probabilities is 0.0035**7. For the t-distribution with 40 degrees of freedom, a more
conservative value is 0.005**7. A full comparison of the exit polls with the null distribution (blue
curve) via a Shapiro-Wilk test yields a probability that is microscopically small that such exit poll
discrepancies could occur by chance.
Aside from three outlier states (on the left) the data appear to be normally distributed with the mean

ElectionArchive.org Page 7 4/12/05
shifted 1.0 standard deviations toward Kerry. The data without these three passes the Shapiro-Wilk test for normality (p=.4), with a shifted mean.
We agree with Edison/Mitofsky, as stated in their report, that random chance as a possible explanation for discrepancies between exit polls and official election results can be dismissed.
Having eliminated random chance as a cause of the discrepancies between election and exit poll results,
two hypotheses remain to explore: Exit polls were subject to a consistent bias or the official vote
count was corrupted.
II. Explanation #Two - Exit Poll Error
A. Exit Poll Science
Exit polling is a well-developed science, informed by half a century of experience and continually improving methodology
11. Edison/Mitofsky samples voters for a nationwide exit poll as well as for
each state's exit poll. Best Practices Exit Poll Methodology involves three steps:
1. Choose a set of representative precincts that mirrors the state as a whole in demography and
historic voting patterns. ("out of precinct" sampling)
2. Randomly select and interview voters from those precincts for polling as they leave the polling
place. ("within precinct" sampling)
3. Algebraically weight to correct for the observed demographic composition of the sample. For
example, re-balance by race and gender in this process to assure a representative sampling of
the state.
Were the Right Precincts Sampled?
To confirm that steps number 1 and 3 were done correctly, official vote tallies from the sampled precincts were substituted by Edison/Mitofsky for exit poll results in their weighting formulas, to see if the results would correctly “predict” statewide voting patterns. This procedure (E/M pp. 28-30) confirms that steps number 1 and 3 worked well. The selected precincts accurately predicted the results in their respective states, with only a small observed bias (0.3%) which was actually in the opposite
direction to the bias that resulted when exit poll numbers were used. Were Voters Randomly Selected and Interviewed?
Problems with step number 2, improper selection of voters, can cause within-precinct error (WPE12
). Edison/Mitofsky seek to explain the overall disparity between exit polls and official election results in
11
Polling and presidential Election Coverage, Lavrakas, Paul J, and Holley, Jack K., eds., Newbury Park, CA: Sage; pp.
83-99.
12
See prior definition of WPE on p. 7 in this document.
ElectionArchive.org Page 8 4/12/05
terms of WPE. They calculate that the required shift toward Kerry in the exit polls must have been 6.5%. They note that this number is greater than any WPE from past presidential elections going back more than 20 years, to a time when polling science was less sophisticated and less reliable than at present. They also note that this 6.5% WPE stands out in comparison to an average 1.9% WPE from 2004 state primaries exit polls. Adjusting the Exit Polls using Reported Election Results The E/M report claims that all of the error is "within precinct error (WPE)" because using reported
precinct level election results with a "Sample Precinct Model" (SPM) gives close to reported results
(p. 28-30). But this does not necessarily follow because the SPM may use reported election results (p.
9), and may be adjusting the weights over time based on these reported results. This implies that
computations with these new weights may not be fully "unadjusted" predictive exit poll estimates.
To the extent that SPM adjustments are based on reported election results, exit poll discrepancies
derived from weights that "have not been adjusted" may be out of precinct. This leaves open the
possibility that “central office mis-tabulation”, and/or “discriminatory voter suppression”, that are not
taken into account when using precinct weights that are derived from past voter participation rates to
calculate state level exit poll results, could explain part of the discrepancy. Access to the raw precinct
level data and weights used to calculate final unadjusted state level exit polls, is necessary to
investigate this hypothesis.
The "Reluctant Bush Responder” (rBr) hypothesis
The E/M report, however, explains the WPE with the following statement (p. 31):
“While we cannot measure the response rate by Kerry and Bush voters, hypothetical response
rates of 56% among Kerry voters and 50% among Bush voters overall would account for the
entire Within Precinct Error that we observed in 2004.”
This, apparently, is the basis for their statement in the Executive Summary (p. 4), “It is difficult to pinpoint precisely the reasons that, in general, Kerry voters were more likely to participate in the exit polls than Bush voters.”
No data in the E/M report supports the hypothesis that Kerry voters were more likely than Bush voters
to cooperate with pollsters and, in fact, the data provided by E/M suggests that the opposite may have
been true.
ElectionArchive.org Page 9 4/12/05
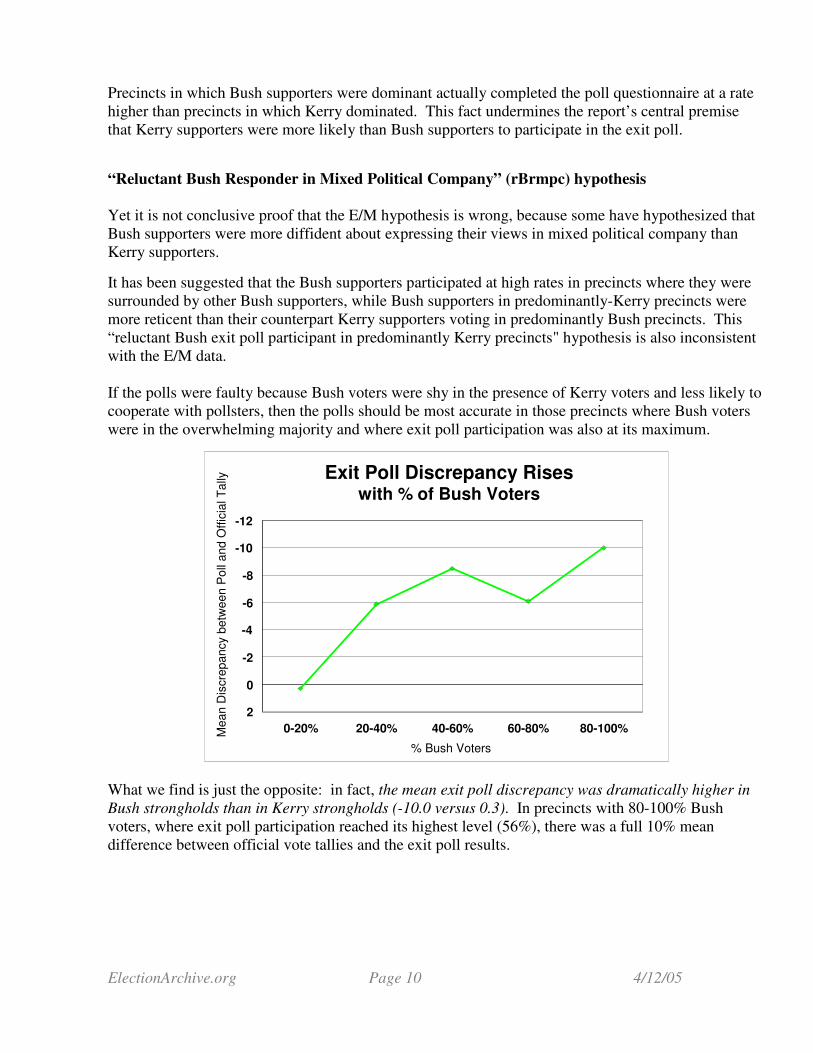
Table 1: Partisanship Precinct Data given in the Edison/Mitofsky Report (pp. 36, 37)
Partisanship of Precinct by Election Results
Number of
Precincts
mean WPE exit poll
discrepancy
median WPE
exit poll discrepancy
Combined Response
Rate
Refusal Rate
Miss Rate
80< Kerry <=100% 0< Bush <=20% 90 0.3% -0.4% 53% 35% 12%
60< Kerry <=80% 20< Bush <=40% 165 -5.9% -5.5% 55% 33% 12%
40< Kerry <=60% 40< Bush <=60% 540 -8.5% -8.3% 52% 37% 11%
20< Kerry <=40% 60< Bush <=80% 415 -6.1% -6.1% 55% 35% 10%
0< Kerry <=20% 80< Bush <=100% 40 -10.0% -5.8% 56% 33% 11%
The following analysis by US Count Votes is based on the data in the above Table 1 which is provided
in the Edison/Mitofsky report. We will use it to show that it is not plausible that the “Reluctant Bush
Responder” hypothesis explains the exit poll discrepancy in the November 2004 presidential election.
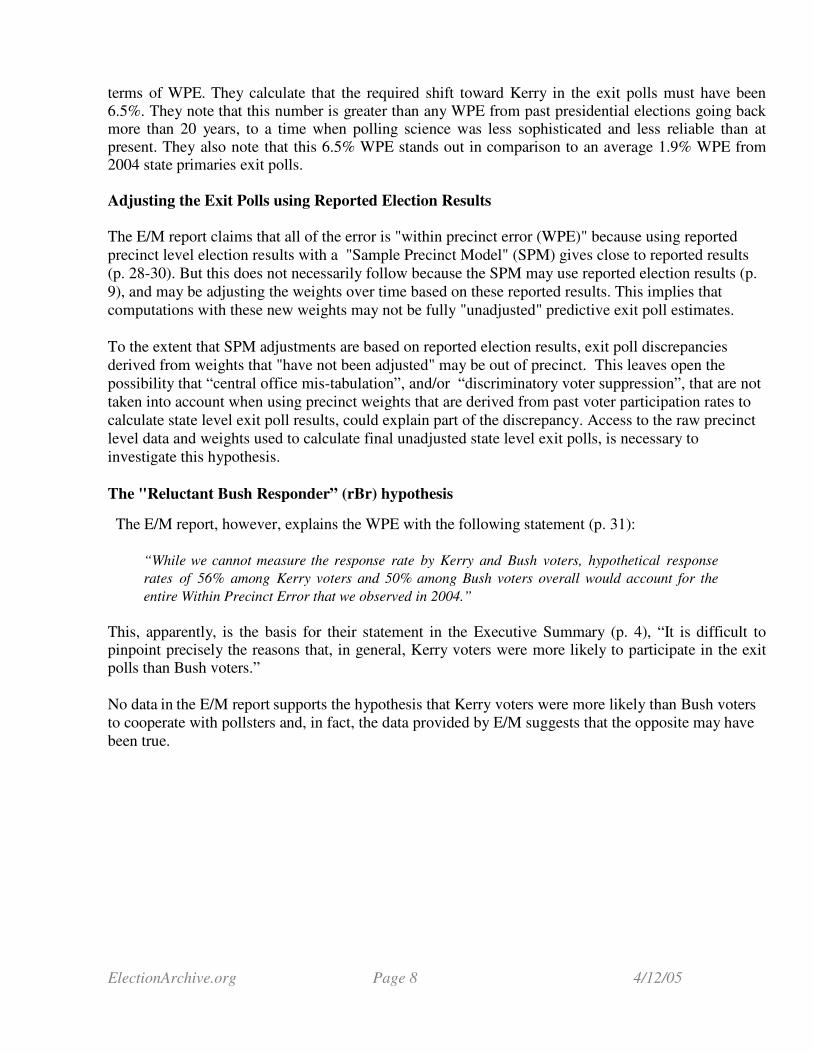
B. Exit Poll Discrepancies Rise with Concentration of Bush Voters
The reluctant Bush responder hypothesis would lead one to expect a higher non-response rate where
there are many more Bush voters, yet Edison/Mitofsky’s data shows that, in fact, the response rate is
slightly higher in precincts where Bush drew ≥80% of the vote (High Rep) than in those where Kerry
drew ≥80% of the vote (High Dem).
The chart above was constructed from data within the E/M report (p. 37). This data bears directly on the plausibility of the report’s central hypothesis, and it goes in the wrong direction. In precincts with higher numbers of Bush voters, response rates were slightly higher than in precincts with higher number of Kerry voters.
ElectionArchive.org Page 10 4/12/05
Precincts in which Bush supporters were dominant actually completed the poll questionnaire at a rate
higher than precincts in which Kerry dominated. This fact undermines the report’s central premise
that Kerry supporters were more likely than Bush supporters to participate in the exit poll.
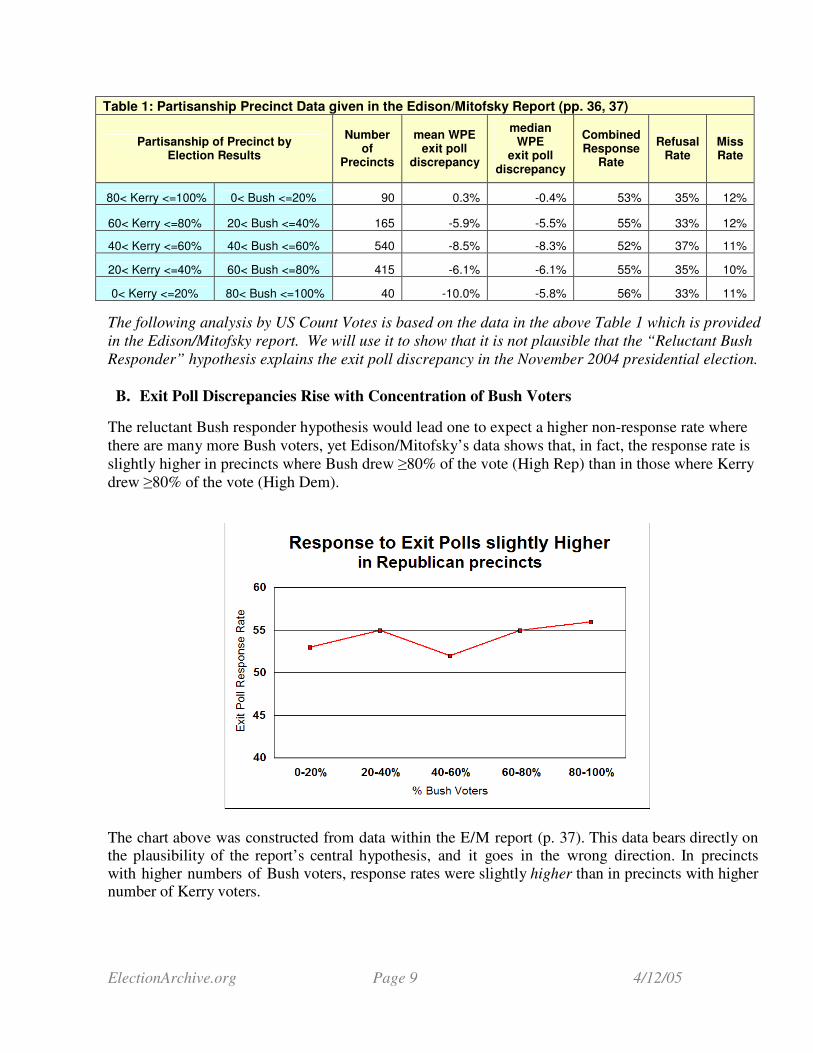
“Reluctant Bush Responder in Mixed Political Company” (rBrmpc) hypothesis
Yet it is not conclusive proof that the E/M hypothesis is wrong, because some have hypothesized that
Bush supporters were more diffident about expressing their views in mixed political company than
Kerry supporters.
It has been suggested that the Bush supporters participated at high rates in precincts where they were
surrounded by other Bush supporters, while Bush supporters in predominantly-Kerry precincts were
more reticent than their counterpart Kerry supporters voting in predominantly Bush precincts. This
“reluctant Bush exit poll participant in predominantly Kerry precincts" hypothesis is also inconsistent
with the E/M data.
If the polls were faulty because Bush voters were shy in the presence of Kerry voters and less likely to
cooperate with pollsters, then the polls should be most accurate in those precincts where Bush voters
were in the overwhelming majority and where exit poll participation was also at its maximum.
0-20% 20-40% 40-60% 60-80% 80-100%
% Bush Voters
-12
-10
-8
-6
-4
-2
0
2
Me
an
Dis
cre
pa
ncy b
etw
ee
n P
oll
an
d O
ffic
ial T
ally Exit Poll Discrepancy Rises
with % of Bush Voters
What we find is just the opposite: in fact, the mean exit poll discrepancy was dramatically higher in
Bush strongholds than in Kerry strongholds (-10.0 versus 0.3). In precincts with 80-100% Bush
voters, where exit poll participation reached its highest level (56%), there was a full 10% mean
difference between official vote tallies and the exit poll results.

ElectionArchive.org Page 11 4/12/05
Alternate hypothesis: “Bush Strongholds have more Vote-Count Corruption” (Bsvcc)
An alternative hypothesis that is more consistent with the data is that corruption of the official vote
count occurred most freely in districts that were overwhelmingly Bush strongholds.
If Edison/Mitofsky would release the detailed results of their poll to the public then much more could
be said about this hypothesis, and the suspicious precincts could be identified. If E/M does not release
its list of sampled precincts, US Count Votes believes it will still be possible to rigorously test the
hypothesis that the vote counts were corrupted by assembling and analyzing a precinct-level
nationwide database containing detailed election results, voting equipment information and
demographic data.
Higher exit poll response rates and higher exit poll discrepancies occurred in Bush strongholds.
E/M’s own data contradict both the rBr and the rBrmpc hypotheses and support the Bsvcc hypothesis.
C. Implausible Exit Poll Participation Patterns Are Needed to Satisfy E/M's data.
The Edison/Mitofsky Report states:
"Our investigation of the differences between the exit poll estimates and the actual vote count point
to one primary reason: in a number of precincts a higher than average Within Precinct Error
(WPE) most likely due to Kerry voters participating in the exit polls at a higher rate than Bush
voters.” (Page 3)
It is mathematically possible to construct a set of response patterns for Bush and Kerry voters while
faithfully reproducing all of Edison/Mitofsky’s “Partisanship Precinct Data” given in Table 1.
(Appendix A)
The following Table 2 shows the required calculated Bush and Kerry response rates if we assume 90%
Bush voters in 80 - 100% Bush precincts, 70% average Bush voters in 60-80% Bush precincts, and so
forth.
mean WPE Response
Rate Bush Kerry Bush Kerry
0< Bush <=20% 80< Kerry <=100% 0.3% 53% 10% 90% 53.8% 52.9%
20< Bush <=40% 60< Kerry <=80% -5.9% 55% 30% 70% 49.6% 57.3%
40< Bush <=60% 40< Kerry <=60% -8.5% 52% 50% 50% 47.6% 56.4%
60< Bush <=80% 20< Kerry <=40% -6.1% 55% 70% 30% 52.6% 60.6%
80< Bush <=100% 0< Kerry <=20% -10.0% 56% 90% 10% 52.9% 84.0%
Required
Response Rates
for entire sample
Table 2: Calculated Required Bush & Kerry Response Rates using
midpoints of precinct intervals as the assumed Bush/Kerry voter
percentages in partisan precincts.
Assumed %
of Kerry/Bush
voters in
partisan
precincts
Partisanship of Precinct based on Election
Results
The visual chart is below.
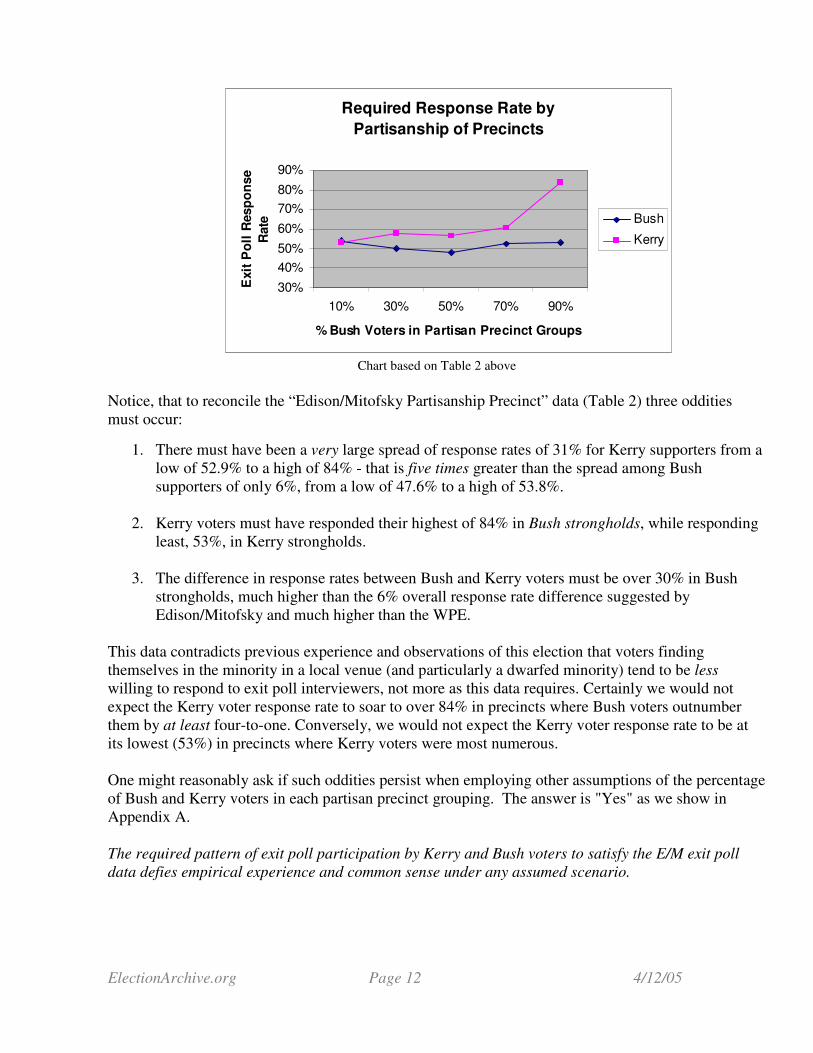
ElectionArchive.org Page 12 4/12/05
Required Response Rate by
Partisanship of Precincts
30%
40%
50%
60%
70%
80%
90%
10% 30% 50% 70% 90%
% Bush Voters in Partisan Precinct Groups
Exit
Po
ll R
esp
on
se
Rate Bush
Kerry
Chart based on Table 2 above
Notice, that to reconcile the “Edison/Mitofsky Partisanship Precinct” data (Table 2) three oddities
must occur:
1. There must have been a very large spread of response rates of 31% for Kerry supporters from a
low of 52.9% to a high of 84% - that is five times greater than the spread among Bush
supporters of only 6%, from a low of 47.6% to a high of 53.8%.
2. Kerry voters must have responded their highest of 84% in Bush strongholds, while responding
least, 53%, in Kerry strongholds.
3. The difference in response rates between Bush and Kerry voters must be over 30% in Bush
strongholds, much higher than the 6% overall response rate difference suggested by
Edison/Mitofsky and much higher than the WPE.
This data contradicts previous experience and observations of this election that voters finding
themselves in the minority in a local venue (and particularly a dwarfed minority) tend to be less
willing to respond to exit poll interviewers, not more as this data requires. Certainly we would not
expect the Kerry voter response rate to soar to over 84% in precincts where Bush voters outnumber
them by at least four-to-one. Conversely, we would not expect the Kerry voter response rate to be at
its lowest (53%) in precincts where Kerry voters were most numerous.
One might reasonably ask if such oddities persist when employing other assumptions of the percentage
of Bush and Kerry voters in each partisan precinct grouping. The answer is "Yes" as we show in
Appendix A.
The required pattern of exit poll participation by Kerry and Bush voters to satisfy the E/M exit poll
data defies empirical experience and common sense under any assumed scenario.
ElectionArchive.org Page 13 4/12/05
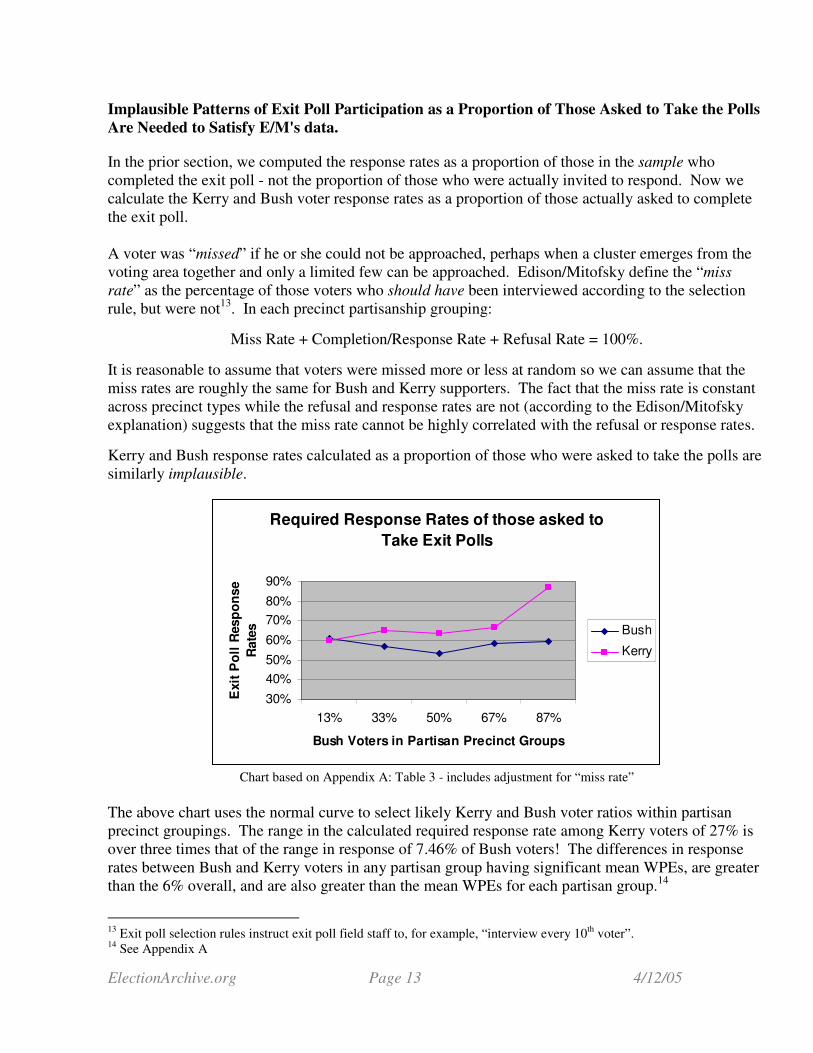
Implausible Patterns of Exit Poll Participation as a Proportion of Those Asked to Take the Polls
Are Needed to Satisfy E/M's data.
In the prior section, we computed the response rates as a proportion of those in the sample who
completed the exit poll - not the proportion of those who were actually invited to respond. Now we
calculate the Kerry and Bush voter response rates as a proportion of those actually asked to complete
the exit poll.
A voter was “missed” if he or she could not be approached, perhaps when a cluster emerges from the
voting area together and only a limited few can be approached. Edison/Mitofsky define the “miss
rate” as the percentage of those voters who should have been interviewed according to the selection
rule, but were not13
. In each precinct partisanship grouping:
Miss Rate + Completion/Response Rate + Refusal Rate = 100%.
It is reasonable to assume that voters were missed more or less at random so we can assume that the
miss rates are roughly the same for Bush and Kerry supporters. The fact that the miss rate is constant
across precinct types while the refusal and response rates are not (according to the Edison/Mitofsky
explanation) suggests that the miss rate cannot be highly correlated with the refusal or response rates.
Kerry and Bush response rates calculated as a proportion of those who were asked to take the polls are
similarly implausible.
Required Response Rates of those asked to
Take Exit Polls
30%
40%
50%
60%
70%
80%
90%
13% 33% 50% 67% 87%
Bush Voters in Partisan Precinct Groups
Exit
Po
ll R
esp
on
se
Rate
s Bush
Kerry
Chart based on Appendix A: Table 3 - includes adjustment for “miss rate”
The above chart uses the normal curve to select likely Kerry and Bush voter ratios within partisan
precinct groupings. The range in the calculated required response rate among Kerry voters of 27% is
over three times that of the range in response of 7.46% of Bush voters! The differences in response
rates between Bush and Kerry voters in any partisan group having significant mean WPEs, are greater
than the 6% overall, and are also greater than the mean WPEs for each partisan group.14
13
Exit poll selection rules instruct exit poll field staff to, for example, “interview every 10th
voter”. 14
See Appendix A
ElectionArchive.org Page 14 4/12/05
E/M's exit poll data not only requires a “reluctant Bush responder” syndrome, it also requires a "high
range of Kerry voters response rates that varies far more than Bush voters'" plus a "Kerry voters
respond most in Bush strongholds" theory.
Once again, there is an implausible set of required response rates for Kerry and Bush supporters
given the Edison/Mitofsky precinct partisanship data in Table 1.
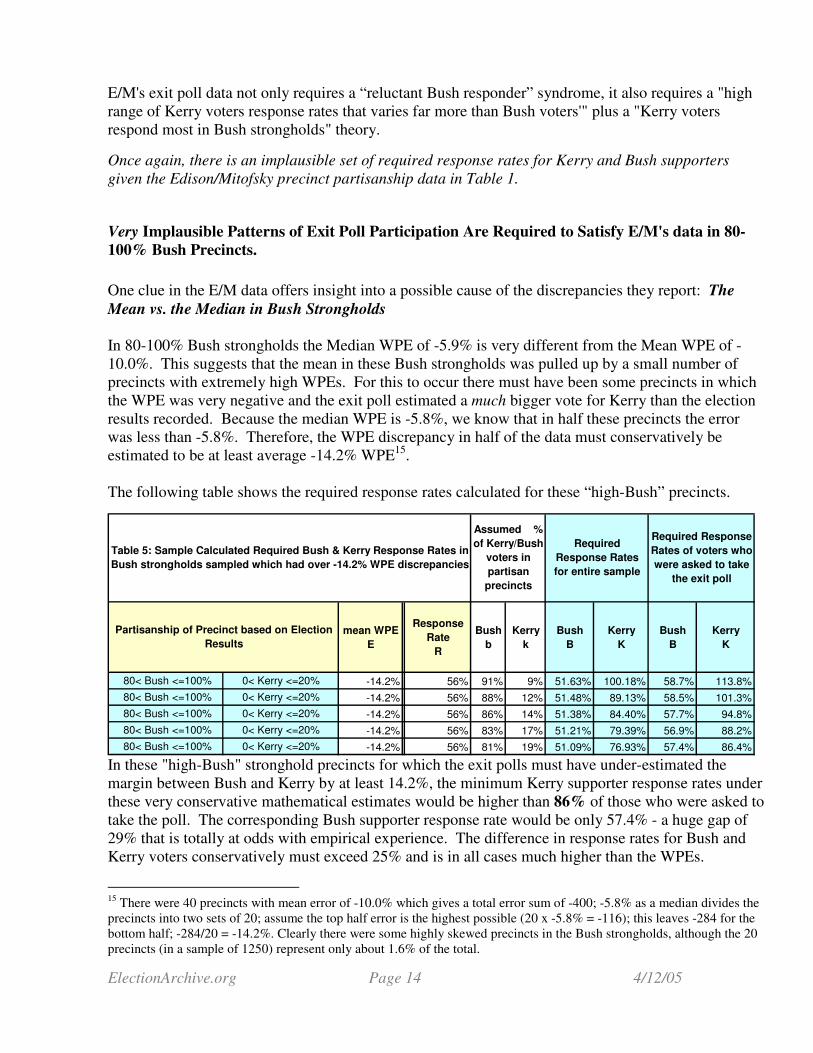
Very Implausible Patterns of Exit Poll Participation Are Required to Satisfy E/M's data in 80-
100% Bush Precincts.
One clue in the E/M data offers insight into a possible cause of the discrepancies they report: The
Mean vs. the Median in Bush Strongholds
In 80-100% Bush strongholds the Median WPE of -5.9% is very different from the Mean WPE of -
10.0%. This suggests that the mean in these Bush strongholds was pulled up by a small number of
precincts with extremely high WPEs. For this to occur there must have been some precincts in which
the WPE was very negative and the exit poll estimated a much bigger vote for Kerry than the election
results recorded. Because the median WPE is -5.8%, we know that in half these precincts the error
was less than -5.8%. Therefore, the WPE discrepancy in half of the data must conservatively be
estimated to be at least average -14.2% WPE15
.
The following table shows the required response rates calculated for these “high-Bush” precincts.
mean WPE
E
Response
Rate
R
Bush
b
Kerry
k
Bush
B
Kerry
K
Bush
B
Kerry
K
80< Bush <=100% 0< Kerry <=20% -14.2% 56% 91% 9% 51.63% 100.18% 58.7% 113.8%
80< Bush <=100% 0< Kerry <=20% -14.2% 56% 88% 12% 51.48% 89.13% 58.5% 101.3%
80< Bush <=100% 0< Kerry <=20% -14.2% 56% 86% 14% 51.38% 84.40% 57.7% 94.8%
80< Bush <=100% 0< Kerry <=20% -14.2% 56% 83% 17% 51.21% 79.39% 56.9% 88.2%
80< Bush <=100% 0< Kerry <=20% -14.2% 56% 81% 19% 51.09% 76.93% 57.4% 86.4%
Required Response
Rates of voters who
were asked to take
the exit poll
Partisanship of Precinct based on Election
Results
Table 5: Sample Calculated Required Bush & Kerry Response Rates in
Bush strongholds sampled which had over -14.2% WPE discrepancies
Assumed %
of Kerry/Bush
voters in
partisan
precincts
Required
Response Rates
for entire sample
In these "high-Bush" stronghold precincts for which the exit polls must have under-estimated the
margin between Bush and Kerry by at least 14.2%, the minimum Kerry supporter response rates under
these very conservative mathematical estimates would be higher than 86% of those who were asked to
take the poll. The corresponding Bush supporter response rate would be only 57.4% - a huge gap of
29% that is totally at odds with empirical experience. The difference in response rates for Bush and
Kerry voters conservatively must exceed 25% and is in all cases much higher than the WPEs.
15
There were 40 precincts with mean error of -10.0% which gives a total error sum of -400; -5.8% as a median divides the
precincts into two sets of 20; assume the top half error is the highest possible (20 x -5.8% = -116); this leaves -284 for the
bottom half; -284/20 = -14.2%. Clearly there were some highly skewed precincts in the Bush strongholds, although the 20
precincts (in a sample of 1250) represent only about 1.6% of the total.
ElectionArchive.org Page 15 4/12/05
Edison/Mitofsky’s data may be better explained by the hypothesis that vote-counting anomalies
occurred disproportionately in “high-Bush” precincts. To help test this hypothesis, in the absence of
E/M’s raw data, US Count Votes is planning an in-depth statistical analysis of precincts with high
Bush and high Kerry vote totals once our new nationwide precinct-level vote database is complete.
When Edison/Mitofsky’s explanation is checked against their own data using conservative
assumptions, it requires highly suspect Kerry voter exit poll behaviors in "high-Bush" precincts.
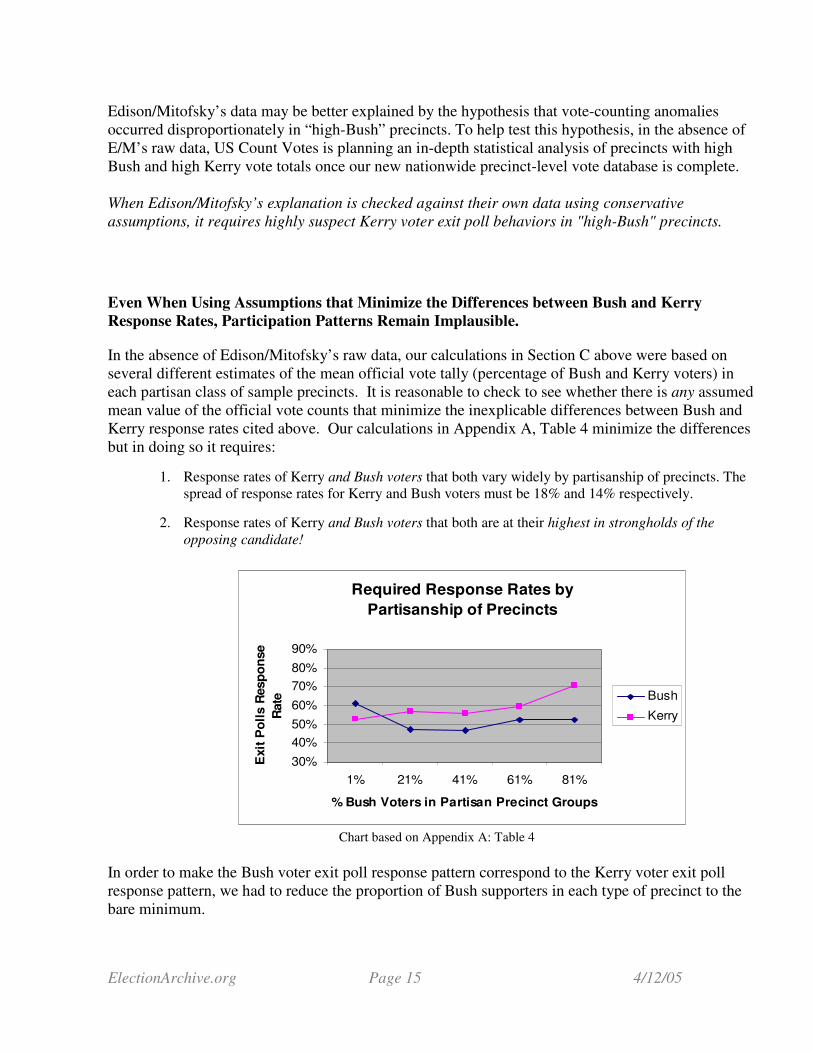
Even When Using Assumptions that Minimize the Differences between Bush and Kerry
Response Rates, Participation Patterns Remain Implausible.
In the absence of Edison/Mitofsky’s raw data, our calculations in Section C above were based on
several different estimates of the mean official vote tally (percentage of Bush and Kerry voters) in
each partisan class of sample precincts. It is reasonable to check to see whether there is any assumed
mean value of the official vote counts that minimize the inexplicable differences between Bush and
Kerry response rates cited above. Our calculations in Appendix A, Table 4 minimize the differences
but in doing so it requires:
1. Response rates of Kerry and Bush voters that both vary widely by partisanship of precincts. The
spread of response rates for Kerry and Bush voters must be 18% and 14% respectively.
2. Response rates of Kerry and Bush voters that both are at their highest in strongholds of the
opposing candidate!
Required Response Rates by
Partisanship of Precincts
30%
40%
50%
60%
70%
80%
90%
1% 21% 41% 61% 81%
% Bush Voters in Partisan Precinct Groups
Exit
Po
lls R
esp
on
se
Rate Bush
Kerry
Chart based on Appendix A: Table 4
In order to make the Bush voter exit poll response pattern correspond to the Kerry voter exit poll
response pattern, we had to reduce the proportion of Bush supporters in each type of precinct to the
bare minimum.
ElectionArchive.org Page 16 4/12/05
Very surprising patterns of partisan response rates to exit polls are required by both Kerry and Bush
voters when we select values to minimize the differences between Bush and Kerry voters' exit poll
response rates.
In sum, there are no values of proportions of Bush and Kerry voters which can be chosen that would
result in plausible response rate patterns, and that satisfy the exit poll data given by E/M.
D. The Same Exit Polls More Accurately Projected the Senate Races
The Senate and presidential races were both questions on a single exit poll survey. If Bush supporters
were refusing to fill out this survey as hypothesized, the accuracy of the exit poll should have been just
as poor in the Senate races as it was in the presidential race. The presidential and Senate poll results
derive from exactly the same responders.
In 32 states, Senate elections took place on the same ballot with the presidential race. The exit polls
were more accurate for Senate races than for the presidential race, including states where a Republican
senator eventually won (pages 19-24).
The Senate polls were significantly more accurate: paired t-test, t(30) = -2.48, p < .02, if outlier North
Dakota is excluded. Therefore the Mitofsky/Edison hypothesis of reluctant Bush poll responders is
irrelevant to explain the discrepancies between the exit poll and election results in the presidential
race.
This difference between the accuracy of the Senate and presidential exit poll is puzzling. Historic data
as well as the exit polls themselves indicate that the ticket-splitting rate is low. It is reasonable to
expect that the same voters who voted for Kerry were also the mainstay of support for the Democratic
candidates in the Senate.
Why should polls based on these same participants be more accurate in predicting Senate results than
in predicting the presidential vote? In the absence of raw, unadjusted precinct level exit poll data, this
question may best be answered by comparative analysis of official precinct-level presidential vote
tallies with tallies from Senate and other races. Patterns of anomalies in vote counting in US Senate
races should also be searched for, and investigated if found.
There is no logic to account for non-responders or missed voters when discussing the difference in the
accuracy of results for the Senate versus the presidential races in the same exit poll.
ElectionArchive.org Page 17 4/12/05
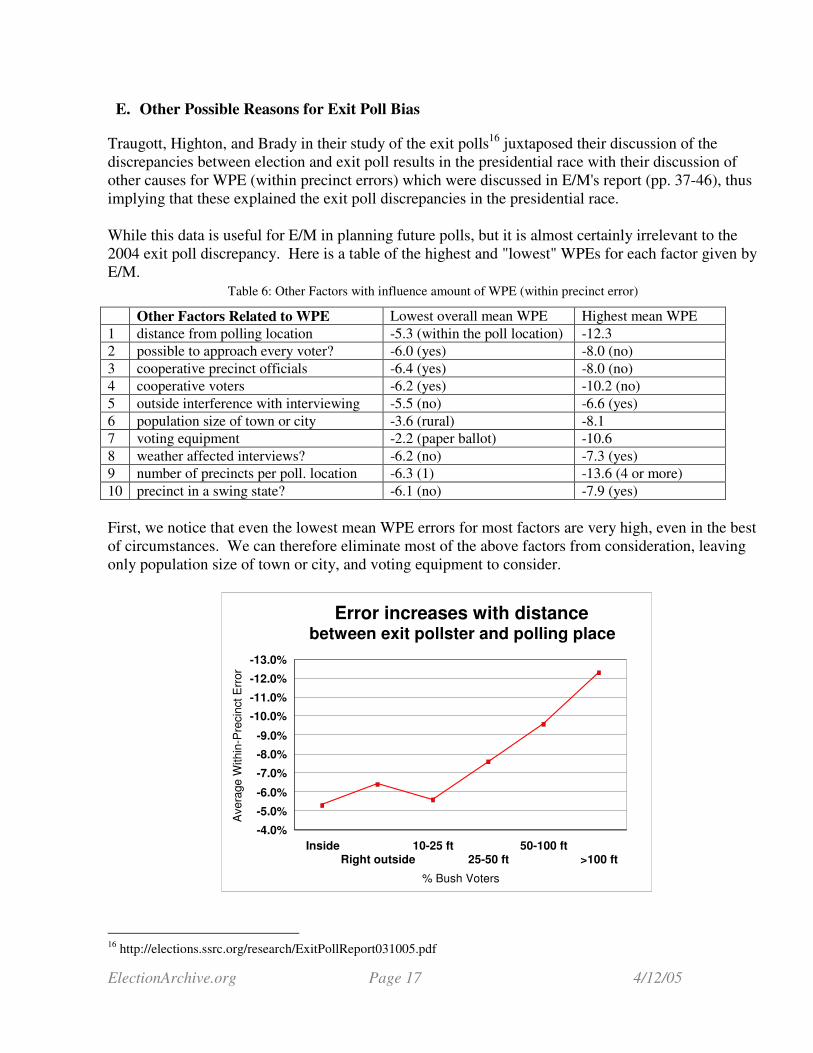
E. Other Possible Reasons for Exit Poll Bias
Traugott, Highton, and Brady in their study of the exit polls16
juxtaposed their discussion of the
discrepancies between election and exit poll results in the presidential race with their discussion of
other causes for WPE (within precinct errors) which were discussed in E/M's report (pp. 37-46), thus
implying that these explained the exit poll discrepancies in the presidential race.
While this data is useful for E/M in planning future polls, but it is almost certainly irrelevant to the
2004 exit poll discrepancy. Here is a table of the highest and "lowest" WPEs for each factor given by
E/M.
Table 6: Other Factors with influence amount of WPE (within precinct error)
Other Factors Related to WPE Lowest overall mean WPE Highest mean WPE
1 distance from polling location -5.3 (within the poll location) -12.3
2 possible to approach every voter? -6.0 (yes) -8.0 (no)
3 cooperative precinct officials -6.4 (yes) -8.0 (no)
4 cooperative voters -6.2 (yes) -10.2 (no)
5 outside interference with interviewing -5.5 (no) -6.6 (yes)
6 population size of town or city -3.6 (rural) -8.1
7 voting equipment -2.2 (paper ballot) -10.6
8 weather affected interviews? -6.2 (no) -7.3 (yes)
9 number of precincts per poll. location -6.3 (1) -13.6 (4 or more)
10 precinct in a swing state? -6.1 (no) -7.9 (yes)
First, we notice that even the lowest mean WPE errors for most factors are very high, even in the best
of circumstances. We can therefore eliminate most of the above factors from consideration, leaving
only population size of town or city, and voting equipment to consider.
InsideRight outside
10-25 ft25-50 ft
50-100 ft>100 ft
% Bush Voters
-13.0%
-12.0%
-11.0%
-10.0%
-9.0%
-8.0%
-7.0%
-6.0%
-5.0%
-4.0%
Avera
ge W
ithin
-Pre
cin
ct E
rror
Error increases with distancebetween exit pollster and polling place
16
http://elections.ssrc.org/research/ExitPollReport031005.pdf
ElectionArchive.org Page 18 4/12/05
For an example of why we can easily eliminate these factors, let us take "distance from polling place".
The number of precincts where the pollsters were placed far from the polling station was small. The
discrepancies that E/M seek to explain are already fully present even in the precincts where pollsters
were optimally placed. Most of this bias is apparent even in the 75% of precincts where the pollster
was allowed to conduct his survey just outside or within the building.
Hand counted paper ballots were used primarily in rural districts in only 3% of sampled precincts
altogether, so had very little effect on the overall discrepancies. All voting methods produced higher
mean WPEs in urban areas with over 50,000 population.
Rural areas constituted 24% of precincts sampled. All other "population size" precinct groups had
mean WPE of at least -5.0, with the highest mean WPE of -7.9 in suburbs which constituted 39% of
precincts.
No other factors relating to WPE (within precinct error) were given in the Edison/Mitofsky report that
would explain the systematic discrepancies between the election results and the exit poll results in the
presidential race.
III. Explanation #Three - Inaccurate Election Results If the discrepancies between exit poll and election results cannot be explained by random sampling error; the “Reluctant Bush Responder” hypothesis is inconsistent with the data; and other exit polling errors are insufficient to explain the large exit polling discrepancies, then the only remaining explanation – that the official vote count was corrupted – must be seriously considered.
Edison/ Mitofsky say in their Executive Summary (p. 3), “Exit polls do not support allegations of fraud …” but they do not seriously consider the hypothesis of election fraud. Instead, E/M use the word “error” consistently to analyze potential problems with the exit polls, always assuming the correctness of the election results without providing supporting evidence for that assumption.
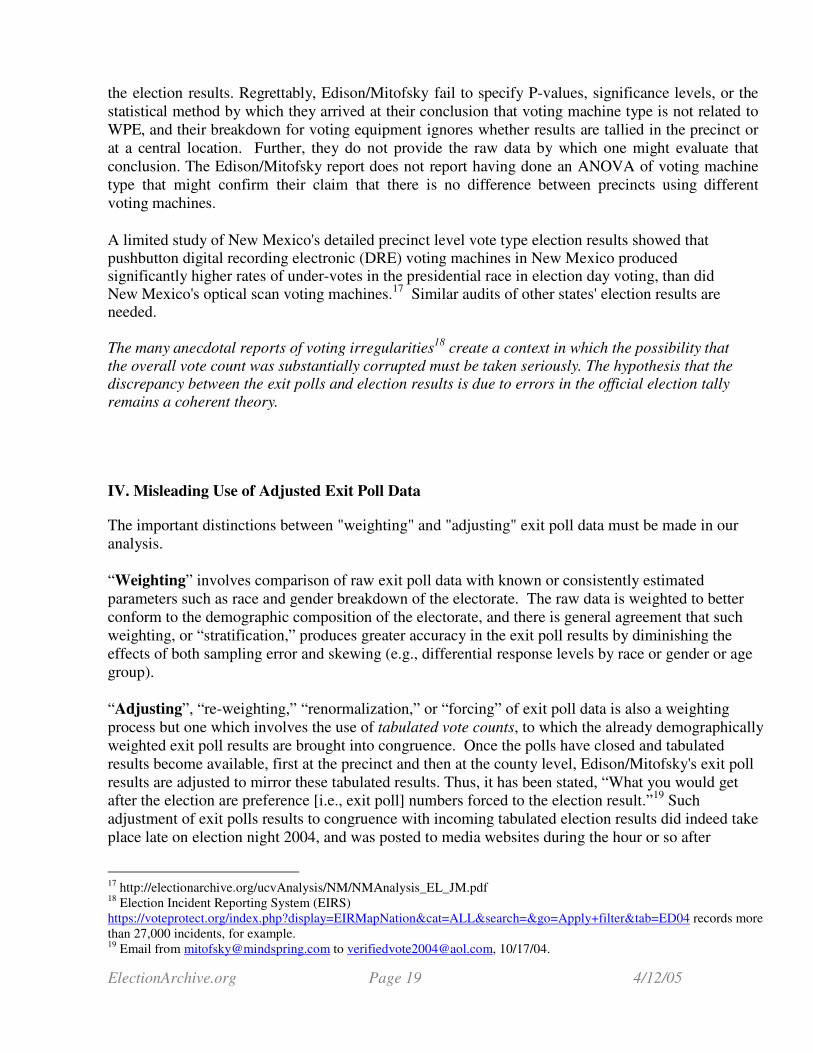
The E/M exit poll report shows differences in WPE for different types of voting equipment (p. 40). Precincts with paper ballots, used primarily in rural precincts, showed a median WPE of –0.9, consistent with chance, while all other technologies were associated with unexplained high WPE discrepancies between election and exit poll results:
Table 7: Median WPE by voting equipment
Type of equipment used at polling place
Median WPE Overall
Paper ballot -0.9
Mechanical voting machine -10.3
Touch screen -7.0
Punch cards -7.3
Optical scan -5.5
There is the possibility that errors for all four automated voting systems could derive from errors in
ElectionArchive.org Page 19 4/12/05
the election results. Regrettably, Edison/Mitofsky fail to specify P-values, significance levels, or the
statistical method by which they arrived at their conclusion that voting machine type is not related to
WPE, and their breakdown for voting equipment ignores whether results are tallied in the precinct or
at a central location. Further, they do not provide the raw data by which one might evaluate that
conclusion. The Edison/Mitofsky report does not report having done an ANOVA of voting machine
type that might confirm their claim that there is no difference between precincts using different
voting machines.
A limited study of New Mexico's detailed precinct level vote type election results showed that pushbutton digital recording electronic (DRE) voting machines in New Mexico produced significantly higher rates of under-votes in the presidential race in election day voting, than did New Mexico's optical scan voting machines.
17 Similar audits of other states' election results are
needed.
The many anecdotal reports of voting irregularities18
create a context in which the possibility that
the overall vote count was substantially corrupted must be taken seriously. The hypothesis that the
discrepancy between the exit polls and election results is due to errors in the official election tally
remains a coherent theory.
IV. Misleading Use of Adjusted Exit Poll Data
The important distinctions between "weighting" and "adjusting" exit poll data must be made in our
analysis.
“Weighting” involves comparison of raw exit poll data with known or consistently estimated
parameters such as race and gender breakdown of the electorate. The raw data is weighted to better
conform to the demographic composition of the electorate, and there is general agreement that such
weighting, or “stratification,” produces greater accuracy in the exit poll results by diminishing the
effects of both sampling error and skewing (e.g., differential response levels by race or gender or age
group).
“Adjusting”, “re-weighting,” “renormalization,” or “forcing” of exit poll data is also a weighting
process but one which involves the use of tabulated vote counts, to which the already demographically
weighted exit poll results are brought into congruence. Once the polls have closed and tabulated
results become available, first at the precinct and then at the county level, Edison/Mitofsky's exit poll
results are adjusted to mirror these tabulated results. Thus, it has been stated, “What you would get
after the election are preference [i.e., exit poll] numbers forced to the election result.”19
Such
adjustment of exit polls results to congruence with incoming tabulated election results did indeed take
place late on election night 2004, and was posted to media websites during the hour or so after
17
http://electionarchive.org/ucvAnalysis/NM/NMAnalysis_EL_JM.pdf 18
Election Incident Reporting System (EIRS)
https://voteprotect.org/index.php?display=EIRMapNation&cat=ALL&search=&go=Apply+filter&tab=ED04 records more
than 27,000 incidents, for example. 19
Email from [email protected] to [email protected], 10/17/04.
ElectionArchive.org Page 20 4/12/05
approximately 12:24 a.m. on November 3, 2004. These adjusted results remain posted, as of this
writing.20
The demographically weighted results available prior to this adjustment will be referred to
as “unadjusted.”
Many have questioned whether this process was in itself sinister, designed to conceal troubling
questions about vote counting in Election 2004 as revealed by the unadjusted exit poll results. The
answer is almost certainly no. And yet the effect of the process was at the very least confusing and
served to blunt public awareness of the dramatic exit poll-vote count discrepancies during the critical
period immediately following the election.
While we acknowledge that slight adjustment may legitimately be made to exit polls using the
reported election results, so that the results can be used to assess the demographics and opinions
underlying the reported voter shares in a consistent fashion, the justification for doing so rests entirely
on the assumption that the reported election results are in fact accurate, as reflected by a small and
undramatic discrepancy between exit poll results and vote counts. In order for the exit poll results in
2004 to be used in this manner they had to be substantially, in fact dramatically, adjusted. Such
substantial discrepancies and the need for such dramatic adjustment raised a bright red flag.
Edison/Mitofsky ignored this red flag and simply substituted the adjusted data set, which has been
generally employed without acknowledgement.
This practice continues in Edison/Mitofsky’s report. The National Exit Poll (NEP) data given on pp.
60-61 and again on p. 65 was adjusted to correspond to the official vote count. This adjusted data
continues to be highly misleading. For example, Adam Nagourney writing in The New York Times21
apparently unknowingly used this adjusted report data to make the major, and erroneous, point that for
the first time the Republican share of the electorate equaled the Democratic (37%-37%). The actual
unadjusted exit poll data showed a Democratic share of 38% to Republican 35%. Promulgating
multiple and not clearly delineated data sets raises the level of general confusion and detracts from the
credibility of the salient data sets and results.
Fortunately a demographically weighted, unadjusted data set has been available for analysis since
November 3, 2004. (See Appendix B.) CNN screen shots of exit poll data were downloaded by
Jonathan Simon and others from 12:17 to 12:24 AM ET on Nov. 3, 2004.22
It is an open question
whether, in the absence of this somewhat fortuitous data capture, either the vote counts themselves or
the exit poll results adjusted to mirror them would have been called into question, and whether any of
the unadjusted data sets would have come to light. To the best of our knowledge the Simon screen
shots— that are marked as having been updated from 12:17 to 12:24 AM ET and referred to as the
“Simon data”23
—reflect the final demographically weighted exit poll data available before these data
20
See, e.g., http://www.cnn.com/ELECTION/2004.pages/results/states/CT/P/00/epolls.0.html; this is the page for
Connecticut; for other states, substitute the appropriate state abbreviation for “CT” in the url above. 21
New York Times, January 24, 2005 22
Copies of these screen shots are posted at: http://www.exitpollz.org/. This unadjusted data remained posted to web sites
such as www.CNN.com at that late hour reportedly (and ironically) as a result of a computer problem with a server at
Edison. 23
For a summary of the Simon data see "Exit Poll Prediction" column p. 36-38 of Baiman, Ron affidavit at http://uscountvotes.net/docs_pdf/analysis/OH/Affidavit_04-21_ver2.pdf. It should be noted that Simon was unable to
capture unadjusted data for four states (NJ, NY, NC, and VA). For the states of Connecticut, Florida, and Ohio, Simon was
captured both unadjusted and adjusted results, all of which show major exit poll adjustments in favor of Bush. In the state
on Connecticut, for example, the results changed from 57.7% Kerry/40.9% Bush in the 12:22 a.m. update to 54.7%
ElectionArchive.org Page 21 4/12/05
were adjusted to conform to the reported election results. Although the E/M report does not
acknowledge or explain these CNN screen shots or the data set derived from them, this Simon data
corresponds closely with the data sets referred to as “call 3” data and presented by E/M in their report
on pp. 21-2224
.
E/M employs this “call-3” data set for the presidential election once in their report (table pp. 21-22)
and then abandons it entirely, substituting without acknowledgement, the adjusted data set, and thus
perpetuating the confusion and misleading impressions created by their original conversion to the
adjusted data on the morning of November 3, 2004. We see no constructive reason for E/M's practice
in this regard.
It is reasonable to ask Edison/Mitofsky to make publicly available the raw precinct level data and
weights used to calculate both their “ call-3”and "Simon" data sets, and explain to the public its
selective avoidance of these data sets in their report.
Kerry/44.4% Bush in the 12:53 a.m. update, while the number of respondents remained constant at 872. The tabulated
results were 54.7% Kerry/44.4% Bush, exactly matching the adjusted poll results. 24
Although the Simon data and call 3 data do not match exactly, in nearly all cases the discrepancies are very minor
(within a few tenths of a percentage point, within the bounds of rounding error) and there is no statistically significant
pattern of overstatement or understatement. Either the Simon data or the call-3 data may be used without changing the
thrust of our analysis that there exists a pattern of statistically significant discrepancy between the exit poll results and vote
counts.
ElectionArchive.org Page 22 4/12/05
Summary
There is already a strong case that there were significant irregularities in the presidential vote count
from the 2004 election. Nevertheless, critics are asking for firmer proof before going forward with a
thorough investigation25
. We feel strongly that this is the wrong standard. One cannot have proof
before an investigation.
In fact, the burden of proof should be to show that the election process is accurate and fair. The
integrity of the American electoral system can and should be beyond reproach. Citizens in the world’s
oldest and greatest democracy should be provided every assurance that the mechanisms they have put
in place to count our votes are fair and accurate. The legitimacy of our elected leaders depends upon
it.
Well-documented security vulnerabilities and accuracy issues have affected voting equipment as far
back as the late 1960s26
, and history shows that partisan election officials have long possessed the
power to suppress and otherwise distort the vote counts27
. The recent and ongoing proliferation of
sophisticated computerized vote recording and tallying equipment28
, much of it unverifiable and hence
"faith-based", dramatically augments the opportunities for wholesale and outcome-determinative
distortions of the vote counting process. That the lion's share of this equipment is developed,
provided, and serviced by partisan private corporations only amplifies these serious concerns. The fact
that, in the 2004 election, all voting equipment technologies except paper ballots were associated with
large unexplained exit poll discrepancies all favoring the same party certainly warrants further inquiry.
The absence of any statistically-plausible explanation for the discrepancy between Edison/Mitofsky’s
exit poll data and the official presidential vote tally is an unanswered question of vital national
importance that demands a thorough and unflinching investigation.
US Count Votes is a Utah non-profit corporation. Its goal is to help ensure the accuracy of future elections. US
Count Votes is sponsoring the "National Election Data Archive" project in order to collect detailed election data
and develop statistical/mathematical methods to analyze elections results data and provide evidence of possible vote
tabulation errors immediately following US elections.
25
See for example http://elections.ssrc.org/research/ExitPollReport031005.pdf 26
Harris, B. "Black Box Voting: Ballot Tampering in the 21st Century (Talion Publishing, March, 2004): Chapter 2, "Can
We Trust These Machines?" http://www.blackboxvoting.org/bbv_chapter-2.pdf contains an extensive list of primary
source citations 27
See for example http://electionarchive.org/ucvAnalysis/OH/FranklinCountyReport_v2.pdf 28
In November 2004 mechanical vote tallying systems, easily tampered with locally, also continue to be used and show
high mean WPEs for precincts using them, according to Edison/Mitofsky's report.

ElectionArchive.org Page 23 4/12/05
Appendix A: Voter Response Rate Calculations
Calculated Kerry and Bush voters response rates required to reconcile Edison/Mitofsky’s Partisanship
Precinct data as given in Table 1.
We assume that there are no significant differences in precinct size between the various precinct
groupings by partisanship. For any assumed percentage of Bush and Kerry voters within any
partisanship precinct group, there exist equations where the unknowns are "the response rate for Bush
voters" and "the response rate of Kerry voters" that have a single solution.
For Each Partisan Precinct Grouping we let:
K be the Kerry voter response rate
B be the Bush voter response rate
k be the % of Kerry votes in the precinct grouping
b be the % of Bush votes in the precinct grouping
R be the overall response rate within each precinct grouping
n be the number of voters in each precinct grouping
E be the mean WPE error for that precinct grouping
m be the miss rate
bkM −= be the margin difference in Bush and Kerry percentage votes
BKw −= be the differential response rate of Kerry and Bush voters
B
K=α be the ratio of Kerry response rate to Bush response rate
Calculation of Bush and Kerry response rates as a proportion of the sample:
Then:
kn is the number of Kerry votes in the precinct grouping
bn is the number of Bush votes in the precinct grouping
knK is the number of Kerry voters in the sample who responded to exit polls
bnB is the number of Bush voters in the sample who responded to the exit polls
Rn is the total number of voters who completed the exit poll in the precinct grouping

ElectionArchive.org Page 24 4/12/05
Rn
knK and
Rn
nbB are the ratios of Kerry and Bush voters who responded to exit polls
Ek 5.0− is the ratio of Kerry voters who responded to exit polls using the WPE discrepancy
Eb 5.0+ is the ratio of Bush voters who responded to exit polls using the WPE discrepancy
Note: 1=+ bk and RbBkK =+
So, putting it altogether -
EkRn
nkK5.0−= and Eb
Rn
nbB5.0+=
Solving for K and B we obtain:
Equation 1. k
REkK
)5.0( −= and
b
REbB
)5.0( +=
Calculation of Bush and Kerry response rates as a proportion of voters asked Let:
K be the Kerry voter response rate
B be the Bush voter response rate
Then:
)1( mknK − is the number of Kerry voters who were asked, and who responded to exit polls
)1( mbnB − is the number of Bush voters who were asked and who responded to the exit polls
So, putting it altogether -
EkRn
mnkK5.0
)1(−=
− and Eb
Rn
mnbB5.0
)1(+=
−
Solving for K and B we obtain:
Equation 2. )1(
)5.0(
mk
REkK
−
−= and
)1(
)5.0(
mb
REbB
−
+=

ElectionArchive.org Page 25 4/12/05
The following three tables calculate required response rates for Bush and Kerry voters under different
assumed proportions of Bush and Kerry voters in each partisanship precinct group. One can see that
any assumption leads to implausible response rates.
Table 2: Assume Midpoints - Bush/Kerry ratios of 10:90, 30:70, 50:50, 70:30, 90:10
mean WPE Response
Rate Bush Kerry Bush Kerry Bush Kerry
0< Bush <=20% 80< Kerry <=100% 0.3% 53% 10% 90% 53.8% 52.9% 61.1% 60.1%
20< Bush <=40% 60< Kerry <=80% -5.9% 55% 30% 70% 49.6% 57.3% 56.4% 65.1%
40< Bush <=60% 40< Kerry <=60% -8.5% 52% 50% 50% 47.6% 56.4% 53.5% 63.4%
60< Bush <=80% 20< Kerry <=40% -6.1% 55% 70% 30% 52.6% 60.6% 58.4% 67.3%
80< Bush <=100% 0< Kerry <=20% -10.0% 56% 90% 10% 52.9% 84.0% 59.4% 94.4%
Required
Response Rates
for entire sample
Table 2: Calculated Required Bush & Kerry Response Rates using
midpoints of precinct intervals as the assumed Bush/Kerry voter
percentages in partisan precincts.
Assumed %
of Kerry/Bush
voters in
partisan
precincts
Partisanship of Precinct based on Election
Results
Required Response
Rates of voters who
were asked to take
the exit poll
Table 3: Assume Normal Curve - Bush Kerry ratios of 13:87, 33:67, 50:50, 67:33, 87:13
mean WPE
E
Response
Rate R
Bush
b
Kerry
k
Bush
BKerry K Bush B Kerry K
0< Bush <=20% 80< Kerry <=100% 0.3% 53% 13% 87% 53.61% 52.91% 60.9% 60.1%
20< Bush <=40% 60< Kerry <=80% -5.9% 55% 33% 67% 50.08% 57.42% 56.9% 65.3%
40< Bush <=60% 40< Kerry <=60% -8.5% 52% 50% 50% 47.58% 56.42% 53.5% 63.4%
60< Bush <=80% 20< Kerry <=40% -6.1% 55% 67% 33% 52.50% 60.08% 58.3% 66.8%
80< Bush <=100% 0< Kerry <=20% -10.0% 56% 87% 13% 52.78% 77.54% 59.3% 87.1%
Table 3: Calculated Required Bush & Kerry Response Rates using the
normal curve to locate likely values to assume for Bush/Kerry voter
percentages in partisan precincts.
Partisanship of Precinct by Election Results
Assumed %
of Kerry/Bush
voters in
partisan
precincts
Required
Response Rates
for entire sample
Required Response
Rates of voters who
were asked to take
the exit poll
Table 4: Assume Arbitrary Minimizing - Bush/Kerry ratios of 1:99, 21:79, 41:59, 61:39, 81:19
mean WPE
E
Response
Rate R
Bush
b
Kerry
k
Bush
B
Kerry
KBush B Kerry K
0< Bush <=20% 80< Kerry <=100% 0.3% 53% 1% 99% 60.95% 52.92% 69.3% 60.1%
20< Bush <=40% 60< Kerry <=80% -5.9% 55% 21% 79% 47.27% 57.05% 53.7% 64.8%
40< Bush <=60% 40< Kerry <=60% -8.5% 52% 41% 59% 46.61% 55.75% 52.4% 62.6%
60< Bush <=80% 20< Kerry <=40% -6.1% 55% 61% 39% 52.25% 59.30% 58.1% 65.9%
80< Bush <=100% 0< Kerry <=20% -10.0% 56% 81% 19% 52.54% 70.74% 59.0% 79.5%
Required
Response Rates
for entire sample
Table 4: Calculated Required Bush & Kerry Response Rates using
arbitrary assumed values of Bush/Kerry voter percentages in partisan
precincts that minimize Bush/Kerry response rate differences.
Partisanship of Precinct based on Election
Results
Required Response
Rates of voters who
were asked to take
the exit poll
Assumed %
of Kerry/Bush
voters in
partisan
precincts

ElectionArchive.org Page 26 4/12/05
Appendix B: WPE and Differential Partisan Response WPE is a poor measure of “differential response by party” as its magnitude is affected by the partisan
composition of the precinct ( k or b ) and by the overall response rate ( R ), in addition to the relative
response to exit pollsters by members of each party.29
This can be seen by inspecting Tables 2-4
above. The difference between Bush and Kerry voter response rates and mean WPE, increases as
precincts become more partisan. This is because, in addition to differential response by party, overall
response rates and partisan composition affect WPE
This can be seen by setting K = r - .5w and B = r +.5w, where BKw −= is "differential response by
party" and r is “mean response by party”, and substituting these into the solutions for K and B in
Equation 1. Appendix A, to get the following two equation system for r and w:
wrk
REk5.0
)5.0(−=
− and wr
b
REb5.0
)5.0(+=
+
The solution of this system for w is:
−
+
+
= k
E
k
Rb
E
b
Rw
22
so that when 1=+ kb as we assume in this report (neglecting the response of “independent voters”
who made up 1% or so of the national electorate) we get:
Equation 3.
−
=
−
=
)1(
1
2)1(
1
2 kk
RE
bb
REw or conversely
Equation 4. ( ) ( )kkR
wbb
R
wE −
=−
= 1
21
2
From this equation we see that E , or WPE, is not only determined by the “partisan response
differential”, w , but also by k or b , and R . More competitive precincts (when 5.0→b 5.0→k ) and
precincts with lower overall response rates R , will have higher absolute WPE simply because of the
mathematical effects of k or b , and R , on the relationship between w and E .
“Differential response by party”, w, will not be equal to E unless
( ) ( ) 112
12
=−
=−
bb
Rkk
R for a perfectly competitive precinct ( ) w
REkb
===
5.05.0 , its
maximum value. If in addition R = 0.5 then wE = .
This suggests that the WPEs listed in Tables 2-4 of our report substantially understate differential
response by party, especially for partisan districts. As we have shown, w has to be very, and
implausibly, large in all cases, if E is to be explained.
29
We thank Elizabeth Liddle, of the University of Nottingham, U.K., for calling our attention to the effect of precinct
partisanship on the relationship between differential partisan response and WPE. We take full responsibility for the derivations and conclusions that we have arrived at from analyzing this pattern in this Appendix.
ElectionArchive.org Page 27 4/12/05
Moreover, this analysis suggests that if there is a pervasive and more or less constant bias in exit
polling because of a differential response by party, WPE should be greatest for more balanced
precincts and fall as precincts become more partisan. The data presented on p. 36, 37 of the E/M report
and displayed in Table 1 of our report above, show that this is the case for all except the most highly
partisan Bush precincts for which WPE dramatically increases to -10.0%. Our calculations above
show the differential partisan response necessary to generate this level of WPE in these precincts
ranges from 40% (Table 2) to an absolute minimum of 20.5% (Table 4). These results would appear
to lend further support to the "Bush Strongholds have More Vote-Corruption" (Bsvcc) hypothesis
discussed in Section B of our report, and to the discussion of the "Very Implausible Patterns of Exit
Poll Participation Are Required to Satisfy E/M's data in 80-100% Bush Precincts.
Signed WPE versus Absolute WPE in partisan precincts
The next to last column of the precinct partisanship table (p. 36 of E/M report) shows that the mean
absolute value WPE (unsigned WPE) for highly partisan Bush precincts declines to 12.4 % for highly
partisan Republican precincts relative to less partisan (13.2% and 13.4%) and more balanced precincts
(15.2%). Only highly partisan Kerry precincts have a lower mean absolute value WPE of 8.8%.
Comparing this data to the mean WPE data in Table 2 of our report shows that:
a) Highly Kerry precincts had large absolute value WPE's (totaling 8.8%) but these included both pro-
Kerry and pro-Bush discrepancies that off-set each other so that the average (signed) WPE was only
0.3%. Pro-Bush bias was just about offset by pro-Kerry bias in these precincts, as one would expect
for random sampling bias and random measurement error.
b) A somewhat similar, but less balanced, pattern occurred in less partisan precincts as in these
precincts (signed) WPE, though consistently negative, was roughly half the
magnitude of mean absolute value WPE (-5.5 and 13.4, -8.3 and 15.2, -6.1 and 13.2, respectively).
This suggests that in these precincts about half of pro-Kerry exit poll bias was off-set by pro-Bush exit
poll bias. This is not what one would expect from random exit poll bias and measurement error but at
least moves in the expected direction.
c) The dramatic and unexpected increase in (signed) mean WPE in highly Bush precincts of -
10.0%, noted above, is also unexpectedly close to mean absolute value WPE (12.4%) in these
precincts. This suggests that the jump in (signed) WPE in highly partisan Bush precincts occurred
primarily because (signed) WPE discrepancies in these precincts were, unlike in a) above and much
more so than in b) above, overwhelmingly one-sided negative overstatements of Kerry's vote share.
These results lend further support to the "Bush Strongholds have more Vote-Corruption" (Bsvcc)
hypothesis discussed in Section B of our report, and to the discussion of the "Very Implausible
Patterns of Exit Poll Participation Are Required to Satisfy E/M's data in 80-100% Bush Precincts".
It is reasonable to ask Edison/Mitofsky to explain why signed WPE in highly partisan precincts is not
lower than in less partisan precincts as would be mathematically expected, and where this dramatic
increase in one-sided WPE in highly Bush precincts and significant increases in one-sided WPE in
more partisan precincts, both of which are at odds with the more or less random pattern of signed
WPE error in highly Kerry precincts, comes from.

ElectionArchive.org Page 28 4/12/05
Appendix C: Jonathan Simon Exit Poll Data - Downloaded from CNN and similar to the "Call-
3" data in Edison/Mitofsky's Report on pp. 21-22
State Venue # Respondents UpdateTime
(ET)
Bush Exit
Poll%
Kerry
Exit Poll%
Bush
Election%
Kerry
Election%
Red
Shift%*
Type Of
State
National Vote 13047 12:23 AM 48.2 50.8 50.9 48.1 2.7 N/A
Alabama 730 12:17 AM 58.1 40.5 63 37 4.2 Safe
Alaska 910 1:00 AM 57.8 38.8 62 35 4 Safe
Arizona 1859 12:19 AM 52.8 46.7 55 44 2.5 Safe
Arkansas 1402 12:22 AM 52.9 46.1 54 45 1.1 Safe
California 1919 12:23 AM 43.4 54.6 45 54 1.1 Safe
Colorado 2515 12:24 AM 49.9 48.1 52 47 1.6 Battleground
Connecticut(1) 872 12:22 AM 40.9 57.7 44 54 3.4 Safe
Connecticut(2) 872 12:53 AM 44.4 54.7 44 54 0.2 Safe
DistColumbia 795 12:22 AM 8.2 89.8 9 90 0.3 Safe
Delaware 770 12:22 AM 40.7 57.3 46 53 4.8 Safe
Florida(1) 2846 8:40 PM 49.8 49.7 52 47 2.5 Critical(Early)
Florida(2) 2846 12:21 AM 49.8 49.7 52 47 2.5 Critical
Florida(3) 2862 1:01 AM 51.4 47.6 52 47 0.6 Critical(Late)
Georgia 1536 12:22 AM 56.6 42.9 58 41 1.7 Safe/Suspect
Hawaii 499 12:22 AM 46.7 53.3 45 54 -1.2 Safe
Idaho 559 12:22 AM 65.7 32.9 68 30 2.6 Safe
Illinois 1392 12:23 AM 42.4 56.6 45 55 2.1 Safe
Indiana 926 12:22 AM 58.4 40.6 60 39 1.6 Safe
Iowa 2502 12:23 AM 48.4 49.7 50 49 2 Battleground
Kansas 654 12:22 AM 64.5 34.1 62 37 -2.7 Safe
Kentucky 1034 12:22 AM 58.4 40.2 60 40 0.9 Safe
Louisiana 1669 12:21 AM 54.7 43.9 57 42 2.1 Safe
Maine 1968 12:22 AM 44.3 53.8 45 54 0.3 Safe
Maryland 1000 12:22 AM 42.3 56.2 43 56 0.5 Safe
Massachusetts 889 12:22 AM 32.9 65.2 37 62 3.7 Safe
Michigan 2452 12:21 AM 46.5 51.5 48 51 1 Battleground
Minnesota 2178 12:23 AM 44.5 53.5 48 51 3 Battleground
Mississippi 798 12:22 AM 56.5 43 60 40 3.3 Safe
Missouri 2158 12:21 AM 52 47 54 46 1.5 Battleground
Montana 640 12:22 AM 58 37.5 59 39 -0.3 Safe
Nebraska 785 12:22 AM 62.5 36 66 33 3.3 Safe/Suspect
Nevada 2116 12:23 AM 47.9 49.2 51 48 2.2 Battleground
New Hampshire 1849 12:24 AM 44.1 54.9 49 50 4.9 Battleground
New Jersey 1520 12:50 AM 46.2 52.8 46 53 -0.2 Safe(Late)
New Mexico 1951 12:24 AM 47.5 50.1 50 49 1.8 Battleground
New York 1452 12:52 AM 40.9 58.2 40 58 -0.4 Safe(Late)
North Carolina 2167 12:48 AM 56.5 42.7 56 44 -0.9 Safe(Late)
BREAKDOWN OF EXIT POLLING AND VOTE TABULATION - PRESIDENTIAL ELECTION 2004

ElectionArchive.org Page 29 4/12/05
State Venue # Respondents UpdateTime
(ET)
Bush Exit
Poll%
Kerry
Exit Poll%
Bush
Election%
Kerry
Election%
Red
Shift%*
Type Of
State
North Dakota 649 12:22 AM 64.4 32.6 63 36 -2.4 Safe
Ohio(1) 1963 7:32 PM 47.9 52.1 51 49 3.1 Critical
Ohio(2) 2020 1:41 AM 50.9 48.6 51 49 0.3 Critical(Late)
Oklahoma 1539 12:23 AM 65 34.6 66 34 0.8 Safe
Oregon 1064 12:22 AM 47.9 50.3 48 52 -0.8 Safe
Pennsylvania 1930 12:21 AM 45.4 54.1 49 51 3.4 Critical
Rhode Island 809 12:22 AM 34.9 62.7 39 60 3.4 Safe
South Carolina 1735 12:24 AM 53.4 45.1 58 41 4.4 Safe
South Dakota 1495 12:24 AM 61 36.5 60 39 -1.8 Safe
Tennessee 1774 12:23 AM 58 40.6 57 43 -1.7 Safe
Texas 1671 12:22 AM 62.2 36.3 61 38 -2 Safe
Utah 796 12:22 AM 68.1 29.1 71 27 2.5 Safe
Vermont 685 12:22 AM 33.3 63.7 39 59 5.2 Safe
Virginia 1431 12:56 AM 54.1 45.4 54 45 0.2 Safe(Late)
Washington 2123 12:38 AM 44 54.1 46 53 1.6 Safe(Late)
West Virginia 1722 12:24 AM 54 44.5 56 43 1.8 Safe
Wisconsin 2223 12:21 AM 48.8 49.2 49 50 -0.3 Battleground
Wyoming 684 12:22 AM 65.5 30.9 69 29 2.7 Safe
*
Red Shift = [(Btab% - Bep%) + (Kep% - Ktab%)]/2 tab= tabulated vote, ep=exit poll
Positive - net movement toward Bush, Negative (blue shift) - net movement toward Kerry
Using Florida (critical) as an example:
Exit Poll % : B=49.8% K=49.7%
Tab (99% precincts) B=52% K=47%
Red Shift: [(52% - 49.8%) + (49.7% - 47%)]/2 = (2.2% + 2.7%)/2 = +2.5%

ElectionArchive.org Page 30 4/12/05
Appendix D: Calculation of National Exit Sample Odds
E/M states that there should be a 95% probability that the reported election result will be within 1% of
the exit-poll share for exit polls with sample sizes of 8,001 to 15,000. E/M also states that its national
exit poll had a sample size of 12,219.30
This information allows us to determine the implied standard deviation for this sample and find what
the probability is that the national exit poll would overestimate Kerry’s vote share by 2.7%. The odds
of this occurring by chance are one in 16,496,696 - see table below:
A B C D E F G H I
Bush Kerry Bush Kerry
Mitofsky
Standard
Deviation
Exit Poll
Overestim
ate of
Kerry Vote
Mitofsky
Margin of
Error with
95%
Probability
Mitosfsky 5%
Confidence Interval
Z-Score Probability
of Random
Occurance
H/1.96 E-C 1% 1-NORM(E,C,F,True)
United
States 50.90% 48.10% 48.20% 50.80% 0.005102 2.70% 1.00% 0.000000060493
Odds (1/I6): 16,530,850
Reported Election Exit Poll Results
National Exit Poll Results
30
Methods Statement - National Election Pool Exit Polls by Edison and Mitofsky International, November 2, 2004
See: http://www.exit-poll.net/election-night/MethodsStatementNationalFinal.pdf


![Tracer Trails Urban Transport System of the City of Villahermosa: … Trails Urban... · 2015. 2. 25. · Mitofsky [5] shows that 56% of men, 51% of women and two of every three Mexicans](https://static.fdocuments.us/doc/165x107/5ff5479fe76d50439b7e1912/tracer-trails-urban-transport-system-of-the-city-of-villahermosa-trails-urban.jpg)