Analysis of soybean cropland expansion in the southern ... · Analysis of soybean cropland...
12
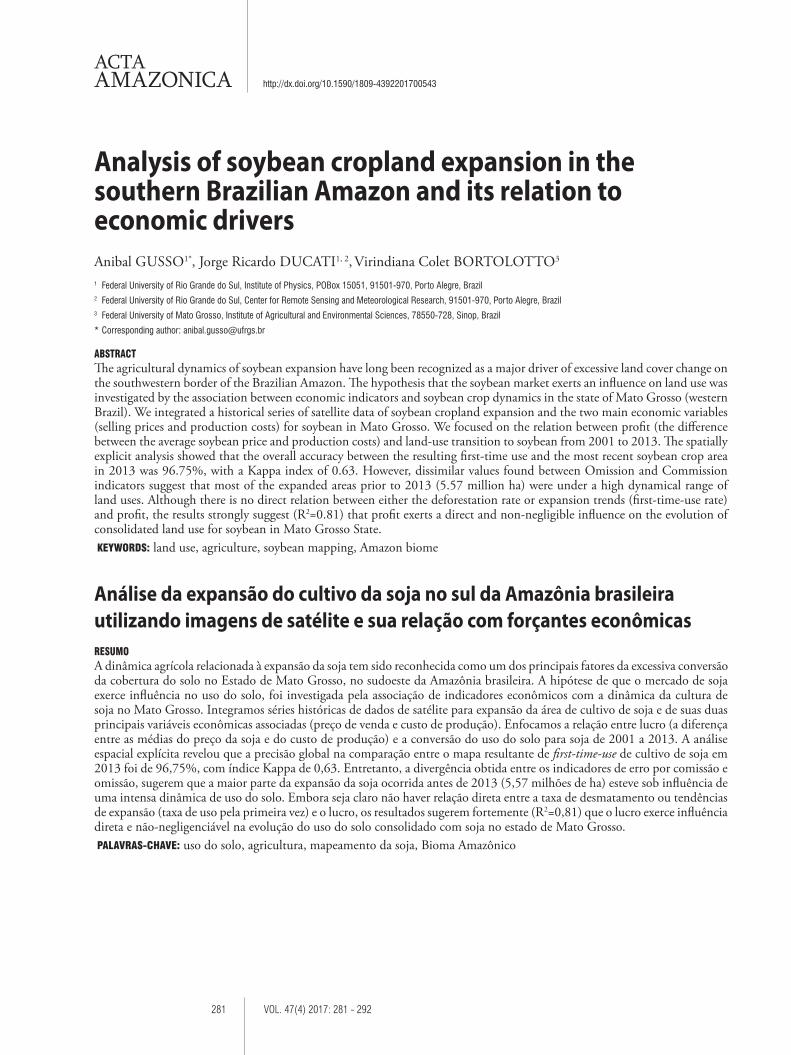
281 VOL. 47(4) 2017: 281 - 292 http://dx.doi.org/10.1590/1809-4392201700543 ACTA AMAZONICA Analysis of soybean cropland expansion in the southern Brazilian Amazon and its relation to economic drivers Anibal GUSSO 1* , Jorge Ricardo DUCATI 1, 2 , Virindiana Colet BORTOLOTTO 3 1 Federal University of Rio Grande do Sul, Institute of Physics, POBox 15051, 91501-970, Porto Alegre, Brazil 2 Federal University of Rio Grande do Sul, Center for Remote Sensing and Meteorological Research, 91501-970, Porto Alegre, Brazil 3 Federal University of Mato Grosso, Institute of Agricultural and Environmental Sciences, 78550-728, Sinop, Brazil * Corresponding author: [email protected] ABSTRACT e agricultural dynamics of soybean expansion have long been recognized as a major driver of excessive land cover change on the southwestern border of the Brazilian Amazon. e hypothesis that the soybean market exerts an influence on land use was investigated by the association between economic indicators and soybean crop dynamics in the state of Mato Grosso (western Brazil). We integrated a historical series of satellite data of soybean cropland expansion and the two main economic variables (selling prices and production costs) for soybean in Mato Grosso. We focused on the relation between profit (the difference between the average soybean price and production costs) and land-use transition to soybean from 2001 to 2013. e spatially explicit analysis showed that the overall accuracy between the resulting first-time use and the most recent soybean crop area in 2013 was 96.75%, with a Kappa index of 0.63. However, dissimilar values found between Omission and Commission indicators suggest that most of the expanded areas prior to 2013 (5.57 million ha) were under a high dynamical range of land uses. Although there is no direct relation between either the deforestation rate or expansion trends (first-time-use rate) and profit, the results strongly suggest (R 2 =0.81) that profit exerts a direct and non-negligible influence on the evolution of consolidated land use for soybean in Mato Grosso State. KEYWORDS: land use, agriculture, soybean mapping, Amazon biome Análise da expansão do cultivo da soja no sul da Amazônia brasileira utilizando imagens de satélite e sua relação com forçantes econômicas RESUMO A dinâmica agrícola relacionada à expansão da soja tem sido reconhecida como um dos principais fatores da excessiva conversão da cobertura do solo no Estado de Mato Grosso, no sudoeste da Amazônia brasileira. A hipótese de que o mercado de soja exerce influência no uso do solo, foi investigada pela associação de indicadores econômicos com a dinâmica da cultura de soja no Mato Grosso. Integramos séries históricas de dados de satélite para expansão da área de cultivo de soja e de suas duas principais variáveis econômicas associadas (preço de venda e custo de produção). Enfocamos a relação entre lucro (a diferença entre as médias do preço da soja e do custo de produção) e a conversão do uso do solo para soja de 2001 a 2013. A análise espacial explícita revelou que a precisão global na comparação entre o mapa resultante de first-time-use de cultivo de soja em 2013 foi de 96,75%, com índice Kappa de 0,63. Entretanto, a divergência obtida entre os indicadores de erro por comissão e omissão, sugerem que a maior parte da expansão da soja ocorrida antes de 2013 (5,57 milhões de ha) esteve sob influência de uma intensa dinâmica de uso do solo. Embora seja claro não haver relação direta entre a taxa de desmatamento ou tendências de expansão (taxa de uso pela primeira vez) e o lucro, os resultados sugerem fortemente (R 2 =0,81) que o lucro exerce influência direta e não-negligenciável na evolução do uso do solo consolidado com soja no estado de Mato Grosso. PALAVRAS-CHAVE: uso do solo, agricultura, mapeamento da soja, Bioma Amazônico
Transcript of Analysis of soybean cropland expansion in the southern ... · Analysis of soybean cropland...
281 VOL. 47(4) 2017: 281 - 292
http://dx.doi.org/10.1590/1809-4392201700543
ACTAAMAZONICA
Analysis of soybean cropland expansion in the southern Brazilian Amazon and its relation to economic drivers Anibal GUSSO1*, Jorge Ricardo DUCATI1, 2, Virindiana Colet BORTOLOTTO3 1 Federal University of Rio Grande do Sul, Institute of Physics, POBox 15051, 91501-970, Porto Alegre, Brazil2 Federal University of Rio Grande do Sul, Center for Remote Sensing and Meteorological Research, 91501-970, Porto Alegre, Brazil3 Federal University of Mato Grosso, Institute of Agricultural and Environmental Sciences, 78550-728, Sinop, Brazil
* Corresponding author: [email protected]
ABSTRACT The agricultural dynamics of soybean expansion have long been recognized as a major driver of excessive land cover change on the southwestern border of the Brazilian Amazon. The hypothesis that the soybean market exerts an influence on land use was investigated by the association between economic indicators and soybean crop dynamics in the state of Mato Grosso (western Brazil). We integrated a historical series of satellite data of soybean cropland expansion and the two main economic variables (selling prices and production costs) for soybean in Mato Grosso. We focused on the relation between profit (the difference between the average soybean price and production costs) and land-use transition to soybean from 2001 to 2013. The spatially explicit analysis showed that the overall accuracy between the resulting first-time use and the most recent soybean crop area in 2013 was 96.75%, with a Kappa index of 0.63. However, dissimilar values found between Omission and Commission indicators suggest that most of the expanded areas prior to 2013 (5.57 million ha) were under a high dynamical range of land uses. Although there is no direct relation between either the deforestation rate or expansion trends (first-time-use rate) and profit, the results strongly suggest (R2=0.81) that profit exerts a direct and non-negligible influence on the evolution of consolidated land use for soybean in Mato Grosso State. KEYWORDS: land use, agriculture, soybean mapping, Amazon biome
Análise da expansão do cultivo da soja no sul da Amazônia brasileira utilizando imagens de satélite e sua relação com forçantes econômicasRESUMOA dinâmica agrícola relacionada à expansão da soja tem sido reconhecida como um dos principais fatores da excessiva conversão da cobertura do solo no Estado de Mato Grosso, no sudoeste da Amazônia brasileira. A hipótese de que o mercado de soja exerce influência no uso do solo, foi investigada pela associação de indicadores econômicos com a dinâmica da cultura de soja no Mato Grosso. Integramos séries históricas de dados de satélite para expansão da área de cultivo de soja e de suas duas principais variáveis econômicas associadas (preço de venda e custo de produção). Enfocamos a relação entre lucro (a diferença entre as médias do preço da soja e do custo de produção) e a conversão do uso do solo para soja de 2001 a 2013. A análise espacial explícita revelou que a precisão global na comparação entre o mapa resultante de first-time-use de cultivo de soja em 2013 foi de 96,75%, com índice Kappa de 0,63. Entretanto, a divergência obtida entre os indicadores de erro por comissão e omissão, sugerem que a maior parte da expansão da soja ocorrida antes de 2013 (5,57 milhões de ha) esteve sob influência de uma intensa dinâmica de uso do solo. Embora seja claro não haver relação direta entre a taxa de desmatamento ou tendências de expansão (taxa de uso pela primeira vez) e o lucro, os resultados sugerem fortemente (R2=0,81) que o lucro exerce influência direta e não-negligenciável na evolução do uso do solo consolidado com soja no estado de Mato Grosso. PALAVRAS-CHAVE: uso do solo, agricultura, mapeamento da soja, Bioma Amazônico
282 VOL. 47(4) 2017: 281 - 292 GUSSO et al.
Analysis of soybean cropland expansion in the southern Brazilian Amazon and its relation to economic drivers
ACTAAMAZONICA
INTRODUCTIONBrazil’s federal government has encouraged the
development of agriculture in the southern frontier of the Brazilian Amazon since the 1970s, mainly due to prevailing favorable summertime climate conditions and physical landscape factors that are suitable for large-scale agriculture (Jasinski et al. 2005). In the 1990s, land-use practices were affected by market fluctuations, in part due to requirements to certify timber, beef, and soybean products imposed by market chain consumers (Espindola et al. 2012). In 2013, the state of Mato Grosso became the largest producer of soybean in Brazil and accounted for approximately 28.9% of national production (CONAB 2015). In the last two decades, the economic and environmental implications of increasing land area for soybean cultivation from deforestation and massive conversion of land use have become a major issue at the international policy agenda level (FAO 2011a; FAO 2011b). Also, at a global perspective, the impacts from economic instability were an equally major concern because prices were projected to increase throughout the 2020 decade above those of the past decade, especially due to higher production costs (FAO 2011b). Given these perceptions, the development and application of new methodologies using geospatial intelligence and analysis have become necessary for the implementation of a synergy between sustainable agricultural practices and decreasing environmental impacts.
In Brazil, several studies on spatially distributed data of agricultural statistics (Gusso et al. 2012; Arvor et al. 2011; Johan et al. 2012) have reported that official data released by two Brazilian agencies, namely, CONAB (Companhia Nacional de Abastecimento – National Company of Food Supply) and IBGE (Instituto Brasileiro de Geografia e Estatística – Brazilian Institute of Geography and Statistics), suffer from three main issues: (1) municipality statistics are not released shortly after a harvest, but nearly 18 months after the end of the soybean season; (2) official statistics lack associated digital/logical georeferenced information that can be used to provide spatial analysis of land-use and land-cover dynamics (Gusso et al. 2014); and (3) a historical compilation of crop management and crop rotation is impossible to provide, as there is no spatial information (as stated in item 2).
The wide timeframe and broad spatial coverage provided by remote sensing data have the potential to address these issues because the enhanced temporal resolution allows for the production of near-real-time estimates of agricultural statistics. Currently, the Moderate-Resolution Imaging Spectroradiometer (MODIS) sensor on board the Terra satellite provides an adequate imaging configuration for crop monitoring based on (1) an almost-daily revisit time; (2) a moderate spatial resolution of 250-m, considered adequate for mapping large-scale agricultural fields (Lobell and Asner
2004); and (3) a geometric quality that is high enough for time series analysis (Justice et al. 2002). A study conducted by Lobell and Asner (2004) concluded that MODIS images have considerable advantages in the characterization of extensive agricultural crops, mainly due to their higher temporal resolution, and many studies focused on Brazil have highlighted the efficiency of the MODIS time series of vegetation indices for mapping cropland, crop expansion (Morton et al. 2006; Macedo et al. 2006; Gusso et al. 2014, Zhu et al. 2016) and cropping system management (Galford et al. 2008; Arvor et al. 2012; Brown et al. 2013).
Investigations over several years have been carried out on the agricultural dynamics related to soybean crop expansion toward the Amazon biome as a major driver of land-use and land-cover changes in Mato Grosso (Fearnside 2001; Morton et al. 2006). According to official agricultural statistics, the soybean crop area has expanded 275% over the last 20 years (IBGE 2015). The total land-use shift into soybean in Mato Grosso from 2001 to 2011 was almost 8.7 million ha, of which almost 3.5 million ha belonged to the Brazilian Amazon biome (Gusso et al. 2014). Most of these areas are currently being gradually abandoned (Spera et al. 2014; Cohn et al. 2016).
Although the relation between soybean cultivation and deforestation has decreased in recent years due to new government policies (Arvor et al. 2012; Spera et al. 2014), there has been continuous land-use transition to soybean covering previously uncultivated areas (Cohn et al. 2016) whose drivers are still not well understood. Thus, in this study, we present the hypothesis that the soybean market has an influence on land use, and we investigate the association of economic environment indicators as drivers for soybean crop dynamics of land use and expansion. We integrate spatially based results of historical expansion trends of soybean from satellite data and the two main economic variables (selling prices and production costs) in the state of Mato Grosso. We focus in particular on the relation between profit (i.e., the difference between average soybean prices and soybean production costs) and the spatial configuration of land-use transition into soybean from 2001 to 2013.
To investigate the above issues, we applied the MODIS Crop Detection Algorithm (MCDA) as presented by Gusso et al. (2012) for generating annual soybean crop area maps and evaluating land-use practices. The reliability of this physically driven approach has been validated in two completely different regions for mapping soybean crops in Brazil: Rio Grande do Sul and Mato Grosso states. In Mato Grosso, Gusso et al. (2014) found an overall accuracy of 88.25% when comparing crop area maps from MCDA to official statistics from IBGE, and few adjustments to the parameters of the model were necessary when studying different ecoregions. We also briefly
283 VOL. 47(4) 2017: 281 - 292 GUSSO et al.
ACTAAMAZONICA Analysis of soybean cropland expansion in the southern Brazilian
Amazon and its relation to economic drivers
discuss some emerging land-use trends provided by remote sensing-based agricultural maps.
MATERIALS AND METHODSStudy area
The state of Mato Grosso (MT) is located in the southwestern portion of the Amazon basin and is characterized by three main biomes: the Brazilian cerrado, the Amazon rainforest and the Pantanal. Cultivation in MT is mostly rain-fed and the climate is tropical super humid (Af ), with dry periods during the winter season (Köppen 1948). The average annual precipitation is 1,610 mm, with a standard deviation of 264 mm (INMET 2009).
Data sources and proceduresWe used several datasets to represent the main physical
conditions and management practices found in Mato Grosso. We obtained soybean prices to producer and soybean production costs to producer at a yearly average basis. Annual costs were obtained from the average of three locations (Primavera do Leste, Sapezal and Sorriso) either for conventional or transgenic soybeans (CONAB 2017). We obtained soybean prices to producer at both a monthly and yearly average basis (CONAB 2015). Official historical series at state-scale agricultural statistics of the soybean crop area are also available at no charge at CONAB (2017). Official state-scale agricultural statistics of the soybean crop area are available at IBGE (2014). The official Amazon Biome Map from the Brazilian Environmental Ministry – Ministério do Meio Ambiente (MMA 2004), at a 1:5,000,000 scale, to define Amazon biome limits and their relation to crop expansion can be found at IBGE (2017). Official deforestation rates are from PRODES (Program for the Estimation of Amazon Deforestation) at INPE (National Institute for Space Research). The PRODES project, which monitors deforestation in the Brazilian Amazon region through satellite imagery, can be found at www.obt.inpe.br/prodes/index.php. We obtained MODIS EVI data (MOD13Q1 product, collections 5) covering all of Mato Grosso State (image tiles: H111V09, H11V10, H12V09, H12V10, H13V09 and H13V10) for the 2001-2013 study period. The EVI data were chosen for their potential to mitigate cloud cover effects and atmospheric and soil background effects (Huete et al. 2002; Justice et al. 2002). The EVI data are a 16-day composite with high radiometric and geometric corrections.
Time series analyses of MOD13Q1 products in a 250-m spatial resolution was used for (a) time series analysis of land-use dynamics and cropland expansion; (b) generation of thematic soybean maps for each soybean crop season; and (c) confusion matrix analysis (Producer and User accuracy) for evaluating land-use dynamics. The MODIS images and
products were pre-processed by the National Aeronautics and Space Administration (NASA) and are available at no charge at <https://lpdaac.usgs.gov/data_access/data_pool>; Landsat-7 ETM satellite data were used for a direct visual inspection analysis between the spectral response of soybean crop areas at false color composition (RGB 453). We compared the three available Landsat ETM dates (11 January 2008, 26 December 2011, 28 December 2012) covering sites near the soybean cultivation frontier to the MCDA map of the 2008, 2012 and 2013 crop seasons, respectively.
Data validationThree types of datasets were obtained to validate our
approach at different scales: state-level, municipality-level and pixel-level datasets. First, we used annual soybean agricultural statistics at the state and municipality levels from IBGE and CONAB for the entire study area. In this validation step, we analyzed the reliability of MCDA to estimate first-time-use soybean areas. Second, we compared soybean cropland estimates from MCDA in Mato Grosso to the official estimates provided by IBGE and CONAB at the State scale. Third, we used Landsat-7 ETM to identify soybean cropland areas by direct visual inspection with bands combination RGB 453. Fourth, we analyzed the historical EVI profile of the new cropland areas detected in the 2013 crop season.
Methodology for new soybean cropland identificationThere is substantial variability in planting and maturing
soybean crops within the same general area (Brown et al. 2013). For this reason, the use of a fixed calendar date to study remote sensing-based yield-prediction models is not optimal (Bolton and Friedl 2013; Gusso et al. 2017). We applied the MCDA approach by using MODIS/Terra EVI (i.e., the Enhanced Vegetation Index) data at a 250-m spatial resolution and a 16-day temporal resolution (MOD13Q1 product). MCDA can locate the planting date during the period between late August to late October (DOY 225 to 289). This application was developed for different conditions and ecoregions in Brazil and its reliability was exhaustively tested as a crop-monitoring model during initial efforts for the inception of satellite data analysis in the Soy Moratorium Project (ABIOVE 2010). The entire methodology is detailed in Gusso et al. (2012) and has also been validated for MT by Gusso et al. (2014) using field campaign data. The results at the municipality scale showed that MCDA estimates at 250-m resolution were highly correlated with IBGE (Instituto Brasileiro de Geografia e Estatística) data, with an R2 equal to 0.97 and an RMSD equal to 13,142 ha.
The Brazilian official statistics available as economic and cropland data cannot be evaluated using a geospatial approach or a spatial dynamic trend. Hence, the use of spatial information for crop area mapping and monitoring is
284 VOL. 47(4) 2017: 281 - 292 GUSSO et al.
Analysis of soybean cropland expansion in the southern Brazilian Amazon and its relation to economic drivers
ACTAAMAZONICA
important for tracking crop sites where new cropland areas are expanding and sites where agricultural intensification and sustainable agriculture prevail.
As a first step, we compared general results from the resulting map of first-time-use soybean area classifications to state averages of official economic and cropland data. The first-time-use map is based on crop area estimations from the MCDA procedure. It is a thematic map expressed under a binary code, where 1 means soybean and 0 means non-soybean, obtained by the application of a Boolean rule running at the object-oriented programming environment from ERDAS/Modeler software. Soybean cropland estimations are only available as EVI/MODIS data from 2001 to 2013. In the present study, therefore, the approach used to identify profit impacts on cropland expansion was to compare the results obtained from MCDA maps of soybean cropland to annual profit averages. Once we obtained the crop area maps for every single crop season between 2001 and 2013, a pixel was tagged as a new soybean cropland area if it was the first time it appeared as a soybean crop area since 2001. The first-time-use rate of soybean crop areas was obtained by comparing the current crop season to all previous crop seasons. Thus, pixels that were previously identified at least once as a soybean crop area were not tagged as new cropland on other crop season maps, so that the entire first-time-use map is the accumulated first-time-use rate (ha/year) from each year. Finally, profit was calculated as the difference between prices and costs.
RESULTSBy applying the MCDA model, we directly obtained
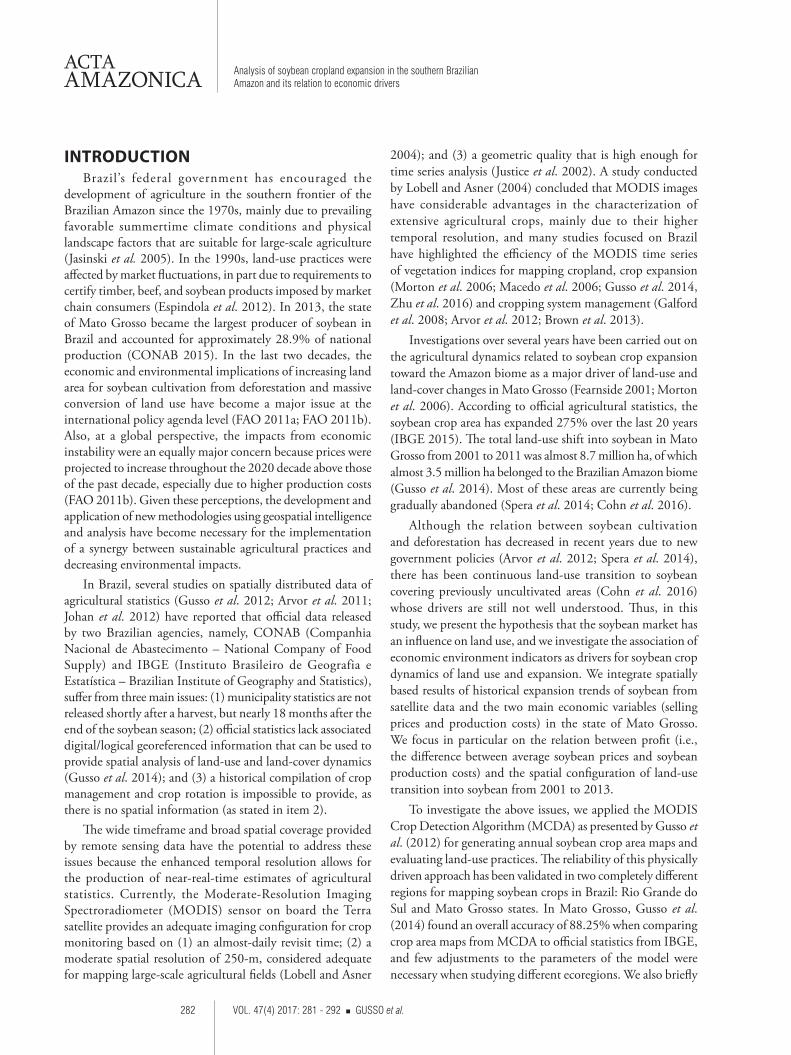
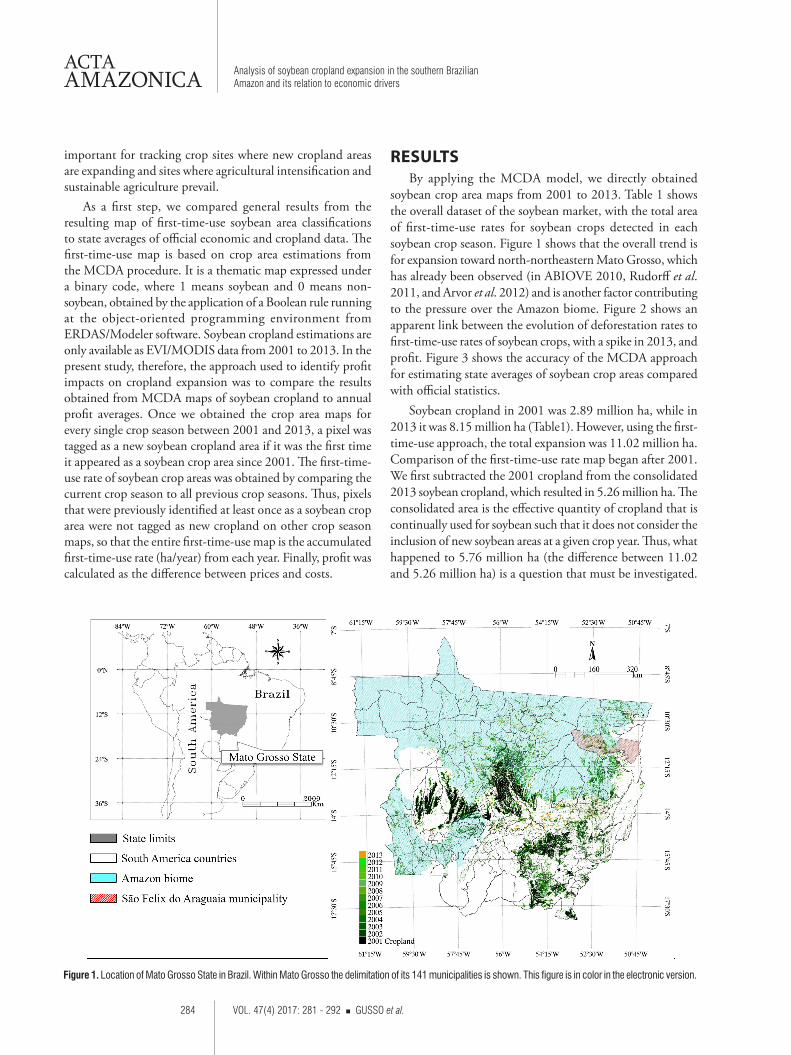
soybean crop area maps from 2001 to 2013. Table 1 shows the overall dataset of the soybean market, with the total area of first-time-use rates for soybean crops detected in each soybean crop season. Figure 1 shows that the overall trend is for expansion toward north-northeastern Mato Grosso, which has already been observed (in ABIOVE 2010, Rudorff et al. 2011, and Arvor et al. 2012) and is another factor contributing to the pressure over the Amazon biome. Figure 2 shows an apparent link between the evolution of deforestation rates to first-time-use rates of soybean crops, with a spike in 2013, and profit. Figure 3 shows the accuracy of the MCDA approach for estimating state averages of soybean crop areas compared with official statistics.
Soybean cropland in 2001 was 2.89 million ha, while in 2013 it was 8.15 million ha (Table1). However, using the first-time-use approach, the total expansion was 11.02 million ha. Comparison of the first-time-use rate map began after 2001. We first subtracted the 2001 cropland from the consolidated 2013 soybean cropland, which resulted in 5.26 million ha. The consolidated area is the effective quantity of cropland that is continually used for soybean such that it does not consider the inclusion of new soybean areas at a given crop year. Thus, what happened to 5.76 million ha (the difference between 11.02 and 5.26 million ha) is a question that must be investigated.
Figure 1. Location of Mato Grosso State in Brazil. Within Mato Grosso the delimitation of its 141 municipalities is shown. This figure is in color in the electronic version.
285 VOL. 47(4) 2017: 281 - 292 GUSSO et al.
ACTAAMAZONICA Analysis of soybean cropland expansion in the southern Brazilian
Amazon and its relation to economic drivers
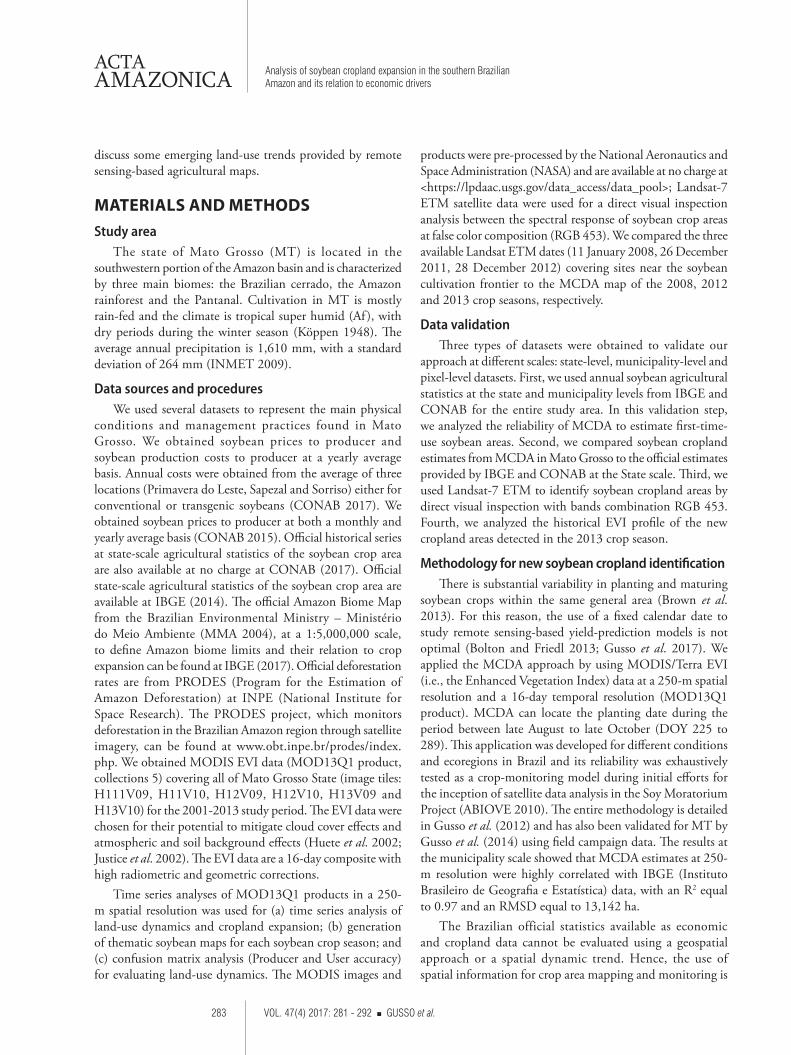
Table 1. Comparison of selling prices, production cost and profit with estimated cropland and first-time-use areas and deforestation in Mato Grosso State between 2001 and 2013. Graphical representation of presented relations are given in Figures 2 and 3.
Soybean market (US$/60 kg) Soybean crop areas (thousand ha) Deforestation (thousand ha)
Crop year Price Cost Profit Cropland MCDA First-time use MCDA PRODES
2001 7.94 7.01 0.93 2,894.1 - 770.32002 10.04 7.75 2.29 3,861.1 1,573.5 789.22003 14.89 10.60 4.29 4,345.0 1,311.1 1,040.52004 17.16 11.99 5.17 5,169.0 1,364.8 1,181.42005 11.42 13.50 -2.08 6,265.9 1,519.8 714.52006 9.35 13.98 -4.63 6,040.5 904.7 433.32007 12.37 13.91 -1.54 5,272.7 599.8 267.82008 17.80 17.49 0.31 5,664.9 693.4 325.82009 18.01 16.72 1.29 6,001.8 562.8 104.92010 15.52 15.28 0.24 6,047.6 399.5 87.12011 18.25 16.05 2.19 6,374.2 557.7 112.02012 26.71 18.84 7.86 6,864.0 234.5 75.72013 24.83 17.53 7.31 8,148.0 1,301.3 113.9
Figure 2. Evolution of soybean profit (difference between average soybean price and production costs) and total expansion of first-time use of soybean crop areas from 2001 to 2013.
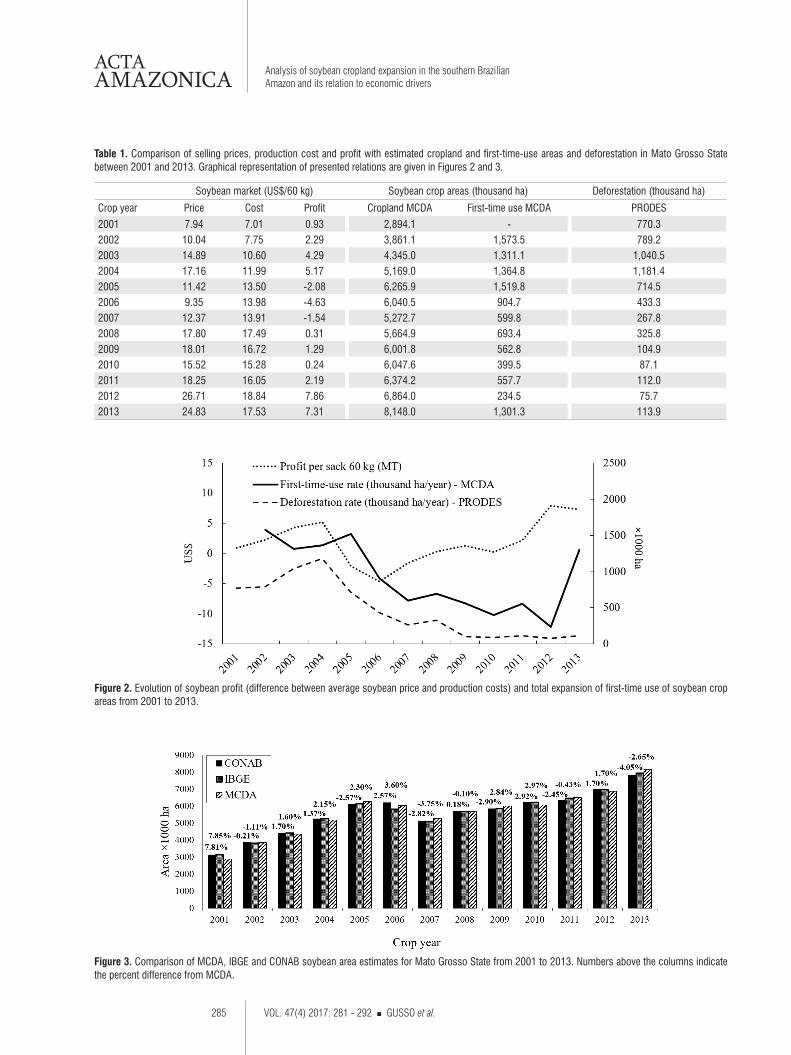
Figure 3. Comparison of MCDA, IBGE and CONAB soybean area estimates for Mato Grosso State from 2001 to 2013. Numbers above the columns indicate the percent difference from MCDA.
286 VOL. 47(4) 2017: 281 - 292 GUSSO et al.
Analysis of soybean cropland expansion in the southern Brazilian Amazon and its relation to economic drivers
ACTAAMAZONICA
Validation of detected first-time-use areas Except for the first year, with a value of 7.85%, the
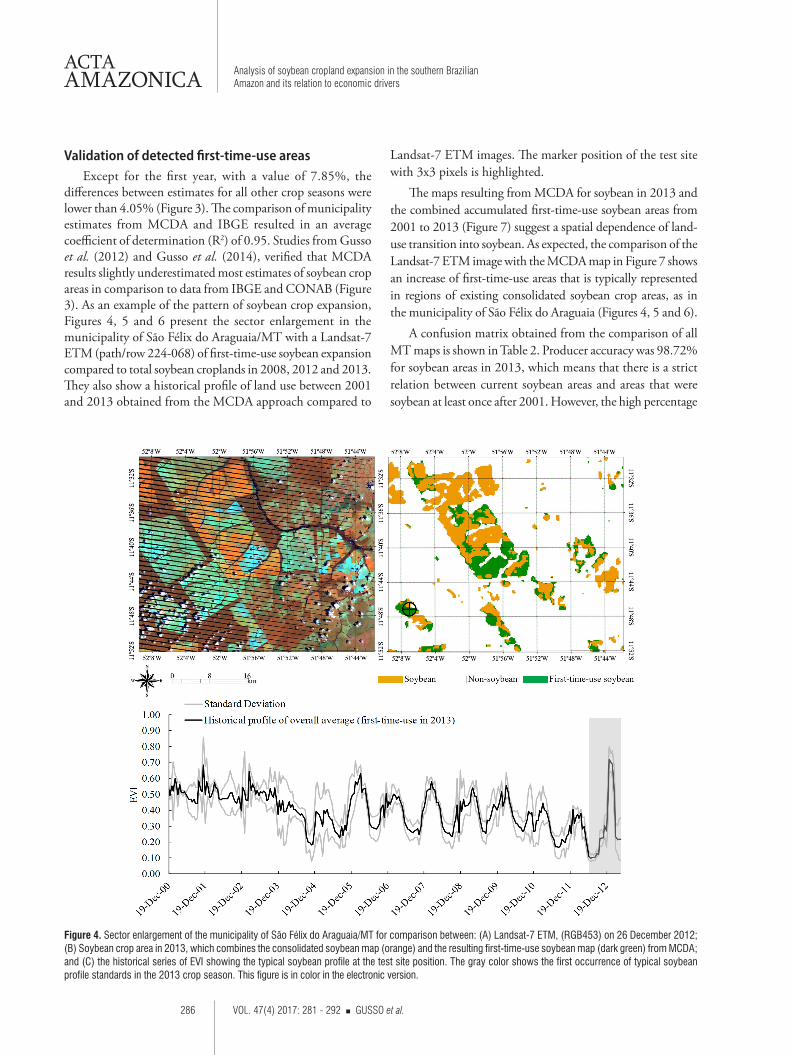
differences between estimates for all other crop seasons were lower than 4.05% (Figure 3). The comparison of municipality estimates from MCDA and IBGE resulted in an average coefficient of determination (R2) of 0.95. Studies from Gusso et al. (2012) and Gusso et al. (2014), verified that MCDA results slightly underestimated most estimates of soybean crop areas in comparison to data from IBGE and CONAB (Figure 3). As an example of the pattern of soybean crop expansion, Figures 4, 5 and 6 present the sector enlargement in the municipality of São Félix do Araguaia/MT with a Landsat-7 ETM (path/row 224-068) of first-time-use soybean expansion compared to total soybean croplands in 2008, 2012 and 2013. They also show a historical profile of land use between 2001 and 2013 obtained from the MCDA approach compared to
Landsat-7 ETM images. The marker position of the test site with 3x3 pixels is highlighted.
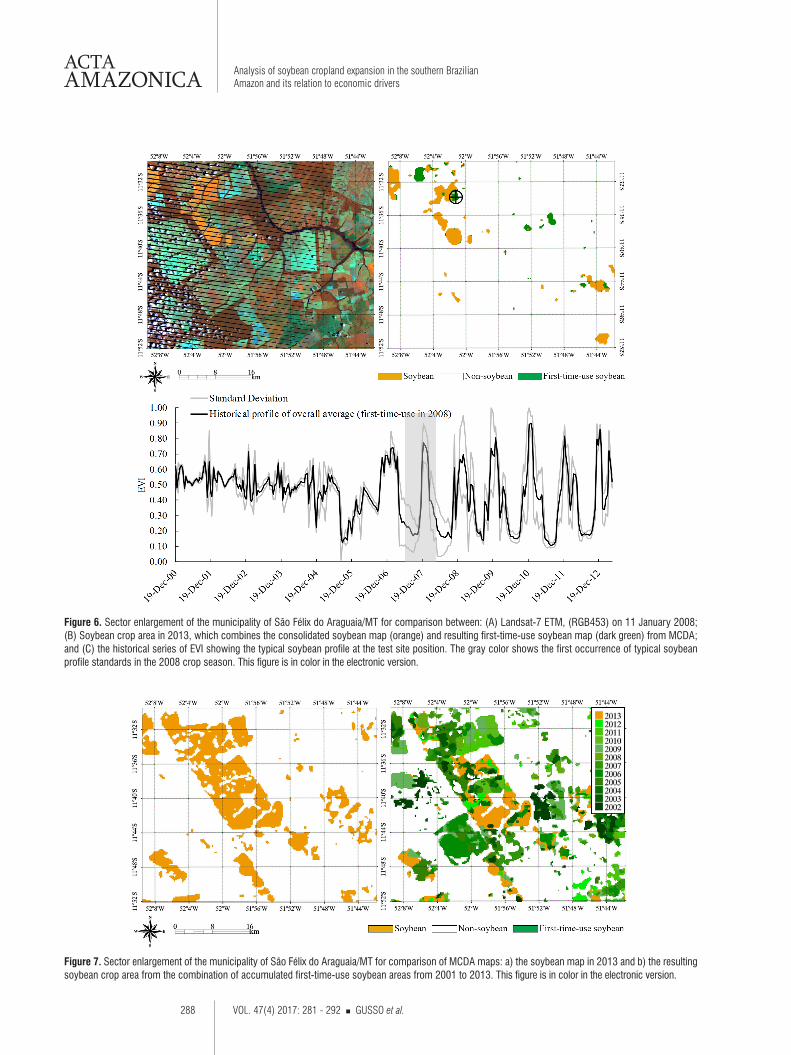
The maps resulting from MCDA for soybean in 2013 and the combined accumulated first-time-use soybean areas from 2001 to 2013 (Figure 7) suggest a spatial dependence of land-use transition into soybean. As expected, the comparison of the Landsat-7 ETM image with the MCDA map in Figure 7 shows an increase of first-time-use areas that is typically represented in regions of existing consolidated soybean crop areas, as in the municipality of São Félix do Araguaia (Figures 4, 5 and 6).
A confusion matrix obtained from the comparison of all MT maps is shown in Table 2. Producer accuracy was 98.72% for soybean areas in 2013, which means that there is a strict relation between current soybean areas and areas that were soybean at least once after 2001. However, the high percentage
Figure 4. Sector enlargement of the municipality of São Félix do Araguaia/MT for comparison between: (A) Landsat-7 ETM, (RGB453) on 26 December 2012; (B) Soybean crop area in 2013, which combines the consolidated soybean map (orange) and the resulting first-time-use soybean map (dark green) from MCDA; and (C) the historical series of EVI showing the typical soybean profile at the test site position. The gray color shows the first occurrence of typical soybean profile standards in the 2013 crop season. This figure is in color in the electronic version.
287 VOL. 47(4) 2017: 281 - 292 GUSSO et al.
ACTAAMAZONICA Analysis of soybean cropland expansion in the southern Brazilian
Amazon and its relation to economic drivers
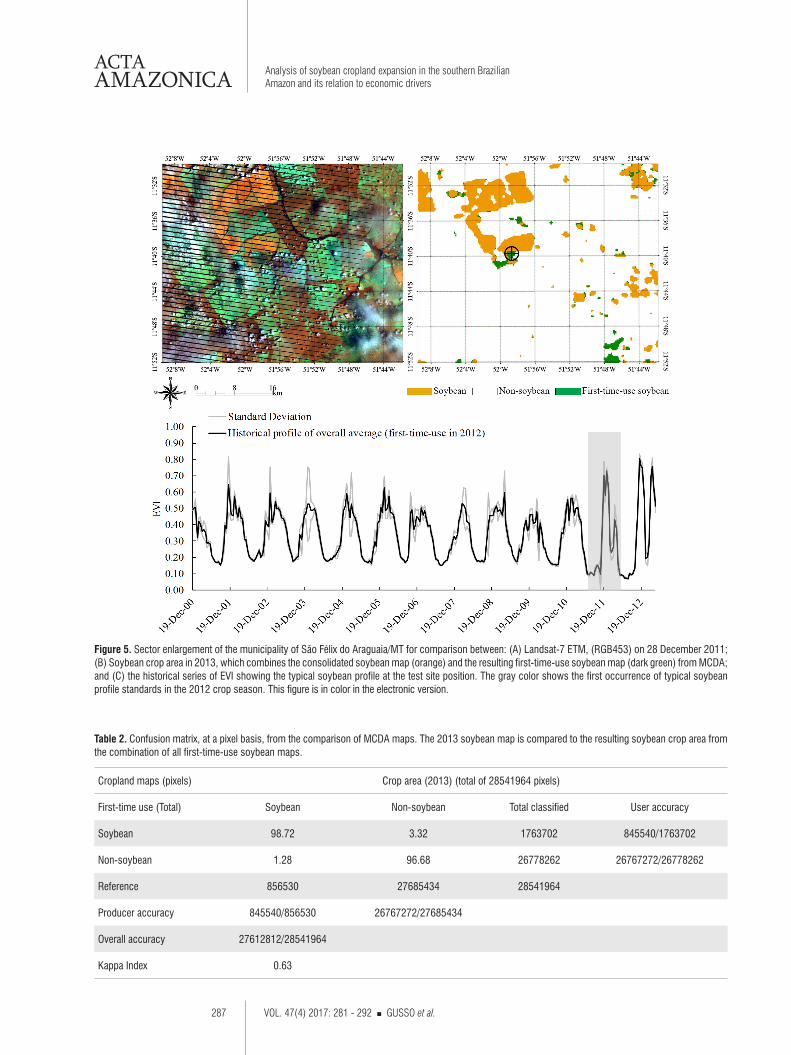
Figure 5. Sector enlargement of the municipality of São Félix do Araguaia/MT for comparison between: (A) Landsat-7 ETM, (RGB453) on 28 December 2011; (B) Soybean crop area in 2013, which combines the consolidated soybean map (orange) and the resulting first-time-use soybean map (dark green) from MCDA; and (C) the historical series of EVI showing the typical soybean profile at the test site position. The gray color shows the first occurrence of typical soybean profile standards in the 2012 crop season. This figure is in color in the electronic version.
Table 2. Confusion matrix, at a pixel basis, from the comparison of MCDA maps. The 2013 soybean map is compared to the resulting soybean crop area from the combination of all first-time-use soybean maps.
Cropland maps (pixels) Crop area (2013) (total of 28541964 pixels)
First-time use (Total) Soybean Non-soybean Total classified User accuracy
Soybean 98.72 3.32 1763702 845540/1763702
Non-soybean 1.28 96.68 26778262 26767272/26778262
Reference 856530 27685434 28541964
Producer accuracy 845540/856530 26767272/27685434
Overall accuracy 27612812/28541964
Kappa Index 0.63
288 VOL. 47(4) 2017: 281 - 292 GUSSO et al.
Analysis of soybean cropland expansion in the southern Brazilian Amazon and its relation to economic drivers
ACTAAMAZONICA
Figure 6. Sector enlargement of the municipality of São Félix do Araguaia/MT for comparison between: (A) Landsat-7 ETM, (RGB453) on 11 January 2008; (B) Soybean crop area in 2013, which combines the consolidated soybean map (orange) and resulting first-time-use soybean map (dark green) from MCDA; and (C) the historical series of EVI showing the typical soybean profile at the test site position. The gray color shows the first occurrence of typical soybean profile standards in the 2008 crop season. This figure is in color in the electronic version.
Figure 7. Sector enlargement of the municipality of São Félix do Araguaia/MT for comparison of MCDA maps: a) the soybean map in 2013 and b) the resulting soybean crop area from the combination of accumulated first-time-use soybean areas from 2001 to 2013. This figure is in color in the electronic version.
289 VOL. 47(4) 2017: 281 - 292 GUSSO et al.
ACTAAMAZONICA Analysis of soybean cropland expansion in the southern Brazilian
Amazon and its relation to economic drivers
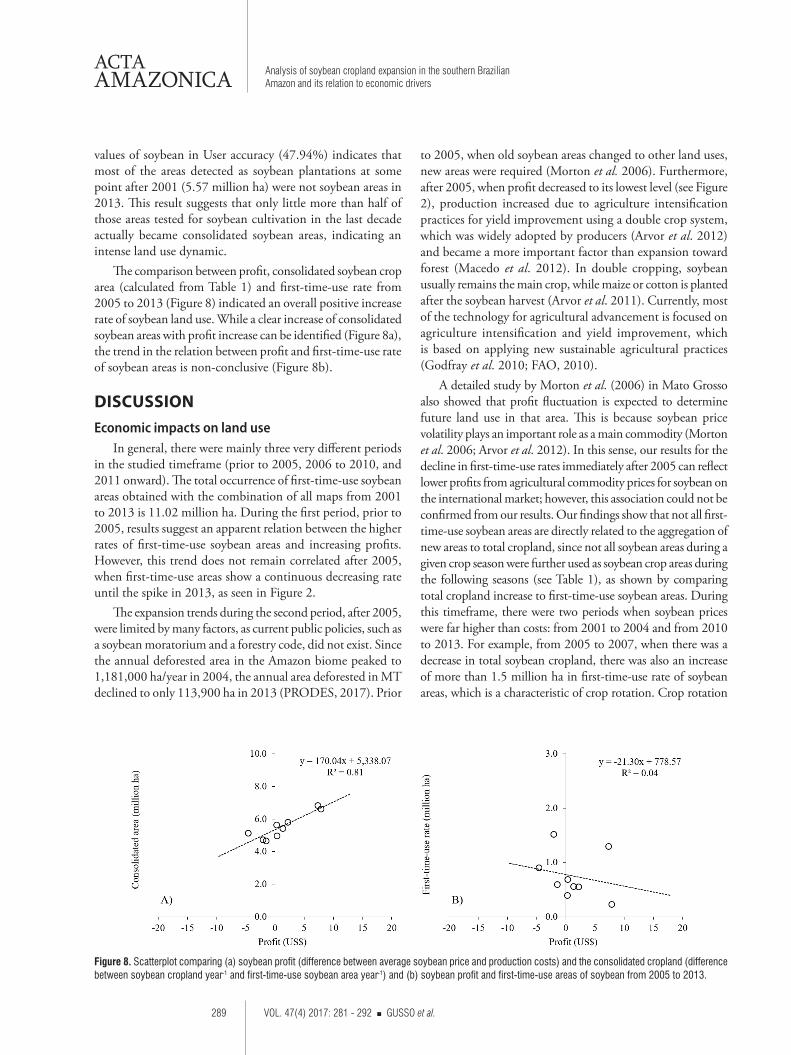
Figure 8. Scatterplot comparing (a) soybean profit (difference between average soybean price and production costs) and the consolidated cropland (difference between soybean cropland year-1 and first-time-use soybean area year-1) and (b) soybean profit and first-time-use areas of soybean from 2005 to 2013.
values of soybean in User accuracy (47.94%) indicates that most of the areas detected as soybean plantations at some point after 2001 (5.57 million ha) were not soybean areas in 2013. This result suggests that only little more than half of those areas tested for soybean cultivation in the last decade actually became consolidated soybean areas, indicating an intense land use dynamic.
The comparison between profit, consolidated soybean crop area (calculated from Table 1) and first-time-use rate from 2005 to 2013 (Figure 8) indicated an overall positive increase rate of soybean land use. While a clear increase of consolidated soybean areas with profit increase can be identified (Figure 8a), the trend in the relation between profit and first-time-use rate of soybean areas is non-conclusive (Figure 8b).
DISCUSSIONEconomic impacts on land use
In general, there were mainly three very different periods in the studied timeframe (prior to 2005, 2006 to 2010, and 2011 onward). The total occurrence of first-time-use soybean areas obtained with the combination of all maps from 2001 to 2013 is 11.02 million ha. During the first period, prior to 2005, results suggest an apparent relation between the higher rates of first-time-use soybean areas and increasing profits. However, this trend does not remain correlated after 2005, when first-time-use areas show a continuous decreasing rate until the spike in 2013, as seen in Figure 2.
The expansion trends during the second period, after 2005, were limited by many factors, as current public policies, such as a soybean moratorium and a forestry code, did not exist. Since the annual deforested area in the Amazon biome peaked to 1,181,000 ha/year in 2004, the annual area deforested in MT declined to only 113,900 ha in 2013 (PRODES, 2017). Prior
to 2005, when old soybean areas changed to other land uses, new areas were required (Morton et al. 2006). Furthermore, after 2005, when profit decreased to its lowest level (see Figure 2), production increased due to agriculture intensification practices for yield improvement using a double crop system, which was widely adopted by producers (Arvor et al. 2012) and became a more important factor than expansion toward forest (Macedo et al. 2012). In double cropping, soybean usually remains the main crop, while maize or cotton is planted after the soybean harvest (Arvor et al. 2011). Currently, most of the technology for agricultural advancement is focused on agriculture intensification and yield improvement, which is based on applying new sustainable agricultural practices (Godfray et al. 2010; FAO, 2010).
A detailed study by Morton et al. (2006) in Mato Grosso also showed that profit fluctuation is expected to determine future land use in that area. This is because soybean price volatility plays an important role as a main commodity (Morton et al. 2006; Arvor et al. 2012). In this sense, our results for the decline in first-time-use rates immediately after 2005 can reflect lower profits from agricultural commodity prices for soybean on the international market; however, this association could not be confirmed from our results. Our findings show that not all first-time-use soybean areas are directly related to the aggregation of new areas to total cropland, since not all soybean areas during a given crop season were further used as soybean crop areas during the following seasons (see Table 1), as shown by comparing total cropland increase to first-time-use soybean areas. During this timeframe, there were two periods when soybean prices were far higher than costs: from 2001 to 2004 and from 2010 to 2013. For example, from 2005 to 2007, when there was a decrease in total soybean cropland, there was also an increase of more than 1.5 million ha in first-time-use rate of soybean areas, which is a characteristic of crop rotation. Crop rotation
290 VOL. 47(4) 2017: 281 - 292 GUSSO et al.
Analysis of soybean cropland expansion in the southern Brazilian Amazon and its relation to economic drivers
ACTAAMAZONICA
is characterized by a shift either of other use types to soybean or of some soybean areas to other uses. However, even when profit was negative (US$ -2.80 and US$ -4.63), in 2005 and 2006, respectively, the total soybean crop area increased continuously.
Although not conclusive, the integrative analysis in Figure 8 suggests that a stable and more profitable economic environment can overrule the need for opening new production areas. Therefore, depending on future Brazilian agriculture scenarios, which remain largely undetermined (Lapola et al. 2013; Cohn et al. 2016) in terms of either climatic or economic perspectives, we may eventually see an increasing rate of soybean cropland (Kang et al. 2009). Although recent studies (ABIOVE 2010; Macedo et al. 2012) have found no significant relation between soybean expansion and deforestation, it is very difficult to accurately determine the major drivers relating to land-use change and deforestation. Decreases in deforestation rates after 2005 may be partially explained by increases in soybean production costs, which decreased profitability during the first half of the decade (Macedo et al. 2012). In fact, new areas for soybean (detected as first-time use) do not necessarily mean deforestation, but certainly a rearrangement of previous agricultural land-use configuration. Even so, the total detected occurrence of first-time-use areas between 2001 and 2013 was 11.02 million ha.
The most recent spike in first-time use of soybean areas in 2013 (see Figure 2), spread over the entire state, exhibits a clear decoupling of deforestation for soybean cultivation, as already evidenced in previous studies by Macedo et al. (2012) and Lapola et al. (2014), even though in the past, conversion to cropland contributed substantially to deforested areas (Espindola et al. 2012), However, this also suggests that the recent slowdown in soybean expansion areas is related more to economic conditions than to agricultural land quality. Ultimately, cultivation of lower-quality agricultural land also depends on the overall economic environment, given its association with profit.
Regarding mapping accuracy, it is important to note that the MCDA model was developed with a focus on soybean crop area identification. Although it is expected that MCDA can easily detect soybean crops in consolidated or recurring areas, as shown in studies by Gusso et al. (2012), Gusso et al. (2014), and Gusso et al. (2017), agricultural practices and dynamics in MT are evolving rapidly. Regarding the prevailing physically driven conditions in the last decade, intensive practices such as double cropping have been widely adopted in Mato Grosso, which is an additional challenge for accurate crop area mapping (Arvor et al. 2012a). Usually, in agricultural frontiers, the prevailing physically driven conditions of new cropland do not perform the typical soybean profile development because of land-use characterization (Jasinsky et al. 2005; ABIOVE, 2010; Macedo et al. 2012; Spera et al. 2012). Thus, difficulty in the
estimation of first-time-use soybean areas is probably related to the generation of thematic maps using the MCDA procedure.
The MCDA approach establishes input parameters as fixed criteria; therefore, the same input parameters are used independently of the evolution of management practices and crop year dynamics during the entire evaluated period, from 2001 to 2013. In this way, natural vegetation cover in the region, which is typical of the Cerrado biome, causes some confusion when one detects soybean development at the beginning of the rainy season (Arvor et al. 2011). The sowing period (DOY 225 to 337) often starts in September, but the beginning of the sowing period is determined by the rainfall in each crop year, in agreement with the soybean zoning provided by MAPA (2009). Usually, the duration of the rainy season is related mainly to the onset date (Arvor et al. 2014). During the sowing period, especially in MT, increasing EVI/MODIS values are observed because of rapid and intense plant growth; maximum values are reached after a relatively short period (Wardlow et al. 2007). Using MODIS data in Mato Grosso, Arvor et al. (2011) evaluated the vegetation profile of different crops and the double crop system during the 2006 and 2007 crop years and found that the double crop system can potentially reduce accuracy. For soybean, the double crop system forms nearly 30% of the soybean crop area (Arvor et al. 2011).
Soybean field size can also cause considerable differences in classification results. Gusso et al. (2012) and Gusso et al. (2014) observed that MCDA generated better results when croplands were larger than 50,000 ha in which the physically driven environment of MCDA was developed: the State of Rio Grande do Sul. Thus, croplands with smaller areas were more subject to error than those with larger areas; this is consistent with a previous analysis in Mato Grosso by ABIOVE (2010) and Lobell and Asner (2004).
Another important source of inaccuracy in cropland estimation is image quality. Cloud contamination exerts a confusing factor during key periods of the vegetation profile (DOY 353 to 033). For the operation of MCDA, cloud contamination is the most significant cause of misidentification and the most difficult one to solve, considering that the model is based on an analysis of the growth rate of vegetation through time. The above-mentioned circumstances together may reduce MCDA performance in a random way (Gusso et al. 2014).
CONCLUSIONSOur results indicate that a spatially explicit analysis of
land-use transition into soybean not only improved the understanding of cropland expansion drivers linked to profit, but also showed a clear relation between land-use evolution and profit in the region. In this context, when compared
291 VOL. 47(4) 2017: 281 - 292 GUSSO et al.
ACTAAMAZONICA Analysis of soybean cropland expansion in the southern Brazilian
Amazon and its relation to economic drivers
to current official methods for soybean area estimation in Brazil, accurate spatial analysis provided by accurate models can offer a better understanding of the most recent soybean expansion trends. Our results also indicate that there is no clear direct relation of either deforestation rates or expansion trends (first-time-use rates) with profit; however, our results strongly suggest (from a R2=0.81) that profit exerts a direct and non-negligible influence on the evolution of consolidated land use for soybean in Mato Grosso State.
ACKNOWLEDGMENTSThanks are due to the to the National Aeronautical and
Space Administration for the free and easily accessible MODIS data products available for environmental and agricultural science research around the world.
REFERENCESABIOVE. 2010. Soy Moratorium Report: mapping & monitoring of
soy plantings in the amazon biome in the third year (www.abiove.com.br/english/sustent/relatorio09/moratoria09_relatorio_jul10_us.pdf ). Accessed on 01/06/2013.
Arvor, D.; Dubreuil, V.; Ronchail, J.; Meirelles, M.; Funatsu, B.M. 2014. Spatial patterns of rainfall regimes related to levels of double cropping agriculture systems in Mato Grosso (Brazil). International Journal of Climatology, 34: 2622–2633.
Arvor, D.; Jonathan, M.; Meirelles, M.S.P; Dubreuil, V.; Durieux, L. 2011. Classification of MODIS EVI time series for crop mapping in the State of Mato Grosso, Brazil. International Journal of Remote Sensing, 29: 1- 25.
Arvor, D.; Meirelles, M.; Dubreuil, V.; Begue, A.; Shimabukuro, Y. E. 2012. Analyzing the agricultural transition in Mato Grosso, Brazil, using satellite-derived indices. Applied Geography, 32: 702-713.
Bolton, D.K.; Friedl, M.A. 2002. Forecasting crop yield using remotely sensed vegetation indices and crop phenology metrics. Agricultural and Forest Meteorology, 173: 74–84.
BCB, Banco Central do Brasi l . 2017. (www.bcb.gov.br/?FALECONOSCO). Acessed on 21/05/2017.
CONAB. 2017. (http://www.conab.gov.br/conteudos.php?a=1555&t=2>). Acessed on 19/05/2017.
CONAB. 2015. (http://sisdep.conab.gov.br/precosiagroweb/>). Acessed on 15/12/2015
MMA. 2004. Biomas (http://mapas.mma.gov.br/i3geo/datadownload.htm). Acessed on 03/10/2009.
MAPA. 2009. Zoneamento Agrícola para a cultura de soja no Estado do Mato Grosso. Diário Oficial da União (D.O.U.), issue 21/07/2009.
IBGE. 2017. Mapas de biomas e de vegetação (http://www.ibge.gov.br/home/presidencia/noticias/21052004biomashtml.shtm).
INPE. 2012. Projeto PRODES (http://obt.inpe.br/prodes/index.php). Acessed on 17/02/2012.
Brown, J.C.; Kastens, J.H.; Coutinho, A.C.; Victoria, D.C.; Bishop, C.R. 2013. Classifying multiyear agricultural land use data from Mato Grosso using time-series MODIS vegetation index data. Remote Sensing of Environment, 130: 39-50.
Cohn, A.S.; VanWey, L.K.; Spera, S.A.; Mustard, J.F. 2016. Cropping frequency and area response to climate variability can exceed yield response. Nature Climate Change, 6: 601–604.
CONAB, 2015. Séries históricas (http://www.conab.gov.br/conteudos.php?a=1252). Accessed on 01/10/2015.
Espindola, G.M; Aguiar, A.P.D.; Pebesma, E.; Câmara, G.; Fonseca, L. 2012. Agricultural land use dynamics in the Brazilian Amazon based on remote sensing and census data. Applied Geography, 32: 240-252.
FAO. 2011a. The State of Food Insecurity in the World (http://www.fao.org/docrep/013/i2050e/i2050e07.pdf). Accessed on 12/01/2016.
FAO. 2011b. World Food and Agriculture in Review (http://www.fao.org/docrep/013/i2050e/i2050e07.pdf). Accessed on 12/01/2016.
Galford, G.L.; Mustard, J.F.; Melillo, J.; Gendrin, A.; Cerri, C.C.; Cerri, C.E.P. 2008. Wavelet analysis of MODIS time series to detect expansion and intensification of row crop agriculture in Brazil. Remote Sensing of Environment, 112: 576-587.
Godfray, H.C.J.; Beddington, J.R.; Crute, I.R.; Haddad, L.; Lawrence, D.; Muir, J.F.; Pretty, J.; Robinson, S.; Thomas, S.M.; Toulmin, C. 2010. Food security: The challenge of feeding 9 billion people. Science, 327: 812-817.
Gusso, A.; Arvor, D.; Ducati, J.R.; Veronez, M.R.; Silveira, L.G. 2014. Assessing the MODIS Crop Detection Algorithm for soybean crop area mapping and expansion in the Mato Grosso State, Brazil. The Scientific World Journal, 863141.
Gusso, A.; Formaggio, A.R.; Rizzi, R.; Adami, M.; Rudorff, B.T.F. 2012. Soybean crop area estimation by MODIS/EVI data. Pesquisa Agropecuária Brasileira, 47: 425-435.
Gusso, A; Arvor, D.; Ducati, J.R. 2017. Model for soybean production forecast based on the prevailing physical conditions. Pesquisa Agropecuária Brasileira, 52: 95-103.
Huete, A.; Didan, K.; Miura, T.; Rodriguez, E.P.; Gao, X.; Ferreira, L.G. 2002. Overview of the radiometric and biophysical performance of the MODIS vegetation indices. Remote Sensing of Environment, 83: 195-213.
IBGE, 2014. Produção agrícola municipal - Automatic Data Recovery System – SIDRA (www.sidra.ibge.gov.br/). Accessed on 15/07/2014.
Jasinski, E.; Morton, D.; DeFries, R.; Shimabukuro, Y.; Anderson, L.; Hansen, M. 2005. Physical landscape correlates of the expansion of mechanized agriculture in Mato Grosso, Brazil. Earth Interactions, 9: 1-18.
Johann, J.A.; Rocha, J.V.; Duft, D.G.; Lamparelli, R.A.C. 2012. Estimativa de áreas com culturas de verão no Paraná, por meio de imagens multitemporais EVI/Modis. Pesquisa Agropecuária Brasileira, 47: 1295-1306.
Justice, C.O.; Townshend, J.R.G.; Vermote, E.F.; Masuoka, E.; Wolfe, R.E.; Saleous, N.; Roy, D. P.; Morisette, J.T. 2002. An overview of MODIS Land data processing and product status. Remote Sensing of Environment, 83: 3-15.
292 VOL. 47(4) 2017: 281 - 292 GUSSO et al.
Analysis of soybean cropland expansion in the southern Brazilian Amazon and its relation to economic drivers
ACTAAMAZONICA
Kang, Y.; Khan, S.; Ma, X. 2009. Climate change impacts on crop yield, crop water productivity and food security – A review. Progress in Natural Science, 19: 1665–1674
Köppen, W. 1948. Climatologia: Con un estúdio de los climas de la Tierra; fondo de cultura econômica. Tlalpan, Mexico, 466p.
Lapola, D.M.; Martinelli, L.A.; Peres, C.A.; Ometto, J.P.H.B.; Ferreira, M.E.; Nobre, C.A.; Aguiar, A.P.D.; Bustamante, M.M.C.; Cardoso, M.F.; Costa, M.H.: et al. 2014. Pervasive transition of the Brazilian land-use system. Nature Climate Change, 4: 27-35.
Lobell, D.B.; Asner, G.P. 2004. Cropland distributions from temporal unmixing of MODIS data. Remote Sensing of Environment, 93: 412-422.
Macedo, M.N.; DeFries, R.S.; Morton, D.C.; Stickler, C.M.; Galford, G.L.; Shimabukuro, Y.E. 2006. Decoupling of deforestation and soy production in the southern Amazon during the late 2000s. Proceedings of the National Academy of Sciences, 109: 1341–1346.
Morton, D.C.; DeFries, R.S.; Shimabukuro, Y.E.; Anderson, L.O.; Arai, E.; Espirito-Santo, F. d-B.; Freitas, R.; Morissete, J. 2006. Cropland expansion changes deforestation dynamics in the southern Brazilian Amazon. Proceedings of the National Academy of Sciences, 103: 14637–14641.
Rizzi, R.; Rudorff, B.F.T. 2005. Estimativa da área plantada com soja no Rio Grande do Sul por meio de imagens Landsat. Revista Brasileira de Cartografia, 57: 226-234.
Rudorff, B.F.T.; Adami, M.; Aguiar, D.A.; Moreira, M.A.; Mello, M.P.; Fabiani, L.; Amaral, D.F.; Pires, B.M. 2011. The Soy Moratorium in the amazon biome monitored by remote sensing images. Remote Sensing, 4: 1853-202.
Spera, S.A.; Cohn, A.S.; Wey, L.K.V.; Mustard, J.F.; Rudorff, B.F.; Risso, J.; Adami, M. 2014. Recent cropping frequency, expansion, and abandonment in Mato Grosso, Brazil had selective land characteristics. Environmental Research Letters, 9: 1-12.
Wardlow, B.D.; Egbert, S.L.; Kastens, J.H. 2007. Analysis of time-series MODIS 250m vegetation index data for crop classification in the U.S. Central Great Plains. Remote Sensing of Environment, 108: 290-310.
Zhu, C.; Lu, D.; Victoria, D.; Dutra, L.V. 2016. Mapping fractional cropland distribution in Mato Grosso, Brazil using time series MODIS Enhanced Vegetation Index and Landsat Thematic Mapper data. Remote Sensing, 8: 22-36.
Received: 04/03/2017Accepted: 29/08/2017