Analysis of Secondary Structure Effects on the IR and ...
16
Analysis of Secondary Structure Effects on the IR and Raman Spectra of Polypeptides in Terms of Localized Vibrations Christoph R. Jacob,* Sandra Luber, and Markus Reiher* ETH Zurich, Laboratorium fu ¨r Physikalische Chemie, Wolfgang-Pauli-Strasse 10, 8093 Zurich, Switzerland ReceiVed: January 13, 2009; ReVised Manuscript ReceiVed: March 3, 2009 We demonstrate how the recently developed methodology for the analysis of calculated vibrational spectra in terms of localized modes [J. Chem. Phys. 2009, 130, 084106] can be applied to investigate the influence of the secondary structure on infrared and Raman spectra of polypeptides. As a model system, a polypeptide consisting of 20 (S)-alanine residues in the conformation of an R-helix and of a 3 10 -helix is considered. Several features of the calculated spectra are analyzed in detail. First, we show for the amide II band how localized modes facilitate the decomposition of the total Raman intensities into contributions of certain groups of atoms, and how such an analysis can be used to identify the origin of differences in Raman intensity of the two helices. Second, we demonstrate how the shift of the position of the amide I band between the two considered structures can be rationalized and how the observed intensity distribution within the amide I band can be explained by considering the coupling constants between the localized modes. Third, we show how localized modes can be employed to analyze the positions of the bands found in the extended amide III region and how such an analysis makes it possible to gain a better understanding of how structural changes influence the coupling between the amide III and the C R -H bending modes in this region. 1. Introduction The determination of the structure of proteins and other biomolecules is a prerequisite for the understanding of most biochemical processes. While X-ray crystallography and NMR spectroscopy often provide detailed structural information, there are several cases where these techniques cannot be employed. Therefore, other complementary spectroscopic methods are needed. Vibrational spectroscopy provides such a method that allows one to study the structure of proteins in their natural environment (i.e., in aqueous solution). In particular, infrared (IR) and Raman spectroscopy (for reviews, see, e.g., refs 1–4) as well as their chiral variants vibrational circular dichroism (VCD) and Raman optical activity (ROA) spectroscopy (for reviews, see, e.g., refs 5 and 6) have been used extensively to investigate the structure of proteins. However, while X-ray crystallography and NMR spectros- copy provide structural information rather directly, in vibrational spectroscopy this information has to be extracted from the measured vibrational frequencies and intensities. Therefore, it is crucial to understand how the measured vibrational spectra are determined by the structure of the investigated protein, and how changes in the secondary structure influence the positions and intensities of the bands in the vibrational spectra. To relate protein structure and vibrational spectra, dedicated experimental studies on model peptides as well as detailed theoretical investigations are necessary. 7 One particular example where such a link could be established is the discrimination of R-helix and 3 10 -helix by means of IR and VCD spectroscopy. Using a combination of experiment and theory, Keiderling and co- workers showed that the two conformations can be clearly distinguished by a specific VCD pattern in the amide I and amide II regions. 8 Another example is the absolute conformation of tryptophan side chains, which can be determined from the sign of a particular band in the ROA spectrum, as was recently shown both experimentally and theoretically. 9,10 For a detailed understanding of the relation between second- ary structure and vibrational spectra, ab initio calculations are extremely useful. 7 They allow it to study well-defined structural models that can be varied in a controlled way. This makes it possible to isolate the secondary structure changes from other effects, thus providing insight that is not available from experimental studies, where changes in secondary structure always go along with other changes, such as, for example, changes of the primary structure or of the solvent. However, while accurate calculations of vibrational spectra of molecules containing hundreds of atoms are nowadays possible with efficient quantum-chemical methodology (for examples, see, refs 11–13) (if necessary in combination with a selective calculation of specific normal modes 14,15 or of normal modes with a high intensity), 16,17 the interpretation of the results of such large calculations remains difficult. For polypeptides and proteins, the calculated spectra usually comprise a large number of close lying normal modes that are delocalized combinations of vibrations on different amino acid residues. However, since these individual normal modes are usually not resolved in experiment, many of them contribute to one band in the observed vibrational spectrum. This makes it difficult to analyze how structural changes influence the positions and intensities of the observed bands and to extract general rules relating secondary structure and vibrational spectra. To overcome this problem, we recently developed a meth- odology for the analysis of calculated vibrational spectra in terms of localized modes. 18 For a given set of normal modes, usually those modes that contribute to a certain band in the vibrational spectrum, the localized modes are obtained by determining a unitary transformation that leads to the modes that maximize a suitably defined localization criterion. In contrast to the delo- calized normal modes, these localized modes will in general * To whom correspondence should be addressed. E-mail: (C.R.J.) [email protected]; (M.R.) markus.reiher@ phys.chem.ethz.ch. J. Phys. Chem. B 2009, 113, 6558–6573 6558 10.1021/jp900354g CCC: $40.75 2009 American Chemical Society Published on Web 04/10/2009
Transcript of Analysis of Secondary Structure Effects on the IR and ...

Analysis of Secondary Structure Effects on the IR and Raman Spectra of Polypeptides inTerms of Localized Vibrations
Christoph R. Jacob,* Sandra Luber, and Markus Reiher*ETH Zurich, Laboratorium fur Physikalische Chemie, Wolfgang-Pauli-Strasse 10, 8093 Zurich, Switzerland
ReceiVed: January 13, 2009; ReVised Manuscript ReceiVed: March 3, 2009
We demonstrate how the recently developed methodology for the analysis of calculated vibrational spectrain terms of localized modes [J. Chem. Phys. 2009, 130, 084106] can be applied to investigate the influenceof the secondary structure on infrared and Raman spectra of polypeptides. As a model system, a polypeptideconsisting of 20 (S)-alanine residues in the conformation of an R-helix and of a 310-helix is considered.Several features of the calculated spectra are analyzed in detail. First, we show for the amide II band howlocalized modes facilitate the decomposition of the total Raman intensities into contributions of certain groupsof atoms, and how such an analysis can be used to identify the origin of differences in Raman intensity of thetwo helices. Second, we demonstrate how the shift of the position of the amide I band between the twoconsidered structures can be rationalized and how the observed intensity distribution within the amide I bandcan be explained by considering the coupling constants between the localized modes. Third, we show howlocalized modes can be employed to analyze the positions of the bands found in the extended amide IIIregion and how such an analysis makes it possible to gain a better understanding of how structural changesinfluence the coupling between the amide III and the CR-H bending modes in this region.
1. Introduction
The determination of the structure of proteins and otherbiomolecules is a prerequisite for the understanding of mostbiochemical processes. While X-ray crystallography and NMRspectroscopy often provide detailed structural information, thereare several cases where these techniques cannot be employed.Therefore, other complementary spectroscopic methods areneeded. Vibrational spectroscopy provides such a method thatallows one to study the structure of proteins in their naturalenvironment (i.e., in aqueous solution). In particular, infrared(IR) and Raman spectroscopy (for reviews, see, e.g., refs 1–4)as well as their chiral variants vibrational circular dichroism(VCD) and Raman optical activity (ROA) spectroscopy (forreviews, see, e.g., refs 5 and 6) have been used extensively toinvestigate the structure of proteins.
However, while X-ray crystallography and NMR spectros-copy provide structural information rather directly, in vibrationalspectroscopy this information has to be extracted from themeasured vibrational frequencies and intensities. Therefore, itis crucial to understand how the measured vibrational spectraare determined by the structure of the investigated protein, andhow changes in the secondary structure influence the positionsand intensities of the bands in the vibrational spectra. To relateprotein structure and vibrational spectra, dedicated experimentalstudies on model peptides as well as detailed theoreticalinvestigations are necessary.7 One particular example where sucha link could be established is the discrimination of R-helix and310-helix by means of IR and VCD spectroscopy. Using acombination of experiment and theory, Keiderling and co-workers showed that the two conformations can be clearlydistinguished by a specific VCD pattern in the amide I andamide II regions.8 Another example is the absolute conformation
of tryptophan side chains, which can be determined from thesign of a particular band in the ROA spectrum, as was recentlyshown both experimentally and theoretically.9,10
For a detailed understanding of the relation between second-ary structure and vibrational spectra, ab initio calculations areextremely useful.7 They allow it to study well-defined structuralmodels that can be varied in a controlled way. This makes itpossible to isolate the secondary structure changes from othereffects, thus providing insight that is not available fromexperimental studies, where changes in secondary structurealways go along with other changes, such as, for example,changes of the primary structure or of the solvent.
However, while accurate calculations of vibrational spectraof molecules containing hundreds of atoms are nowadayspossible with efficient quantum-chemical methodology (forexamples, see, refs 11–13) (if necessary in combination with aselective calculation of specific normal modes14,15 or of normalmodes with a high intensity),16,17 the interpretation of the resultsof such large calculations remains difficult. For polypeptidesand proteins, the calculated spectra usually comprise a largenumber of close lying normal modes that are delocalizedcombinations of vibrations on different amino acid residues.However, since these individual normal modes are usually notresolved in experiment, many of them contribute to one bandin the observed vibrational spectrum. This makes it difficult toanalyze how structural changes influence the positions andintensities of the observed bands and to extract general rulesrelating secondary structure and vibrational spectra.
To overcome this problem, we recently developed a meth-odology for the analysis of calculated vibrational spectra in termsof localized modes.18 For a given set of normal modes, usuallythose modes that contribute to a certain band in the vibrationalspectrum, the localized modes are obtained by determining aunitary transformation that leads to the modes that maximize asuitably defined localization criterion. In contrast to the delo-calized normal modes, these localized modes will in general
* To whom correspondence should be addressed. E-mail:(C.R.J.) [email protected]; (M.R.) [email protected].
J. Phys. Chem. B 2009, 113, 6558–65736558
10.1021/jp900354g CCC: $40.75 2009 American Chemical SocietyPublished on Web 04/10/2009

be dominated by a vibration on one single residue, and localizedmodes on different but homologous residues will be very similar.Therefore, the localized modes simplify the interpretation ofcalculated vibrational spectra of polypeptides and proteins andmake it possible to rationalize the effects of structural changesby considering the changes of the vibrational frequencies andintensities of the localized modes as well as the changes of thecouplings between them. Note that with our methodology it ispossible to extract localized modes and coupling constants fromaccurate calculations on full polypeptides or proteins, thusavoiding the crude approximations that are made if local modesand coupling constants obtained from calculations on smallmodel systems or from empirical models are employed.
Here, we apply our newly developed methodology for theanalysis of vibrational spectra in terms of localized modes tostudy the IR and Raman spectra of a helical polypeptideconsisting of 20 (S)-alanine residues for which an R-helical anda 310-helical conformation will be compared. These exampleshave been chosen since they can serve as a model for morecomplicated proteins, and because they allow us to demonstratehow localized modes can be employed for analyzing the effectsof secondary-structure changes on the vibrational spectra ofpolypeptides and proteins.
This work is organized as follows. In Section 2.1, thetheoretical background is briefly reviewed. This is followed bya discussion of the analysis of vibrational intensities and bandshapes in terms of localized modes in Section 2.2. Thecomputational details are given in Section 3, and the resultsobtained for R-helical and 310-helical alanine polypeptides arepresented in Section 4. In particular, in Section 4.3 the changeof the Raman intensity of the amide II band is investigated, inSection 4.4 the shift of the position of the amide I band isanalyzed, and in Section 4.5 the coupling between N-H bendingand CR-H bending vibrations in the extended amide III regionis studied. Finally, a summary and concluding remarks are givenin Section 5.
2. Theory
2.1. Localization of Normal Modes. Within the harmonicapproximation, the normal modes and vibrational frequenciescan be obtained by diagonalizing the mass-weighted molecularHessian matrix H(m), which contains the second derivatives ofthe total electronic energy E (including the nuclear repulsionenergy) with respect to Cartesian nuclear coordinates,7 that is
HiR,j(m) ) 1
√mimj( ∂
2E∂RiR∂Rj
)0
(1)
where the subscript “0” denotes that the derivative is evaluatedat the equilibrium structure R0. In the above expression, mi isthe atomic mass of nucleus i, and RiR is the R ) x,y,z Cartesiancomponent of the position of nucleus i. The matrix Q containingthe eigenvectors of H(m) can be employed to transform theHessian matrix to diagonal form,
H(q) ) QTH(m)Q (2)
where H(q) is a diagonal matrix with the diagonal elements (i.e.,the eigenvalues of H(m)) equal to the squares of the angularfrequencies, Hpp
(q) ) ωp2 ) 4π2νp
2, with vibrational frequenciesνp. The columns of the matrix Q are the normal modes in termsof mass-weighted Cartesian displacements. These normal modeswill be referred to as Qp, and its components as QiR,p. The Qp
are chosen to be normalized, that is, |Qp|2 ) ΣiRQiR,p2 ) 1, so
that the matrix Q is unitary. The normal modes in terms of not
mass-weighted Cartesian displacements Qp(c), can be obtained
as QiR,p(c) ) (1/mi
1/2)QiR,p.In order to analyze the vibrational spectra of polypeptides
and proteins in terms of localized modes,18 one considers asubset of k normal modes, which are usually those modes thatcontribute to one band in the vibrational spectrum. These normalmodes are collected in the matrix Qsub. By means of a unitarytransformation U, these can be transformed to a set of localizedmodes
Qsub ) QsubU (3)
where the unitary transformation is chosen such that it yieldsthe “most localized” transformed modes. This is achieved bymaximizing (Qsub) ) (QsubU), where (Qsub) is a suitablydefined criterion that measures how localized a set of trans-formed modes Qsub is.18 Here and in the following, the tilde isused to denote the localized modes, or other quantities that aredefined with respect to these localized modes. The localizingunitary transformation U can then be determined using theJacobi-sweep method as discussed in ref 18.
For the localization criterion (Qsub), different definitions canbe employed. Here, we will use the atomic-contribution criterion18
at(Qsub) ) ∑
p)1
k
∑i)1
n
(Cipsub)2 (4)
where Cipsub is the contribution of nucleus i to the mode Qp
sub,which can be measured by the fraction of the kinetic energy ofthis atom in the normal mode as 19–21
Cipsub ) ∑
R)x,y,z
(QiR,psub )2 (5)
This criterion measures the number of atomic centers thatcontribute to each of the modes. It leads to localized modes towhich as few atomic centers as possible contribute.
Note that the localized modes are not eigenvectors of themass-weighted Hessian H(m), and therefore have no directphysical significance. Nevertheless, they can be useful for theinterpretation of calculated vibrational spectra. For polypeptidesand proteins, where the normal modes are in general delocalizedcombinations of vibrations on different amino acid residues,the localized modes will each be dominated by a vibration ofone single residue. Furthermore, the localized modes on differentresidues will involve similar atomic displacements, that is, theset of localized modes obtained for one vibrational band willconsist of modes that are very similar but are located on differentresidue. This very simple structure of the localized modes makesthem well suited for the analysis of vibrational spectra and, aswill be discussed in the following, makes it possible to analyzethe positions and intensities as well as shapes of the bands inthe vibrational spectra.
In order to analyze the positions and shapes of the bands inthe vibrational spectra, it is useful to define the (vibrational)coupling matrix Ω as18
Ω ) UTΩU (6)
where Ω is a diagonal matrix with the vibrational frequenciesνp ) ωp/2π of the considered normal modes on the diagonal.From this coupling matrix Ω, the vibrational frequencies of thenormal modes and the transformation matrix U can be obtainedby diagonalization. The eigenvectors of Ω are the rows of thetransformation matrix U (columns of the inverse transformationUT) and give the composition of the normal modes in the basisof localized modes.
Spectra of Polypeptides in Terms of Localized Vibrations J. Phys. Chem. B, Vol. 113, No. 18, 2009 6559

As is discussed in ref 18, the diagonal elements Ωpp of thiscoupling matrix can be interpreted as vibrational frequenciesof the localized modes. For a set of localized modes that aresimilar but located on different residues, these frequencies ofthe localized modes will be very similar, that is, the localizedmodes are energetically (almost) degenerate. As will be shown,a shift in the position of a band in the vibrational spectrum canthen be understood in terms of a shift of the frequencies of thelocalized modes. Since these localized modes are very similar,it will be sufficient to consider only one representative localizedmode for analyzing this shift.
The off-diagonal elements Ωpq can be understood as couplingconstants. In the case of two degenerate localized modes, themagnitude of the corresponding coupling constant correspondsto half the frequency splitting between two normal modes thatarise as combination of these localized modes. For nondegen-erate localized modes and for a larger number of localizedmodes, more complicated coupling patterns arise. However, theresulting vibrational frequencies of the normal modes can stillbe understood in terms of the frequencies of the localized modesΩpp and the coupling constants Ωpq between them. Note thatthe coupling constants Ωpq will in general be small for localizedmodes that are centered on groups which are not spatially close.Consequently, for each localized mode only couplings with asmall number of other modes will be significant. Furthermore,in the case of polypeptides and proteins, the coupling constantsbetween localized modes on neighboring residues in similarsecondary structure elements will be very similar. Therefore,the coupling matrix Ω in general has a rather simple structure,which allows us to understand how the more complicateddelocalized normal modes arise.
2.2. Analysis of Vibrational Intensities in Terms of Local-ized Modes. The vibrational frequencies of the localized modesand the coupling constants between the localized modes can beused to analyze the positions of the bands in the vibrationalspectrum. In addition, the localized modes can also be employedfor analyzing both the total intensities of these bands as well astheir band shapes. This will be investigated now for the totalband intensities and in the following section for the band shapes.
In IR spectroscopy, the absorption of the p-th vibrationalmode is proportional to the square of the derivative of the dipolemoment with respect to the corresponding normal mode11
ApIR ∝ ( ∂µ
∂Qp)
0
2) ∑
R(∂µR
∂Qp)
0
2
(7)
and the scattering intensity measured in Raman spectroscopyis proportional to a linear combination of the Raman invariants22,11
IpRaman ∝ [c1ap
2 + c2γp2] (8)
where the coefficients c1 and c2 depend on the geometry of thescattering experiment. For the most common case in which theincident light is linearly polarized and the scattered light isdetected at an angle of 90°, one has c1 ) 45 and c2 ) 7.22 Theterm on the right-hand side is the so-called scattering factor S.Since the proportionality constant in the above expressiondepends on the precise experimental conditions (for details, seerefs 11 and 23) it is common, in particular in theoretical studies,to ignore this proportionality constant and to consider only theRaman scattering factor S. The isotropic and anisotropic Ramaninvariants are given by22
ap2 ) 1
9[(∂Rxx
∂Qp)
0+ (∂Ryy
∂Qp)
0+ (∂Rzz
∂Qp)
0]2
) 19 ∑
R(∂RRR
∂Qp)
0(∂R
∂Qp)
0(9)
γp2 ) 1
2 ∑R
[3(∂RR
∂Qp)
0
2
- (∂RRR
∂Qp)
0(∂R
∂Qp)
0] (10)
Both the IR absorption and the Raman scattering factor ofthe p-th vibrational mode can be expressed as
Ip ∝ ∑l
cl(∂Pl(1)
∂Qp)
0(∂Pl
(2)
∂Qp)
0(11)
where Pl(1) and Pl
(2) are components of the appropriate molecularproperty, that is, of the dipole moment vector µ in the case ofthe IR absorption and of the electric dipole-electric dipolepolarizability tensor R for the Raman scattering factor.
The total intensity of one band (i.e., the intensity integratedover the whole band), to which the k normal modes Qp
sub
contribute, is given by
Iband ∝ ∑p)1
k
∑l
cl( ∂Pl(1)
∂Qpsub)
0( ∂Pl
(2)
∂Qpsub)
0
(12)
As is shown in ref 18, this total intensity is invariant underunitary transformations among the contributing modes, andtherefore the total intensities of the considered band can alsobe expressed in terms of the localized modes, that is
Iband ∝ ∑p)1
k
∑l
cl( ∂Pl(1)
∂Qpsub)
0(∂Pl
(2)
Qpsub )
0
(13)
This makes it possible to analyze the total intensity of theband under study in terms of the localized modes. Since thelocalized modes obtained for one band are in general rathersimilar, also the intensities with respect to the localized modeswill be similar. Therefore, it will usually be sufficient to consideronly one representative localized mode from this set in orderto understand the effects that determine the total intensity of acertain band. One possibility for analyzing vibrational intensitiesis their decomposition into contributions of certain atoms orgroups of atoms. Note that since only vibrations of a smallnumber of atoms contribute to each localized mode, the localizedmodes simplify such an analysis considerably.
Finally we should mention that a scheme for the decomposi-tion of the Raman and ROA invariants into local contributionsof individual atoms or groups of atoms has been proposed byHug,20 which can be employed for analyzing the vibrationalintensities with respect to the localized modes. Even thoughthis analysis has only been applied to Raman and ROAinvariants so far, also IR and VCD intensities can be decom-posed in the same fashion. Since we will only consider IR andRaman spectroscopy here, we will only discuss the decomposi-tion of the IR absorption and the Raman scattering factor inthe following. Hug’s decomposition scheme arises naturallywhen rewriting the property (i.e., dipole moment or polariz-ability) derivatives in terms of Cartesian displacements as
( ∂Pl
∂Qp)
0
) ∑A
[ ∑i∈A
∑R
QiR,p(c) ( ∂Pl
∂RiR)
0] (14)
where A denotes appropriately chosen groups of atoms, in termsof which the decomposition is performed. For the IR absorptionand the Raman scattering factor (as well as for the individual
6560 J. Phys. Chem. B, Vol. 113, No. 18, 2009 Jacob et al.

Raman invariants), which are both given by a linear combinationof products of property tensor derivatives, one obtains the localdecomposition
Ip ) ∑l
cl(∂Pl(1)
∂Qp)
0(∂Pl
(2)
∂Qp)
0
) ∑AB
[Jp]AB (15)
where Ip now stands for the IR absorption, Raman scatteringfactor, or one of the Raman invariants for which Pl
(1) and Pl(2)
are the required property tensor components and cl the appropri-ate coefficients. The indices A and B run over the atoms orgroups of atoms in terms of which the analysis is performed,and the local contributions are given by
[Ip]AB ) ∑i∈A, j∈B
∑R
QiR,p(c) Qj,p
(c) [ ∑l
cl(∂Pl(1)
∂RiR)
0(∂Pl
(2)
∂Rj)
0](16)
While the diagonal terms [Ip]AA represent contributions thatare solely due to the atoms in the group A, the off-diagonalterms [Ip]AB arise from the coupling between atoms in groups Aand B. These local contributions can be visualized as groupcoupling matrices as proposed in ref 20 by representing the localcontributions as circles with an area proportional to the size ofthe local contributions.
2.3. Analysis of Band Shapes in Terms of LocalizedModes. While the total intensity of a band in the vibrationalspectrum is invariant under a unitary transformation of thecontributing normal modes, the intensities corresponding to theindividual transformed modes differ from those of the normalmodes. Therefore, in order to understand the shapes of the bandsin the vibrational spectrum, the localized modes and theircorresponding intensities alone are not sufficient, but also thecouplings between them as well as the cross-terms in theintensities arising due to these couplings have to be considered.
In a similar fashion as described in the previous section forthe decomposition into local contributions, IR and Ramanintensities (as well as VCD and ROA intensities) of the normalmodes within a certain band can be analyzed in terms ofcontributions of the corresponding localized modes. The normalmode Qp
sub can be expressed in terms of localized modes as18
Qpsub ) ∑
q
UqpT Qq
sub ) ∑q
UpqQqsub (17)
that is, the coefficients are given by the p-th column of UT,which can be obtained as an eigenvector of the coupling matrixΩ. Therefore, the intensity Ip associated with this mode can bedecomposed as
Ip ) ∑qr
[Ip]qr ) ∑qr
UpqUpr[I]qr (18)
with the intensity coupling matrix
[I]qr ) ∑l
cl( ∂Pl(1)
∂Qqsub)
0( ∂Pl
(2)
∂Qrsub)
0
(19)
This intensity coupling matrix describes the intensity and thearising coupling terms in terms of the localized modes, and thesame intensity coupling matrix can be applied to all normalmodes in the considered subset. Its diagonal elements [I]qq aregiven by the intensity with respect to the localized mode q, whilethe off-diagonal elements arise due to the coupling between twolocalized modes. Since the localized modes associated with oneband in the vibrational spectrum are usually similar for modes
located on different parts of the considered system, these termswill often show, similar to case of the coupling matrix Ω, asimple structure that is relatively easy to understand.
In order to obtain the decomposition of the intensity Ip withrespect to a specific normal mode p in terms of localized modesaccording to eq 18, the elements of this intensity coupling matrixhave to be multiplied by UpqUpr, that is, products of thecoefficients of the localized modes that contribute to the normalmode p. These coefficients are determined by the vibrationalcoupling between the localized modes, that is, they are givenby an eigenvector of the vibrational coupling matrix Ω.
If one considers the isotropic Raman invariant a2 as thesimplest case, the intensity coupling matrix is given by
[a]qr ) ( ∂R∂Qq
sub)0( ∂R∂Qr
sub)0
(20)
where Rj ) (1/3)(Rxx + Ryy + Rzz) is the isotropic polarizability.In general, the localized modes will be very similar, so that thederivatives of Rj with respect to the localized modes will bealmost identical and have the same sign if the phase of thelocalized modes is chosen in a consistent way. Therefore, allelements (diagonal and off-diagonal) will be positive and almostequal in size. With this in mind, one can easily see that thenormal mode with the highest intensity is the mode in whichall the prefactors UpqUpr are positive, that is, the (nodeless) in-phase combination of the localized modes. At which vibrationalfrequency this highest-intensity normal mode occurs dependson the structure of the vibrational coupling matrix Ω as well ason the vibrational frequencies of the localized modes.
However, in general the intensity coupling matrix will bemore complicated and its structure will also depend on theorientation of the considered localized modes with respect toeach other, so that other combinations of localized modes canturn out to lead to higher intensities. This is already true forthe IR absorption, where a scalar product between the dipolemoment derivatives with respect to the two localized modeshas to be considered, and is further complicated in the case ofVCD and ROA spectroscopy. Nevertheless, the decompositionanalysis described above can be used to explain the intensitydistribution within one band in the vibrational spectrum.
3. Computational Details
Structure optimizations were performed with the Turbomoleprogram package24,25 employing density-functional theory. TheBP86 exchange-correlation functional26,27 and Ahlrichs’ valencetriple- basis with one set of polarization functions (TZVP) 28,29
and the corresponding auxiliary basis sets 30,31 were employed.All structures have been fully optimized. However, in order toconverge to the desired local minima, constraints fixing thepositions of different groups of atoms were applied in the initialphase of the optimization, but all these constraints were relaxedin the final stage of the optimization.
The program SNF11,32 was used to calculate the normal modesand vibrational frequencies, as well as the dipole and polariz-ability derivatives that determine the IR absorption and theRaman scattering factor. As has been shown earlier bycomparison to coupled-cluster calculations, DFT is able toreliably predict Raman scattering intensities.33 The analyticenergy gradients (needed for the seminumerical calculation ofthe harmonic force field) were calculated with Turbomole fordistorted structures.11,32 The Raman scattering factors werecalculated for an excitation wavelength of 799 nm. It wasverified that the chosen excitation wavelength is well away fromany electronic absorption frequency of the considered molecules.
Spectra of Polypeptides in Terms of Localized Vibrations J. Phys. Chem. B, Vol. 113, No. 18, 2009 6561

The calculations were performed for the isolated molecules andsolvent effects were not included.
The localized modes were calculated according to the atomic-contribution criterion using the Jacobi-sweep method as de-scribed in ref 18. Both the localization of normal modes andthe related analysis routines are implemented in an add-onpackage to SNF written in the Python programming language.The Numpy package34 is used for efficient linear algebraoperations where needed. For managing the geometric coordi-nates and for the assignment of atoms to individual residuesand atom types in the investigated polypeptide, the Openbabellibrary35,36 has been employed.
Pictures of molecular structures and normal modes wereprepared with Jmol.37 Plots of vibrational spectra and of group-and intensity-coupling matrices were produced using the Mat-plotlib package.38 In the graphical representations of thesecoupling matrices, the area of the circles is proportional to thesize of the corresponding matrix element, and filled circlesrepresent positive whereas empty circles represent negativecontributions. Note that for these symmetric matrices only theupper triangular part is shown, and the off-diagonal matrixelements have, therefore, been multiplied by two.
4. Results and Discussion
4.1. IR and Raman Spectra of r-Helical and 310-Helical(Ala)20. In order to demonstrate how localized modes can beemployed for analyzing how changes in the secondary structureaffect the vibrational spectra, we study the calculated IR andRaman spectra of a polypeptide consisting of twenty (S)-alanineresidues, denoted (Ala)20, in an R-helical conformation and ina 310-helical conformation. Such a polypeptide can serve as asimple model for the vibrational spectrum of more complicatedproteins and allows us to study how structural changes influencethe amide bands in the IR and Raman spectra, which arecommonly used to study protein structure.
The optimized structures of the polypeptides under investiga-tion are shown in Figure 1. Note that the molecular structuresof both polypeptides have been obtained from a full geometryoptimization. Therefore, a rather large polypeptide containingtwenty alanine residues has to be used in order to preserve theR-helical structure in the optimization. The structure of theR-helical (Ala)20 polypeptide is identical to the one that wasemployed in ref 18. For the R-helix, the backbone dihedralangles of the central residues are approximately ) -60° andψ ) -42°, while for the 310-helix, they are approximately )-63° and ψ ) -19° for the central residues, that is, the twoconformers differ in the backbone dihedral angle ψ (the CRCtorsional angle), while (the NCR torsional angle) is almostidentical in both conformers. Note that at the termini, bothhelices are slightly distorted, and in the case of the R-helix, thetermini tend to resemble a 310-helix. The Cartesian coordinatesof both considered polypeptides are given in the SupportingInformation.
The calculated IR and Raman spectra of R-helical and 310-helical (Ala)20 in the region between 1800 and 1100 cm-1 areshown in Figure 2. In these spectra, the individual transitions,which are included as lines in the plotted spectra, have beenbroadened using a Lorentzian line shape with a half-width of15 cm-1. The first step toward the analysis of these vibrationalspectra in terms of localized modes is the assignment of theindividual vibrational transitions to certain bands in the spec-trum. As described in ref 18, this assignment can be performedby considering the wavenumbers of the transitions, which formost vibrational bands cluster around the corresponding band
maxima, and by collecting modes for which the contributionsof certain groups of atoms to the normal modes show a similarpattern. The assignment of all modes within the consideredwavenumber range can be found in the Supporting Informationfor both conformers of (Ala)20.
All peaks in the IR and Raman spectra shown in Figure 2can be assigned to one of these sets of normal modes. Thewavenumber range of these sets of modes, the correspondingband maxima, as well as the calculated total IR absorption andRaman scattering factors of these bands are listed in Table 1for the two (Ala)20 conformations considered. The assignmentof these groups of modes to certain types of vibrations has beendiscussed in detail in ref 18, where the displacements involvedin each of these bands are visualized by considering thecorresponding localized modes. The amide I modes are domi-nated by CdO stretching vibrations with smaller contributionsof N-H bending and CR-H bending vibrations. The amide IImodes are due to the out-of-phase combination of the N-Hbending and the C-N stretching vibrations of the amide group.The modes denoted as CR-H bending and those denoted asamide III modes in Table 1 are usually jointly referred to as“extended amide III region”, since all these modes consist ofcoupled N-H bending and CR-H bending vibrations.39 Adetailed analysis of the bands in the extended amide III regionand the coupling between N-H bending and CR-H bendingvibrations will be presented in Section 4.5.
Comparing the IR and Raman spectra calculated for theR-helical and the 310-helical conformation, one can identify anumber of significant differences between the spectra. First,
Figure 1. Optimized structures of (Ala)20 in the conformation of (a)an R-helix and (b) a 310-helix.
6562 J. Phys. Chem. B, Vol. 113, No. 18, 2009 Jacob et al.

while the amide II peak cannot be identified in the Ramanspectrum of R-helical (Ala)20, it is clearly visible for the 310-helix. This increased Raman scattering intensity can also be seenfrom the total scattering factors for the amide II modes givenin Table 1, which increases from 30.3 Å4/amu for the R-helixto 47.8 Å4/amu for the 310-helix. Second, the position of theamide I peak shifts from 1659 to 1638 cm-1, that is, byapproximately 20 cm-1 when moving from an R-helix to a 310-helix. These two differences between the vibrational spectra willbe investigated in detail in the following sections. Finally, even
though the modes in the extended amide III region are usuallybelieved to be very sensitive to structural changes, they are verysimilar for the R-helix and the 310-helix. Only the CR-H bending(II) mode shifts by approximately 10 cm-1 from 1288 to 1279cm-1. To gain a better understanding of the structural factorsdetermining the vibrational spectrum in the extended amide IIIregion, these modes will be investigated in more detail in thefollowing. But before proceeding to this investigation, it isworthwhile to compare the calculated vibrational spectra of theR-helical conformation to those observed in experiment.
Figure 2. Calculated IR and Raman spectrum of (a) R-helical (Ala)20 and (b) 310-helical (Ala)20. The spectra have been plotted using a Lorentzianline width of 15 cm-1. Individual peaks have been included as a line spectrum scaled by 0.2. In the IR spectrum, the region below 1400 cm-1 hasbeen magnified by a factor of 5.
TABLE 1: Wavenumber Ranges, Band Maxima, and Sum of the IR Absorptions and Sum of the Raman Scattering Factors Sfor the Characteristic Bands in the Vibrational Spectra of r-Helical and 310-Helical (Ala)20
a
range [cm-1] max [cm-1] total IR abs. [km/mol]total Raman scattering
factor [Å4/amu]
R-helixamide I 1633-1681 1659 6279.9 483.1amide II 1468-1515 1514 1918.6 30.3CH3 asymm bend 1446-1466 1456 496.4 322.8CH3 symm bend 1356-1373 1367 248.7 45.2CR-H bending (I) 1304-1334 1317 198.8 199.9CR-H bending (II) 1257-1290 1288 215.0 101.2amide III 1184-1260 1221, 1241 528.4 95.8skeletal CR-N stretch 1103-1156 1144 353.6 47.5
310-helixamide I 1631-1674 1638 5909.0 516.4amide II 1474-1515 1513 1780.0 47.8CH3 asymm bend 1447-1457 1453 493.1 298.1CH3 symm bend 1357-1369 1367 295.2 67.3CR-H bending (I) 1304-1334 1319 231.9 215.3CR-H bending (II) 1268-1282 1279 213.4 92.6amide III 1183-1259 1223, 1245 720.8 126.1skeletal CR-N stretch 1124-1159 1146 338.3 33.0
a Band maxima refer to the calculated IR spectrum.
Spectra of Polypeptides in Terms of Localized Vibrations J. Phys. Chem. B, Vol. 113, No. 18, 2009 6563

4.2. Comparison to the Experimental Spectrum of r-Heli-cal Polyalanine. In experiments performed in aqueous solution,such (Ala)20 polypeptides do not adopt the nearly ideal R-helicalstructure investigated here computationally but are instead frayedat the termini, and their structure is very sensitive to temperaturedue to this (partial) unfolding.40 Therefore, we compare to theexperimental spectrum of solid (all-S)-polyalanine,41,42 whichadopts an R-helical conformation. The calculated IR bandmaxima as well as those observed in the experimental IRspectrum for the considered wavenumber range are given inTable 2. Note that for the 310-helical conformation, no directcomparison to experimental data is possible since this confor-mation is in general not observed for alanine polypeptides, butCR,R-disubstituted residues are required to support a 310-helicalconformation in short polypeptides.43 However, this is nodrawback in our computational experiment, which only requiresboth helical structures to be a local minima on the potentialenergy surface.
The comparison shows an excellent agreement of thecalculated band maxima to those observed in experiment forthe amide I and the side chain CH3 bending modes with anerror smaller than 10 cm-1. However, this good agreement ispartially due to a fortunate error cancelation,23,44–47 since onewould expect that the harmonic approximation, the deficienciesof the approximate exchange-correlation functional employedin the DFT calculations, and the neglect of solvent and bulkeffects lead to deviations of the calculated band maxima fromthose observed in experiment. For the amide II modes, theextended amide III region, and the skeletal stretch band theexperimental wavenumbers are underestimated by up to 30cm-1. These modes all involve some contribution of N-Hbending vibrations that can be expected to be most sensitive tosolvent effects that were neglected in our calculations.
It should be noted that in previous DFT calculations onR-helical alanine polypeptides, larger deviations between theexperimentally observed amide I IR bands and the calculatedones, which appeared at approximately 1720 cm-1, were found.48
This was attributed to the absence of solvent effects, and it wasshown that the inclusion of explicit water solvent moleculesshifts the calculated amide I band to approximately 1670 cm-1.While solvent effect will certainly affect the amide bandssignificantly, there are also a number of other sources of errorsin the calculations of ref 48 that can account for the observedlarge shift of the amide I band. In particular, the vibrationalspectra were simulated by transferring force constants calculatedfor smaller fragments to the large system,49 which only partlyincludes the environment of the individual residues in thepolypeptide and neglects the coupling between different residues.Furthermore, an idealized R-helical conformation was used forthe small alanine oligopeptides in ref 48 from which the force
constants were obtained, and the backbone dihedral angles wereconstrained during the structure optimization. Therefore, theeffect of the intramolecular hydrogen bonds that significantlyaffects the electronic structure of the amide group will only bedescribed partially.
The simplest way to include the effect of a solvent environ-ment in the calculations is to employ a continuum solvationmodel.50,51 Note that such a continuum solvation model cannotbe expected to yield an accurate description of specific solventeffects (i.e., of hydrogen bonds between solvent molecules andthe solute), and therefore it can only be considered as a firstestimate. To test the significance of continuum solvation effectsfor the calculated vibrational spectra, we performed calculationsemploying the conductor-like screening model (COSMO).52
Details on these calculations as well as the IR and Raman spectracalculated using the COSMO model can be found in theSupporting Information. However, as is discussed there, includ-ing continuum solvation effects changes neither the molecularstructures nor the vibrational spectra significantly. In both theIR and the Raman spectra, the positions and intensities of thebands within the considered wavenumber range only changeslightly (the shifts in the band maxima are 20 to 30 cm-1 forthe amide I band and less than 10 cm-1 for all other bands) andall the qualitative features of the spectra that will be discussedin the following are preserved. This shows that in order todescribe the effects of the solvent or bulk environment moreaccurately, more sophisticated solvent models that explicitlyinclude the molecular structure of the environment would berequired (see, e.g., ref 48 for the description of solvent effectson vibrational spectra, and refs 53–55 and references thereinfor other molecular properties). For our purposes here, it willbe sufficient not to include continuum solvent effects in thefollowing.
4.3. Decomposition of the Raman Intensity of the AmideII Band. The amide II modes in polypeptides and proteins,which are mainly due to an out-of-phase combination of N-Hbending and C-N stretching vibrations of the amide groups,are very prominent peaks in IR and VCD spectra, that havebeen used extensively for investigations of secondary structure.4,56
In the Raman spectrum, the amide II band is generally weak orabsent.39 However, it can be prominent in the ultraviolet (UV)resonance Raman spectrum57 and also in ROA spectra, wherethey provide useful information on protein conformation.6,58
In the calculated Raman spectra of (Ala)20, the amide II bandis only found in the spectrum of the 310-helical conformation,while it is too weak to be visible in the spectrum of the R-helicalconformation. To understand the Raman intensity of the amideII band, which is the sum of the intensities of a number ofdelocalized amide II normal modes, it is instructive to look atthe corresponding localized modes. These will show a moreregular intensity pattern, that is, all localized modes will exhibita very similar intensity, though all intensities still sum up tothe same total intensity. Therefore, it is sufficient to investigateonly one of these localized modes in more detail.
We will consider the localized mode which features thebending of N-H of residue 12 as a main contribution. Thislocalized mode is shown in Figure 3a, and it can be seen thatit is almost identical for the two conformers. However, whilefor the R-helix the considered localized mode has a scatteringfactor of 0.95 Å4/amu, it increases to 2.05 Å4/amu for the 310-helix. Therefore, this localized mode reflects the observedincrease of the total scattering intensity of the amide II band.
To analyze the Raman scattering factor associated with theconsidered localized mode, the Raman scattering factor can be
TABLE 2: Comparison of the Band Maxima Calculated for(Ala)20 to Those Measured in the Experimental IR Spectrumof r-(all-S)-Polyalaninea
calc [cm-1] exp [cm-1]
amide I 1659 1658amide II 1514 1548CH3 asymm bend 1456 1461CH3 symm bend 1367 1384CR-H bending (I) 1317 1330CR-H bending (II) 1288 1305amide III 1221, 1241 1274skeletal CR-N stretch 1144 1168
a Experimental values are taken from ref 42.
6564 J. Phys. Chem. B, Vol. 113, No. 18, 2009 Jacob et al.

decomposed into contributions of groups of atoms as describedin Section 2.2. For this decomposition, we will consider theisotropic and anisotropic Raman invariants 45a2 and 7γ2
separately. The coefficients in front of these invariants areincluded so that their total values are comparable. The Ramaninvariants are decomposed into contributions of the N-H, ofthe CdO group, of the CR-H, and of the CH3 groups of residue11, as well as of the adjacent CdO and N-H groups of residues10 and 12, respectively, and those of all other atoms (labeled“R”). These groups are shown in Figure 3b.
The decomposition of the isotropic Raman invariant 45a2 isshown in Figure 3c. The main contribution is for bothconformations the one of the N-H group of residue 12, whichcould be expected since this group also has the largest con-tribution to the mode under investigation. However, thecontributions are almost identical for both conformations, andthe difference between the 45a2 invariant for the two conforma-tions is close to zero, that is, the observed increase in the Raman
scattering factor is not caused by an increase of the isotropicinvariant 45a2, but is due to the anisotropic invariant 7γ2.
The decomposition of the anisotropic Raman invariant 7γ2
is shown in Figure 3d. As for 45a2, the largest contribution isdue to the N-H group of residue 12, but there is also asignificant contribution from the adjacent CdO group of residue11 and, to a smaller extent, from the CdO group of residue 10.However, the anisotropic invariant 7γ2 is different for theR-helical and the 310-helical conformations, and the groupcoupling matrices in Figure 3 show that this difference is almostexclusively due to the diagonal terms associated with the N-Hgroup of residue 12 and the CdO group of residue 11, that is,the differences can be associated with the C-N stretchingvibration. Since the localized mode under investigation is almostidentical for both conformations, these differences must be dueto variations in the derivatives of the anisotropy of thepolarizability that are caused by the changes in the electronicstructure induced by the different molecular structures. Note
Figure 3. Analysis of the amide II Raman intensity. (a) Localized amide II mode with the main contribution on the N-H group of residue 12.Only the atoms of residue 11 and the adjacent N-H and CdO groups are shown. The contributions of all other atoms to this mode are negligible.(b) Groups of atoms that are used for the decomposition into group contributions. All other atoms are collected in the group labeled “R”. (c) Groupcoupling matrices showing the decomposition of the isotropic Raman invariant 45a2 for (Ala)20 in the conformation of an R-helix (left) and of a310-helix (middle), and difference between the two conformations (right). In all three cases, also the total value of 45a2 (in Å4/amu) is given. (d)Group coupling matrices showing the analogous decomposition of the anisotropic Raman invariant 7γ2. In all three cases, also the total value of7γ2 (in Å4/amu) is given.
Spectra of Polypeptides in Terms of Localized Vibrations J. Phys. Chem. B, Vol. 113, No. 18, 2009 6565

that the increased Raman intensity is not caused by an increasedcoupling of the amide II modes with the very intense CH3
bending modes, as could be expected at first sight.4.4. Understanding the Frequency Shift of the Amide I
Band. In our calculated IR spectra, the maximum of the amideI band is shifted to lower wavenumbers from 1659 cm-1 forR-helical (Ala)20 to 1638 cm-1 for the 310-helical conformation,that is, by 21 cm-1. In this section, we analyze the origin ofthis shift. We note that a similar shift of the amide I peak tolower wavenumbers between an R-helical and a 310-helicalalanine polypeptide was obtained previously in the calculationsof Keiderling and co-workers.8 However, they also found thatthis shift is counteracted by the R-methyl substitution in theCR,R-disubstituted model peptides adopting a 310-helical con-formation that they also investigated experimentally, so that thisshift cannot be employed to distinguish the two conformationsexperimentally.
The amide I band in the calculated IR spectrum for the R-helixand the 310-helix are shown in Figure 4a, where also theunderlying vibrational transitions are included as a line spectrum.It can be seen that the band maxima are in both cases due toonly a few very intense transitions. When considering thecorresponding localized modes, the picture changes and alllocalized modes exhibit very similar intensities, and also showquite similar wavenumbers. This can be seen in the fictitiousspectra in terms of localized modes, which are shown in Figure4b. These spectra are obtained by plotting the IR spectrum onewould obtain if the localized modes were the true normal modes(i.e., if the coupling between them could be neglected).
In these fictitious spectra in terms of localized modes, themaxima of the amide I band occur at 1657 and 1644 cm-1 forthe R-helix and the 310-helix, respectively. The difference of13 cm-1 between the maxima found for the two conformations
is due to the shift in the vibrational frequencies of the localizedmodes. Therefore, this shift is caused by changes of the forceconstants that are due to the conformational change, that is,differences in the local electronic structure of the carbonylgroups. However, this shift only accounts for a part of the shiftof 21 cm-1 found in the true spectrum.
To explain the remaining shift, one has to consider thecoupling between the localized amide I modes on differentresidues. It is well known that the shape and position of theamide I band in polypeptides and proteins is largely influencedby the coupling between the individual carbonyl stretchingvibrations. This was first recognized by Krimm and co-workers,who showed that the splitting of the amide I band in -sheetpolypeptides can be explained by using a simple dipole couplingmodel.59,60 Such empirical transition dipole coupling (TDC)constants have since then been used in numerous theoreticalstudies.41,61,62 However, the TDC model neglects the effects ofthrough-bond coupling, and it has been shown that for residuesthat are close to each other, the TDC model leads to significantdeviations of the resulting vibrational frequencies.63,64 Incontrast, our approach allows it to extract coupling constantsfrom full quantum chemical calculations, that include all theseeffects and that do not rely on any empirical models. As wasshown in ref 18, the TDC model is able to qualitativelyreproduce these full coupling constants only for the amide Iband (even though the magnitudes of the TDC couplingconstants deviate significantly), while for all other bands, theTDC coupling constants are even qualitatively wrong.
In order to simplify the analysis, we will only consider thesix localized modes with their main contributions on residues7 to 12. For the localized modes at the terminal residues, thevibrational frequencies are shifted, which would further com-plicates the observed coupling patterns. However, the restricted
Figure 4. (a) Amide I band in the calculated IR spectrum of R-helical (left) and 310-helical (right) (Ala)20. The individual transitions are includedas a line spectrum scaled by 0.2. (b) Amide I band in the fictitious IR spectra defined in terms of localized modes. The contributions of theindividual localized modes are included as a line spectrum scaled by 0.2.
6566 J. Phys. Chem. B, Vol. 113, No. 18, 2009 Jacob et al.

subset of six localized modes already allows for a qualitativeunderstanding.
As discussed in Section 2.2, the distribution of the intensityacross the normal modes in one band of the spectrum isdetermined by the intensity coupling matrix, [µ2]qr in the caseof the IR intensity, and by the coefficients of the normal modeswith respect to the localized modes, which are determined bythe vibrational coupling matrix Ω. Graphical representations ofthe IR intensity coupling matrices for the considered subset oflocalized modes of R-helical and 310-helical (Ala)20 are shownin Figure 5a. These matrices show a rather simple pattern. All
off-diagonal elements, which describe the coupling terms in theIR intensity between the localized modes, are positive and ofsimilar size. The small differences between the elementscorresponding to a different distance between the residues (i.e.,the different secondary diagonals of the matrices in Figure 5a)are due to the slight differences in the orientation of thecorresponding transition dipole vectors.
Since all the off-diagonal elements of the IR intensitycoupling matrices are positive, the normal mode with the highestintensity will be the in-phase combination of the localizedmodes, that is, the normal mode in which all the coefficients
Figure 5. (a) Intensity coupling matrices for the localized amide I modes on residues 7 to 12 of R-helical (left) and of 310-helical (right) (Ala)20.(b) Graphical representation of the considered localized modes (left column of each plot) and the corresponding coupled modes, that is, eigenvectorsof the considered subblock of the coupling matrix Ω (right column of each plot) for the two considered conformations. The positions of the linesindicate the wavenumbers of the localized modes and the coupled modes, respectively. For each mode, the arrows indicate its composition bygiving the coefficients of the contributing localized modes. The values labeled “int” are the IR absorptions in km/mol corresponding to the coupledmode.
Spectra of Polypeptides in Terms of Localized Vibrations J. Phys. Chem. B, Vol. 113, No. 18, 2009 6567

with respect to the localized modes have the same sign. Thevibrational frequencies and the composition of the normal modesconsidered in terms of localized modes are obtained as eigen-values and eigenvectors of the vibrational coupling matrix Ω,respectively. Table 3 shows the subblock of Ω correspondingto the localized amide I modes with their major contribution ofresidues 7 to 10 for the two conformations of (Ala)20 under studyhere.
As expected, in both cases one finds that the elements onone diagonal, which correspond to the same distance betweenresidues, are rather similar. For the R-helix, the largest couplingsoccur between nearest-neighbor residues, with coupling con-stants of Ωi,i+1 ≈ 8.2 cm-1. For residues that are further apart,the coupling constants are negative. For the second nearest-neighbor, the coupling constant is with Ωi,i+2 ≈ -2.2 cm-1
smaller as for the nearest neighbor, and a somewhat largercoupling constant of Ωi,i+3 ≈ -4.3 cm-1 is found for the thirdnearest-neighbor, which corresponds to one complete turn ofthe R-helix. For residues that are even further apart, themagnitude of the coupling constants is smaller than 1 cm-1.For the 310-helix, a different pattern is found. The nearest-neighbor coupling constants are with Ωi,i+1 ≈ 2.6 cm-1 smallerthan in the R-helix case. The second nearest-neighbor couplingconstants of Ωi,i+2 ≈ -3.7 cm-1, which now corresponds toone complete turn of the 310-helix, are even larger in magnitude.The magnitude of the coupling constants between residues thatare further apart are smaller than 1 cm-1.
These different coupling patterns lead to different normalmodes and to a different vibrational frequency of the mostintense mode, that is, of the in-phase combination of localizedmodes. To illustrate this, a graphical representation of theresulting coupled modes (i.e., eigenvectors of the subblock ofthe considered coupling matrix Ω) as well as the correspondingeigenvalues are shown in Figure 5b. Note that since only asubblock of Ω is considered, these eigenvectors do not cor-respond to the true normal modes (which could be obtainedfrom the full coupling matrix). Nevertheless, these eigenvectorsdemonstrate the influence of the different coupling patterns onthe resulting eigenvectors, which can also be found for theeigenvectors of the full coupling matrix. For the R-helix, wherethe largest coupling constants occur between nearest-neighborresidues, the in-phase combination appears at approximately1662 cm-1, that is, shifted to higher wavenumbers with respectto the localized modes. In contrast, for the 310-helix, where thesecond nearest-neighbor coupling constants are larger than thenearest-neighbor ones, the in-phase combination appears at
approximately 1640 cm-1, that is, shifted to lower wavenumberswith respect to the localized modes.
About 13 cm-1 of the total shift of the amide I peak betweenthe R-helix and the 310-helix could be explained by a shift ofthe vibrational frequencies of the localized modes. The remain-ing shift of about 8 cm-1 can be attributed to the differentstructure of the coupling matrix Ω. While in the case of theR-helix, the coupled mode with the highest intensity appears athigher wavenumbers than the localized modes, as in the caseof the 310-helix the coupled mode with the highest intensity atlower wavenumbers than the localized modes. By employingan analysis in terms of localized modes, it is possible to separatethese two contributions to the shift of the vibrational frequencyand to further analyze both contributions.
4.5. Analysis of the Bands in the Extended Amide IIIRegion. The extended amide III region of the vibrational spectraof polypeptides and proteins approximately comprises thewavenumber range between 1200 and 1350-1400 cm-1. In thisregion, a number of bands appear that are due to the couplingof the “classical amide III” mode, which is an in-phasecombination of the N-H bending and the C-N stretchingvibration of the amide group, with the CR-H bending vibrations.Because of this coupling, these modes in the extended amideIII region are particularly sensitive to changes in the secondarystructure,65,39,66 which has been explored in a number ofexperimental and theoretical studies attempting to exploit thissensitivity for the determination of protein structure usingvibrational spectroscopy.57,67–69 Mostly, the bands in the extendedamide III region are measured in Raman and in UV resonanceRaman spectroscopy, which enhances these backbone vibrations.
Nevertheless, the understanding of how the secondarystructure determines the vibrational frequencies of the bands inthe extended amide III region still remains rather incomplete.Most of the knowledge concerning the origin of the bands inthe extended amide III region comes from experimental andtheoretical investigations performed for di- or tripeptides. Intwo pioneering studies,70,71 which still form the basis for mostdiscussions of the extended amide III region in polypeptidesand proteins, Diem and co-workers measured the IR and Ramanspectra of various isotopomers of (S,S)-alanylalanine. They findthat the classical amide III mode, which can be observed in theisotopomer deuteriated at both CR positions, appears at 1336cm-1. The CR-H bending modes of the C-terminal residueappear at 1330 and 1279 cm-1, while those of the N-terminalresidue are found at 1355 and 1305 cm-1. In the nondeuteriatedisotopomer, these five modes strongly couple to a set of normal
TABLE 3: Subblock of the Amide I Coupling Matrices Ω Corresponding to the Localized Modes on Residues 7 to 12 for(Ala)20 in the Conformation of an r-Helix and of a 310-Helixa
R-helix 7 8 9 10 11 12
7 1659.1 8.5 –2.2 –4.2 –0.4 –0.58 8.5 1655.9 7.9 –2.3 –4.2 –0.49 –2.2 7.9 1654.6 8.2 –2.2 –4.410 –4.2 –2.3 8.2 1654.9 8.3 –2.111 –0.4 –4.2 –2.2 8.3 1654.8 8.212 –0.5 –0.4 –4.4 –2.1 8.2 1655.8
310-helix 7 8 9 10 11 12
7 1643.1 2.5 –3.7 –0.7 –0.6 –0.68 2.5 1641.8 2.7 –3.7 –0.8 –0.69 –3.7 2.7 1640.4 2.8 –3.8 –0.810 –0.7 –3.7 2.8 1641.7 2.4 –3.711 –0.6 –0.8 –3.8 2.4 1640.5 2.512 –0.6 –0.6 –0.8 –3.7 2.5 1641.1
a The phase of the localized modes is chosen such that all nearest-neighbor coupling constants Ωi,i+1 are positive. All values in cm-1.
6568 J. Phys. Chem. B, Vol. 113, No. 18, 2009 Jacob et al.

modes that are combinations of the classical amide III modeand CR-H bending vibrations.
However, one has to realize that while for this small dipeptidethe two CR-H groups are very different (with differences inthe CR-H bending frequencies of approximately 25 cm-1), inlarger polypeptide or proteins the CR-H groups on both sidesof the amide group are in general in a very similar environmentand, therefore, can be expected to have similar vibrationalfrequencies. This will significantly affect the coupling betweenCR-H bending and N-H bending modes and thus also changethe resulting vibrational frequencies. Therefore, studies inves-tigating the structural dependence of the amide III bands fordi- or tripeptides (see, e.g., refs 72 and 73) in many cases cannotbe employed directly to extrapolate to larger polypeptides andproteins.
Therefore, calculations on larger polypeptides are mandatoryin order to investigate the structural dependence of the bandsin the amide III region, and an analysis in terms of localizedmodes can be employed to gain an understanding of the factorsdetermining the observed bands. In our calculated spectra, forR-helical and 310-helical (Ala)20, three distinct bands in theextended amide III region can be identified, which in Table 1have been designated as CR-H bending (I), CR-H bending (II),and amide III.
In order to gain a better understanding of the origin of thesebands, we transform the normal modes within each of theseband to localized modes. Since the localization procedure isapplied to each of the three bands separately, these modes willbe referred to as band-localized modes. The localized modeswith their main contribution on residue 10 are visualized in
Figure 6a as representative examples of the localized modescorresponding to the three bands. Since only a very limitednumber of atoms contributes to these localized modes thevisualization of these modes is greatly simplified, and it issufficient to only show the atom of residues 9 and 10, since thecontributions of all other atoms are negligible.
As Figure 6a shows, the CR-H bending (I) modes are mainlydue to a vibration of the CR-H group along the direction ofthe N-CR bond, while the CR-H bending (II) mode is due toa vibration of the CR-H group that is approximately perpen-dicular to the N-CR bond. In both cases, also smaller contribu-tions of an N-H bending vibration and of an asymmetric CH3
bending vibration are present. The modes designated as amideIII are mainly due to the classical amide III vibration, that is,an in-phase combination of the N-H bending and C-Nstretching vibrations of the amide group. However, it also showslarge contributions of a CR-H bending vibration which isapproximately perpendicular to the N-CR bond and of anasymmetric CH3 bending vibration. We note that this assign-ment is consistent with the experimental IR and Raman spectraof (all-S)-polyalanine given in ref 42, where also three bandsare observed in the extended amide III region. Upon deuteriationof the N-H groups, the two bands at higher wavenumbers (i.e.,those that are mainly due to CR-H bending) only shift slightlyby less than 10 cm-1, while the band at lower wavenumber (i.e.,the classical amide III band) shifts outside the extended amideIII region.
However, one distinct feature of our calculated spectra thatdoes not agree with the experimental spectra of polyalanine arethe two maxima that are found for the amide III band. These
Figure 6. Localized modes for the extended amide III region of R-helical (Ala)20 obtained by performing the localization (a) for the subsets ofnormal modes in each of the three bands individually (band-localized modes) and (b) for the subset of all normal modes within the three bands atonce (region-localized modes). Only residues 9 and 10 are shown, the remaining parts of the helix are left out for clarity. For each set of localizedmodes, only the modes with the largest contribution on residue 10 are shown.
Spectra of Polypeptides in Terms of Localized Vibrations J. Phys. Chem. B, Vol. 113, No. 18, 2009 6569

appear in the IR spectra at 1241 and 1221 cm-1 for the R-helixand at 1245 and 1223 cm-1 for the 310-helix. This can beunderstood by considering the vibrational frequencies of thelocalized modes obtained for the amide III band. While for thecentral residues, these are in the range between 1235 to 1250cm-1, those of the terminal residues are shifted to significantlylower wavenumbers and appear between 1200 and 1230 cm-1.Therefore, the maxima at 1221 and 1223 cm-1, respectively,are due to the terminal residues. For these residues thefrequencies of the localized amide III modes are significantlylower, since at the termini the amide groups are only involvedin one hydrogen bond while for the central residues they areinvolved in two hydrogen bonds. For the amide III band, thisdifferent hydrogen bonding has a much larger effect than forthe CR-H bending modes, where the shift of the frequenciesof the localized modes on the terminal residues is with onlyabout 10 cm-1 much smaller.
To obtain a more detailed picture of the coupling betweenthe CR-H bending and the amide III vibrations, it is beneficialto consider another set of localized modes. Instead of performingthe localization for each of the three bands in the extended amideIII region separately, which leads to the band-localized modesdiscussed above, one can also perform the localization for allnormal modes within the extended amide III region. Theresulting localized modes will be referred to as region-localizedmodes. Similar to the band-localized modes, the region-localizedmodes on different residues are very similar, and for each residueone finds three different region-localized modes with their maincontribution on this residue.
As a representative example, the three region-localized modeswith the main contribution on residue 10 are shown in Figure6b. As can be seen, the region-localized modes differ from theband-localized modes. While for the latter, the CR-H bendingand the classical amide III vibration are mixed, for the region-localized modes one obtains two almost pure CR-H bendingmodes (one in which the bending vibration is along the N-CR
bond and one in which it is perpendicular to the N-CR bond)and one almost pure amide III mode (i.e., an in-phase combina-tion of the N-H bending and the C-N stretching vibration).
The coupling between the pure CR-H bending and amideIII modes can now be analyzed by considering the couplingmatrix Ω with respect to the region-localized modes. Thesubblock of Ω corresponding to the modes on residues 9 and10 is given in Table 4 for both the R-helical and the 310-helicalconformation of (Ala)20. Note that in this Table the localizedmodes on each residue are not ordered according to theirvibrational frequency but according to the order in which theinvolved groups of atoms appear in the polypeptide.
The different coupling constants are affected by the changein secondary structure between the two considered conformersin different ways. For the coupling between the amide III modeand the CR-H bending modes on the same residue one findscoupling constants of approximately 12 cm-1 and approximately16 cm-1 for both the R-helix and for the 310-helix. Theorientation between the groups involved in this vibration (theamide group and the CR-H group of the same residue) isdetermined by the backbone dihedral angle (i.e., the N-CR
torsional angle). This torsional angle is very similar for bothstructures, which explains the almost identical coupling con-stants. In contrast to this, for the coupling between the amideIII mode on residue 10 with the CR-H bending modes onresidue 9, the coupling constants differ for the two conformers.While coupling constants of -7.8 and 11.6 cm-1 are found forthe R-helical conformation, the corresponding coupling constantsare -4.1 and 8.1 cm-1 in the 310-helix. For these couplingconstants, the orientation between the involved groups, theCR-H of residue 9 and the amide group connecting residues 9and 10, is determined by the backbone dihedral angle ψ, whichdiffers in the two conformers. This change is reflected by thechange in the coupling constants. For the coupling between theamide III mode of residue 9 and the CR-H bending modes onresidue 10, the coupling constants are smaller than 2 cm-1,which can be understood since the groups involved in thesevibrations are further apart. Similarly, the coupling constantsbetween localized modes on residues which are further apart(i.e., those couplings not shown in Table 4) are generally smallerthan 2 cm-1.
TABLE 4: Subblock of the Extended Amide III Coupling Matrices Ω Corresponding to the Region-Localized Modes onResidues 9 and 10 of r-Helical and 310-Helical (Ala)20
a
R-helix
9 10
AmIII CRH (I) CRH (II) AmIII CRH (I) CRH (II)
9 AmIII 1255.1 12.2 15.5 –7.5 0.5 –0.9CRH (I) 12.2 1315.2 3.9 –7.8 0.9 –0.1CRH (II) 15.5 3.9 1276.1 11.6 –0.6 0.0
10 AmIII –7.5 –7.8 11.6 1256.5 11.8 15.2CRH (I) 0.5 0.9 –0.6 11.8 1315.8 3.8CRH (II) –0.9 –0.1 0.0 15.2 3.8 1275.4
310-helix
9 10
AmIII CRH (I) CRH (II) AmIII CRH (I) CRH (II)
9 AmIII 1254.3 11.7 16.6 –6.6 0.2 –1.0CRH(I) 11.7 1316.2 5.4 –4.1 1.2 0.0CRH(II) 16.6 5.4 1271.3 8.1 –0.3 0.1
10 AmIII –6.6 –4.1 8.1 1254.0 11.4 16.7CRH(I) 0.2 1.2 –0.3 11.4 1314.4 5.9CRH(II) –1.0 0.0 0.1 16.7 5.9 1270.7
a “CRH (I)” and “CRH (II)” refer to the two CR-H bending modes, while “AmIII” is used for the classical amide III mode. The phase of theregion-localized modes is chosen as shown in Fig. 6b. All values in cm-1.
6570 J. Phys. Chem. B, Vol. 113, No. 18, 2009 Jacob et al.

In addition to the differences in the coupling constants, alsothe changes in the vibrational frequencies of the localized modes(i.e., the diagonal elements of the coupling matrix shown inTable 4) have to be considered. While the wavenumbers of theregion-localized amide III and CR-H bending (I) modes arevery similar for both conformations, the region-localized CR-Hbending (II) mode is shifted to lower wavenumbers by ap-proximately 5 cm-1 in the 310-helix. This change in thewavenumber of the localized CR-H bending (II) mode, togetherwith the changes in the coupling constants discussed above,leads to the observed shift of the CR-H bending (II) to lowerwavenumbers in the calculated spectra.
This analysis shows that changes in the structure affect thepositions of the bands in the extended amide III region indifferent way. First, structural changes influence the localelectronic structure and bond strengths, which will affect thefrequencies of the localized CR-H bending and amide III modes.In particular the amide III modes can be expected to be verysensitive to changes in the strengths of the internal hydrogenbonds.74 Second, structural changes influence the couplingbetween the localized CR-H bending and amide III modes.While the coupling constant between the amide III and theCR-H bending modes on the same residue can be expected tobe sensitive to changes in the torsional angle , the couplingconstant between the CR-H bending modes and the amide IIImode on the following residue can be expected to be sensitiveto ψ. Third, also the coupling between the amide III modes onadjacent residues as well as the coupling between the CR-Hbending modes on such residues might be sensitive to structuralchanges. The analysis in terms of region-localized modes allowsus to separate these different effects. However, in order to fullyunderstand the different structural influences on the peaks inthe extended amide III region, a more detailed analysis for alarger number of different structures will be necessary.
5. Conclusions
In this paper, we have applied our recently developedmethodology for the analysis of calculated vibrational spectrain terms of localized modes18 to study the IR and Raman spectraof the polypeptide (Ala)20. In particular, we have analyzed thedifferences between the vibrational spectra of an R-helical anda 310-helical conformation. The localized modes, which areobtained from a unitary transformation of the normal modesbelonging to one band or a specific region in the spectrum, aremuch simpler and therefore better suited for such an analysisthan the normal modes. For the (Ala)20 polypeptide consideredhere, the localized modes for one band in the vibrationalspectrum form a set of modes that involve similar vibrations,each of them on a different amino acid residue, while the originalnormal modes are delocalized combinations of these localizedmodes.
Since the total IR and Raman intensities of a vibrational bandare invariant under unitary transformations of the normal modescontributing to this band, the localized modes can be used toanalyze these total intensities instead of the normal modes.Furthermore, since the localized modes each involve very similaratomic displacements on the different residues, they will ingeneral each give a very similar contribution to the totalintensity. Therefore, it is sufficient to consider one representativelocalized mode in order to analyze the total IR or Ramanintensity of a certain vibrational band. This has been demon-strated for the Raman intensity of the amide II band, whichshows a significantly larger intensity for the 310-helix than forthe R-helix. By considering only the amide II localized mode
on residue 12, which reflects the change in the total Ramanintensity, the origin of this difference can be traced back tocontributions of certain groups of atoms. We showed that theanisotropic Raman invariant γ, and particularly the contributionof the C-N vibration, are responsible for the increased amideII Raman intensity.
Furthermore, also the positions of the bands in the IR andRaman spectra can be analyzed in terms of localized modes.This feature has been employed to analyze the position of theamide I band, which in the 310-helix is shifted to lowerwavenumbers by approximately 20 cm-1 compared to theR-helix. Two different contributions have to be considered inorder to explain this shift. A part of this shift is accounted forby the shift of the vibrational frequencies of the localized amideI modes. The remaining part of the shift can be attributed tochanges in the coupling constants. For the R-helix, the nearest-neighbor coupling constant is the largest, which leads to a shiftof the highest-intensity modes to higher wavenumbers withrespect to the vibrational frequencies of the localized modes.In the 310-helix, the second nearest-neighbor coupling constantis larger than the nearest-neighbor coupling constant, whichleads to a different coupling pattern and results in a shift towardlower wavenumbers for the highest-intensity modes. Moregenerally speaking, we show how the intensity distributionwithin one vibrational band can be explained in terms of thevibrational coupling matrix Ω, which determines how thelocalized modes couple to other localized modes, on the onehand and the intensity coupling matrix, which determines howthe intensity is distributed among these coupled modes, on theother hand.
Finally, for the peaks found in the extended amide III regionof the IR and Raman spectra of the two conformers of (Ala)20
considered, we have demonstrated how the positions of thesepeaks can be analyzed. Two of the peaks in this region aremainly due to CR-H bending vibrations, while the third one ismainly due to the classical amide III vibration (i.e., an in-phasecombination of the N-H bending and the C-N stretchingmode). However, the localized modes obtained for each of thesebands show that there is a significant coupling between thesemodes. By performing the localization not for each bandseparately, but by localizing all normal modes in the extendedamide III region at once, one obtains what we call region-localized modes, which are almost pure CR-H bending andclassical amide III vibrations, respectively. Using the region-localized modes, it is possible to extract vibrational frequenciesof the pure CR-H bending and classical amide III vibrations aswell as coupling constants for the interaction between them.The positions in the extended amide III region can then beunderstood by both the differences in frequencies of the region-localized modes and by the differences in the coupling constantsbetween them. It appears that the coupling constants describingcouplings between different local vibrations are sensitive todifferent structural changes. While the coupling between theCR-H bending modes and the classical amide III mode can beexpected to depend on the backbone dihedral angle , thecoupling between the CR-H bending modes and the classicalamide III mode on the following residue appears to be sensitiveto changes in the backbone dihedral angle ψ. A detailed analysisof these couplings might lead to a better understanding of thedependence of vibrational frequencies observed in the extendedamide III region on changes in the secondary structure.
However, it is not straightforward to extract general rulesfor relations between secondary structure and vibrational spectrafrom the results presented here. First, only two structural models
Spectra of Polypeptides in Terms of Localized Vibrations J. Phys. Chem. B, Vol. 113, No. 18, 2009 6571
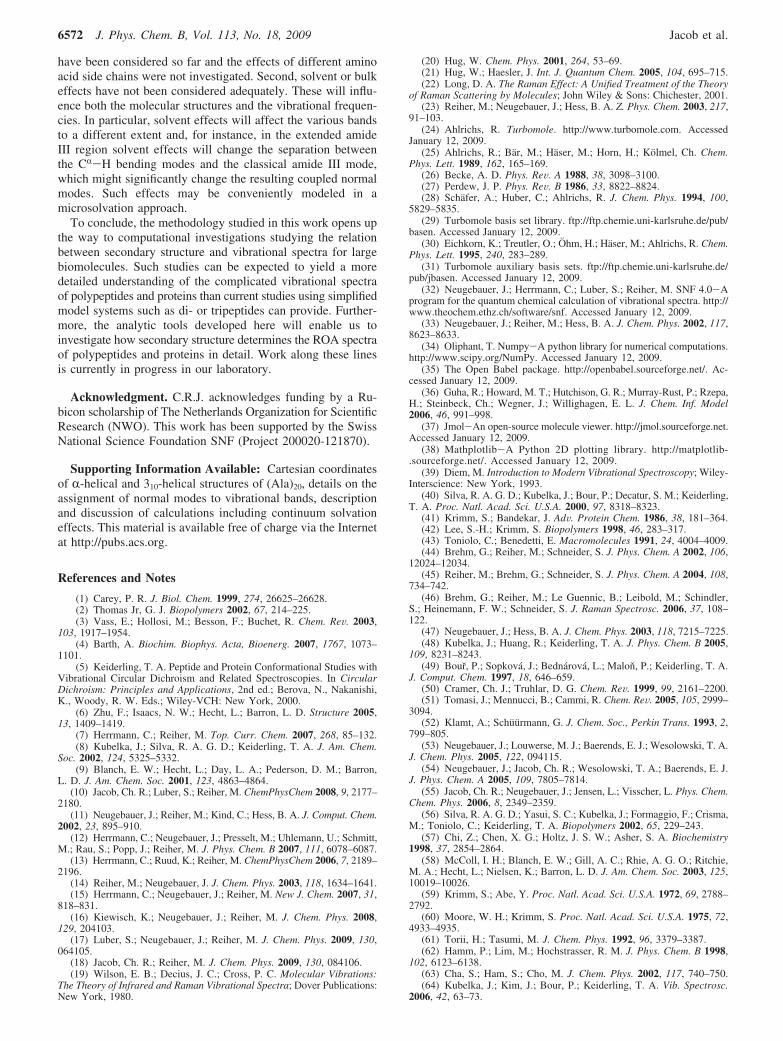
have been considered so far and the effects of different aminoacid side chains were not investigated. Second, solvent or bulkeffects have not been considered adequately. These will influ-ence both the molecular structures and the vibrational frequen-cies. In particular, solvent effects will affect the various bandsto a different extent and, for instance, in the extended amideIII region solvent effects will change the separation betweenthe CR-H bending modes and the classical amide III mode,which might significantly change the resulting coupled normalmodes. Such effects may be conveniently modeled in amicrosolvation approach.
To conclude, the methodology studied in this work opens upthe way to computational investigations studying the relationbetween secondary structure and vibrational spectra for largebiomolecules. Such studies can be expected to yield a moredetailed understanding of the complicated vibrational spectraof polypeptides and proteins than current studies using simplifiedmodel systems such as di- or tripeptides can provide. Further-more, the analytic tools developed here will enable us toinvestigate how secondary structure determines the ROA spectraof polypeptides and proteins in detail. Work along these linesis currently in progress in our laboratory.
Acknowledgment. C.R.J. acknowledges funding by a Ru-bicon scholarship of The Netherlands Organization for ScientificResearch (NWO). This work has been supported by the SwissNational Science Foundation SNF (Project 200020-121870).
Supporting Information Available: Cartesian coordinatesof R-helical and 310-helical structures of (Ala)20, details on theassignment of normal modes to vibrational bands, descriptionand discussion of calculations including continuum solvationeffects. This material is available free of charge via the Internetat http://pubs.acs.org.
References and Notes
(1) Carey, P. R. J. Biol. Chem. 1999, 274, 26625–26628.(2) Thomas Jr, G. J. Biopolymers 2002, 67, 214–225.(3) Vass, E.; Hollosi, M.; Besson, F.; Buchet, R. Chem. ReV. 2003,
103, 1917–1954.(4) Barth, A. Biochim. Biophys. Acta, Bioenerg. 2007, 1767, 1073–
1101.(5) Keiderling, T. A. Peptide and Protein Conformational Studies with
Vibrational Circular Dichroism and Related Spectroscopies. In CircularDichroism: Principles and Applications, 2nd ed.; Berova, N., Nakanishi,K., Woody, R. W. Eds.; Wiley-VCH: New York, 2000.
(6) Zhu, F.; Isaacs, N. W.; Hecht, L.; Barron, L. D. Structure 2005,13, 1409–1419.
(7) Herrmann, C.; Reiher, M. Top. Curr. Chem. 2007, 268, 85–132.(8) Kubelka, J.; Silva, R. A. G. D.; Keiderling, T. A. J. Am. Chem.
Soc. 2002, 124, 5325–5332.(9) Blanch, E. W.; Hecht, L.; Day, L. A.; Pederson, D. M.; Barron,
L. D. J. Am. Chem. Soc. 2001, 123, 4863–4864.(10) Jacob, Ch. R.; Luber, S.; Reiher, M. ChemPhysChem 2008, 9, 2177–
2180.(11) Neugebauer, J.; Reiher, M.; Kind, C.; Hess, B. A. J. Comput. Chem.
2002, 23, 895–910.(12) Herrmann, C.; Neugebauer, J.; Presselt, M.; Uhlemann, U.; Schmitt,
M.; Rau, S.; Popp, J.; Reiher, M. J. Phys. Chem. B 2007, 111, 6078–6087.(13) Herrmann, C.; Ruud, K.; Reiher, M. ChemPhysChem 2006, 7, 2189–
2196.(14) Reiher, M.; Neugebauer, J. J. Chem. Phys. 2003, 118, 1634–1641.(15) Herrmann, C.; Neugebauer, J.; Reiher, M. New J. Chem. 2007, 31,
818–831.(16) Kiewisch, K.; Neugebauer, J.; Reiher, M. J. Chem. Phys. 2008,
129, 204103.(17) Luber, S.; Neugebauer, J.; Reiher, M. J. Chem. Phys. 2009, 130,
064105.(18) Jacob, Ch. R.; Reiher, M. J. Chem. Phys. 2009, 130, 084106.(19) Wilson, E. B.; Decius, J. C.; Cross, P. C. Molecular Vibrations:
The Theory of Infrared and Raman Vibrational Spectra; Dover Publications:New York, 1980.
(20) Hug, W. Chem. Phys. 2001, 264, 53–69.(21) Hug, W.; Haesler, J. Int. J. Quantum Chem. 2005, 104, 695–715.(22) Long, D. A. The Raman Effect: A Unified Treatment of the Theory
of Raman Scattering by Molecules; John Wiley & Sons: Chichester, 2001.(23) Reiher, M.; Neugebauer, J.; Hess, B. A. Z. Phys. Chem. 2003, 217,
91–103.(24) Ahlrichs, R. Turbomole. http://www.turbomole.com. Accessed
January 12, 2009.(25) Ahlrichs, R.; Bar, M.; Haser, M.; Horn, H.; Kolmel, Ch. Chem.
Phys. Lett. 1989, 162, 165–169.(26) Becke, A. D. Phys. ReV. A 1988, 38, 3098–3100.(27) Perdew, J. P. Phys. ReV. B 1986, 33, 8822–8824.(28) Schafer, A.; Huber, C.; Ahlrichs, R. J. Chem. Phys. 1994, 100,
5829–5835.(29) Turbomole basis set library. ftp://ftp.chemie.uni-karlsruhe.de/pub/
basen. Accessed January 12, 2009.(30) Eichkorn, K.; Treutler, O.; Ohm, H.; Haser, M.; Ahlrichs, R. Chem.
Phys. Lett. 1995, 240, 283–289.(31) Turbomole auxiliary basis sets. ftp://ftp.chemie.uni-karlsruhe.de/
pub/jbasen. Accessed January 12, 2009.(32) Neugebauer, J.; Herrmann, C.; Luber, S.; Reiher, M. SNF 4.0-A
program for the quantum chemical calculation of vibrational spectra. http://www.theochem.ethz.ch/software/snf. Accessed January 12, 2009.
(33) Neugebauer, J.; Reiher, M.; Hess, B. A. J. Chem. Phys. 2002, 117,8623–8633.
(34) Oliphant, T. Numpy-A python library for numerical computations.http://www.scipy.org/NumPy. Accessed January 12, 2009.
(35) The Open Babel package. http://openbabel.sourceforge.net/. Ac-cessed January 12, 2009.
(36) Guha, R.; Howard, M. T.; Hutchison, G. R.; Murray-Rust, P.; Rzepa,H.; Steinbeck, Ch.; Wegner, J.; Willighagen, E. L. J. Chem. Inf. Model2006, 46, 991–998.
(37) Jmol-An open-source molecule viewer. http://jmol.sourceforge.net.Accessed January 12, 2009.
(38) Mathplotlib-A Python 2D plotting library. http://matplotlib-.sourceforge.net/. Accessed January 12, 2009.
(39) Diem, M. Introduction to Modern Vibrational Spectroscopy; Wiley-Interscience: New York, 1993.
(40) Silva, R. A. G. D.; Kubelka, J.; Bour, P.; Decatur, S. M.; Keiderling,T. A. Proc. Natl. Acad. Sci. U.S.A. 2000, 97, 8318–8323.
(41) Krimm, S.; Bandekar, J. AdV. Protein Chem. 1986, 38, 181–364.(42) Lee, S.-H.; Krimm, S. Biopolymers 1998, 46, 283–317.(43) Toniolo, C.; Benedetti, E. Macromolecules 1991, 24, 4004–4009.(44) Brehm, G.; Reiher, M.; Schneider, S. J. Phys. Chem. A 2002, 106,
12024–12034.(45) Reiher, M.; Brehm, G.; Schneider, S. J. Phys. Chem. A 2004, 108,
734–742.(46) Brehm, G.; Reiher, M.; Le Guennic, B.; Leibold, M.; Schindler,
S.; Heinemann, F. W.; Schneider, S. J. Raman Spectrosc. 2006, 37, 108–122.
(47) Neugebauer, J.; Hess, B. A. J. Chem. Phys. 2003, 118, 7215–7225.(48) Kubelka, J.; Huang, R.; Keiderling, T. A. J. Phys. Chem. B 2005,
109, 8231–8243.(49) Bour, P.; Sopkova, J.; Bednarova, L.; Malon, P.; Keiderling, T. A.
J. Comput. Chem. 1997, 18, 646–659.(50) Cramer, Ch. J.; Truhlar, D. G. Chem. ReV. 1999, 99, 2161–2200.(51) Tomasi, J.; Mennucci, B.; Cammi, R. Chem. ReV. 2005, 105, 2999–
3094.(52) Klamt, A.; Schuurmann, G. J. Chem. Soc., Perkin Trans. 1993, 2,
799–805.(53) Neugebauer, J.; Louwerse, M. J.; Baerends, E. J.; Wesolowski, T. A.
J. Chem. Phys. 2005, 122, 094115.(54) Neugebauer, J.; Jacob, Ch. R.; Wesolowski, T. A.; Baerends, E. J.
J. Phys. Chem. A 2005, 109, 7805–7814.(55) Jacob, Ch. R.; Neugebauer, J.; Jensen, L.; Visscher, L. Phys. Chem.
Chem. Phys. 2006, 8, 2349–2359.(56) Silva, R. A. G. D.; Yasui, S. C.; Kubelka, J.; Formaggio, F.; Crisma,
M.; Toniolo, C.; Keiderling, T. A. Biopolymers 2002, 65, 229–243.(57) Chi, Z.; Chen, X. G.; Holtz, J. S. W.; Asher, S. A. Biochemistry
1998, 37, 2854–2864.(58) McColl, I. H.; Blanch, E. W.; Gill, A. C.; Rhie, A. G. O.; Ritchie,
M. A.; Hecht, L.; Nielsen, K.; Barron, L. D. J. Am. Chem. Soc. 2003, 125,10019–10026.
(59) Krimm, S.; Abe, Y. Proc. Natl. Acad. Sci. U.S.A. 1972, 69, 2788–2792.
(60) Moore, W. H.; Krimm, S. Proc. Natl. Acad. Sci. U.S.A. 1975, 72,4933–4935.
(61) Torii, H.; Tasumi, M. J. Chem. Phys. 1992, 96, 3379–3387.(62) Hamm, P.; Lim, M.; Hochstrasser, R. M. J. Phys. Chem. B 1998,
102, 6123–6138.(63) Cha, S.; Ham, S.; Cho, M. J. Chem. Phys. 2002, 117, 740–750.(64) Kubelka, J.; Kim, J.; Bour, P.; Keiderling, T. A. Vib. Spectrosc.
2006, 42, 63–73.
6572 J. Phys. Chem. B, Vol. 113, No. 18, 2009 Jacob et al.

(65) Lord, R. C. Appl. Spectrosc. 1977, 31, 187–194.(66) Overman, S. A.; Thomas, G. J., Jr. Biochemistry 1998, 37, 5654–
5665.(67) Asher, S. A.; Ianoul, A.; Mix, G.; Boyden, M. N.; Karnoup, A.;
Diem, M.; Schweitzer-Stenner, R. J. Am. Chem. Soc. 2001, 123, 11775–11781.
(68) Mikhonin, A. V.; Ahmed, Z.; Ianoul, A.; Asher, S. A. J. Phys.Chem. B 2004, 108, 19020–19028.
(69) Mikhonin, A. V.; Bykov, S. V.; Myshakina, N. S.; Asher, S. A. J.Phys. Chem. B 2006, 110, 1928–1943.
(70) Oboodi, M. R.; Alva, C.; Diem, M. J. Phys. Chem. 1984, 88, 501–505.
(71) Diem, M.; Lee, O.; Roberts, G. M. J. Phys. Chem. 1992, 96, 548–554.
(72) Mirkin, N. G.; Krimm, S. J. Phys. Chem. A 2002, 106, 3391–3394.(73) Schweitzer-Stenner, R.; Eker, F.; Huang, Q.; Griebenow, K.; Mroz,
P. A.; Kozlowski, P. M. J. Phys. Chem. B 2002, 106, 4294–4304.(74) Myshakina, N. S.; Ahmed, Z.; Asher, S. A. J. Phys. Chem. B 2008,
112, 11873–11877.
JP900354G
Spectra of Polypeptides in Terms of Localized Vibrations J. Phys. Chem. B, Vol. 113, No. 18, 2009 6573