Analysis of Savings-Investment Gap in Sub-Saharan Africa ...
28
Analysis of Savings-Investment Gap in Sub-Saharan Africa: Does the nexus between Foreign Remittances and Domestic Financial Sector matter? Oluwatosin Adeniyi University of Ibadan Joshua Ogunjimi NISER: Nigerian Institute of Social and Economic Research Wasiu Adekunle ( [email protected] ) Nigerian Economic Summit Group (NESG) https://orcid.org/0000-0003-4968-3642 Musibau Babatunde University of Ibadan Edward Omiwale Bowen University Research Article Keywords: Savings-Investment Gap, Remittances, Financial Development, Panel ARDL Posted Date: March 31st, 2021 DOI: https://doi.org/10.21203/rs.3.rs-239037/v1 License: This work is licensed under a Creative Commons Attribution 4.0 International License. Read Full License
Transcript of Analysis of Savings-Investment Gap in Sub-Saharan Africa ...
Analysis of Savings-Investment Gap in Sub-SaharanAfrica: Does the nexus between ForeignRemittances and Domestic Financial Sector matter?Oluwatosin Adeniyi
University of IbadanJoshua Ogunjimi
NISER: Nigerian Institute of Social and Economic ResearchWasiu Adekunle ( [email protected] )
Nigerian Economic Summit Group (NESG) https://orcid.org/0000-0003-4968-3642Musibau Babatunde
University of IbadanEdward Omiwale
Bowen University
Research Article
Keywords: Savings-Investment Gap, Remittances, Financial Development, Panel ARDL
Posted Date: March 31st, 2021
DOI: https://doi.org/10.21203/rs.3.rs-239037/v1
License: This work is licensed under a Creative Commons Attribution 4.0 International License. Read Full License
1 | P a g e
Analysis of Savings-Investment Gap in Sub-Saharan Africa: Does the nexus between
Foreign Remittances and Domestic Financial Sector matter?
Abstract
In recent times, increasing attention is being paid to examine the developmental impact of
remittances inflow, particularly due to the emergence of remittances as the fastest growing
source of capital flows for developing countries. To this end, we contribute to the literature by
analyzing the interactive effects of remittances and financial development on savings-
investment gap for a panel of 18 Sub-Saharan African (SSA) countries over the period of 1990
to 2017. Our Panel ARDL model estimation showed that higher remittances have significant
reducing effect on savings-investment gap in the long run, and this becomes magnified while
accounting for individual and interactive effects of remittances and financial development. We
also uncovered the widening effects of rising real GDP growth and bank deposits over a long-
term horizon, whereas higher private sector credit widens the savings-investment gap only in
the short-run. Meanwhile, liquid liabilities have no significant effect on savings-investment
gap both in the short run and long run. We further offered evidence on the complementarity
and substitutability effects of remittances and financial development over the short-term and
long-term horizons, respectively. We also demonstrated the superior forecast accuracy of the
predictive savings-investment gap model - that accounts for both individual and interactive
effects - over other specifications, and this is robust to the choice of financial development
indicators, samples and forecast horizons. Our results underscore the urgent need for a
reduction of transfer costs, so as to encourage both migrant workers and their beneficiaries to
make use of the official channels for sending and receiving remittances in the region.
Keywords: Savings-Investment Gap, Remittances, Financial Development and Panel ARDL.

2 | P a g e
1. Introduction
The relative importance of remittances, as a source of foreign capital flows, is gradually
becoming more quintessential in recent times given the upsurge in remittances sent by migrant
workers in developed economies to their home countries, mostly developing economies (Le,
2011). Remittances have outpaced foreign direct investment (FDI), both as a share of GDP and
in absolute terms, to become the largest source of foreign capital inflows to low and middle
income economies and it is three times larger than official development assistance (World
Bank, 2019). Remittances inflow to low and middle income countries rose markedly from
about $285 million in 1970 to $531 billion in 2018 with the share of Sub-Saharan African
countries averaging 8.2% over a similar period. Remittances inflow to Sub-Saharan Africa rose
sharply from $23 million (0.04% of GDP) in 1970 to $48 billion (2.82% of GDP) in 2018
(World Bank, 2019). However, it is not the absolute size of remittances flow that matters for
policy issues, but its share in total GDP of the recipient country (Akindipe, 2020).
The foregoing suggests that despite the increasing inflow of remittances, its share in total GDP
is still at low ebb. This could be attributed to the migrant stocks, wage structure and economic
conditions of the foreign countries where they reside, exchange rate movement, and transaction
costs of sending and receiving remittances, among others (Lartey, 2013; Dash, 2020;
KNOMAD, 2020). Further, Tung (2018) alluded to the fact that the actual volume of
remittances is underreported because remittances inflow through the informal channel are
usually not captured in the official statistics. This suggests that concerted efforts need to be
made by the government and other stakeholders in Sub-Saharan African countries to boost the
inflow of remittances to the region, especially through the formal channels. Given the
decreasing inflow of other sources of foreign capital including foreign direct investment (FDI),
foreign portfolio investment (FPI) and official development assistance (ODA), it is imperative
to improve the growth enhancing effects of remittances, particularly through the investment
channel.
There are basically two motives why migrants transfer a fraction of their incomes to their home
countries, and they are altruistic and portfolio motives (see, for instance, Bouhga-Hagbe,
2004 and Barajas, et al., 2009). The altruistic motive relates to assisting the migrant’s families
in the home country, especially during economic downturns (counter-cyclical behaviour),
which suggests that the migrant derives satisfaction from his/her family’s utility. On the other
hand, the portfolio motive is investment-driven, particularly for portfolio diversification
rationale (pro-cyclical behavior). Intuitively, remittances engender both income transfer and
capital flows. Nevertheless, these two motives have economic implications, including boosting
consumption (a demand-side phenomenon) and stimulating production (a supply-side
phenomenon), which helps to improve the receiving country’s domestic investment and
economic growth (OECD, 2006).
The proponents of foreign remittances argued for its relative stability and increment during
economic downturns in the recipient country compared to foreign direct investment and foreign
portfolio investment (Aggarwal, Demirgüç-Kunt and Pería, 2011). Other benefits of
remittances to the recipient household or country include: improvement in recipient’s standard
3 | P a g e
of living, expansion of consumption and investment, relaxation of financial constraints,
stability of institutions, promotion of industrialization through the financial development
channel, and encouragement of investment in healthcare and education, among others
(Bjuggren, Dzansi and Shukur, 2010; Efobi, Asongu, Okafor, Tchamyou and Tanankem, 2016;
Qiang, Khurshid, Calin and Khan, 2019; Akindipe, 2020). On the other hand, the devastating
impacts of higher remittances inflow in the recipient country include its ability to reduce the
incentive to work and save, stoke inflationary pressures and drag economic growth through the
real exchange rate appreciation channel (Acosta, et al., 2008; Sobiech, 2019).
There are numerous country-specific studies on the linkage between remittances and other
macroeconomic variables, such as, financial sector development and economic growth1. We
also acknowledge panel-data studies on developing countries2. However, studies with specific
focus on Sub-Saharan African countries did not consider the channel through which the
remittances-financial development nexus affects investment3. Nonetheless, the study by
Okodua (2013) was limited to the impact of remittances on private investment in 31 Sub-
Saharan African countries using the GMM technique, while Lartey (2013) only examined the
effects of remittances on investment and growth. To this end, we contribute to the extant
literature by investigating whether the nexus between foreign remittances and financial sector
development matters in pluging the domestic savings-investment gap in Sub-Saharan Africa.
In specific terms, we proffer answers to the following research questions: (1) What is the
pairwise correlation: between remittances inflow and financial development; between
remittances inflow and savings-investment gap, as well as, between financial development and
savings-investment gap in Sub-Saharan Africa? (2) What is the role of the nexus between
foreign remittances and financial development in narrowing domestic savings-investment gap
in Sub-Saharan Africa? This will be done through examining the interactive effects of the three
most prominent financial development indicators (ratio of broad money supply to GDP, ratio
of private sector credit to GDP and ratio of liquid liabilities to GDP) with remittances on the
domestic savings-investment gap in the region.
Following the introduction, the rest of the paper is structured as follows. Section two gives a
snapshot of stylized facts. Section three presents a brief review of the relevant theoretical and
empirical literatures. Section four comprises the methodological approach and data utilized in
1See, for instance, Adenutsi (2011), Hassan and Shakur (2017), Peprah, Ofori and Asomani (2019), Kousar, Rais, Mansoor, Zaman, Shah and Ejaz (2019), Misati, Kamau and Nassir (2019), Olaniyan (2019), Garba, Adekunle and Adeniyi (2020). 2See, for instance, Bjuggren, Dzansi and Shukur (2010), Fayissa and Nsiah (2010), Abida and Sghaier (2014), Chowdhury (2016), Efobi, Asongu, Okafor, Tchamyou and Tanankem (2016), El Hamma (2016), Karikari, Mensah and Harvey (2016), Matuzeviciute and Butkus (2016), Ali, Law and Yusop (2018), El Hamma (2018), Tung (2018), Bangake and Eggoh (2019), Brown, Carmignani and Fayad (2019), Eggoh, Bangake and Semedo (2019), Qiang, Khurshid, Calin and Khan (2019), Sobiech (2019) and Dash (2020). 3See, for instance, Nyamongo, Misati, Kipyegon and Ndirangu (2012), Couharde and Generoso (2014), Adetou and Fiodendji (2019), Bandura, Zivanomoyo and Tsaurai (2019), Chitambara (2019), Olayungbo and Quadri (2019), Tah (2019).

4 | P a g e
this study. Section five entails empirical analysis and discussion of results. Section six
concludes the study.
2. Stylized Facts on Remittances, Migrant Stock & Savings-Investment Gap in SSA
2.1 Sub-Saharan Africa remains the least recipient of foreign remittances
Remittances inflows to low and middle income countries increased markedly by about 73%
from $307 billion in 2009 to $531 billion in 2018 with the share of Sub-Saharan Africa
averaging 6.6% and 6.9% of global remittances in both periods, respectively. East Asia and
Pacific remains the region with the highest remittances inflow among low and middle income
countries, while it is worrisome that Sub-Saharan Africa maintains its position as the lowest
recipient region of remittances over time (see Table 1). Nonetheless, there has been a
significant increase in remittances inflow to Sub-Saharan Africa. This could be attributed to
good economic conditions in high-income countries which host many migrants from Sub-
Saharan Africa.
Insert Table 1 here
2.2 Nigeria ranks first on remittances receipt over the past 2 decades
Table 2 presents the absolute values of remittances inflow to Sub-Saharan Africa. Senegal had
the highest remittance inflows in 1990 but fell to second and third positions in 2010 and 2017,
respectively. Botswana was seventh largest recipient of remittances in 1990 but later relegated
to being the least recipient from 2010 to 2017. Benin, Guinea and Namibia also ranked low in
terms of remittances inflow over a similar period. Meanwhile, Nigeria emerged the largest
recipient of remittances in the region since year 1995, even though the country took fourteenth
position out of 18 SSA countries under study in 1990. It is worthy of note that Ghana, which
ranked sixteenth on the remittance scale in 1990, climbed up the remittances inflow ladder to
attain the tenth and second positions in 2010 and 2017, respectively. Rwanda and Togo
achieved similar feat by moving up the chart of top recipients of remittances in Sub-Saharan
Africa. Noteworthy is the feat of Togo which rose from ninth position in 1990 to eighth in 2010
and maintained same position in 2017. Nonetheless, South Africa was in fourth position in
1990, third in 2010 but fell to sixth position in 2017. Similarly, Madagascar and Niger moved
up and down the remittances chart during the period under review. In general, remittances
inflow to Sub-Saharan Africa is remarkable and rising gradually over the years.
Insert Table 2 here
2.3 West Africa maintains lead in remittances inflow (percent of GDP) in the last 3 decades
The World Bank, as well as, the Sustainable Development Goals (SDG) indicator 17.3.2 gives
more credence to remittances as % of GDP than its absolute value, even though an increase in
remittances (in absolute value) would translate into higher ratios between remittances and GDP
as long as the former grows at a faster pace relative to the latter. In terms of remittances as %
of GDP, Table 3 shows that Togo topped the chart in 2005 and 2010 but was ousted by Ghana
and Senegal from 2015 upwards. It is worthy of note that only Senegal experienced an upward
trend throughout the period. Though, Benin ranked first in 1990, its position fell to twelfth
5 | P a g e
position in 2017. More so, despite being the highest remittances recipient (in absolute value)
in 2010 and 2017, Nigeria ranked third and fifth respectively on the remittance (% of GDP)
scale. Expectedly, Botswana which had the least remittances in absolute value in 2010 and
2017 also had the least remittances as % of GDP during these periods. Nonetheless, Côte
d'Ivoire maintained eleventh position in 1990 and 2010, but its rank fell to fourteenth in 2017.
Insert Table 3 here
2.4 In spite of recording a substantial increase in migrant stock, Sub-Saharan Africa has the
World’s highest remittances transfer cost
Apparently, most countries in Sub-Saharan Africa had a significant increase in the number of
emigrants over the years, thereby suggesting that higher number of emigrants is a probable
determinant of the increasing remittance flows to the region (see Table 4). However, the
Remittance Prices Worldwide database posits that the average cost of remitting $200 to low
and middle income countries stood at 6.8%, with Sub-Saharan Africa having the highest
average cost of about 9% (KNOMAD, 2020). This triples the SDG target 10.c of 3% and also
exceeds the global average of 7%. Unfortunately, intraregional remittance costs remain at
approximately 20% in the region despite the fact that intraregional migrants in SSA constitute
more than two-third of all global migrants from the region. The relatively high remittances
transfer cost is a disincentive to migrants who would prefer to send money home through
informal channels in a bid to reduce transaction costs. In addition, the high costs of transferring
money along various remittance corridors has lowered the gains from migration, especially for
poor recipients in the migrant’s home country. Recruitment costs charged migrant workers are
very high despite the SDG goal 10.7.1 - which aims at reducing recruitment costs. Most
migrants continue to face various recruitment misconducts including excessive charges. These
malpractices pose a serious challenge on the volume of remittances sent to migrant’s home
country, as well as, the volume of investment and standard of living of recipients (KNOMAD,
2020). It is therefore imperative that government and other stakeholders make concerted efforts
to address the high intraregional transaction costs.
Insert Table 4 here
2.5 Two-third of Sub-Saharan African countries under study have substantial savings-
investment gap
Savings-Investment gap expresses the difference between aggregate investment and aggregate
savings in an economy (see Table 5). A positive savings-investment gap shows that aggregate
savings fall short of aggregate investment. On the other hand, a negative savings-investment
gap indicates that economy-wide investment is below the economy-wide savings. Accordingly,
most of the countries (including Benin, Burkina Faso, Ghana, Guinea, Guinea-Bissau, Kenya,
Madagascar, Mali, Namibia, Niger, Rwanda and Senegal) have positive savings-investment
gap over the period of 1990 to 2017, whereas Cote d’Ivoire is the only country with negative
savings-investment gap over the same period. On the one hand, Botswana, Nigeria and South
Africa have predominantly negative savings-investment gap, while countries with
predominantly positive savings-investment gap are Cameroon and Togo (see Table 5).

6 | P a g e
Apparently, Botswana, which has the lowest remittance inflows (% of GDP) in the region, also
had a substantial savings-investment gap, such that, savings outweighed investment throughout
the period under review except in 2010 and 2015. Given that 66% of the SSA countries under
study have huge savings-investment gap, we hypothesize that countries could maximize this
investment opportunity through two channels – domestic financial sector and remittances
inflow, whose relation to each other could either be complements or substitutes. This is the
major thrust of the current empirical exercise, which is addressed in later sections of this paper.
Insert Table 5 here
3. Literature Review
3.1 Theoretical Review
There are two major views in the theoretical literature on the relationship between remittances
and financial development especially as it relates to their role in promoting economic growth -
substitutability hypothesis and complementary hypothesis. Further, the foremost theory in the
literature linking foreign flows (remittances, in our case) with domestic investment is the two-
gap model of financial aids. We also take note of the baseline accelerator theory of investment.
Accordingly, these four theoretical postulations are reviewed in this study.
3.1.1 Substitutability Hypothesis
The substitutability hypothesis states that remittances serve as an alternative available to
economic agents who are unable to access funds from financial institutions or where the
financial sector is underdeveloped or inefficient. The substitutability hypothesis holds mostly
in countries with weak and underdeveloped financial sector as it occurs when remittances pass
through the informal sector instead of the formal financial institutions. Numerous studies give
support to the substitutability hypothesis (see Hassan and Shakur, 2017; Bandura, Zivanomoyo
and Tsaurai, 2019; Brown, Carmignani and Fayad, 2019; Olayungbo and Quadri, 2019; Tah,
2019; Garba, Adekunle and Adeniyi, 2020 (particularly, where interest rate spread is employed
as the qualitative measure of financial development).
3.1.2 Complementarity Hypothesis
The complementarity hypothesis posits that remittances and financial development are
complements because they promote each other. The proponents of the complementary
hypothesis alluded that a well-developed financial sector afford migrants the opportunity to
easily and conveniently send money to their home country, a situation which makes money
available for the financial institution to make funds available for investment purposes thereby
instigating competitions among financial institutions and improving their performance. A
competitive financial sector could engender a reduction in transfer cost thereby creating more
incentives for migrants to keep sending money to their home country, and as such keep making
more money available for investment, a situation which will simultaneously increase
remittances and make the financial sector more developed and competitive, as well as, increase
the national income of the receiving country. Intuitively, remittances and financial
development can effectively serve as complements only when the financial sector is well-
developed. The complementarity hypothesis has been widely supported in several empirical

7 | P a g e
studies (see Nyamongo, Misati, Kipyegon and Ndirangu, 2012; Abida and Sghaier, 2014;
Karikari, Mensah and Harvey, 2016; El Hamma, 2016; El Hamma, 2018; Qiang, Khurshid,
Calin and Khan, 2019; and Misati, Kamau and Nassir, 2019, Garba, et al., 2020 (particularly,
where liquid liabilities, private sector credit and total bank deposits are employed as the
quantitative measures of financial development).
3.1.3 Two-Gap Model
Identifying the need for foreign capital inflows to fill the savings and foreign exchange gaps,
Chenery and Strout (1966) developed the two-gap model of foreign aids. Whereas, the
difference between domestic investment and domestic savings describes the saving gap, the
foreign exchange gap is the discrepancy between the foreign exchange received and disbursed
through exports and imports respectively. The postulations of the two-gap model were
substantiated by the Harrod-Domar growth model through its advocacy for attracting foreign
capital (such as, remittances, foreign portfolio investment, foreign direct investment and
foreign aids, among others) to bridge the savings-investment gap especially in economies with
low domestic savings in relation to domestic investments (Todaro and Smith, 2012). The theory
posits that foreign capital (including remittances) can be used to equilibrate domestic savings
and investment.
3.1.4 Accelerator Theory of Investment
The acceleration theory posits that an increase in consumption or income will increase
investment by a multiple amount. It suggests a direct relationship between income (total output)
and investment spending. The rationale behind this is that an increase in income will raise
consumption (demand) which will require the production of more commodities thereby
prompting additional investment expenditure especially when the available capital stocks are
fully used. The investment induced by income or consumption dynamics is called induced
investment. A certain level of capital stock is required to produce a given level of output and
this can be written as:
𝐾" = 𝑣𝑌" (1)
Where 𝐾 is capital stock; 𝑌 is output or income; 𝑣 is capital-output ratio (𝐾/𝑌) and 𝑡 is time
period.
Equation or Eq. (1) shows that capital stock (net induced investment) is an increasing function
of aggregate output or income with the assumption that the capital-output ratio (v) is constant.
This assumption indicates that output and capital stock grows at the same rate such that when
income or output is 𝑌", the required capital stock will be 𝐾" = 𝑣𝑌" and when income or output
is 𝑌"(), capital stock becomes:
𝐾"() = 𝑣𝑌"() (2)
Eq. (2) implies that the previous level of capital stock is an increasing function of the previous
level of output or income. Put differently, an increase in output or income in the previous period
will instigate an increase in investment spending in the same period. The increase in capital
stock in the previous and current period can be obtained by deducting Eq. (2) from Eq. (1) to
give:
𝐾" −𝐾"() = 𝑣(𝑌" − 𝑌"()) (3)
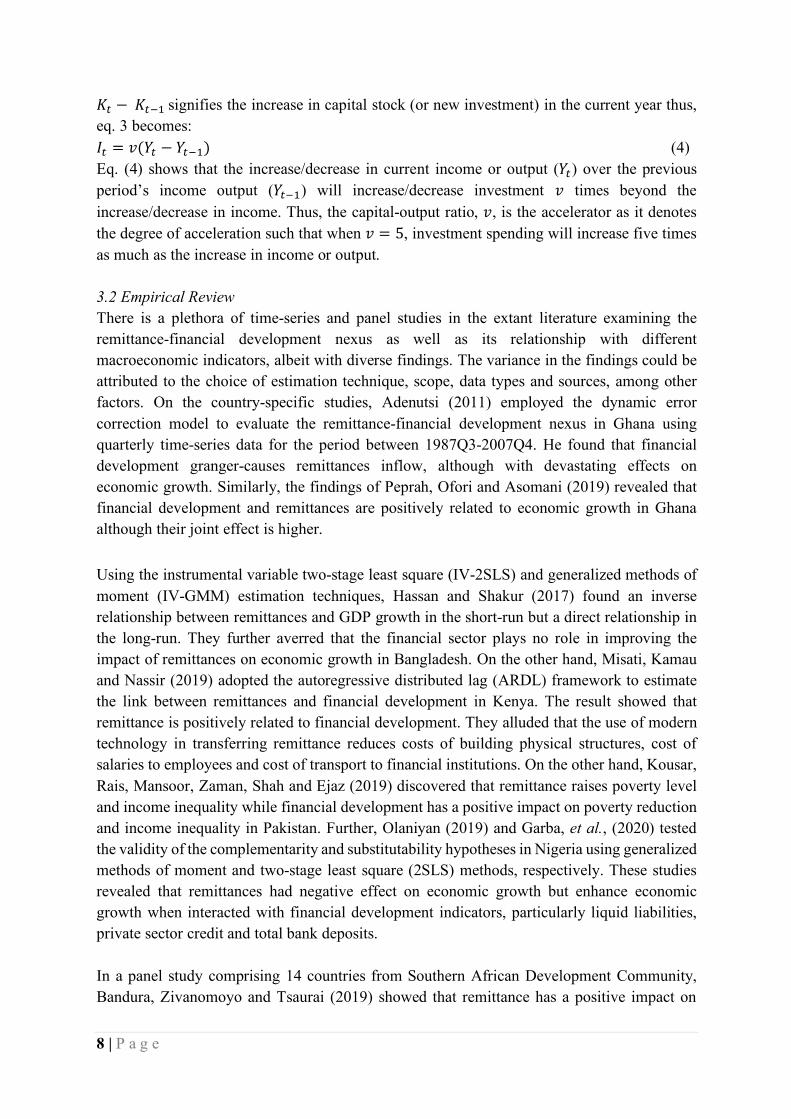
8 | P a g e
𝐾" −𝐾"() signifies the increase in capital stock (or new investment) in the current year thus,
eq. 3 becomes:
𝐼" = 𝑣(𝑌" − 𝑌"()) (4)
Eq. (4) shows that the increase/decrease in current income or output (𝑌") over the previous
period’s income output (𝑌"()) will increase/decrease investment 𝑣 times beyond the
increase/decrease in income. Thus, the capital-output ratio, 𝑣, is the accelerator as it denotes
the degree of acceleration such that when 𝑣 = 5, investment spending will increase five times
as much as the increase in income or output.
3.2 Empirical Review
There is a plethora of time-series and panel studies in the extant literature examining the
remittance-financial development nexus as well as its relationship with different
macroeconomic indicators, albeit with diverse findings. The variance in the findings could be
attributed to the choice of estimation technique, scope, data types and sources, among other
factors. On the country-specific studies, Adenutsi (2011) employed the dynamic error
correction model to evaluate the remittance-financial development nexus in Ghana using
quarterly time-series data for the period between 1987Q3-2007Q4. He found that financial
development granger-causes remittances inflow, although with devastating effects on
economic growth. Similarly, the findings of Peprah, Ofori and Asomani (2019) revealed that
financial development and remittances are positively related to economic growth in Ghana
although their joint effect is higher.
Using the instrumental variable two-stage least square (IV-2SLS) and generalized methods of
moment (IV-GMM) estimation techniques, Hassan and Shakur (2017) found an inverse
relationship between remittances and GDP growth in the short-run but a direct relationship in
the long-run. They further averred that the financial sector plays no role in improving the
impact of remittances on economic growth in Bangladesh. On the other hand, Misati, Kamau
and Nassir (2019) adopted the autoregressive distributed lag (ARDL) framework to estimate
the link between remittances and financial development in Kenya. The result showed that
remittance is positively related to financial development. They alluded that the use of modern
technology in transferring remittance reduces costs of building physical structures, cost of
salaries to employees and cost of transport to financial institutions. On the other hand, Kousar,
Rais, Mansoor, Zaman, Shah and Ejaz (2019) discovered that remittance raises poverty level
and income inequality while financial development has a positive impact on poverty reduction
and income inequality in Pakistan. Further, Olaniyan (2019) and Garba, et al., (2020) tested
the validity of the complementarity and substitutability hypotheses in Nigeria using generalized
methods of moment and two-stage least square (2SLS) methods, respectively. These studies
revealed that remittances had negative effect on economic growth but enhance economic
growth when interacted with financial development indicators, particularly liquid liabilities,
private sector credit and total bank deposits.
In a panel study comprising 14 countries from Southern African Development Community,
Bandura, Zivanomoyo and Tsaurai (2019) showed that remittance has a positive impact on

9 | P a g e
economic growth but a negative impact on financial development. Nyamongo, Misati,
Kipyegon and Ndirangu (2012) argued that remittances have growth effects in 36 African
countries, but its volatility adversely affects growth. They further stated that remittances
complement financial development, though the importance of the financial sector in spurring
growth appears weak. However, the empirical findings of Chowdhury (2016) revealed that
remittances inflow neither complement nor substitute financial development. Nevertheless, El
Hamma (2016), Chitambara (2019) and Adetou and Fiodendji (2019) showed that the growth
effect of remittances is enhanced in the presence of strong institutions and well-developed
financial sector.
In their study on 36 African countries spanning the period between 1980 and 2004, Fayissa and
Nsiah (2010) showed that remittances have positive influence on economic growth as it helps
to circumvent liquidity constraint problems and provides other means of financing investment.
Eggoh, Bangake and Semedo (2019) and Olayungbo and Quadri (2019) corroborated this
finding in their panel study of 49 developing countries over the period of 2001-2013 and 20
Sub-Saharan African countries spanning 2000 to 2015, respectively. Sobiech (2019) argued
that the efficiency, depth and size of the financial sector determine the strength of the
interaction between remittance and financial development. Karikari, Mensah and Harvey
(2016) argued that remittances promote some aspects of financial development and better
financial system foster remittance receipts through formal channels, while Bangake and Eggoh
(2019) identified threshold effect of financial development in the remittances-growth
relationship.
On the link between remittances and investment, Lartey (2013) employed the GMM technique
to estimate panel data of 36 Sub-Saharan African countries from 1990-2008. The findings
indicated that remittances and growth are positively related and the interaction between
remittances and financial depth has positive effect on growth. Further, the author argued that
remittances directly affect growth through the investment channel but indirectly through the
consumption smoothing effect. Similarly, Okodua (2013) collected panel data for 31 Sub-
Saharan African countries from 2000-2011 and used the GMM method to estimate the link
between remittances and private investment. The results showed that remittances are positively
related to private investment and it serves as both capital and financial flows. Conversely, the
finding of Tung (2018) showed that whereas remittances are inversely related to domestic
investment, GDP per capita has a positive impact on domestic investment in 19 Asian-Pacific
countries. Dash (2020) adopted the panel cointegration and causality approach to investigate
the remittances-domestic investment nexus in 6 South Asian Countries from 1991-2017. The
result showed that remittances increase domestic investment in the short-run and long run
implying that it serves both consumption and investment purposes. Further result revealed that
unidirectional causality runs from remittances to domestic investment. Moreover, Bjuggren,
Dzansi and Shukur (2010), in their panel study of 79 developing countries, found that
remittances, well-developed credit market and high quality institutional framework stimulate
investment. However, the marginal significance of remittances, as a financier of investment,
diminishes with a more developed financial market and improved institutional framework.
10 | P a g e
To this end, we contribute to the literature in the following distinct ways. Firstly, we examine
the role of remittances-financial development nexus in bridging the savings-investment in Sub-
Saharan African countries both in the short-run and long-run, a study which to the best of our
knowledge is particularly rare for Sub-Saharan African countries. Secondly, our paper employs
the Panel Autoregressive Distributed Lag (ARDL) framework which is superior to other panel
estimation methods in the following ways: it accommodates variables with mixed order of
integration, that is, variables that are integrated of order zero and order one; it has the ability to
estimate short-run and long-run models simultaneously; it is capable of estimating models with
varying degree of lags of both the dependent and independent variables, and it complies with
both small and large sample sizes, most especially if the time dimension is relatively long,
thereby requiring that the issue of non-stationarity is addressed.
Lastly, unlike previous studies, we evaluate the forecast accuracy of our baseline model
(premised on the Accelerator Theory of Investment) and alternative specifications in order to
determine whether augmenting the baseline model with individual and interactive effects of
remittances and financial development matters in modelling savings-investment gap in Sub-
Saharan Africa. We complement our findings by undertaking a sensitivity analysis to
investigate same (forecast evaluation of the baseline model and alternative specifications) for
sub-regional groupings in SSA including Economic Community of Central African States
(ECCAS), Southern African Development Community (SADC) and Economic Community of
West African States (ECOWAS). In order to allow for out-of-sample forecast evaluation using
the Root Mean Square Error (RMSE) and the test statistic of Campbell and Thompson (2008),
we utilized 75% of the sample size, while considering two forecast horizons of 2 and 4 years4.
4. Methodology and Data
4.1 Pre-estimation Tests
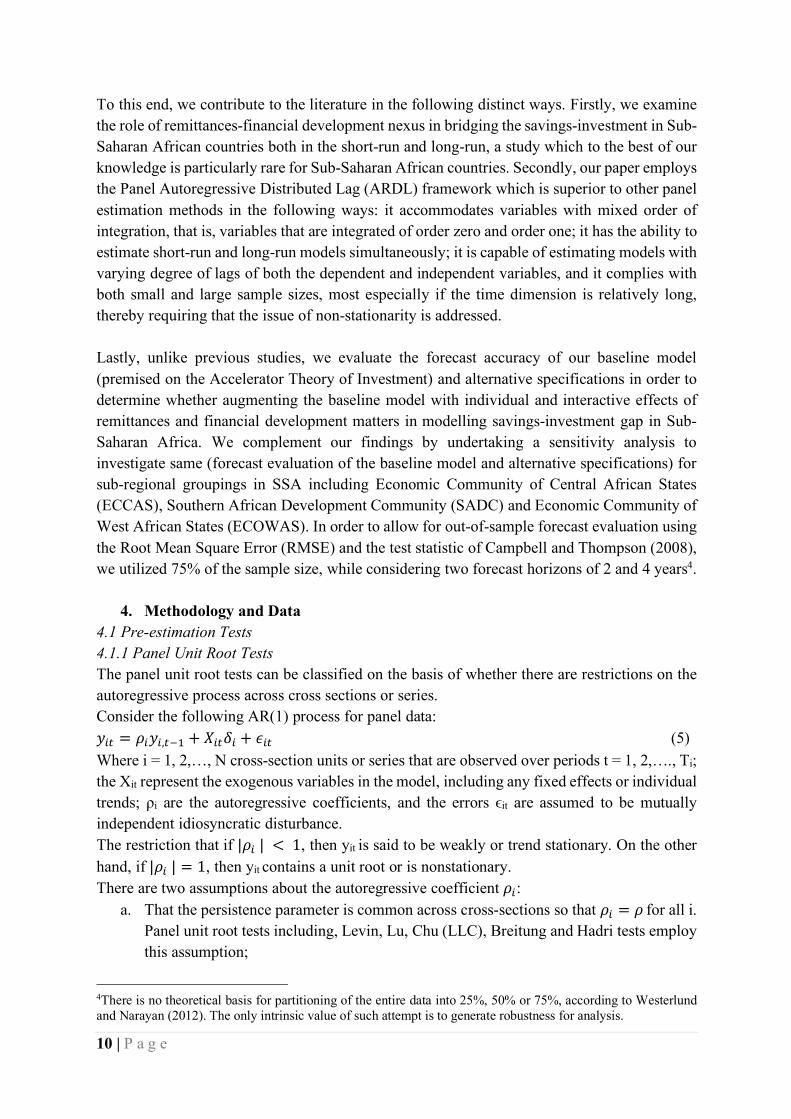
4.1.1 Panel Unit Root Tests
The panel unit root tests can be classified on the basis of whether there are restrictions on the
autoregressive process across cross sections or series.
Consider the following AR(1) process for panel data:
𝑦1" = 𝜌1𝑦1,"() + 𝑋1"𝛿1 + 𝜖1" (5)
Where i = 1, 2,…, N cross-section units or series that are observed over periods t = 1, 2,…., Ti;
the Xit represent the exogenous variables in the model, including any fixed effects or individual
trends; ρi are the autoregressive coefficients, and the errors ϵit are assumed to be mutually
independent idiosyncratic disturbance.
The restriction that if |𝜌1 | < 1, then yit is said to be weakly or trend stationary. On the other
hand, if |𝜌1 | = 1, then yit contains a unit root or is nonstationary.
There are two assumptions about the autoregressive coefficient 𝜌1: a. That the persistence parameter is common across cross-sections so that 𝜌1 = 𝜌 for all i.
Panel unit root tests including, Levin, Lu, Chu (LLC), Breitung and Hadri tests employ
this assumption;
4There is no theoretical basis for partitioning of the entire data into 25%, 50% or 75%, according to Westerlund and Narayan (2012). The only intrinsic value of such attempt is to generate robustness for analysis.
11 | P a g e
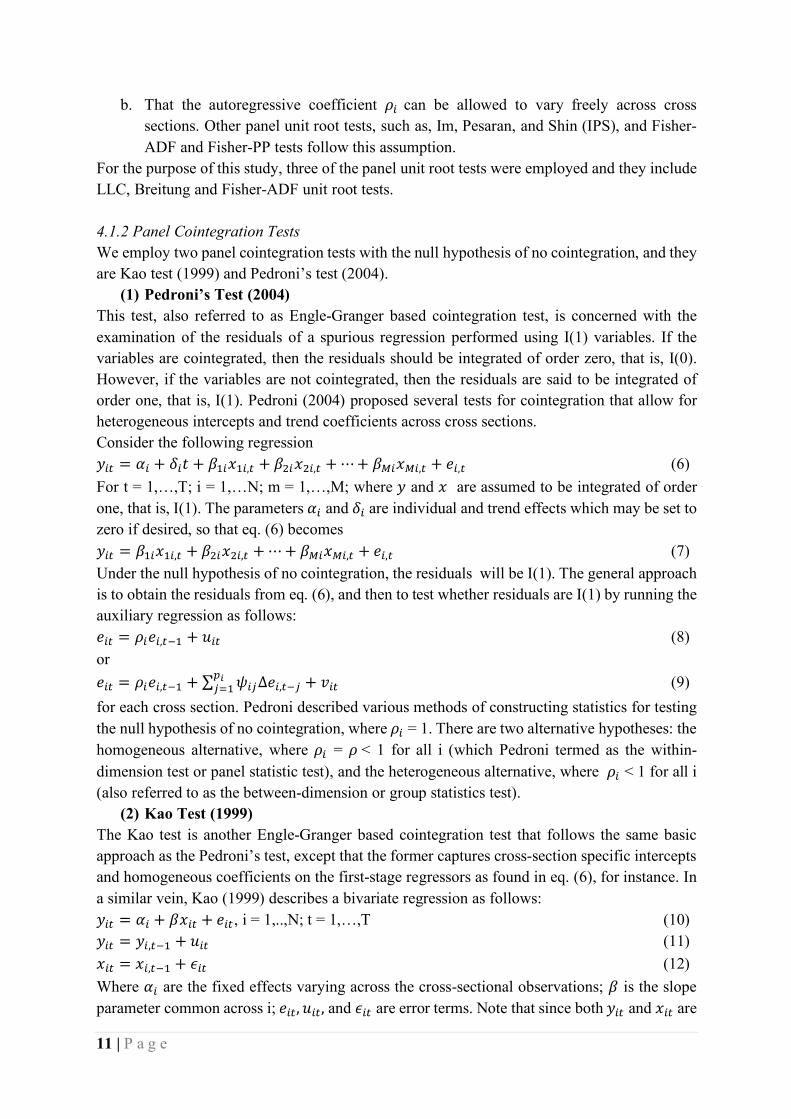
b. That the autoregressive coefficient 𝜌1 can be allowed to vary freely across cross
sections. Other panel unit root tests, such as, Im, Pesaran, and Shin (IPS), and Fisher-
ADF and Fisher-PP tests follow this assumption.
For the purpose of this study, three of the panel unit root tests were employed and they include
LLC, Breitung and Fisher-ADF unit root tests.
4.1.2 Panel Cointegration Tests
We employ two panel cointegration tests with the null hypothesis of no cointegration, and they
are Kao test (1999) and Pedroni’s test (2004).
(1) Pedroni’s Test (2004)
This test, also referred to as Engle-Granger based cointegration test, is concerned with the
examination of the residuals of a spurious regression performed using I(1) variables. If the
variables are cointegrated, then the residuals should be integrated of order zero, that is, I(0).
However, if the variables are not cointegrated, then the residuals are said to be integrated of
order one, that is, I(1). Pedroni (2004) proposed several tests for cointegration that allow for
heterogeneous intercepts and trend coefficients across cross sections.
Consider the following regression
𝑦1" = 𝛼1 + 𝛿1𝑡 + 𝛽)1𝑥)1," + 𝛽>1𝑥>1," +⋯+ 𝛽@1𝑥@1," + 𝑒1," (6)
For t = 1,…,T; i = 1,…N; m = 1,…,M; where 𝑦 and 𝑥 are assumed to be integrated of order
one, that is, I(1). The parameters 𝛼1 and𝛿1 are individual and trend effects which may be set to
zero if desired, so that eq. (6) becomes
𝑦1" = 𝛽)1𝑥)1," + 𝛽>1𝑥>1," +⋯+ 𝛽@1𝑥@1," + 𝑒1," (7)
Under the null hypothesis of no cointegration, the residuals will be I(1). The general approach
is to obtain the residuals from eq. (6), and then to test whether residuals are I(1) by running the
auxiliary regression as follows:
𝑒1" = 𝜌1𝑒1,"() + 𝑢1" (8)
or
𝑒1" = 𝜌1𝑒1,"() + ∑ 𝜓1E∆𝑒1,"(EGHEI) + 𝑣1" (9)
for each cross section. Pedroni described various methods of constructing statistics for testing
the null hypothesis of no cointegration, where 𝜌1 = 1. There are two alternative hypotheses: the
homogeneous alternative, where 𝜌1 = 𝜌< 1 for all i (which Pedroni termed as the within-
dimension test or panel statistic test), and the heterogeneous alternative, where 𝜌1 < 1 for all i
(also referred to as the between-dimension or group statistics test).
(2) Kao Test (1999)
The Kao test is another Engle-Granger based cointegration test that follows the same basic
approach as the Pedroni’s test, except that the former captures cross-section specific intercepts
and homogeneous coefficients on the first-stage regressors as found in eq. (6), for instance. In
a similar vein, Kao (1999) describes a bivariate regression as follows:
𝑦1" = 𝛼1 + 𝛽𝑥1" + 𝑒1", i = 1,..,N; t = 1,…,T (10)
𝑦1" = 𝑦1,"() + 𝑢1" (11)
𝑥1" = 𝑥1,"() + 𝜖1" (12)
Where 𝛼1 are the fixed effects varying across the cross-sectional observations; 𝛽 is the slope
parameter common across i; 𝑒1", 𝑢1",and 𝜖1" are error terms. Note that since both 𝑦1" and 𝑥1" are

12 | P a g e
random walks or follow a first-order autoregressive process, under the null hypothesis of no
cointegration, the residual series 𝑒1" should be nonstationary.
Kao (1999) then runs either the pooled auxiliary regression,
𝑒1" = 𝜌𝑒1,"() + 𝑣1" (13)
Or the augmented version of the pooled specification, that is, eq. (13)
𝑒1" = 𝜌𝑒1,"() +∑ 𝜓E∆𝑒1,"(EGEI) + 𝑣1" (14)
Where the lagged difference terms are captured in eq. (14) to resolve the issue of
autocorrelation, and the number of lags, 𝑝, is chosen such that the residuals 𝑣1" are serially
uncorrelated with past errors. The null and alternative hypotheses are as follows:
H0: 𝜌 = 1 (There is no cointegration)
H1: 𝜌 < 1 (There is cointegration)
4.2 Estimation Technique & Forecast Evaluation
4.2.1 Pooled Mean Group Estimator (PMG)
Pesaran and Smith (1995) showed that, unlike in static models, pooled dynamic heterogeneous
models generate estimates that are inconsistent even in large samples (the problem cannot be
solved by extending the sample through increasing the number of cross sections, N). The
authors observed that while it is implausible that the dynamic specification is common to all
countries, it is at least conceivable that the long-run parameters of the model may be common.
Pesaran and Smith (1995), therefore, proposed estimation by either averaging the individual
country estimates, or, by pooling the long-run parameters, if the data allow, and estimating the
model as a system. In a later work, Pesaran, Shin and Smith (1999) termed the second approach
the pooled mean group (PMG) estimator, which combines the efficiency of pooled estimation
while avoiding the inconsistency problem flowing from pooling heterogeneous dynamic
relationships (Asteriou and Hall, 2007). In panel settings with individual effects, standard
regression estimation of autoregressive distributed lag (ARDL) models is problematic due to
bias caused by correlation between the mean-differenced regressors and the error term. This
bias only vanishes for large number of observations T, and cannot be corrected by increasing
the number of cross sections N. To address this problem, a number of small T-large N, dynamic
panel GMM estimators have been developed (for instance, Arellano and Bond’s Difference
GMM). However, in large T data sets, this assumption underlying dynamic GMM (which is N
> T) is often inappropriate and the estimator breaks down. In such cases, a popular alternative
is the pooled mean group (PMG) estimator developed by Pesaran, et al. (1999). These authors
also refer to PMG as the maximum likelihood (ML) estimators since the long-run parameters
are nonlinear functions of the short-run parameters in the panel ARDL model.
The PMG is an intermediate estimator which allows intercepts, short-run coefficients and error
variances to differ freely across groups, but constrains the long-run coefficients to be the same.
This is unlike the two extreme estimators, mean group (MG) and dynamic fixed-effects (DFE)
estimators, where the former assumes heterogeneity in all coefficients (intercept, short-run and
long-run coefficients) and error variances across the cross sections, while the latter assumes
that only the intercept coefficient differs across cross sections, but other coefficients (short run
and long-run) and error variance are homogeneous across groups/cross sections. The selection

13 | P a g e
of the appropriate estimator, particularly between MG and PMG estimators, is based on Hansen
test for estimator selection. Under the null hypothesis, PMG is the efficient estimator, whereas
MG is the efficient estimator under the alternative hypothesis. In addition, the advantage of
adopting the pooled mean group (PMG) estimator in the present study is that it allows for the
level of financial development and remittances to have similar effects across countries in the
long run, while permitting heterogeneous short-run adjustments across groups to changes in
the levels of financial development and remittances. This, in fact, follows a conventional
wisdom that countries with similar socio-economic characteristics or economic conditions - as
is the case with many commodity-dependent SSA countries5 - are expected to converge to a
common steady state level (that is, absolute convergence), that is characterized by a uniform
growth rate across macroeconomic indicators, such as, output, investment, remittances and
financial development.
4.2.2 Model Specification
In this study, we adopt the accelerator model of investment (that is, eq. 4) as our baseline
specification. We then augment the baseline model with both the individual and interactive
effects of remittances and financial development on savings-investment gap, which in turn
constitutes the overparameterized or general specification such that restricting the partial slope
coefficients on the explanatory variables (remittances and financial development) to zero
ultimately yields a reduced-form model, also known as, the accelerator model of investment.
Following Pesaran and Smith (1995), eq. (4) is augmented with the individual and interactive
effects of remittances and financial development on savings-investment gap and is expressed
in terms of a panel autoregressive distributed lag model of order (p, q1,…,q4) as follows:
∆𝑖𝑠_𝑔𝑎𝑝1" = ∅)𝑖𝑠_𝑔𝑎𝑝1,"() + ∅>𝑔𝑟𝑜𝑤𝑡ℎ1,"() + ∅U𝑟𝑒𝑚𝑖𝑡1,"() + ∅W𝑓𝑑1,"() + ∅Z𝑟𝑒𝑚_𝑓𝑑1,"() +∑ 𝛼E∆𝑖𝑠_𝑔𝑎𝑝1,"(EG()EI) +∑ 𝜆E∆𝑔𝑟𝑜𝑤𝑡ℎ1,"(E\]()
EI^ + ∑ 𝛿E∆𝑟𝑒𝑚𝑖𝑡1,"(E\_()EI^ +∑ 𝛾E∆𝑓𝑑1,"(E\a()
EI^ +∑ 𝜃E∆𝑟𝑒𝑚_𝑓𝑑1,"(E\c()EI^ +𝜖1" (15)
Where p is the lag length associated with the dependent variable for i = 1,…N and j = 1,…p;
qk is the lag length associated with the k-regressors (X’s) for i = 1,…N; j = 1,…qk, where k =
1,…,4.
The error correction version of eq. (15) is derived as follows:
∆𝑖𝑠_𝑔𝑎𝑝1" = ∅)[𝑖𝑠_𝑔𝑎𝑝1,"() − e− ∅_∅]𝑔𝑟𝑜𝑤𝑡ℎ1,"() − ∅a
∅]𝑟𝑒𝑚𝑖𝑡1,"() − ∅c
∅]𝑓𝑑1,"() − ∅f
∅]𝑟𝑒𝑚_𝑓𝑑1,"()g] +
∑ 𝛼E∆𝑖𝑠_𝑔𝑎𝑝1,"(EG()EI) +∑ 𝜆E∆𝑔𝑟𝑜𝑤𝑡ℎ1,"(E\]()
EI^ + ∑ 𝛿E∆𝑟𝑒𝑚𝑖𝑡1,"(E\_()EI^ +∑ 𝛾E∆𝑓𝑑1,"(E\a()
EI^ +∑ 𝜃E∆𝑟𝑒𝑚_𝑓𝑑1,"(E\c()EI^ +𝜖1" (16)
By letting,
𝐸𝐶𝑇1" = 𝑖𝑠_𝑔𝑎𝑝1,"() − 𝛽)𝑔𝑟𝑜𝑤𝑡ℎ1,"() − 𝛽>𝑟𝑒𝑚𝑖𝑡1,"() − 𝛽U𝑓𝑑1,"() − 𝛽W𝑟𝑒𝑚_𝑓𝑑1,"() (17)
Where 𝛽) = − ∅_∅] , 𝛽> = − ∅a
∅] , 𝛽U = − ∅c
∅] , 𝛽W = − ∅f
∅]
Eq. (16) becomes:
5About 51% of SSA countries are by nature oil producers and resource-intensive countries (see, IMF, 2020: pp. 16). Also refer to Appendix A for the classification of the 18 SSA countries, by sub-region and economic structure, under study.
14 | P a g e
∆𝑖𝑠_𝑔𝑎𝑝1" = ∅)𝐸𝐶𝑇1" +∑ 𝛼E∆𝑖𝑠_𝑔𝑎𝑝1,"(EG()EI) +∑ 𝜆E∆𝑔𝑟𝑜𝑤𝑡ℎ1,"(E\]()
EI^ +∑ 𝛿E∆𝑟𝑒𝑚𝑖𝑡1,"(E\_()EI^ +
∑ 𝛾E∆𝑓𝑑1,"(E\a()EI^ + ∑ 𝜃E∆𝑟𝑒𝑚_𝑓𝑑1,"(E\c()
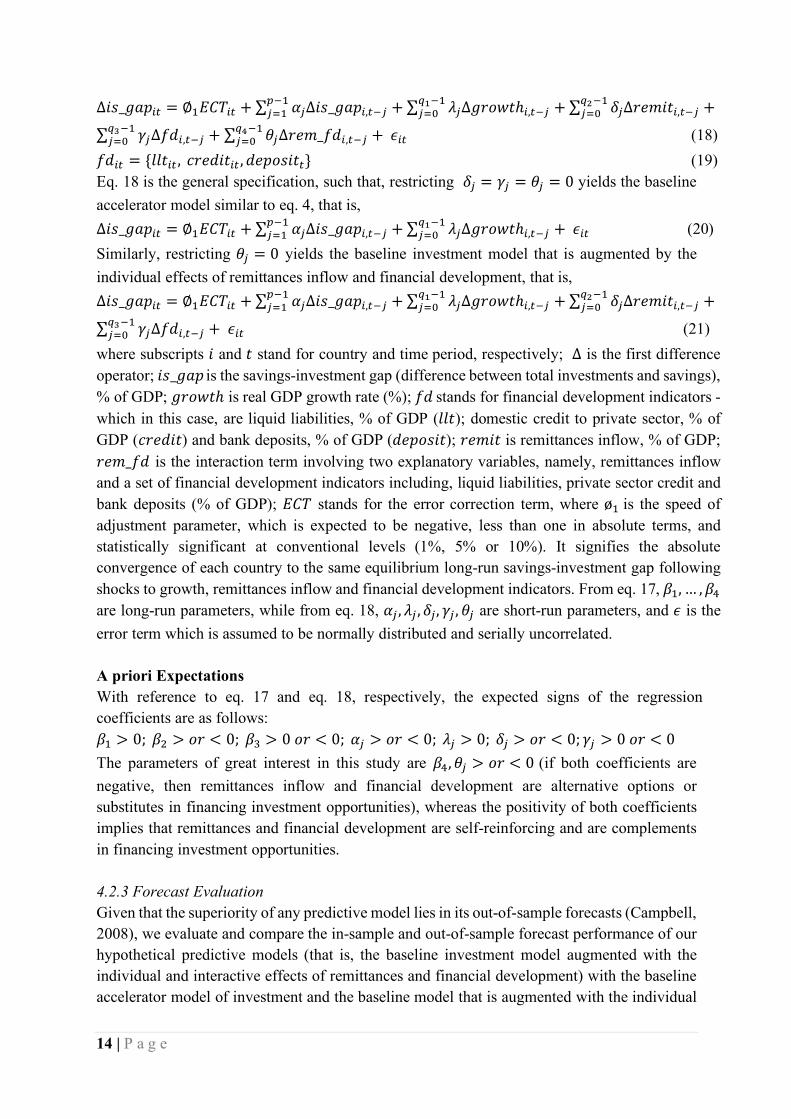
EI^ +𝜖1" (18)
𝑓𝑑1" = {𝑙𝑙𝑡1" , 𝑐𝑟𝑒𝑑𝑖𝑡1" , 𝑑𝑒𝑝𝑜𝑠𝑖𝑡"} (19)
Eq. 18 is the general specification, such that, restricting 𝛿E = 𝛾E = 𝜃E = 0 yields the baseline
accelerator model similar to eq. 4, that is,
∆𝑖𝑠_𝑔𝑎𝑝1" = ∅)𝐸𝐶𝑇1" +∑ 𝛼E∆𝑖𝑠_𝑔𝑎𝑝1,"(EG()EI) +∑ 𝜆E∆𝑔𝑟𝑜𝑤𝑡ℎ1,"(E\]()
EI^ +𝜖1" (20)
Similarly, restricting 𝜃E = 0 yields the baseline investment model that is augmented by the
individual effects of remittances inflow and financial development, that is,
∆𝑖𝑠_𝑔𝑎𝑝1" = ∅)𝐸𝐶𝑇1" +∑ 𝛼E∆𝑖𝑠_𝑔𝑎𝑝1,"(EG()EI) +∑ 𝜆E∆𝑔𝑟𝑜𝑤𝑡ℎ1,"(E\]()
EI^ +∑ 𝛿E∆𝑟𝑒𝑚𝑖𝑡1,"(E\_()EI^ +
∑ 𝛾E∆𝑓𝑑1,"(E\a()EI^ +𝜖1" (21)
where subscripts 𝑖 and 𝑡 stand for country and time period, respectively; ∆ is the first difference
operator; 𝑖𝑠_𝑔𝑎𝑝 is the savings-investment gap (difference between total investments and savings),
% of GDP; 𝑔𝑟𝑜𝑤𝑡ℎ is real GDP growth rate (%); 𝑓𝑑 stands for financial development indicators -
which in this case, are liquid liabilities, % of GDP (𝑙𝑙𝑡); domestic credit to private sector, % of
GDP (𝑐𝑟𝑒𝑑𝑖𝑡) and bank deposits, % of GDP (𝑑𝑒𝑝𝑜𝑠𝑖𝑡); 𝑟𝑒𝑚𝑖𝑡 is remittances inflow, % of GDP;
𝑟𝑒𝑚_𝑓𝑑 is the interaction term involving two explanatory variables, namely, remittances inflow
and a set of financial development indicators including, liquid liabilities, private sector credit and
bank deposits (% of GDP); 𝐸𝐶𝑇 stands for the error correction term, where ø) is the speed of
adjustment parameter, which is expected to be negative, less than one in absolute terms, and
statistically significant at conventional levels (1%, 5% or 10%). It signifies the absolute
convergence of each country to the same equilibrium long-run savings-investment gap following
shocks to growth, remittances inflow and financial development indicators. From eq. 17, 𝛽), … , 𝛽W
are long-run parameters, while from eq. 18, 𝛼E , 𝜆E , 𝛿E, 𝛾E , 𝜃E are short-run parameters, and 𝜖 is the
error term which is assumed to be normally distributed and serially uncorrelated.
A priori Expectations
With reference to eq. 17 and eq. 18, respectively, the expected signs of the regression
coefficients are as follows:
𝛽) > 0;𝛽> > 𝑜𝑟 < 0;𝛽U > 0𝑜𝑟 < 0;𝛼E > 𝑜𝑟 < 0;𝜆E > 0;𝛿E > 𝑜𝑟 < 0; 𝛾E > 0𝑜𝑟 < 0
The parameters of great interest in this study are 𝛽W, 𝜃E > 𝑜𝑟 < 0 (if both coefficients are
negative, then remittances inflow and financial development are alternative options or
substitutes in financing investment opportunities), whereas the positivity of both coefficients
implies that remittances and financial development are self-reinforcing and are complements
in financing investment opportunities.
4.2.3 Forecast Evaluation
Given that the superiority of any predictive model lies in its out-of-sample forecasts (Campbell,
2008), we evaluate and compare the in-sample and out-of-sample forecast performance of our
hypothetical predictive models (that is, the baseline investment model augmented with the
individual and interactive effects of remittances and financial development) with the baseline
accelerator model of investment and the baseline model that is augmented with the individual

15 | P a g e
effects of remittances and financial development only, which are more restrictive6. We achieve
this using forecast evaluation tools including the root mean square error (RMSE) and the
Campbell and Thompson test statistic (C-T test, subsequently). The in-sample forecast is
conducted using 75% of the full sample data. The out-of-sample forecast, on the other hand, is
based on two forecast horizons, namely, 2 and 4 years. We also support our arguments with
predictability graphs for only the unrestricted predictive model in order to compare the fitted
values of savings-investment gap with its actual value. The Campbell and Thompson test
statistic is computed as: 1 − (𝑅𝑀𝑆𝐸x ) 𝑅𝑀𝑆𝐸x ^⁄ ), where 𝑅𝑀𝑆𝐸x ) and 𝑅𝑀𝑆𝐸x ^are, respectively,
the root mean square errors obtained from the unrestricted model and the restricted models,
respectively. A positive value of the statistic implies that the unrestricted model outperforms
the restricted model; otherwise, it does not.
4.3 Data Description and Sources
The scope of this study is limited to 18 Sub-Saharan African countries for the period between
1990 and 2017. The sampled countries include: Benin, Botswana, Burkina Faso, Cameroon,
Côte d'Ivoire, Ghana, Guinea, Guinea-Bissau, Kenya, Madagascar, Mali, Namibia, Niger,
Nigeria, Rwanda, Senegal, South Africa and Togo. The choice of these countries is predicated
on the evidence of their massive influx of remittances during the period under review, their
proven savings-investment gap, as well as, data availability on the variables of interest
(remittances, financial development indicators [ratio of liquid liabilities to GDP, ratio of credit
to private sector to GDP and ratio of bank deposits to GDP], the ratios of domestic investment
and savings to GDP and real GDP growth). While we obtained the data on the financial
development indicators from Beck, et al., (2019), other variables have their data sourced from
the World Bank’s World Development Indicator (2019). Aside from data paucity, the sample
period, 1990-2017, was selected because of the exceptional surge in emigration together with
massive remittance inflows into most Sub-Saharan African countries during this period.
5. Empirical Analysis and Discussion of Results
5.1 Preliminary Analysis
5.1.1 Descriptive Statistics & Correlation
The statistical features for all variables employed in this study are summarized in Table 6.
Considering the fact that the sampled countries have a mix of positive and negative savings-
investment gap, the average savings-investment gap for the SSA region is positive at 7.6% of
GDP. This is an affirmation of the existence of huge investment opportunities in Sub-Saharan
Africa. Remittances inflow averaged 2.3% of GDP for the region over a period of 1990 to 2017.
Comparatively, we can infer, on the average, that remittances fall short of the amount that is
required to bridge the savings-investment gap in SSA; hence the need to deepen the domestic
financial sector and/or to attract the inflow of remittances through the formal channels, mainly
banks. For the indicators of financial development, the average value of liquid liabilities is
6We can otherwise state that the baseline accelerator model of investment and the baseline model augmented with individual effects only are both nested in the general model of investment (which captures both the individual and interactive effects. While the first two specifications constitute the restricted models, the general specification is otherwise called the unrestricted model.
16 | P a g e
higher at 24.8% of GDP, compared to the mean values of other indicators: credit to private
sector (20.9% of GDP) and bank deposits (19.6% of GDP).
By implication, we can sufficiently state that Africa’s financial sector is highly liquid, but this
has not adequately translated into higher volume of domestic credit to the private sector. This
is reflected by the fact that credit to private sector does not match the deposits at banks in the
majority of SSA countries, indicating a ratio of less than 100%7. Real GDP growth rate in SSA
averaged 3.9%8 over the period of 1990 to 2017. In terms of standard deviation, we observed
that the three indicators of financial development are highly volatile, while the least volatile
series is remittances inflow (% of GDP) followed by real GDP growth. This clearly
demonstrates the relative stability of remittances inflow (% of GDP) over the sample period.
Meanwhile, the increasing volatility in the SSA’s financial sector development puts the region
at high risk of the contagious effects of global crises, such as, the 2008-09 global financial
crisis which caused instability in the banking segment of the financial sector of African
countries with high presence of foreign banks9.
Insert Table 6 here
On the other hand, pairwise correlation coefficients were computed between variables
employed in this study (see Table 7). All variables except remittances have negative
correlation with savings-investment gap. This suggests that the region’s financial sector has a
key role to play in narrowing the savings-investment gap. A possible explanation for the
positive correlation between savings-investment gap and remittances is in two-folds: (1) that
remittances are not channeled through banks due to the high transaction cost10; an event that
has prompted huge remittance flows via unofficial/informal channels11; (2) that the
7The countries in this category include: Ghana, Guinea, Botswana, Guinea Bissau, Benin, Madagascar, Kenya, Cameroon, Rwanda, Nigeria, Togo, Niger, Burkina Faso and Mali. All other countries have higher ratios (Senegal – 103.5%, Cote d’Ivoire – 105.3%, Namibia – 109.6%, and South Africa – 231.6%). 8The sampled SSA countries are a combination of fast-growing economies (such as, Benin, Burkina Faso, Cote d’Ivoire, Ghana, Guinea, Kenya, Mali, Niger, Rwanda, Senegal and Togo), whose real growth rates are at least 5% per annum from 2017 to 2019 and low/weak growth countries (including Botswana, Cameroon, Guinea Bissau, Madagascar, Namibia, Nigeria and South Africa), whose real GDP growth rates are strictly below 5% per annum over a similar period. Ironically, the middle income countries (Botswana, Cameroon, Namibia, Nigeria and South Africa) generally dragged the overall growth in the SSA region overtime, whereas the majority of fast-growing economies in the region belong to the low income group (see, IMF, 2020). 9A bank is said to be foreign-owned if at least 50% of its shares are held directly by foreign citizens. While countries including Botswana, Burkina Faso, Cameroon, Cote d’Ivoire, Ghana, Madagascar, Mali and Rwanda have high shares of foreign-owned banks (above 50%), countries like Kenya, Namibia, Nigeria, Senegal, South Africa and Togo have limited shares of banking assets held by foreigners (see, Massa and Willem te Velde, 2008). 10The cost of transferring remittances (US$200) is highest in SSA at 9%, relative to other low and developing regions (KNOMAD, 2020). 11Unofficial channels involve sending remittances through carriers, such as, family members, friends or through unlicensed money transfer operators using traditional networks, such as, “hawala”. This is a traditional system of transferring money used in Arab countries and South Asia, whereby the money is paid to an agent who then instructs an associate in the relevant country or area to pay the final recipient.

17 | P a g e
beneficiaries are not incentivized to save some part of remittances received, implying that
remittances are spent mainly on consumption at the expense of funding investments12. These
reasons partly explain the weak positive correlation between remittances and economic growth
in the SSA region. All financial sector indicators employed in this study (liquid liabilities,
private sector credit and bank deposits) have negative correlation with growth. This is expected
as the financial sector in the region is not sufficiently developed so as to translate savings into
profitable investments that would have a high multiplier effect on economic growth. As
expected, there is a positive and strong correlation among the financial development indicators,
particularly: between liquid liabilities and bank deposits, on the one hand, and between bank
deposits and private sector credit on the other hand.
Insert Table 7 here
5.1.2 Panel Unit Root Test Results
Considering the fact that we are dealing with long panels which suggest the need to address
issues around non-stationarity, we present the results of panel unit root test using three
approaches in Table 8. We observe that irrespective of approaches, three variables including
savings-investment gap, remittances inflow and real GDP growth are stationary at levels,
implying that these variables are integrated of order zero, that is, I(0). However, there is some
disparity in the results of the unit root test approaches for the remaining variables which are
the three indicators of financial development (liquid liabilities, private sector credit and bank
deposits); hence they are largely non-stationary, but become stationary at first difference. This
implies that they are integrated of order one, that is, I(1).
Insert Table 8 here
5.1.3 Panel Cointegration Test Results
For the sake of robustness, we equally employed two cointegration test approaches (see Table
9). We observe that all specifications, except Model VI, showed that irrespective of test
approaches, we can sufficiently conclude the existence of a long-run relationship between
savings-investment gap and its proposed determinants including real GDP growth and the three
measures of financial development (liquid liabilities, private sector credit and bank deposits).
In order to address the issue of spurious correlation among the financial development indicators
(as shown in Table 7), we captured the indicators in separate savings-investment gap models.
Insert Table 9 here
5.2 Regression Results and Discussion
With the existence of a long-run relationship between savings-investment gap and its supposed
determinants, we estimate two variants of the savings-investment gap model: the first looks at
the individual effects of remittances and financial development (see Table 10), while the
12Garba, et al. (2020) suggest the need to encourage migrant workers and their beneficiaries to make use of banks so that remittances could be made available to finance genuine investment projects.
18 | P a g e
second combines the individual and interactive effects of both variables on savings-investment
gap in Sub-Saharan Africa (see Table 11).
Our results showed that irrespective of the proxy variable for financial development
(particularly private sector credit and bank deposits), remittances inflow has negative impact
on savings-investment gap both in the short-run and long-run. The impact becomes effective
only over the long-term horizon considering the statistical insignificance of the short-run
impact coefficients at the 10% level across specifications. Controlling for private sector credit
and bank deposits, 1 percentage point increase in each of these indicators reduces the savings-
investment gap by 0.8 and 0.6 percentage points, respectively, in Models II and III (see Table
11). This result affirms the possible role of remittances as an alternative option to augment
limited domestic savings in financing a given level of investment in the SSA region13.
Accounting for the individual and interactive effects of remittances and the financial sector
magnifies the impact of remittances in narrowing the savings-investment gap in the region; as
every 1 percentage point increase in remittances translates to a range of 0.9 and 1.5 percentage
points decline in savings-investment gap on the average keeping other variables constant (see
Table 11). Generally, irrespective of specifications, high rates of economic growth have a
knock-on effect in stimulating additional investments over a long-term horizon (see Tables 10
and 11), thereby building up the savings-investment gap14. This finding clearly validates the
postulation of the accelerator theory which states that a positive relationship exists between
domestic investment and output/income growth.
Our result is mixed regarding the impact of financial development on savings-investment gap.
Irrespective of specifications (Models II and V), private sector credit exerts positive short-term
influence on widening the savings-investment gap as banks increasingly channel a large portion
of their deposit liabilities to fund profitable investment opportunities; hence, for every 1
percentage point increase in private sector credit, the saving-investment gap widens by an
average of 0.9 percentage point (see Table 10) and by 1.5 percentage points (see Table 11),
keeping other variables unchanged. Irrespective of specifications (Models I and IV), liquid
liabilities have no significant impact on savings-investment gap both in the short-run and long-
run, whereas, bank deposits significantly widen savings-investment gap only in the long run
(see Models III and VI). This result could be linked to the money creation effect of the initial
deposit liabilities when banks operate a fractional reserve banking system, which stipulates that
banks keep an excess reserve to meet demand deposits and to fund investment opportunities
by extending loans to prospective investors. These loans, if kept in the bank, constitute a new
deposit that is further partitioned into demand deposits and loanable funds after taking care of
legal reserve requirement and this process continues over and over again. In essence, for every
1 percentage point increase in bank deposits, savings-investment gap widens by an average of
0.2 percentage point (see Table 10) and 0.4 percentage point (see Table 11), keeping other
variables constant.
13Our results reflected the findings of Bjuggren, et al. (2010); Okodua (2013), and Dash (2020). 14This parallels the findings of Tung (2018) that a positive relationship exists between per capita income and investment.

19 | P a g e
With respect to the explanatory variable of interest which is the interaction between remittances
and financial development (see Table 11), we observed mixed results across the three
indicators of financial development. Our result showed that the interactive effect of remittances
and bank deposits is significant only in the short run (see Model VI in Table 11). By
implication, a combination of improved financial development in terms of higher bank deposits
and huge inflow of remittances reinforce each other in narrowing the savings-investment gap.
This would be the case if the migrant workers make remittances transfer through the banking
channel, also would the beneficiaries save some part of the remittances received in the bank.
However, our results revealed that the interactive effects of remittances and other financial
development indicators (liquid liabilities and private sector credit) are significant over a long-
term horizon only (see Models IV and V in Table 11). By implication, higher remittances
inflow coupled with improved financial sector development in terms of higher liquid liabilities
and private sector credit represent independent and alternative ways of bridging the savings-
investment gap. This would play out if beneficiary households, already faced with high cost of
borrowing from banks, depend hugely on remittances inflow to finance investment
opportunities, thereby bypassing the huge debt servicing burden, were they to successfully
secure a bank loan. In this way, the beneficiary household considers the domestic financial
sector and remittances inflow as substitutes. Meanwhile, the fact that most beneficiary
households spend a large chunk of the remittances received on consumption rather than on
investment, the savings-investment gap becomes widened15. This further support our earlier
finding that on the average, remittances inflow falls short of the amount that is required to
narrow the gap between domestic investment and savings (see Table 6).
In terms of the choice of estimator between PMG and MG, the result of Hansen’s test showed
that we cannot reject the null hypothesis that PMG is the efficient and most suitable estimator
since the probability value associated with the Chi-square test statistic is greater than 10% level
of significance or 0.1 (see Tables 10 and 11). We validate this outcome in favour of all three
indicators of financial development (liquid liabilities, private sector credit and bank deposits).
Moreover, the result of the redundancy test performed on the interactive terms in Models IV to
VI revealed that the panel ARDL that captures the individual and interactive effects between
remittances and financial development indicators, particularly liquid liabilities and private
sector credit are preferred to equivalent models that incorporate the individual effects only.
This is premised on the fact that we cannot accept the null hypothesis that the interactive terms
are redundant given that the probability value associated with the Wald test statistic is in excess
of 10% level of significance or 0.1 (see Table 11). In addition, the adjustment parameter or the
coefficient on the error correction term (ECT) fulfils the convergence condition of being
15Our results also paralleled the previous findings of Ramirez and Sharma (2008); Giuliano and Ruiz-Arranz (2009); Mundaca (2009); Dzansi and Shukur (2010); Bettin and Zazzaro (2011); Nyamongo, Misati, Kipyegon and Ndirangu, (2012); Lartey (2013); Chia (2014), and El Hama (2016) while negating the findings of Chowdhury (2016). We also affirmed the findings of Garba, et al. (2020) that there are both complementarity and substitutability effects of remittances and financial sector development on economic growth via the investment channel. Similarly, Adeniyi, et al., (2017) revealed that the complementarity or substitutability effect of remittances and financial development on output volatility depends on the indicators of financial development used.
20 | P a g e
negative, less than 1 in absolute value and statistically significant at the 1% level across
specifications. The coefficient which is 0.4 across the six specifications (see Tables 10 and
11) implies that previous errors arising from shocks to the explanatory variables (growth,
financial development indicators and remittances) are corrected in the current period at an
adjustment rate of 40%. By implication, there is a moderate convergence of savings-investment
gap towards its equilibrium or long-run value for Sub-Saharan Africa.
Insert Tables 10 & 11 here
5.3 Modelling Savings-Investment Gap in SSA: Does the Nexus between Remittances and
Financial Development matter?
We further evaluate the forecast accuracy of our unrestricted predictive model or general
specification (which in this case, is the baseline investment model augmented with the individual
and interactive effects of remittances and financial development) in relation to the restricted
predictive models which include the baseline accelerator model of investment and the baseline
model that is augmented with the individual effects of remittances and financial development only.
Based on the RMSE and the C-T test statistic, we observe the in-sample forecast superiority of our
unrestricted predictive model over the benchmark restrictive models using 75% of the full sample
size. Similarly, we are able to validate the improvement in the out-of-sample forecast accuracy of
our general specification over the two restricted predictive models. This is premised on lower
RMSE and positive C-T test statistic of our unrestricted model over the two restricted models (see
Tables 12 and 13), and our result is robust to the choice of financial development indicators (liquid
liabilities, private sector credit and bank deposits) and out-of-sample forecast horizons (2 and 4
years). We further demonstrate graphically the relative superiority of predicting savings-
investment gap using the baseline investment model augmented with the individual and interactive
effects of remittances and financial development. The predictability graphs make a comparison
between the actual and predicted values of savings-investment gap based on the forecasts from the
general specification for the SSA region (see Appendix B1).
Insert Tables 12 & 13 here
5.4 Sensitivity Analysis: Does the nexus between remittances and financial development matter in
modelling Savings-Investment Gap across SSA sub-regions?
Additionally, we conduct sub-regional sensitivity analyses to evaluate the forecast accuracy of our
unrestricted predictive model or general specification (which in this case, is the baseline investment model
augmented with the individual and interactive effects of remittances and financial development) in relation
to the restricted predictive models which include the baseline accelerator model of investment and the
baseline model that is augmented with the individual effects of remittances and financial development
only. Based on the RMSE and the C-T test statistic for the three SSA sub-regions under study, we observe
the superiority of the in-sample and out-of-sample forecasts based on the unrestricted predictive model
over the benchmark restrictive models using 75% of the full sample size forecast horizons of 2 and 4 years,
respectively. This is premised on lower RMSE and positive C-T test statistic of our unrestricted model
over the two restricted models (see Tables 14-19), and our result is robust to the choice of financial

21 | P a g e
development indicators (liquid liabilities, private sector credit and bank deposits), out-of-forecast horizons
(2 and 4 years) and SSA sub-regions under study. We further demonstrate graphically the relative
superiority of predicting savings-investment gap using the baseline investment model augmented with the
individual and interactive effects of remittances and financial development. The predictability graphs
make a comparison between the actual and predicted values of savings-investment gap based on the
forecasts from the general specification for the three sub-regions under study – ECCAS, SADC and
ECOWAS (see Appendices B2-B4).
Insert Tables 14, 15, 16, 17, 18 & 19 here
6. Concluding Remarks
We contribute to the literature by investigating the nexus among savings-investment gap,
remittances and financial sector development (with proxies including liquid liabilities, private
sector credit and bank deposits), unlike the majority of the previous studies that considered a
pair-wise relationship between the variables. We collect yearly data on 18 Sub-Saharan African
countries over the period from 1990 to 2017. Unlike previous studies, with the aid of forecast
tools (RMSE and C-T test statistic), we evaluate the forecast accuracy of our proposed model
– Accelerator model of investment augmented by the individual and interactive effects of
remittances and financial development - in relation to the restricted models (with and without
individual effects of remittances and financial sector development) using 75% of the full
sample and two forecast horizons (2 and 4 years) for in-sample and out-of-sample forecasts,
respectively for the SSA region as a whole and its three sub-regions under study - Economic
Community of Central African States (ECCAS), Southern African Development Community
(SADC) and Economic Community of West African States (ECOWAS).
Utilizing the Panel ARDL model estimated using Pooled Mean Group (PMG) estimator, we
observed that remittances inflow has negative impact on savings-investment gap both in the
short-run and long-run, irrespective of the financial development indicators used. Accounting
for the individual and interactive effects of remittances and the financial development
magnifies the impact of remittances in narrowing the savings-investment gap in the region,
most especially in the long run. Generally, irrespective of specifications, high rates of economic
growth have a knock-on effect in stimulating additional investments over a long-term horizon.
Irrespective of specifications, private sector credit exerts significant short-term influence on
widening the savings-investment gap as banks increasingly channel a large portion of their
deposit liabilities to fund profitable investment opportunities. Irrespective of specifications,
liquid liabilities have no significant impact on savings-investment gap both in the short run and
long run, whereas, bank deposits significantly widen savings-investment gap only in the long
run. Moreover, our result showed that the interactive effect of remittances and bank deposits is
significant and negative only in the short run, thereby justifying the complementarity
hypothesis. On the other hand, our results revealed that the interactive effects of remittances
and financial development indicators - liquid liabilities and private sector credit - are significant
and positive over a long-term horizon only, thereby affirming the postulates of the
substitutability hypothesis.

22 | P a g e
In addition, we showed that the unrestricted model – which considers the individual and
interactive effects of remittances and financial development - is preferred to the restricted
version that accounts for only the individual effects through the Wald test for variable
redundancy. Further, we observed the superiority of the in-sample and out-of-sample forecasts
based on the unrestricted predictive model over the benchmark restrictive models (which
ignores both effects or consider the individual effects only) premised on lower RMSE and
positive C-T test statistic associated with the former over the latter, and our results are robust
to the choice of financial development indicators, out-of-sample forecast horizons (2 and 4
years) and samples (SSA and the three sub-regions under study). We also demonstrated this
graphically in the Appendix. Our findings showed that significant investment opportunities
abound in Sub-Saharan Africa that could be financed either by the domestic financial sector or
the inflow of remittances or a combination of both. Meanwhile, the win-win strategy for SSA
countries is to improve the confidence of migrant workers and the beneficiary households in
the domestic financial sector so that both parties are encouraged to make use of the formal
channel, which is expected to enhance the capacity of banks to create more credit facilities16.
Achieving this would require a reduction of the remittance transfer costs in the region and
encouraging the beneficiaries to spend more on investment rather than on consumption.
16We acknowledge the recent directive by the Central Bank of Nigeria to the International Money Transfer Operators (IMTOs) to make remittances available to the beneficiaries in dollar cash or through their domiciliary accounts. This is in a bid to improve the inflow of foreign exchange; a situation that was warranted by the country’s weak external reserves position largely due to lower oil export receipts and limited foreign investment inflows, magnified by the outbreak and increasing spread of the coronavirus pandemic and its new strain.
23 | P a g e
References
Abida, Z. and Sghaier, I.M. (2014). Remittances, Financial Development and Economic Growth: The Case of North African Countries. The Romanian Economic Journal, 17(51): 137-170
Acosta, P., Calderon, C., Fajnzylber, P. and Lopez, H. (2008). What is the Impact of International Migrant Remittances on Poverty and Inequality in Latin America? World
Development, 36(1): 89-114. Adeniyi, O., Ajide, K. and Raheem, I.D. (2017). Remittances and output growth volatility in
developing countries: Does financial development dampen or magnify the effects? Empirical Economics, 56: 865–882.
Adenutsi, D.E. (2011). Financial Development, International Migrant Remittances and Endogenous Growth in Ghana. Studies in Economics and Finance, 28(1): 68-89. http://dx.doi.org/10.1108/10867371111110561
Adetou, A.E. and Fiodendji, K. (2019). Finance, Institutions, Remittances and Economic Growth: New Evidence from a Dynamic Panel Threshold Analysis. Journal of Applied
Finance & Banking, 9(2): 69-104. Aggarwal, R., Demirgüç-Kunt, A. and Pería, M.S.M. (2011). Do Remittances Promote
Financial Development? Journal of Development Economics, 96(2): 255-264. Akindipe, H.A. (2020). Remittances, Financial Development and Economic Growth in Nigeria.
DBN Journal of Economics and Sustainable Growth, 3(1): 147-172. Ali, H.S., Law, S.H. and Yusop, Z. (2018). Remittance and Growth Nexus: Bootstrap Panel
Granger-Causality Evidence from High Remittance Receiving Countries. International
Journal of Economics and Business Research, 15(3): 312-324. Asteriou, D. and Hall, S.G. (2007). Applied Econometrics: A Modern Approach. Published by
Palgrave Macmillan, Hampshire, New York, Revised Edition. Bandiera, O., Caprio, G., Honohan, P. and Schiantarelli, F. (2000). Does Financial Reforms
Raise or Reduce Savings? Review of Economic and Statistics, 82(2): 239-263. Bandura, W.N., Zivanomoyo, J. and Tsaurai, K. (2019). Remittances, Financial Development
and Economic Growth: A Case of Southern African Development Community. Acta
Universitatis Danubius, 15(4): 67-82. Bangake, C and Eggoh, J. (2019). Financial Development Thresholds and the
Remittances-Growth Nexus. Journal of Quantitative Economics, https://doi.org/10.1007/s40953-019-00188-6
Barajas, A., Chami, R., Fullenkamp, C., Gapen, M. and Montiel, P. (2009). Do Workers’ Remittances Promote Economic Growth? Working Paper, WP/09/153. Washington, DC: International Monetary Fund.
Beck, T., A. Demirguc-Kunt, R.E. Levine, M. Cihak and E.H.B. Feyen (2019). Financial development and structure data set (Updated in September 2019. Available from www.worldbank.org/en/publication/gfdr/data/financial-structure-database
Bettin, G. and Zazzaro, A. (2011). Remittances and financial development: Substitutes or complements in economic growth? Bulletin of Economic Research, 64(4): 509-536.
Bjuggren, P., Dzansi, J. and Shukur, G. (2010). Remittances and Investment. Centre of Excellence for Science and Innovation Studies Electronic Working Paper Series, Paper No. 216.
Bouhga-Hagbe, J. (2004). A Theory of Workers’ Remittances with an Application to Morocco. IMF Working Paper 194. International Monetary Fund.
Brown, R.P.C., Carmignani, F. and Fayad, G. (2019). Migrants’ Remittances and Financial Development: Macro- and Micro-level Evidence of a Perverse Relationship. OxCarre Research Paper, 59.

24 | P a g e
Campbell, J.Y. (2008). Viewpoint: Estimating the Equity Premium. Canadian Journal of
Economics, 41: 1–21. Chenery, H. and Strout, A. (1966). Foreign Assistance and Economic Development. American
Economic Review, 56(4), 679-733. Chia, Y.E. (2014). Remittances, financial depth and economic growth of Malaysia. Labuan
Bulletin of International Business and Finance, 12: 48-60. Chitambara, P. (2019). Remittances, Institutions and Growth in Africa. International
Migration, DOI: 10.1111/imig.12542. Chowdhury, M. (2016). Financial Development, Remittances and Economic Growth: Evidence
Using a Dynamic Panel Estimation. The Journal of Applied Economic Research, 10(1): 35–54.
Couharde, C. and Generoso, R. (2014). The Ambiguous Role of Remittances in West African Countries Facing Climate Variability. Environment and Development Economics, 20: 493–515.
Dash R.K. (2020). Impact of Remittances on Domestic Investment: A Panel Study of Six South Asian Countries. South Asia Economic Journal, 21(1):7-30.
De Gregorio, J. and Guidotti, P. (1995). Financial Development and Economic Growth. World
Development, 23: 433-48. Demetriades, P.O. and Luintel, K.B. (1996). Financial development, economic growth and
banking sector controls: Evidence from India. The Economic Journal, 106: 359-374. Efobi, U., Asongu, S., Okafor, C., Tchamyou, V. and Tanankem, B. (2016). Diaspora
Remittance Inflow, Financial Development and the Industrialisation of Africa. African
Governance and Development Institute, WP/16/037. Eggoh, J., Bangake, C. and Semedo, G. (2019). Do Remittances Spur Economic Growth?
Evidence from Developing Countries. The Journal of International Trade and Economic
Development, 15(2): 1-28. El Hamma, I. (2016). Linking Remittances with Financial Development and Institutions: A
Study from Selected MENA Countries. GREDEG Working Paper No. 2016–38. El Hamma, I. (2018). Migrant Remittances and Economic Growth: The Role of Financial
Development and Institutional Quality. Economics and Statistics, 503(504): 123-142. Fayissa, B. and Nsiah, C. (2010). The Impact of Remittances on Economic Growth and
Development in Africa. The American Economist, 55(2): 92-103. Garba, K.P., Adekunle, W. and Adeniyi. O. (2020). Nexus between Foreign Remittances and
Economic Growth in Nigeria: Role of the Financial Sector. Asian Journal of Economics
and Empirical Research, 7(1): 15-24. Giuliano, P. and Ruiz-Arranz, M. (2009). Remittances, Financial Development, and Growth.
Journal of Development Economics, 90: 144-152. Hassan, G.M. and Shakur, S. (2017). Nonlinear Effects of Remittances on Per Capita GDP
Growth in Bangladesh. Economies, 5(25): 1-11. IMF (2020). COVID-19: An Unprecedented Threat to Development. International Monetary
Fund’s Regional Economic Outlook for Sub-Saharan Africa, April 2020. Johnson, R.A., and Wichtern, D.W. (1992). Applied Multivariate Statistical Analysis, Third
Edition, Upper Saddle River, New Jersey: Prentice-Hall, Inc. Kao, C. (1999). Spurious Regression and Residual-Based Tests for Cointegration in Panel
Data. Journal of Econometrics, 90: 1-44. Kar, M., Nazlioğlu, S. and Ağir, H. (2014). Trade Openness, Financial Development and
Economic Growth in Turkey: Linear and Nonlinear Causality Analysis. BDDK
Bankacılık ve Finansal Piyasalar, 8(1): 64-86. Karikari, N.K, Mensah, S. and Harvey, S.K (2016). Do Remittances Promote Financial
Development in Africa? Springer Plus, 5:1-21.

25 | P a g e
Khan, M.A. and Qayyum, A. (2007). Trade Liberalization, Financial Development and Economic Growth. Pakistan Institute of Development Economics Working Papers 19.
KNOMAD (2020). COVID-19 Crisis through a Migration Lens. Migration and Development
Brief 32. Retrieved from http://documents1.worldbank.org Kousar, R., Rais, S.I., Mansoor, A., Zaman, K., Shah, S.T.H. and Ejaz, S. (2019). The Impact
of Foreign Remittances and Financial Development on Poverty and Income Inequality in Pakistan: Evidence from ARDL - Bounds Testing Approach. Journal of Asian Finance,
Economics and Business, 6(1): 71-81. Lartey, E.K.K. (2013) Remittances, Investment and Growth in Sub-Saharan Africa. The
Journal of International Trade and Economic Development: An International and
Comparative Review, 22(7): 1038-1058. Le, T. (2011), Remittances for economic development: the investment perspective. Economic
Modelling, 28: 2409-2415. Luintel, K.B. and Khan, M.A. (1999). A Quantitative Reassessment of the Finance-Growth
Nexus: Evidence from a Multivariate VAR. Journal of Economics, 60:381-405. Massa, I. and Willem te Velde, D. (2008). The Global Financial Crisis: will successful African
countries be affected? Overseas Development Institute (ODI). Retrieved from http://www.odi.org.uk/
Matuzeviciute, K. and Butkus, M. (2016). Remittances, Development Level, and Long-Run Economic Growth. Economies, 4(28): 1-20.
Misati, R.N., Kamau, A. and Nassir, H. (2019). Do Migrant Remittances Matter for Financial Development in Kenya? Financial Innovation, 5(31): 1-25.
Mundaca, B.G. (2009). Remittance, Financial Market Development, and Economic Growth: The Case of Latin America and the Caribbean. Review of Development Economics, 13: 288-303.
Nyamongo, E.M., Misati, R.N., Kipyegon, L. and Ndirangu, L. (2012). Remittances, Financial Development and Economic Growth in Africa. Journal of Economics and Business, 64: 240-260.
OECD. (2006). International Migrant Remittances and Their Role in Development. International Migration Outlook. SOPEMI, Paris. Retrieved from http://www.oecd.org/els/mig/38840502.pdf
Okodua, H. (2013). Migrant Workers’ Remittances and Private Investment in Sub-Saharan African Countries. European Journal of Social Sciences, 36(3): 451-461.
Olaniyan, T.O. (2019). Interactive Effects of Remittances and Financial Sector Development on Economic Growth in Nigeria. Remittances Review, 4(1): 19-39. DOI: https://doi.org/10.33182/rr.v4i1.677
Olayungbo, D.O. and Quadri, A. (2019). Remittances, Financial Development and Economic Growth in Sub-Saharan African Countries: Evidence from a PMG-ARDL Approach. Financial Innovation, 5(9): 1-25.
Pedroni, P. (2004). Panel Cointegration: Asymptotic and Finite Sample Properties of Pooled Time Series Tests with Application to the PPP Hypothesis. Economic theory, 20: 597-625.
Peprah, J.A., Ofori, I.K. and Asomani, A.N. (2019). Financial Development, Remittances and Economic Growth: A Threshold Analysis. Cogent Economics and Finance, 7: 1-20. https://doi.org/10.1080/23322039.2019.1625107
Pesaran, M.H. and Smith, R. (1995). Estimation of Long-Run Relationship from Dynamic Heterogeneous Panels. Journal of Econometrics, 68: 79-113.
Pesaran, M.H., Shin, Y. and Smith, R.P. (1999). Pooled Mean Group Estimation of Dynamic Heterogeneous Panels. Journal of the American Statistical Association, 94(446): 621-634.

26 | P a g e
Qiang, S., Khurshid, A., Calin, A.C. and Khan, K. (2019). Do Remittances Contribute to the Development of Financial Institutions? New Evidence from the Developing World. Romanian Journal of Economic Forecasting, 22(2): 78-97.
Ramirez, M.D. and Sharma, H. (2008). Remittances and growth in Latin America: A panel unit root and panel cointegration analysis. Yale University Economics Department Working Paper No. 51.
Siddique, A., Selvanathan, E.A. and Selvanathan, S. (2012). Remittances and Economic Growth: Empirical Evidence from Bangladesh, India and Sri Lanka. The Journal of
Development Studies, 48(8): 1045-1062. Sobiech, I. (2019). Remittances, Finance and Growth: Does Financial Development Foster the
Impact of Remittances on Economic Growth? World Development, 113: 44–59. Tah, K.A. (2019). Remittances and Financial Access: Evidence from Sub-Saharan Africa.
Cogent Economics and Finance, 7: 1-10. Theil, H. (1971). Principles of Econometrics. London: North Holland. Todaro, M. and Smith, S.C. (2012). Economic Development (11th Ed.). USA: Pearson
Education Incorporated Tung, L.T. (2018). The Impact of Remittances on Domestic Investment in Developing
Countries: Fresh Evidence from the Asia-Pacific Region. Organizations and Markets in
Emerging Economies, 9(2): 193-211. Westerlund, J. and Narayan, P.K. (2012). Does the choice of estimator matter when forecasting
returns? Journal of Banking and Finance, 36: 2632–2640. World Bank (1989). World Development Report 1989. New York: Oxford University Press. World Bank (2019). Migration and Remittances: Recent Developments and Outlook. Migration
and Development Brief, 31. Retrieved from: https://www.knomad.org/sites/default/files Word Development Indicators (WDI), 2019. Database of the World Bank. Retrieved from
https://data.worldbank.org/country/nigeria
Insert Appendix Table & Figures here

Supplementary Files
This is a list of supplementary �les associated with this preprint. Click to download.
FiguresCharts.docx
Tables.pdf