Analysis of Sample Survey Data in SAS Group Presentations...ANALYSIS OF SAMPLE SURVEY DATA Ana...
22
ANALYSIS OF SAMPLE SURVEY DATA Ana Yankovsky Research Associate Alberta Cancer Prevention Legacy Fund Alberta Health Services 1
-
Upload
truongkien -
Category
Documents
-
view
220 -
download
0
Transcript of Analysis of Sample Survey Data in SAS Group Presentations...ANALYSIS OF SAMPLE SURVEY DATA Ana...

ANALYSIS OF SAMPLE
SURVEY DATA
Ana Yankovsky
Research Associate
Alberta Cancer Prevention Legacy Fund
Alberta Health Services
1

Overview
• Explore why we need survey analysis tools;
• Learn about analytics survey procedures in SAS;
• Use procedures with sample survey examples;
• Questions/Discussion;
2

Why do we need survey data analysis
software?• Regular statistical software analyzes data as if the data were
collected using simple random sampling;
• Very few surveys use a simple random sample to collect
data because it is not efficient (financially or statistically);
• If you ignore the sampling design both the point estimates
and their standard errors will likely be calculated incorrectly.
3

Complex Sample Design Analysis• Need to account for weights, stratification, and clustering that was part of
the sample design;The sampling weight will affect the calculation of the point estimate;
The stratification and/or clustering will affect the calculation of the standard errors.
Ignoring the clustering will likely lead to standard errors that are underestimated, possibly leading to results that seem to be statistically significant, when in fact, they are not.
• SURVEY procedures allow for correct estimation of variances/standard errors from complex samples;
• SURVEY procedures cover main analytic techniques:Means/Totals
Frequency tables
Linear regression
Logistic regression
Survival models using PH regression approach
4

Example 1: Big Burn Marketing Survey
• Sampling from an on-line panel – non-random sampling;
• Sample was weighted according to Census 2011;
• Target population parents of children 10 to 15 years old;
• The intend of this survey is to measure the impact of a
marketing campaign on the parents’ knowledge, believe
and behavior towards indoor tanning and assess if they
talked to their children about the skin cancer risks that
indoor tanning posses;
5

PROC SURVEYFREQ
PROC SURVEYFREQ <options> ;
BY variables ;
CLUSTER variables ;
REPWEIGHTS variables </ options> ;
STRATA variables </ option> ;
TABLES requests </ options> ;
WEIGHT variable ;
6

PROC SURVEYFREQ• For one-way frequency tables
Rao-Scott chi-square goodness-of-fit tests, which are adjusted for
the sample design.
• For tables computes
Estimates and confidence limits for risks (or row proportions), the
risk difference, the odds ratio, and relative risks.
• For two-way tables provides
Design-adjusted tests of independence, or no association,
between the row and column variables.
• Provides a choice of variance estimation methods
Taylor series linearization,
Balanced repeated replication (BRR),
Jackknife.
7

Example 1: Big Burn Marketing Survey
Test if more parents talked to their child about indoor
tanning post marketing intervention;
PROC SURVEYFREQ data=ana.allcamp3;
TABLES post*q7_1/or row nowt chisq
plots=WTFREQPLOT(scale= percent);
WEIGHT weight;
RUN;
8

Example1: Big Burn Marketing Survey
9

PROC SURVEYLOGISTICS
PROC SURVEYLOGISTIC <options> ;BY variables ;
CLASS variable <(v-options)> <variable <(v-options)> ...> </ v-options> ;
CLUSTER variables ;
CONTRAST ’label’ effect values <,...effect values> </ options> ;
DOMAIN variables <variablevariable variablevariablevariable ...> ;
FREQ variable ;
MODEL events/trials = <effects < / options>> ;
MODEL variable <(v-options)> = <effects> < / options> ;
OUTPUT <OUT=SAS-data-set> <options> ;
REPWEIGHTS variables < / options> ;
STRATA variables </ option> ;
<label:> TEST equation1 < , ... , equationk> </ options> ;
UNITS independent1 = list1 <... independentk = listk> < / options> ;
WEIGHT variable </ option> ;
10

Example 1: Big Burn Marketing Survey
Test the model that parents did not talk to their child about
indoor tanning because of their sex, low income, believe
that it is not important to talk about indoor tanning, that they
allow their children to tan and that the parents themselves are tanning beds users.
PROC SURVEYLOGISTIC data=ana.allcamp3;
CLASS sex low_income not_import alow_tan q10;
MODEL q7_1 (REF=‘0') = sex low_income not_import
alow_tan q10 / link=glogit;
WEIGHT weight;
RUN;
11

Example 1: Big Burn Marketing Survey
12

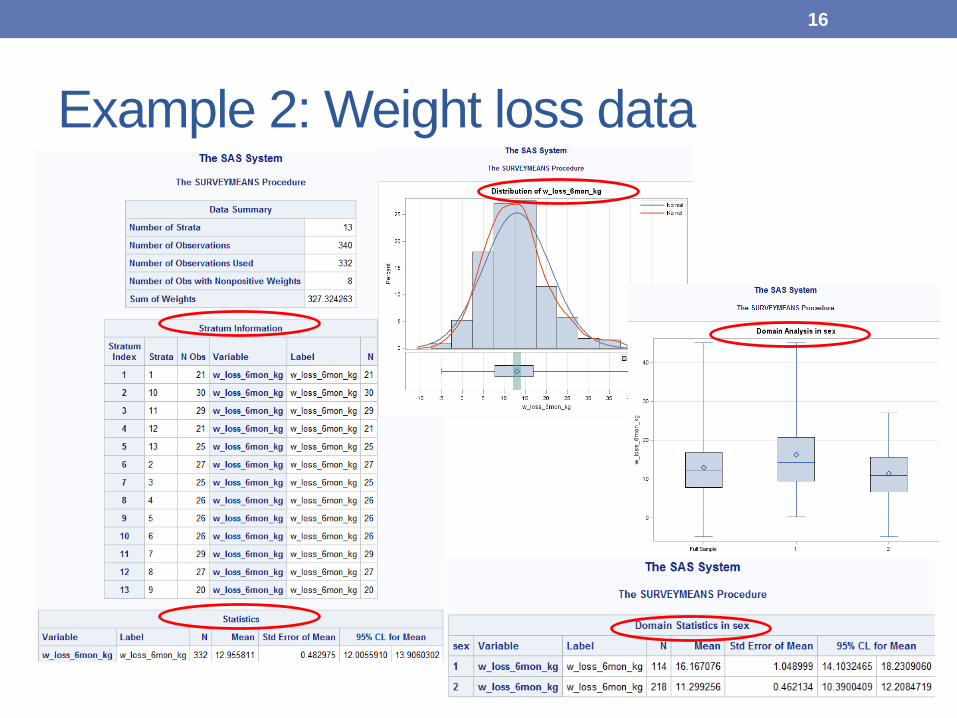
Example 2: Weight loss data
• Fictional data to show how other survey analysis
procedures work;
• Sample is stratified by region of residence of the
participant and is weighted according to Census 2011;
• Data reflects a longitudinal survey design, intended to
measure the weight loss after 6 months among those
participating in a diet/exercise program.
13

PROC SURVEYMEANS
PROC SURVEYMEANS <options> <statistic-keywords> ;
BY variables ;
CLASS variables ;
CLUSTER variables ;
DOMAIN variables <variable variable variable...> < / option> ;
RATIO <’label’> variables / variables ;
REPWEIGHTS variables < / options> ;
STRATA variables < / option> ;
VAR variables ;
WEIGHT variable ;
14

Example 2: Weight loss data
PROC SURVEYMEANS data=example
/*sum df clm fraction*/;
VAR w_loss_6mon_kg;
STRATA Strata/ list;
DOMAIN sex;
WEIGHT weight;
RUN;
15
Example 2: Weight loss data
16

PROC SURVEYREG
PROC SURVEYREG <options> ;BY variables ;
CLASS variables ;
CLUSTER variables ;
CONTRAST ’label’ effect values < ... effect values> </ options> ;
DOMAIN variables <variablevariable variablevariablevariable ... > ;
EFFECT name = effect-type ( variables </ options> ) ;
ESTIMATE <'label'> estimate-specification < / options> ;
LSMEANS <model-effects> </ options> ;
LSMESTIMATE model-effect lsmestimate-specification < / options> ;
MODEL dependent = <effects> </ options> ;
OUTPUT <keyword <=variable-name> ... keyword <=variable-name>> </ option> ;
REPWEIGHTS variables < / options> ;
SLICE model-effect </ options> ;
STORE <OUT=>item-store-name</LABEL='label'> ;
STRATA variables </ option> ;
TEST <model-effects> </ options> ;
WEIGHT variable ;
17

Example 2: Weight loss data
PROC SURVEYREG data=example;
STRATA Strata / list;
CLASS sex tobacco_use diabetes;
MODEL w_loss_6mon_kg = sex tobacco_use
diabetes / covB;
WEIGHT Weight;
RUN;
18

Example 2: Weight loss data
19

Other Sample Survey Analysis Procedures
PROC SURVEYPHREG - procedure performs regression
analysis based on the Cox proportional hazards model for
sample survey data;
PROC SURVEYSELECT - procedure provides a variety of
methods for selecting probability-based random samples;
20

References:
1. Statistical Computing Seminar. Applied Survey Data Analysis using SAS 9.4. UCLA:
Statistical Consulting Group. From
http://statistics.ats.ucla.edu/stat/sas/seminars/SAS_survey/ (accessed March 21,
2016).
2. An, A. & Watts, D. New SAS Procedures for Analysis of Sample Survey Data. SAS
Institute. From http://www.ats.ucla.edu/stat/sas/libra.ry/svy_survey.pdf (accessed
March 30, 2016).
3. Survey Analysis. SAS Support. From
https://support.sas.com/rnd/app/stat/procedures/SurveyAnalysis.html (accessed
March 30, 2016)
4. Berglund, P. A. Analysis of Survey Data Using the SAS SURVEY Procedures: A
Primer. From:
http://www.isr.umich.edu/src/smp/asda/Berglund%20Survey%20Data%20Analysis%2
0WIILL%20June%202014.pdf (accessed March 21, 2016)
21

Questions?
22