Analysis of residential single jet meter accuracy ......**FACSA. Calle Mayor 82. 12001 Castellon....
23
Analysis of residential single jet meter accuracy degradation rate F.J. Arregui*, F.J. Gavara * Universitat Politecnica Valencia. Camino de Vera s/n. 46022 Valencia. Spain – [email protected] **FACSA. Calle Mayor 82. 12001 Castellon. Spain - [email protected] This presentation was made by Francisco Arregui at the IWA International Conference on Water Efficiency and Performance Assessment of Water Services Conference in Cincinnati U.S.A in April 2015. The authors have confirmed that they are entitled to grant this permission for copies to be made available free of charge for reading and/or downloading from the LEAKSSuite website.
Transcript of Analysis of residential single jet meter accuracy ......**FACSA. Calle Mayor 82. 12001 Castellon....

Analysis of residential single jet meter accuracy degradation rate
F.J. Arregui*, F.J. Gavara
* Universitat Politecnica Valencia. Camino de Vera s/n. 46022
Valencia. Spain – [email protected]
**FACSA. Calle Mayor 82. 12001 Castellon. Spain -
This presentation was made by Francisco Arregui at the IWA
International Conference on Water Efficiency and Performance
Assessment of Water Services Conference in Cincinnati U.S.A in April
2015.
The authors have confirmed that they are entitled to grant this
permission for copies to be made available free of charge for reading
and/or downloading from the LEAKSSuite website.

Water Efficiency and Performance Assessment of Water Services - Cincinnati, Ohio (USA) - April 20-24, 2015
Francisco Arregui – [email protected]
Francesc Gavara – [email protected]

The company in figures
• Serves more than 1.5 million customers
• 200 towns, mostly medium and small size
• Distributes 300 MLD
• 3000 km of pipes
• 375,380 customer meters
Water Efficiency and Performance Assessment of Water Services - Cincinnati, Ohio - April 2015
Metering errors vary with flow rate
-10
-5
0
5
10 100 1000 10000
Flow rate (l/h)
Err
or
(%)
Class B Velocity meter 30 l/h 120 l/h 3000 l/h
Leaks
New meter
Starting flow

Water Efficiency and Performance Assessment of Water Services - Cincinnati, Ohio - April 2015
Metering errors vary with flow rate
-10
-5
0
5
10 100 1000 10000
Flow rate (l/h)
Err
or
(%)
Class C - PD 15 l/h 22.5 l/h 3000 l/h
New meter
Starting flow

Water Efficiency and Performance Assessment of Water Services - Cincinnati, Ohio - April 2015
What happens to meters when they get old?
-10
-5
0
5
10 100 1000 10000
Flow rate (l/h)
Err
or
(%)
Class B Velocity meter 30 l/h 120 l/h 3000 l/h
Leaks
New meter Old meter
Water Efficiency and Performance Assessment of Water Services - Cincinnati, Ohio - April 2015
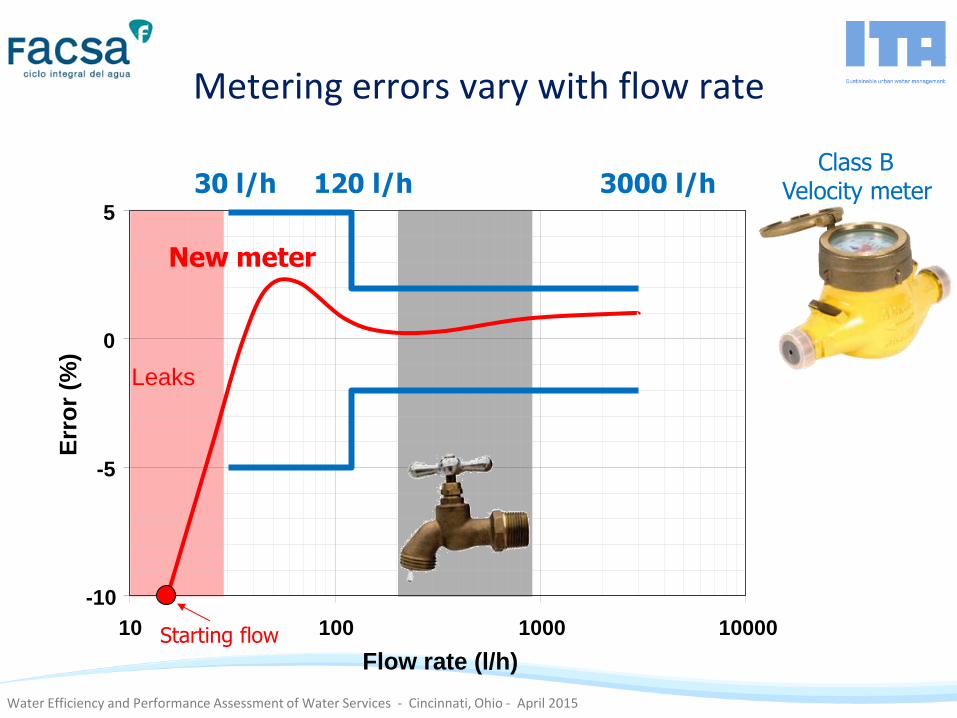
Finding real field performance of a meter
Weighted error
Water consumption pattern Error curve
-10
-5
0
5
10
1 10 100 1000
Erro
r (%
)
Flow rate (l/h)
0
10
20
30
40
50
4,71,9 1,3 0,8 0,5 0,4 1,1 1,1
6,3
25,3
43,3
11,9
1,2 0,2
Wate
r co
nsu
mp
tio
n (
%)
Flow rate (l/h)

Water Efficiency and Performance Assessment of Water Services - Cincinnati, Ohio - April 2015
Understanding weighted error of a meter
Weighted error of -X%
-10
-5
0
5
10
1 10 100 1000
Erro
r (%
)
Flow rate (l/h)
0
10
20
30
40
50
4,71,9 1,3 0,8 0,5 0,4 1,1 1,1
6,3
25,3
43,3
11,9
1,2 0,2
Wate
r co
nsu
mp
tio
n (
%)
Flow rate (l/h)
-X% weighted error means that every 100 litres consumed X litres are not measured
It is strictly associated to: One meter (or type of meter)
One customer (or type of customer)

Water Efficiency and Performance Assessment of Water Services - Cincinnati, Ohio - April 2015
Consumption pattern
Results were taken from a previous research in the same city in 2006
200 domestic customers were monitored
This consumption pattern is currently being updated
Flow rates (l/h) Consumption (%)
0-6 3.2
6-12 1.8
12-24 2.3
24-45 2.4
45-90 3.7
90-250 8.6
250-1000 72.7
1000-2000 4.5
2000-3000 0.8
>3000 0
Water Efficiency and Performance Assessment of Water Services - Cincinnati, Ohio - April 2015
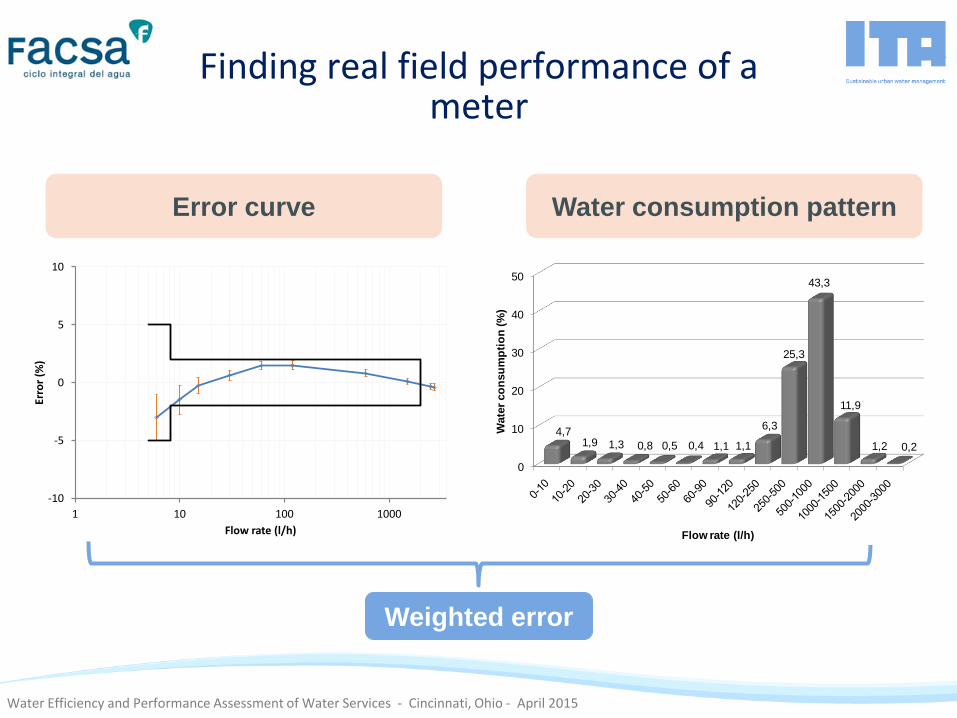
Findings about the weighted error of new domestic meters
The following results are associated to the specific consumption pattern of the city
Class B or Equivalent Class C or Equivalent
Positive
displacement
Water Efficiency and Performance Assessment of Water Services - Cincinnati, Ohio - April 2015
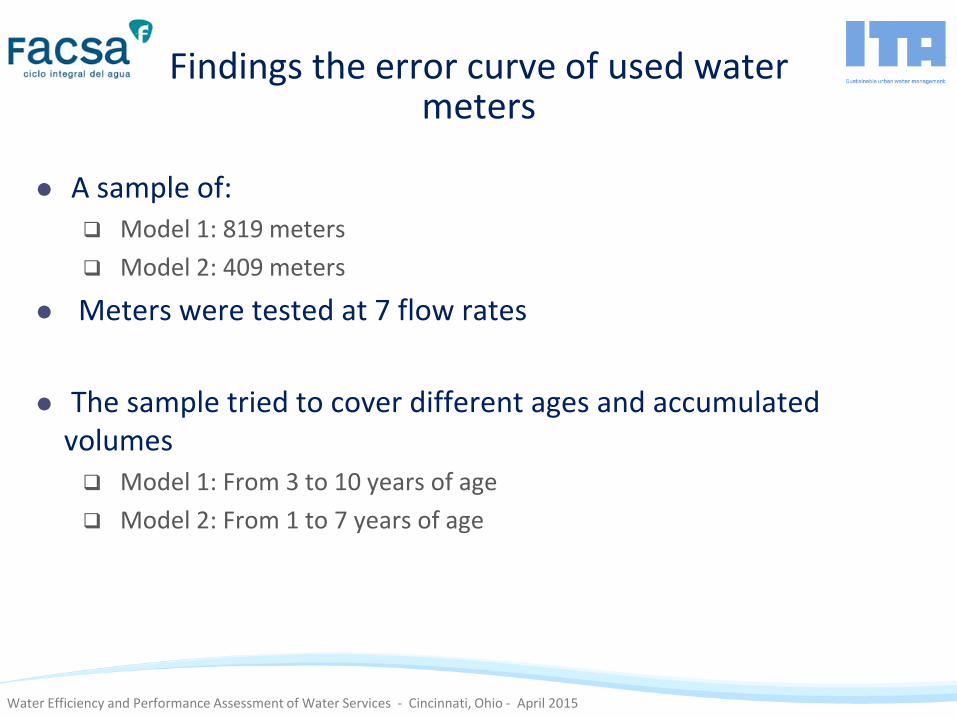
Findings the error curve of used water meters
A sample of: Model 1: 819 meters
Model 2: 409 meters
Meters were tested at 7 flow rates
The sample tried to cover different ages and accumulated volumes Model 1: From 3 to 10 years of age
Model 2: From 1 to 7 years of age
Water Efficiency and Performance Assessment of Water Services - Cincinnati, Ohio - April 2015
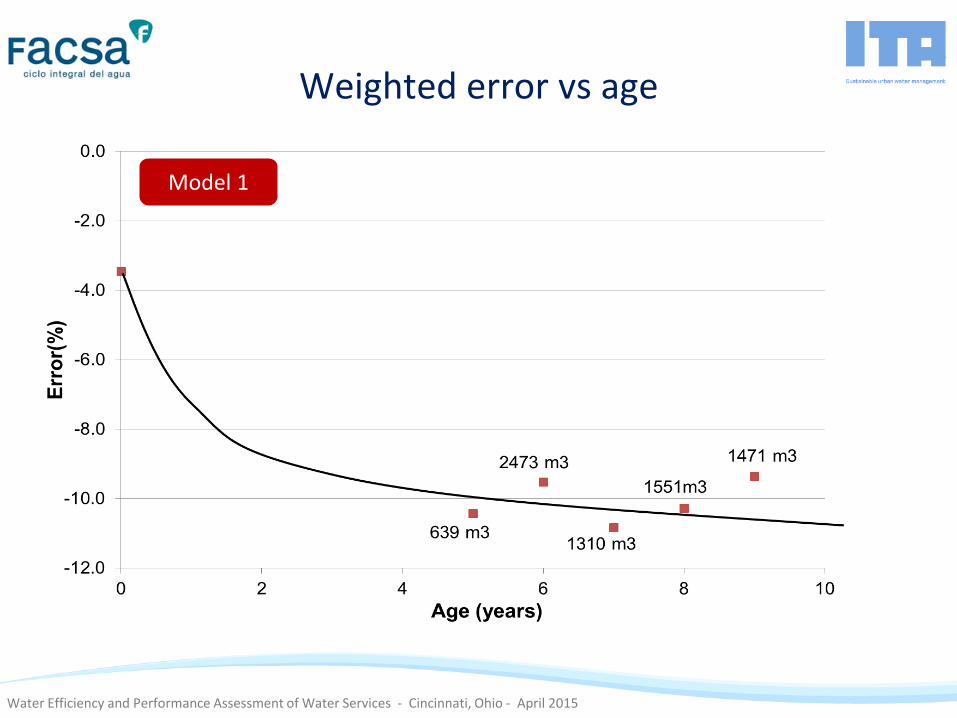
Weighted error vs age
Model 1
Water Efficiency and Performance Assessment of Water Services - Cincinnati, Ohio - April 2015
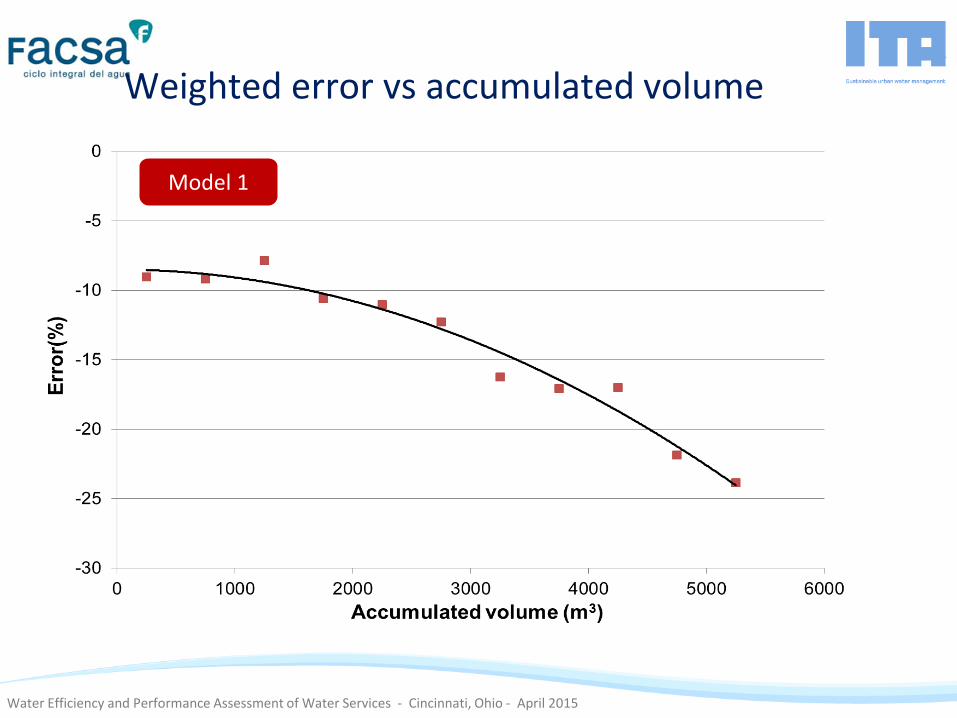
Weighted error vs accumulated volume
Model 1
Water Efficiency and Performance Assessment of Water Services - Cincinnati, Ohio - April 2015
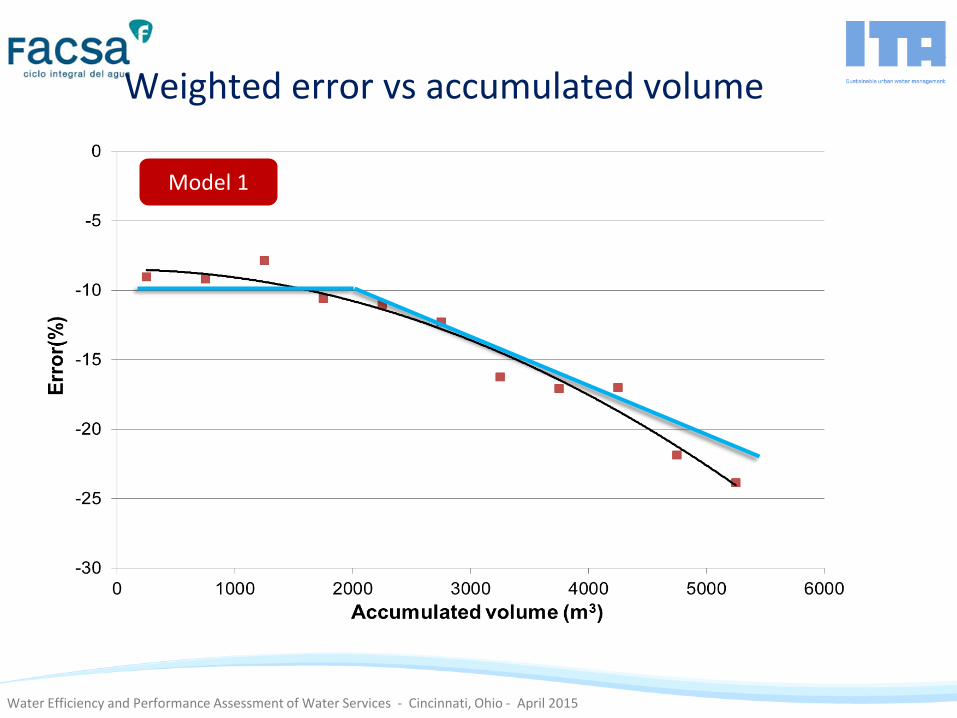
Weighted error vs accumulated volume
Model 1
Water Efficiency and Performance Assessment of Water Services - Cincinnati, Ohio - April 2015
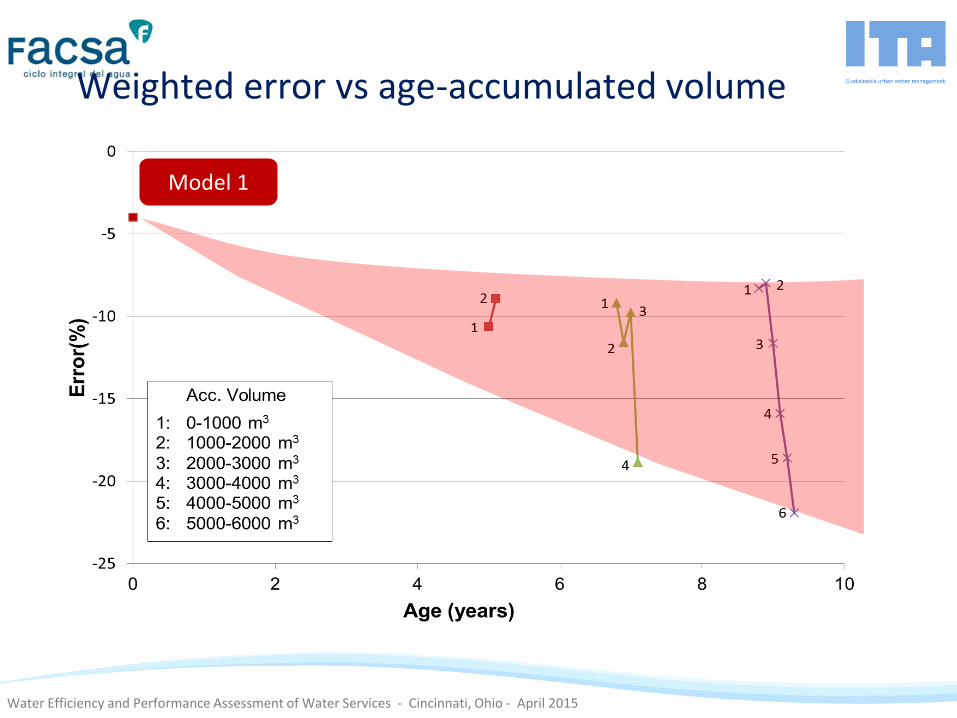
Weighted error vs age-accumulated volume
Model 1
Water Efficiency and Performance Assessment of Water Services - Cincinnati, Ohio - April 2015
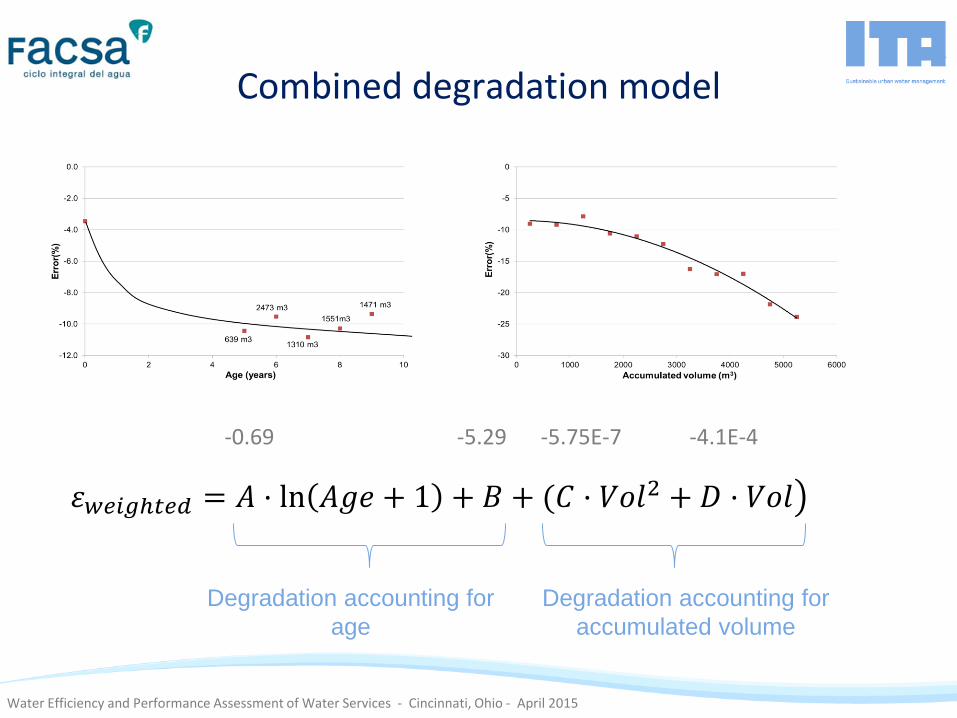
Combined degradation model
𝜀𝑤𝑒𝑖𝑔ℎ𝑡𝑒𝑑 = 𝐴 · ln 𝐴𝑔𝑒 + 1 + 𝐵 + (𝐶 · 𝑉𝑜𝑙2 + 𝐷 · 𝑉𝑜𝑙
Degradation accounting for
age
Degradation accounting for
accumulated volume
-0.69 -5.29 -5.75E-7 -4.1E-4
Water Efficiency and Performance Assessment of Water Services - Cincinnati, Ohio - April 2015
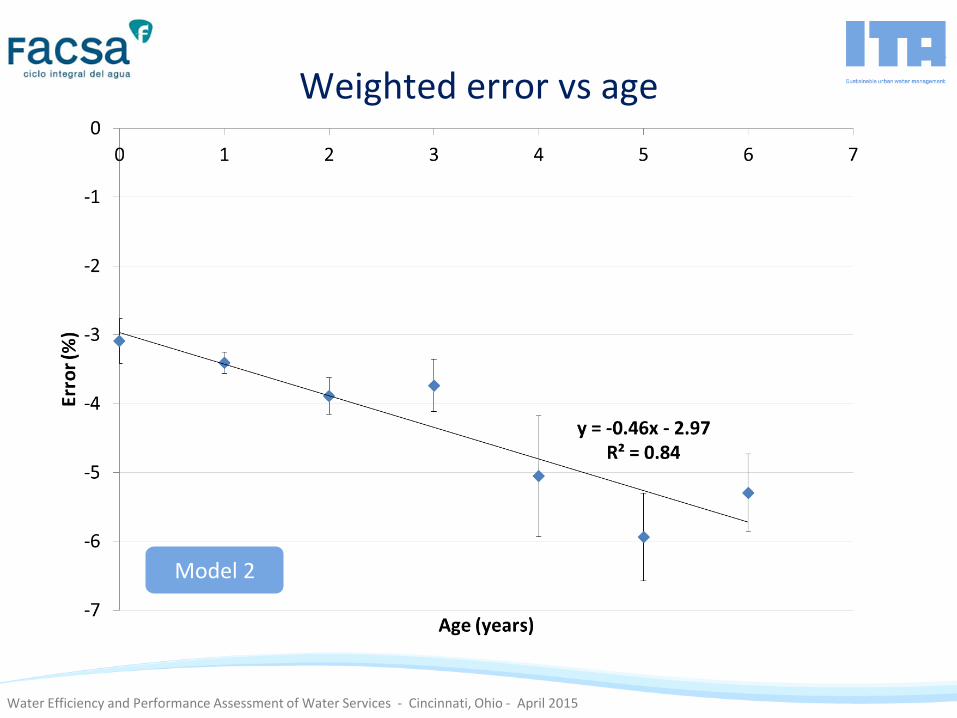
Weighted error vs age
Model 2

Water Efficiency and Performance Assessment of Water Services - Cincinnati, Ohio - April 2015
Weighted error vs accumulated volume
Model 2
Water Efficiency and Performance Assessment of Water Services - Cincinnati, Ohio - April 2015
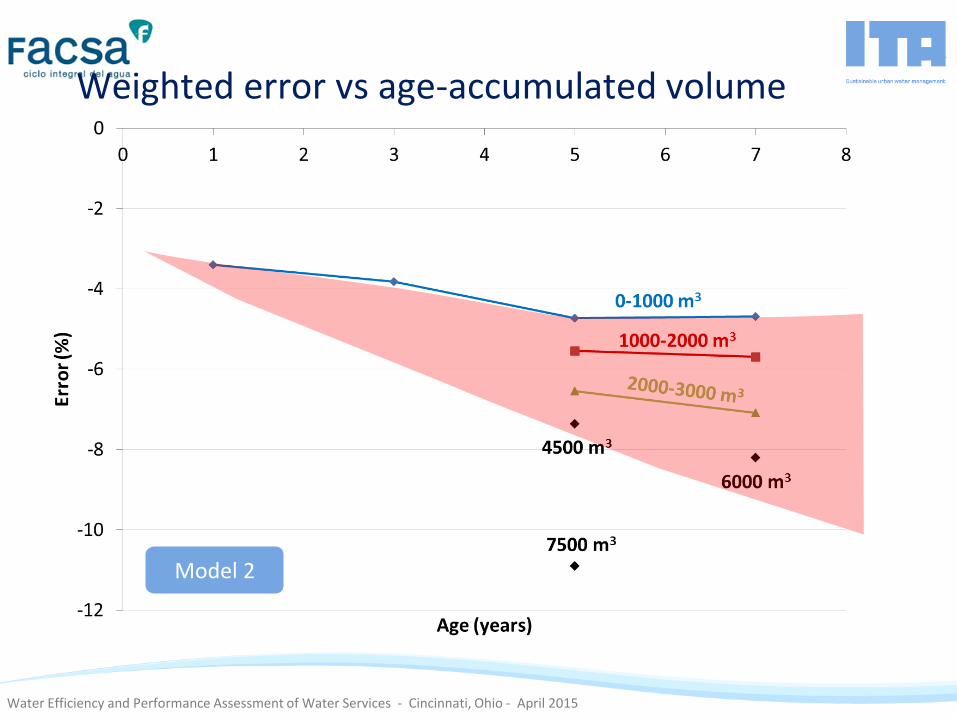
Weighted error vs age-accumulated volume
Model 2

Water Efficiency and Performance Assessment of Water Services - Cincinnati, Ohio - April 2015
Weighted error vs age-accumulated volume
Model 2

Water Efficiency and Performance Assessment of Water Services - Cincinnati, Ohio - April 2015
Comparison: Age
Model 2
Model 1
Water Efficiency and Performance Assessment of Water Services - Cincinnati, Ohio - April 2015
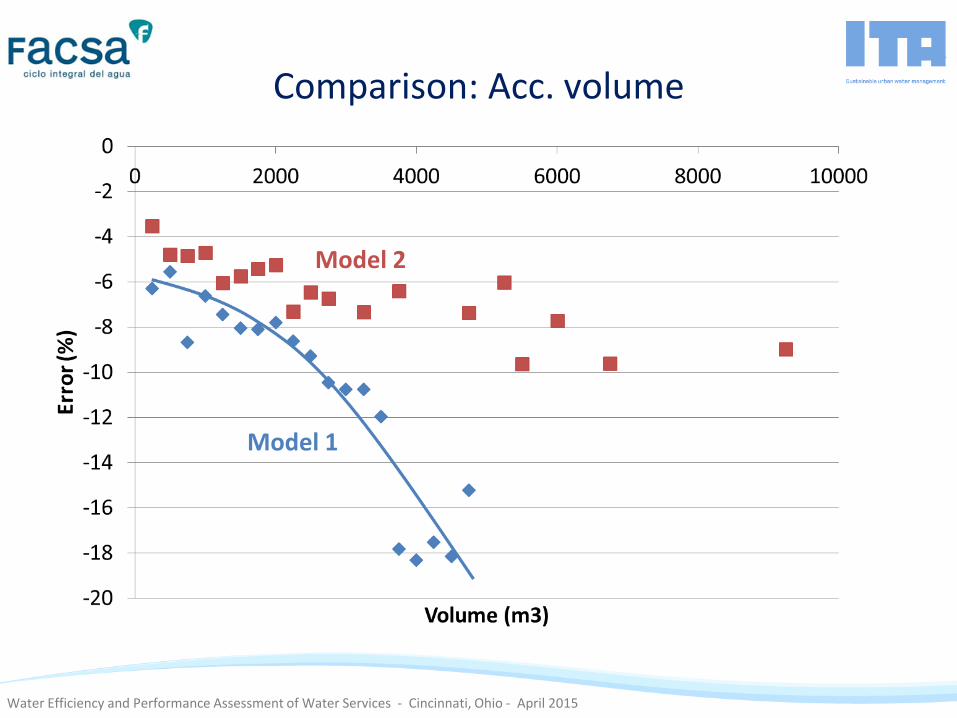
Comparison: Acc. volume
Model 2
Model 1

Water Efficiency and Performance Assessment of Water Services - Cincinnati, Ohio - April 2015
Conclusions
Linear degradation with age may not be valid
Extremely different degradation rates for two models
A combined model accounting for age and accumulated volume is needed (different from each model)
𝜀𝑤𝑒𝑖𝑔ℎ𝑡𝑒𝑑 = 𝐴 · ln 𝐴𝑔𝑒 + 1 + 𝐵 + (𝐶 · 𝑉𝑜𝑙2 + 𝐷 · 𝑉𝑜𝑙
Degradation accounting for
age
Degradation accounting for
accumulated volume