ANALYSIS OF RELATIONSHIP BETWEEN OCULOMOTOR AND ...
12
© The Polish Journal of Aviation Medicine and Psychology 2014 | Volume 20 | Issue 2 | 5 ANALYSIS OF RELATIONSHIP BETWEEN OCULOMOTOR AND PSEUDOSEIZURE ACTIVITY IN EEG EXAMINATIONS OF AVIATION PERSONNEL Author’s address: Results: Jan S. MISZCZAK 1 , Stanisław DEC 1 , Ewa ZALEWSKA 2 1 Military InsƟtute of AviaƟon Medicine, Warsaw, Poland 2 Nałęcz InsƟtute of BiocyberneƟcs and Biomedical Engineering, Warsaw, Poland J. Miszczak, Military Institute of Aviation Medicine, Krasińskiego 54/56 str., 01-755 Warsaw, Poland, e-mail: [email protected] Introduction: ORIGINAL ARTICLE Own sources Source of support: Methods: Pol J Aviat Med Psychol 2014; 20(2): 5-16 DOI: 10.13174/pjamp.20.02.2014.1 Figures: 11 • References: 23 • Full-text PDF: http://www.pjamp.com • Copyright © 2014 Polish Aviation Medicine Society, ul. Krasińskiego 54/56, 01-755 Warsaw, license WIML • IndexaƟon: Index Copernicus, Polish Ministry of Science and Higher EducaƟon This is an open-access arƟcle distributed under the terms of the CreaƟve Commons AƩribuƟon Non-commercial License (hƩp://creaƟvecommons.org/licenses/by-nc/3.0), which permits use, distribuƟon, and reproducƟon in any medium, provided the original work is properly cited, the use is non-commercial and is otherwise in compliance with the license. Electrooculographic (EOG) activity recorded simultaneously with the EEG signal is the most common artifact which may be eliminated from EEG records by special algorithms applied in the recording systems. The objective of this study was to identify potential relationships between the activity caused by involuntary eye movement and the spon- taneous activity of the brain. A hypothesis was proposed with regard to a potential relationship between interoceptive (central) and exteroceptive (peripheral) mechanism of EOG activity and pseudoseizure episodes in EEG records of healthy subjects. EEG, VEOG (vertical electrooculographic) and HEOG (horizontal electrooculographic) activity was recorded using a Neuroscan 4.3 system for neurophysiological examination with 1 kHz sampling frequency and 16-bit amplitude resolution. The records were made in line with the recommendation of the International Federation of Clinical Neurophy- siology. The study group consisted of 30 healthy subjects aged 24-32 years. A total of 10 records with EOG artifacts were selected for the analysis. The signals were analyzed in the bands of 0.1-4 Hz, 4-8 Hz, 8-14 Hz, and 0.1-70 Hz using FFT, Intra-Class Correlation coefficients and coherence ratios. The results showed a significant variability of the amplitude and frequency of the epi- sodes of EOG activity simultaneous to EEG oscillations in various areas of the brain. The highest impact of EOG on the EEG record was observed in the frontotemporal region. The coherence ratios for signals recorded in the mediotemporal region was 0.56-0.67 (delta) and 0.8-0.95 (theta) compared to <0.99 in the frontal region. Simultaneous EOG oscillations and pseudoseizure-type EEG activity were observed in 3 records.
Transcript of ANALYSIS OF RELATIONSHIP BETWEEN OCULOMOTOR AND ...

© The Polish Journal of Aviation Medicine and Psychology 2014 | Volume 20 | Issue 2 | 5
ANALYSIS OF RELATIONSHIP BETWEEN
OCULOMOTOR AND PSEUDOSEIZURE ACTIVITY
IN EEG EXAMINATIONS OF AVIATION PERSONNEL
Author’s address:
Results:
Jan S. MISZCZAK1, Stanisław DEC1, Ewa ZALEWSKA2
1Military Ins tute of Avia on Medicine, Warsaw, Poland2Nałęcz Ins tute of Biocyberne cs and Biomedical Engineering, Warsaw, Poland
J. Miszczak, Military Institute of Aviation Medicine, Krasińskiego 54/56 str., 01-755 Warsaw, Poland, e-mail: [email protected]
Introduction:
ORIGINAL ARTICLE
Own sourcesSource of support:
Methods:
Pol J Aviat Med Psychol 2014; 20(2): 5-16DOI: 10.13174/pjamp.20.02.2014.1
Figures: 11 • References: 23 • Full-text PDF: http://www.pjamp.com • Copyright © 2014 Polish Aviation Medicine Society, ul. Krasińskiego 54/56, 01-755 Warsaw, license WIML • Indexa on: Index Copernicus, Polish Ministry of Science and Higher Educa on
This is an open-access ar cle distributed under the terms of the Crea ve Commons A ribu on Non-commercial License (h p://crea vecommons.org/licenses/by-nc/3.0), whichpermits use, distribu on, and reproduc on in any medium, provided the original work is properly cited, the use is non-commercial and is otherwise in compliance with the license.
Electrooculographic (EOG) activity recorded simultaneously with the EEG signal is the most common artifact which may be eliminated from EEG records by special algorithms applied in the recording systems. The objective of this study was to identify potential relationships between the activity caused by involuntary eye movement and the spon-taneous activity of the brain. A hypothesis was proposed with regard to a potential relationship between interoceptive (central) and exteroceptive (peripheral) mechanism of EOG activity and pseudoseizure episodes in EEG records of healthy subjects.
EEG, VEOG (vertical electrooculographic) and HEOG (horizontal electrooculographic) activity was recorded using a Neuroscan 4.3 system for neurophysiological examination with 1 kHz sampling frequency and 16-bit amplitude resolution. The records were made in line with the recommendation of the International Federation of Clinical Neurophy-siology. The study group consisted of 30 healthy subjects aged 24-32 years. A total of 10 records with EOG artifacts were selected for the analysis. The signals were analyzed in the bands of 0.1-4 Hz, 4-8 Hz, 8-14 Hz, and 0.1-70 Hz using FFT, Intra-Class Correlation coeffi cients and coherence ratios.
The results showed a signifi cant variability of the amplitude and frequency of the epi-sodes of EOG activity simultaneous to EEG oscillations in various areas of the brain. The highest impact of EOG on the EEG record was observed in the frontotemporal region. The coherence ratios for signals recorded in the mediotemporal region was 0.56-0.67 (delta) and 0.8-0.95 (theta) compared to <0.99 in the frontal region. Simultaneous EOG oscillations and pseudoseizure-type EEG activity were observed in 3 records.

6 | 2014 | Volume 20 | Issue 2 | www.pjamp.com
Original Article
INTRODUCTION
Electroencephalography plays a very impor-tant role in qualifi cation of candidates for avia-tion-related professions as it facilitates detection of CNS reactivity and cognitive function disorders that cannot be detected even using the most advanced neuroimaging techniques. Electroen-cephalograpy was fi rst used in aviation medicine in the 1950s. [2,3,4,10,14,16,17]. Advances in the technique contributed to defi nition of stricter diagnostic criteria and thus to the increased rel-evance of the method.
One of the most important uses of EEG in avia-tion medicine is the screening for potential pre-dispositions to seizure activity and transient loss of consciousness in candidates for aviation jobs. These phenomena are considered exclusion crite-ria in the qualifi cation procedure. Diff erentiation of seizure activity and pseudoseizure activity in the EEG records of healthy subjects is one of the most important issues that still require more de-tailed studies [5,7,9,18,20,21,22].
In our studies, generalized paroxysmal activity (discharges) related only to short or long episodes of polymorphic activity of variable amplitude and frequency. In EEG, this type of activity is described as monorhythmic or mixed type and referred to as pseudoseizure activity. Episodes of paroxys-mal activity identifi ed as epileptogenic in origin, or featuring spikes, multispikes, sharp waves, and spike-and-wave complexes were not taken into account.
Our previous studies [18] revealed dissimilar characteristics of pseudseizure activity recorded in healthy subjects and seizure activity in epileptic
patients. Diff erences were also observed in pre-and post-stimulus activity patterns. This suggests that these activities were generated by diff erent mechanisms. The diffi culty in diff erentiation be-tween both types of activities is also due to the potential impact of extracerebral activity, e.g. EOG activity, on the EEG signal, which interferes with the analysis.
EEG signals are disturbed by signals classifi ed as either biological or technical artifacts, including heart activity, ocular movements, muscle activity or signals from the environment [5,8,11,15,19,23]. Both biological and technical artifacts are elimi-nated from the record by means of advanced processing methods. However, as opposed to technical artifacts, biological artifacts may be of certain importance and provide diagnostic infor-mation.
The eyeball movement signal is very important in polysomnographic examinations as an indica-tor of individual phases of sleep [1]. In standard EEG records, EOG activity may be of importance for the assessment of wakefulness and sleepiness. Eyelid fl utter observed in frontal leads may be as-sociated with intellectual activity. Despite the po-tential usefulness of these signals and their impact on the EEG record, they are usually eliminated us-ing automated EEG analysis methods [6,12,13,19].
The blinking refl ex is associated with retinal function. During adaptation to darkness, the rest-ing potential achieves the minimum value (“off ”) after several minutes. When the light is turned on, the potential increases (“on”) and subsequently falls as the retina adapts to the light level.
The characteristics of oscillations of bioelectrical activity in various regions of the brain correlated to EOG activity in records taken with subjects’ eyes open is diff erent than in records taken with subjects’ eyes being closed . The EEG records are indicative of a re-lationship between the central and peripheral neuronal mechanism of eye movements and the brain activity in various frequency bands. The results are suggestive of a potential impact of oculomotor activity on the recorded EEG oscillations. Therefore, interpreta-tion of generalized oscillation episodes in healthy subjects requires the analysis of the morphology and dynamics of oscillations as well as of the simultaneous EOG activity.
Diff erentiation of pseudoseizure and seizure episodes requires oculomotor activity being recorded using an extended protocol with eyes both open and closed in order to verify the impact of oculomotor activity on EEG records.
EEG, oculomotor activity, aviation medicine, VEOG, HEOGKeywords:
Discussion:
Conclusions:
© The Polish Journal of Aviation Medicine and Psychology 2014 | Volume 20 | Issue 2 | 7
J. Miszczak et al. - Analysis of relationship...
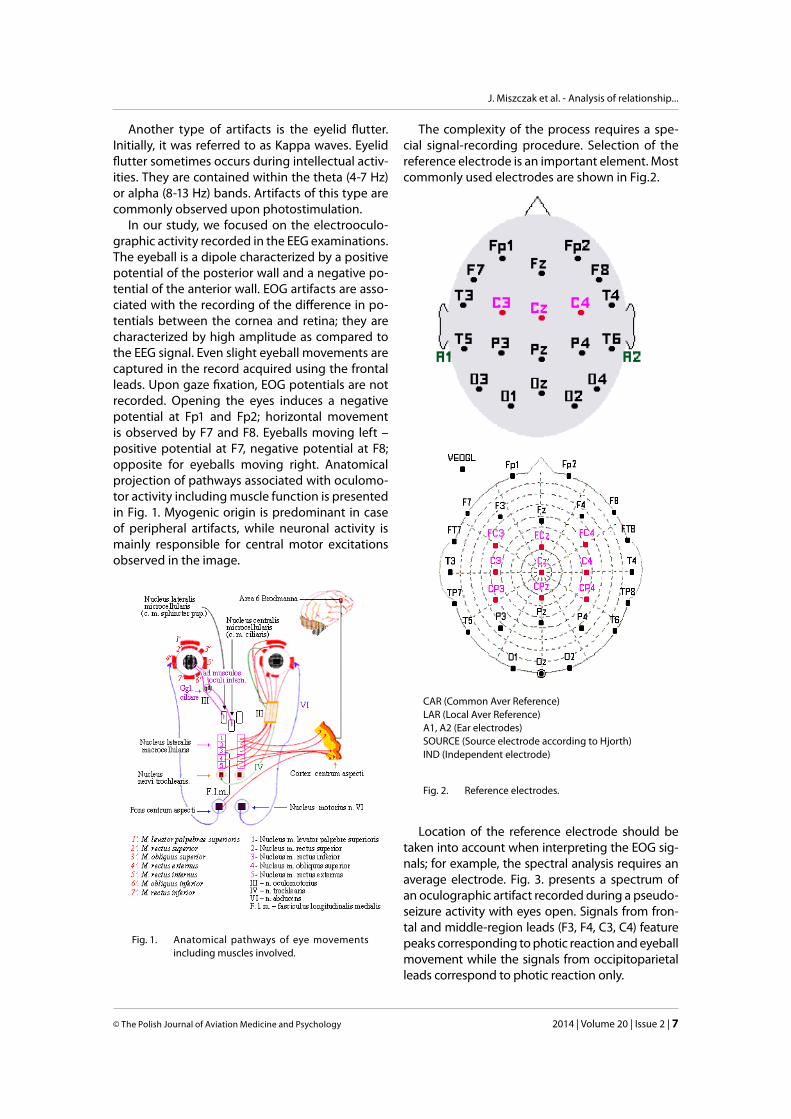
The complexity of the process requires a spe-cial signal-recording procedure. Selection of the reference electrode is an important element. Most commonly used electrodes are shown in Fig.2.
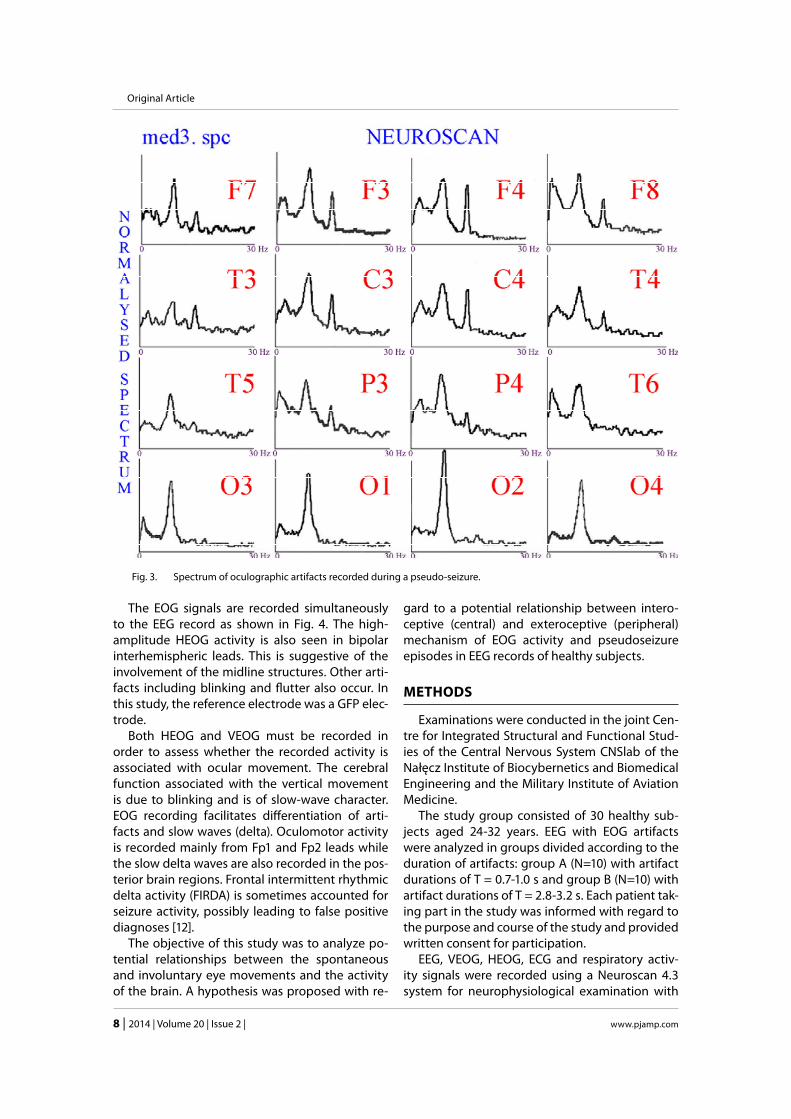
Location of the reference electrode should be taken into account when interpreting the EOG sig-nals; for example, the spectral analysis requires an average electrode. Fig. 3. presents a spectrum of an oculographic artifact recorded during a pseudo-seizure activity with eyes open. Signals from fron-tal and middle-region leads (F3, F4, C3, C4) feature peaks corresponding to photic reaction and eyeball movement while the signals from occipitoparietal leads correspond to photic reaction only.
Another type of artifacts is the eyelid fl utter. Initially, it was referred to as Kappa waves. Eyelid fl utter sometimes occurs during intellectual activ-ities. They are contained within the theta (4-7 Hz) or alpha (8-13 Hz) bands. Artifacts of this type are commonly observed upon photostimulation.
In our study, we focused on the electrooculo-graphic activity recorded in the EEG examinations. The eyeball is a dipole characterized by a positive potential of the posterior wall and a negative po-tential of the anterior wall. EOG artifacts are asso-ciated with the recording of the diff erence in po-tentials between the cornea and retina; they are characterized by high amplitude as compared to the EEG signal. Even slight eyeball movements are captured in the record acquired using the frontal leads. Upon gaze fi xation, EOG potentials are not recorded. Opening the eyes induces a negative potential at Fp1 and Fp2; horizontal movement is observed by F7 and F8. Eyeballs moving left – positive potential at F7, negative potential at F8; opposite for eyeballs moving right. Anatomical projection of pathways associated with oculomo-tor activity including muscle function is presented in Fig. 1. Myogenic origin is predominant in case of peripheral artifacts, while neuronal activity is mainly responsible for central motor excitations observed in the image.
Fig. 1. Anatomical pathways of eye movements including muscles involved.
Fig. 2. Reference electrodes.
CAR (Common Aver Reference)LAR (Local Aver Reference)A1, A2 (Ear electrodes)SOURCE (Source electrode according to Hjorth)IND (Independent electrode)
8 | 2014 | Volume 20 | Issue 2 | www.pjamp.com
Original Article
gard to a potential relationship between intero-ceptive (central) and exteroceptive (peripheral) mechanism of EOG activity and pseudoseizure episodes in EEG records of healthy subjects.
METHODS
Examinations were conducted in the joint Cen-tre for Integrated Structural and Functional Stud-ies of the Central Nervous System CNSlab of the Nałęcz Institute of Biocybernetics and Biomedical Engineering and the Military Institute of Aviation Medicine.
The study group consisted of 30 healthy sub-jects aged 24-32 years. EEG with EOG artifacts were analyzed in groups divided according to the duration of artifacts: group A (N=10) with artifact durations of T = 0.7-1.0 s and group B (N=10) with artifact durations of T = 2.8-3.2 s. Each patient tak-ing part in the study was informed with regard to the purpose and course of the study and provided written consent for participation.
EEG, VEOG, HEOG, ECG and respiratory activ-ity signals were recorded using a Neuroscan 4.3 system for neurophysiological examination with
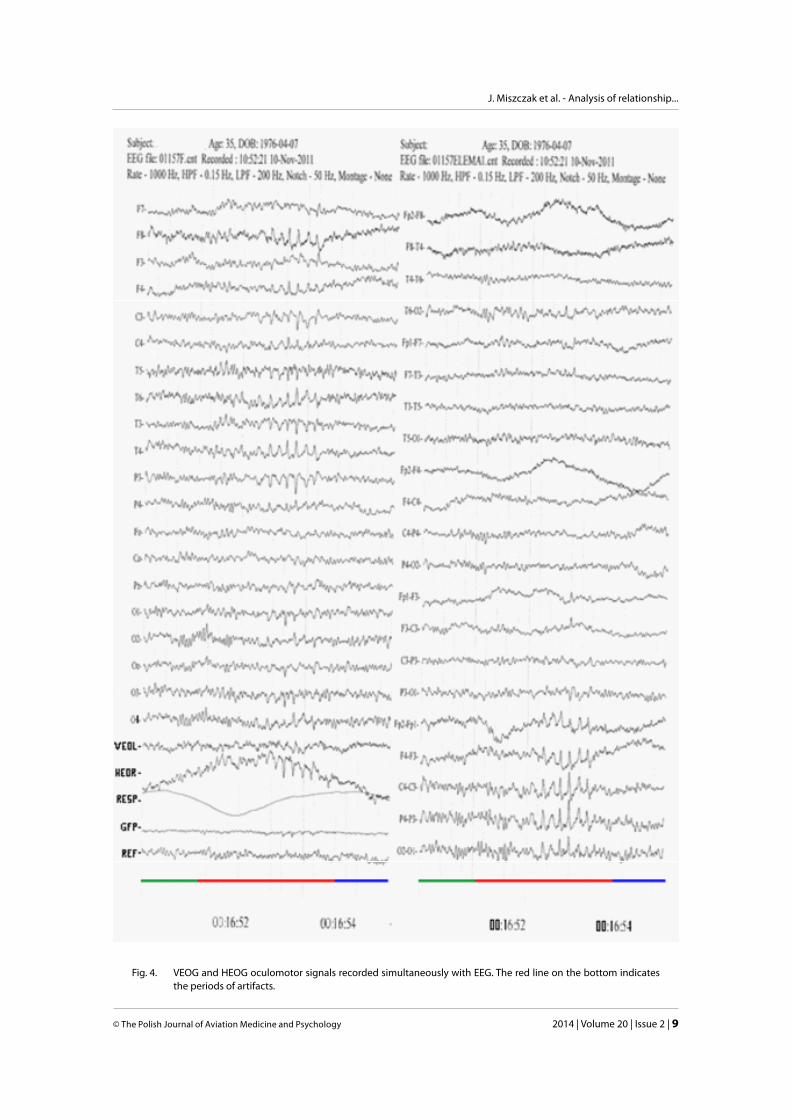
The EOG signals are recorded simultaneously to the EEG record as shown in Fig. 4. The high-amplitude HEOG activity is also seen in bipolar interhemispheric leads. This is suggestive of the involvement of the midline structures. Other arti-facts including blinking and fl utter also occur. In this study, the reference electrode was a GFP elec-trode.
Both HEOG and VEOG must be recorded in order to assess whether the recorded activity is associated with ocular movement. The cerebral function associated with the vertical movement is due to blinking and is of slow-wave character. EOG recording facilitates diff erentiation of arti-facts and slow waves (delta). Oculomotor activity is recorded mainly from Fp1 and Fp2 leads while the slow delta waves are also recorded in the pos-terior brain regions. Frontal intermittent rhythmic delta activity (FIRDA) is sometimes accounted for seizure activity, possibly leading to false positive diagnoses [12].
The objective of this study was to analyze po-tential relationships between the spontaneous and involuntary eye movements and the activity of the brain. A hypothesis was proposed with re-
Fig. 3. Spectrum of oculographic artifacts recorded during a pseudo-seizure.
© The Polish Journal of Aviation Medicine and Psychology 2014 | Volume 20 | Issue 2 | 9
J. Miszczak et al. - Analysis of relationship...
Fig. 4. VEOG and HEOG oculomotor signals recorded simultaneously with EEG. The red line on the bottom indicates the periods of artifacts.
10 | 2014 | Volume 20 | Issue 2 | www.pjamp.com
Original Article
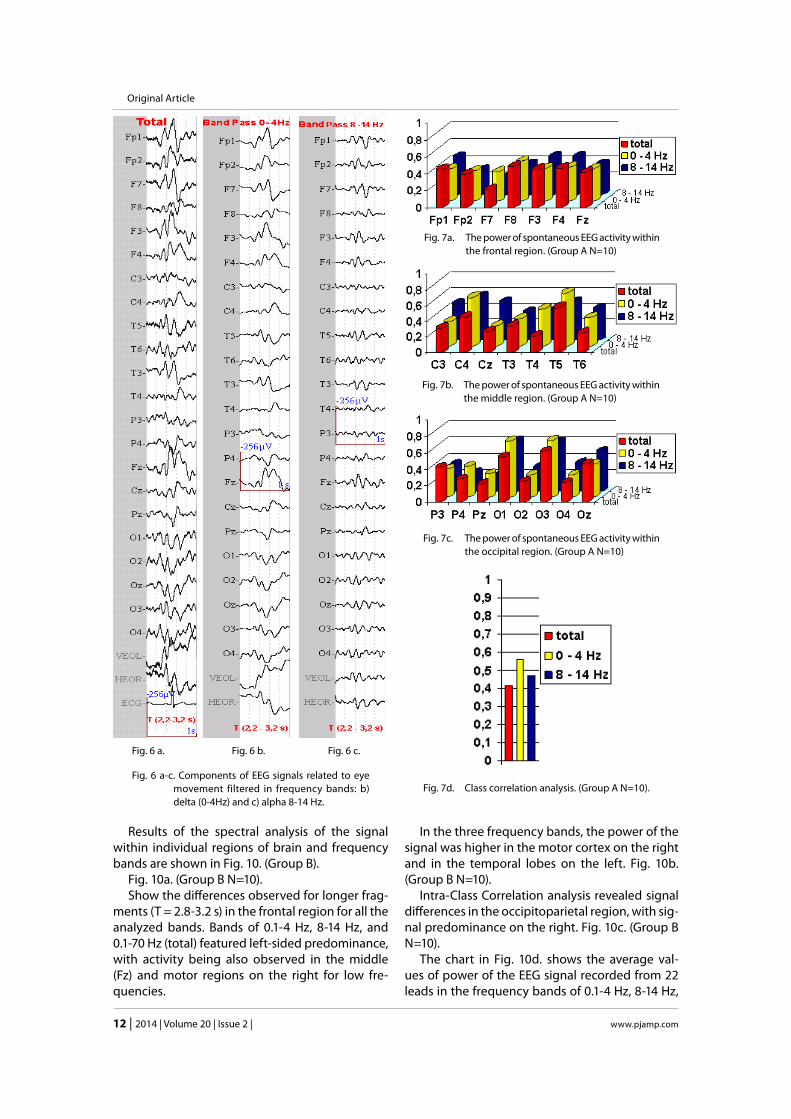
was ca. 50% lower than in the remaining regions. The power of the EEG signal in the (0.1-4 Hz) band in the frontal region of the left hemisphere is simi-lar to that in the remaining regions.
In the middle region (Fig. 7b.), asymmetry of EEG signal power (up to 50%) is observed in all fre-quency bands – predominance of right parietal re-gion and left posterotemporal region is observed during the short episode of oculographic activity.
In the occipital leads, the signal power is higher on the left. As shown by the results of the analysis, oculomotor activity is associated with left-sided lateralization of EEG activity
The chart in Fig. 7d. shows the average values of power of the EEG signal recorded from 22 leads in the frequency bands of 0.1-4 Hz, 8-14 Hz, and 0.1-70 Hz (total). The highest values of > 55% were observed in the 0.1-4 Hz band. For higher frequen-cies, the signal power (8-14 and 0.1-70 Hz) does not exceed 50%. The lowest values were measured for the 0.1-70 Hz band. The signifi cant diversity in av-erage signal power in the entire frequency band as well as in the individual bands may be due to the short duration of the recorded episode (T < 1 s) and to its presence in the frontal and middle region with a discrete predominance on the left. All subjects in the study group (N = 10) were right-handed (random selection).
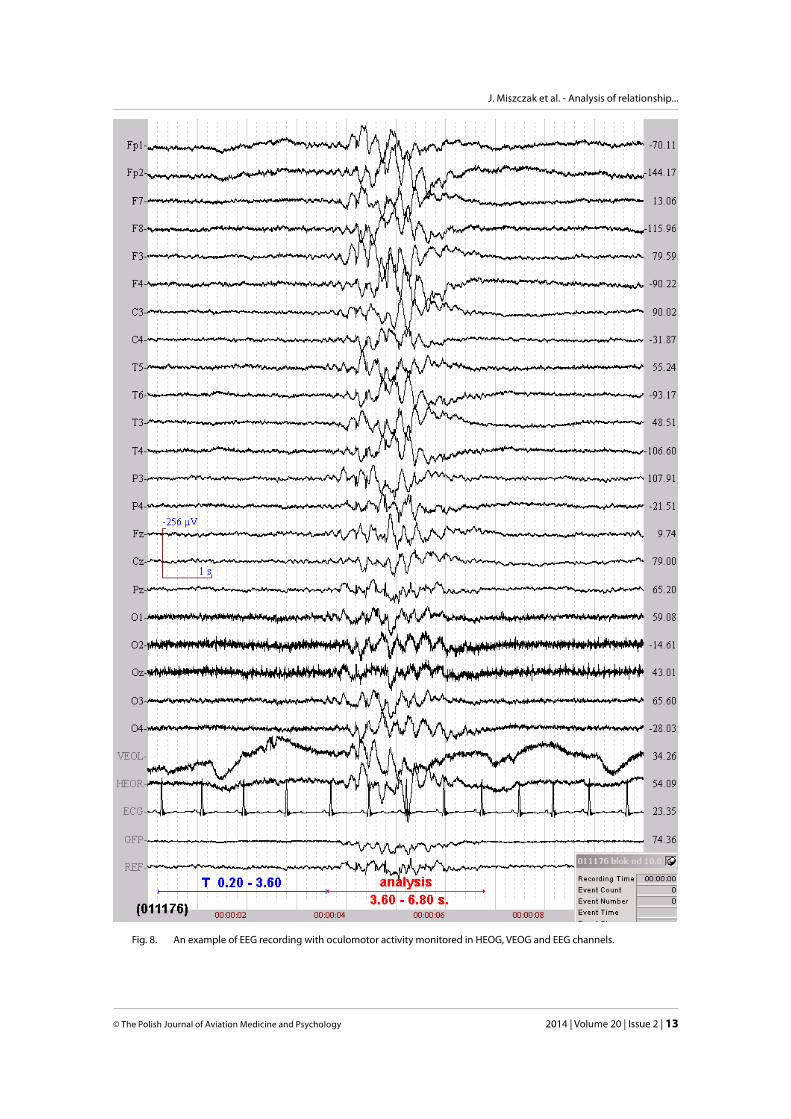
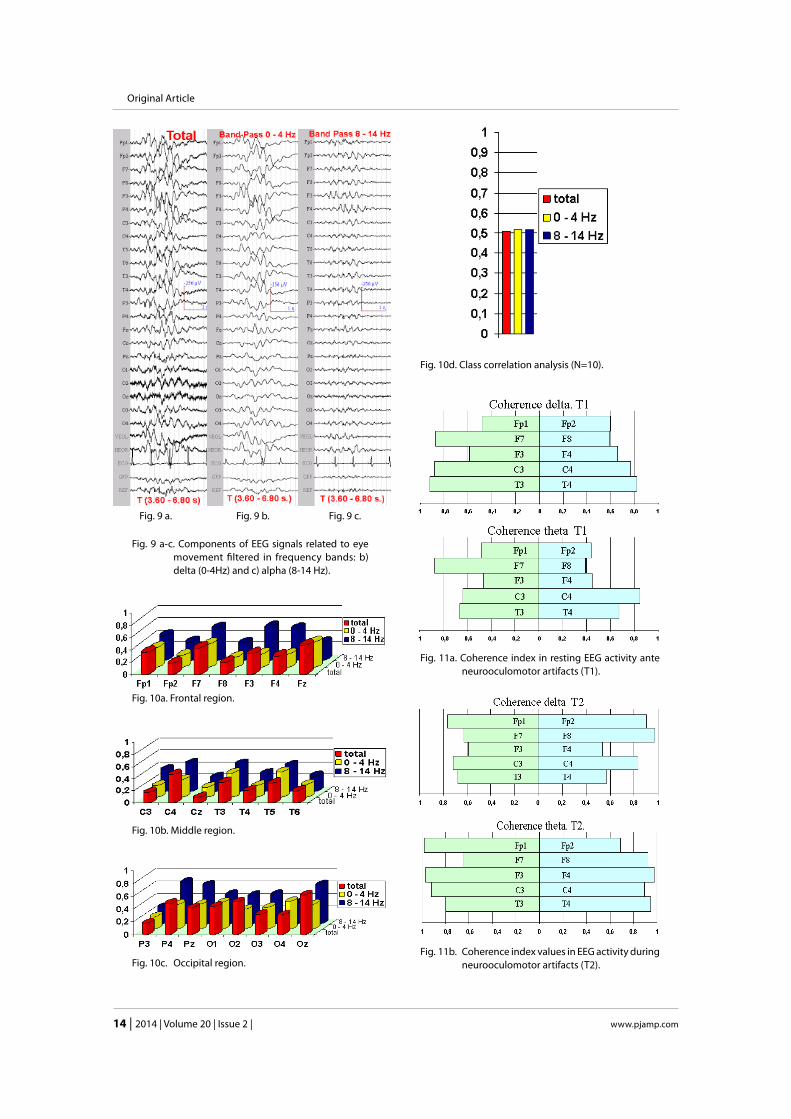
Fig. 8. (Group B) presents another type of ocu-lomotor activity with high-amplitude oscillations.
Marked in red is a fragment of the EEG record (T = 3.20 s) for spontaneous, biocular movements (blinking) selected for QEEG analysis. Marked in blue is a fragment of the resting (reference) pat-tern (T = 3.40 s) used for comparison with the ana-lyzed fragment.
Fig. 9. presents EEG components associated with oculomotor activity in various frequency bands: total (Fig. 9a.), range 0.1 to 4 Hz (Fig. 9v.), and 8 to 14 Hz (Fig. 9c.). Signal fi ltration revealed predominant activity in the delta band.
1 kHz sampling frequency and 16 bit amplitude resolution. The system was additionally equipped with a video-recording capability allowing pa-tients’ behavior being monitored during the ex-amination. The videorecording was synchronized with the EEG record.
EEG records were conducted while resting with eyes open. Recording fragments selected for the analysis featured oculomotor activity and a seg-ment preceding this activity as a reference signal. The selected fragments were fi ltered in the fre-quency bands of 0.1-4 Hz, 4-8 Hz, 8-12 Hz, 0.1-70 Hz, and analyzed by means of FFT analysis (groups A and B) as well as by means of Intra-Class Correla-tion coeffi cients (groups A and B) and coherence ratios (group B).
RESULTS
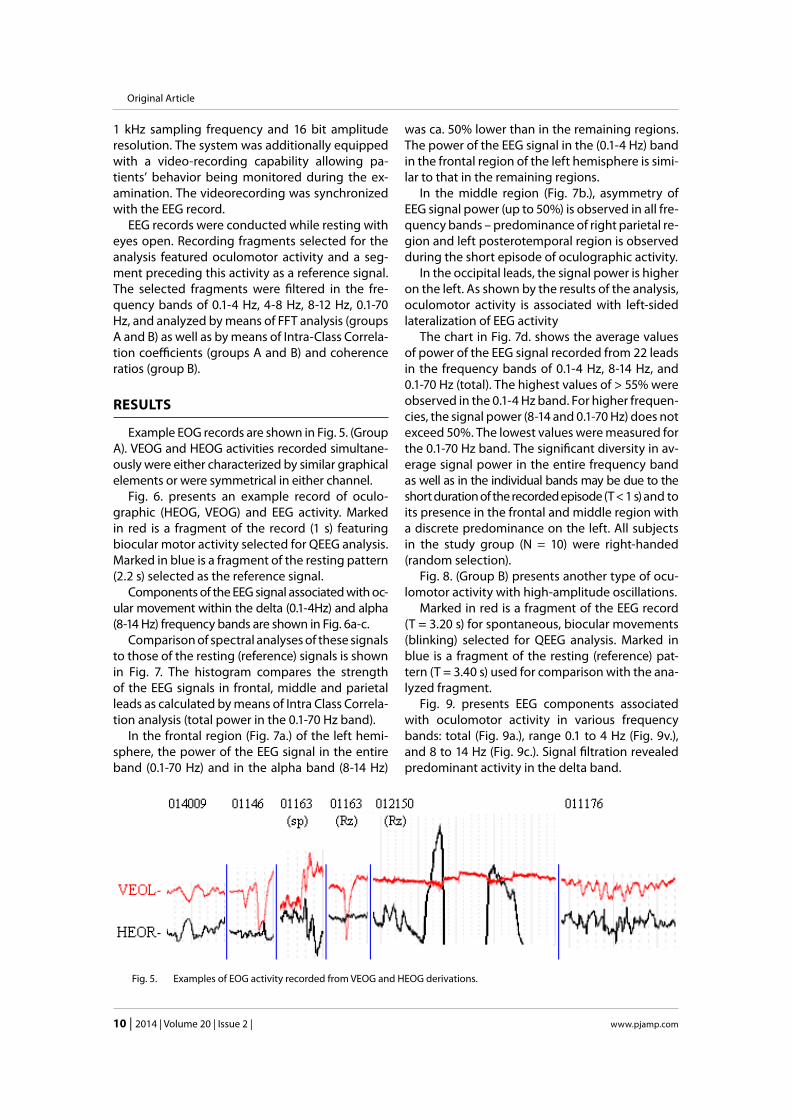
Example EOG records are shown in Fig. 5. (Group A). VEOG and HEOG activities recorded simultane-ously were either characterized by similar graphical elements or were symmetrical in either channel.
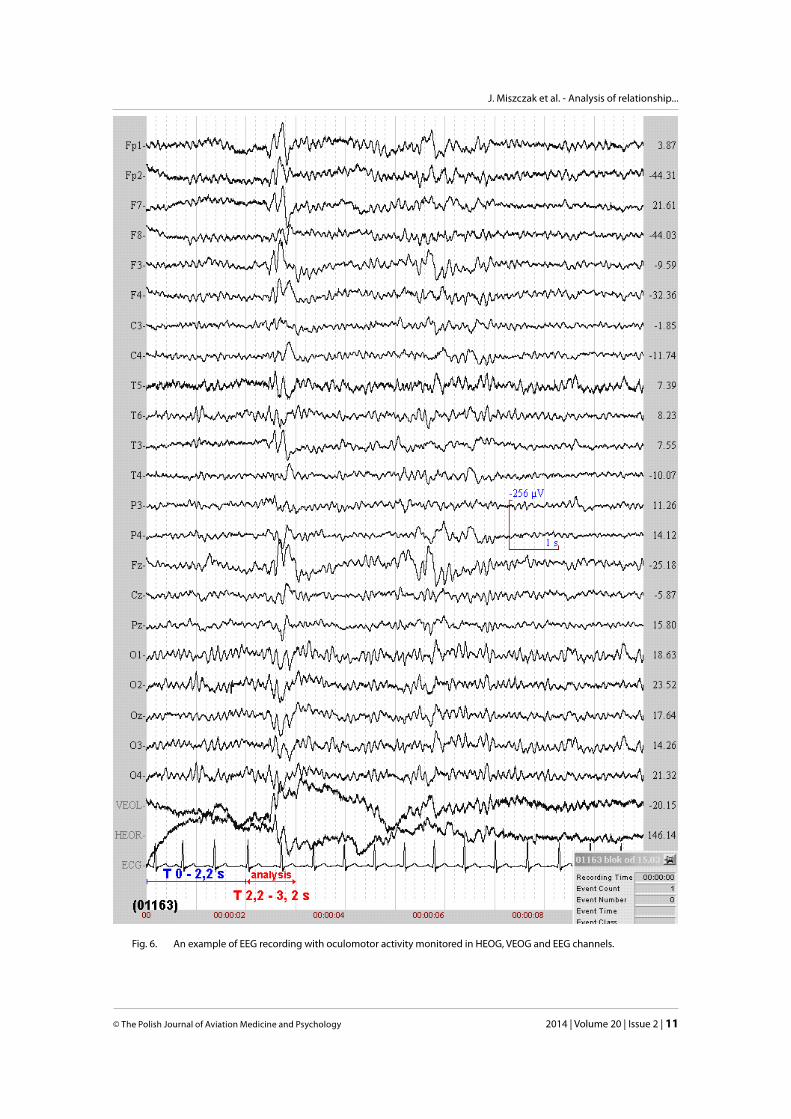
Fig. 6. presents an example record of oculo-graphic (HEOG, VEOG) and EEG activity. Marked in red is a fragment of the record (1 s) featuring biocular motor activity selected for QEEG analysis. Marked in blue is a fragment of the resting pattern (2.2 s) selected as the reference signal.
Components of the EEG signal associated with oc-ular movement within the delta (0.1-4Hz) and alpha (8-14 Hz) frequency bands are shown in Fig. 6a-c.
Comparison of spectral analyses of these signals to those of the resting (reference) signals is shown in Fig. 7. The histogram compares the strength of the EEG signals in frontal, middle and parietal leads as calculated by means of Intra Class Correla-tion analysis (total power in the 0.1-70 Hz band).
In the frontal region (Fig. 7a.) of the left hemi-sphere, the power of the EEG signal in the entire band (0.1-70 Hz) and in the alpha band (8-14 Hz)
Fig. 5. Examples of EOG activity recorded from VEOG and HEOG derivations.
© The Polish Journal of Aviation Medicine and Psychology 2014 | Volume 20 | Issue 2 | 11
J. Miszczak et al. - Analysis of relationship...
Fig. 6. An example of EEG recording with oculomotor activity monitored in HEOG, VEOG and EEG channels.
12 | 2014 | Volume 20 | Issue 2 | www.pjamp.com
Original Article
In the three frequency bands, the power of the signal was higher in the motor cortex on the right and in the temporal lobes on the left. Fig. 10b. (Group B N=10).
Intra-Class Correlation analysis revealed signal diff erences in the occipitoparietal region, with sig-nal predominance on the right. Fig. 10c. (Group B N=10).
The chart in Fig. 10d. shows the average val-ues of power of the EEG signal recorded from 22 leads in the frequency bands of 0.1-4 Hz, 8-14 Hz,
Results of the spectral analysis of the signal within individual regions of brain and frequency bands are shown in Fig. 10. (Group B).
Fig. 10a. (Group B N=10).Show the diff erences observed for longer frag-
ments (T = 2.8-3.2 s) in the frontal region for all the analyzed bands. Bands of 0.1-4 Hz, 8-14 Hz, and 0.1-70 Hz (total) featured left-sided predominance, with activity being also observed in the middle (Fz) and motor regions on the right for low fre-quencies.
Fig. 6 a-c. Components of EEG signals related to eye movement filtered in frequency bands: b) delta (0-4Hz) and c) alpha 8-14 Hz.
Fig. 6 a.
Fig. 7a. The power of spontaneous EEG activity within the frontal region. (Group A N=10)
Fig. 7b. The power of spontaneous EEG activity within the middle region. (Group A N=10)
Fig. 7c. The power of spontaneous EEG activity within the occipital region. (Group A N=10)
Fig. 7d. Class correlation analysis. (Group A N=10).
Fig. 6 b. Fig. 6 c.
© The Polish Journal of Aviation Medicine and Psychology 2014 | Volume 20 | Issue 2 | 13
J. Miszczak et al. - Analysis of relationship...
Fig. 8. An example of EEG recording with oculomotor activity monitored in HEOG, VEOG and EEG channels.
14 | 2014 | Volume 20 | Issue 2 | www.pjamp.com
Original Article
Fig. 9 a-c. Components of EEG signals related to eye movement fi ltered in frequency bands: b) delta (0-4Hz) and c) alpha (8-14 Hz).
Fig. 9 a.
Fig. 10a. Frontal region.
Fig. 10b. Middle region.
Fig. 10c. Occipital region.
Fig. 10d. Class correlation analysis (N=10).
Fig. 11a. Coherence index in resting EEG activity ante neurooculomotor artifacts (T1).
Fig. 11b. Coherence index values in EEG activity during neurooculomotor artifacts (T2).
Fig. 9 b. Fig. 9 c.
© The Polish Journal of Aviation Medicine and Psychology 2014 | Volume 20 | Issue 2 | 15
J. Miszczak et al. - Analysis of relationship...
lomotor activity and the electrical activity of the brain [5]. In previous studies, we pointed to the diff erences in EOG signal morphology for sponta-neous ocular movements recorded with eyes be-ing shut and open.
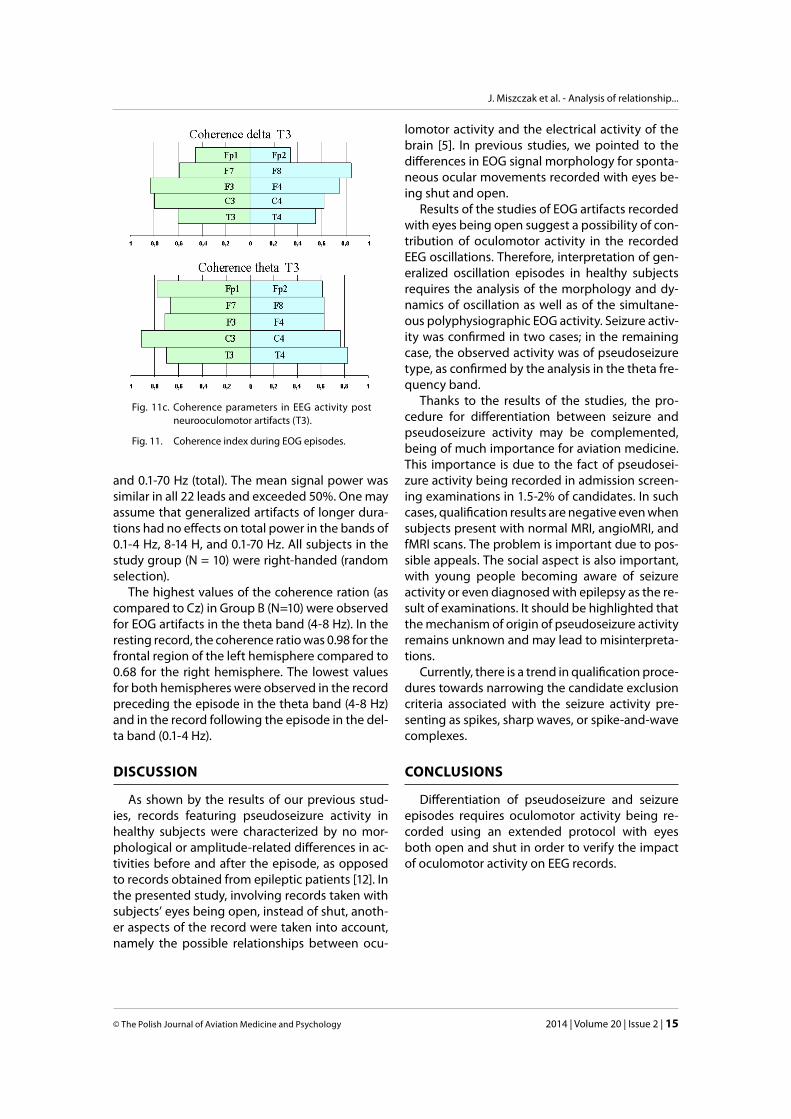
Results of the studies of EOG artifacts recorded with eyes being open suggest a possibility of con-tribution of oculomotor activity in the recorded EEG oscillations. Therefore, interpretation of gen-eralized oscillation episodes in healthy subjects requires the analysis of the morphology and dy-namics of oscillation as well as of the simultane-ous polyphysiographic EOG activity. Seizure activ-ity was confi rmed in two cases; in the remaining case, the observed activity was of pseudoseizure type, as confi rmed by the analysis in the theta fre-quency band.
Thanks to the results of the studies, the pro-cedure for diff erentiation between seizure and pseudoseizure activity may be complemented, being of much importance for aviation medicine. This importance is due to the fact of pseudosei-zure activity being recorded in admission screen-ing examinations in 1.5-2% of candidates. In such cases, qualifi cation results are negative even when subjects present with normal MRI, angioMRI, and fMRI scans. The problem is important due to pos-sible appeals. The social aspect is also important, with young people becoming aware of seizure activity or even diagnosed with epilepsy as the re-sult of examinations. It should be highlighted that the mechanism of origin of pseudoseizure activity remains unknown and may lead to misinterpreta-tions.
Currently, there is a trend in qualifi cation proce-dures towards narrowing the candidate exclusion criteria associated with the seizure activity pre-senting as spikes, sharp waves, or spike-and-wave complexes.
CONCLUSIONS
Diff erentiation of pseudoseizure and seizure episodes requires oculomotor activity being re-corded using an extended protocol with eyes both open and shut in order to verify the impact of oculomotor activity on EEG records.
and 0.1-70 Hz (total). The mean signal power was similar in all 22 leads and exceeded 50%. One may assume that generalized artifacts of longer dura-tions had no eff ects on total power in the bands of 0.1-4 Hz, 8-14 H, and 0.1-70 Hz. All subjects in the study group (N = 10) were right-handed (random selection).
The highest values of the coherence ration (as compared to Cz) in Group B (N=10) were observed for EOG artifacts in the theta band (4-8 Hz). In the resting record, the coherence ratio was 0.98 for the frontal region of the left hemisphere compared to 0.68 for the right hemisphere. The lowest values for both hemispheres were observed in the record preceding the episode in the theta band (4-8 Hz) and in the record following the episode in the del-ta band (0.1-4 Hz).
DISCUSSION
As shown by the results of our previous stud-ies, records featuring pseudoseizure activity in healthy subjects were characterized by no mor-phological or amplitude-related diff erences in ac-tivities before and after the episode, as opposed to records obtained from epileptic patients [12]. In the presented study, involving records taken with subjects’ eyes being open, instead of shut, anoth-er aspects of the record were taken into account, namely the possible relationships between ocu-
Fig. 11c. Coherence parameters in EEG activity post neurooculomotor artifacts (T3).
Fig. 11. Coherence index during EOG episodes.

16 | 2014 | Volume 20 | Issue 2 | www.pjamp.com
Original Article
REFERENCES
Anderer P, Roberts S, Schlögl A, Gruber G, Klösch G, Herrmann W, Rappelsberger P, Filz O, Barbanoj MJ, Dorffner G, Saletu 1. B. Artifact processing in computerized analysis of sleep EEG – a review. Neuropsychobiology 1999; 40:150-7.
Bennett DR, Duvoisin RC. The EEG in Aerospace Medicine. Aerosp Med. 1964; 35:452-8.2.
Blanc C, Lafontaine E, Laplane R. Meaning and Value of Electroencephalography in Aeronautical Medicine. Aerosp Med. 3. 1964; 35:249-56.
Blanc C, Lafontaine E, Laplane R. Principles and methods of application of electroencephalography in aviation medicine. 4. Aerosp Med. 1964; 35:1083-8.
Brown M, Marmor M, Vaegan, Zrenner E, Brigell M, Bach M, ISCEV. ISCEV Standard for Clinical Electro-oculography (EOG). 5. Doc Ophthalmol. 2006 ;113(3):205-12.
Croft RJ, Barry RJ. Removal of ocular artifact from the EEG: a review. Clin Neurophysiol 2000; 30(1):5-19.6.
De Clerq W, Vergult A, Vanrumste B, Van Paesschen W, Van Huffel S. Canonical correlation analysis applied to remove muscle 7. artifacts from the electroencephalogram. IEEE Trans. Biomed. Eng. 2006; 53(12):2583-7.
Dec S, Miszczak J, Zalewska E. Metody weryfi kacji padaczkopodobnych zmian w EEG u zdrowych klinicznie pilotów. Polski 8. Przegląd Medycyny Lotniczej 2003; (3):307-27.
Dec S, Miszczak J, Zalewska E. Rola badań elektroencefalografi cznych w przygotowaniu zawodowym pilota. Polski Przegląd 9. Medycyny Lotniczej 1998; 4(3):327-43.
Gregory RP, Oates T, Merry RT. Electroencephalogram epileptiform abnormalities in candidates for aircrew training. Electro-10. encephalogr Clin Neurophysiol. 1993; 86(1):75-7.
Hendriksen IJ, Elderson A. The use of EEG in aircrew selection. Aviat Space Environ Med. 2001; 72(11):1025-33.11.
Joe-Air Jiang, Chih-Feng Chao, Ming-Jang Chiu, Ren-Guey Lee, Chwan-Lu Tseng, Robert Lin. An automatic analysis method 12. for detecting and eliminating ECG artifacts in EEG. Computers in Biology and Medicine 2007; 37(11):1660-71.
Joyce CA, Gorodnitsky IF, Kutas M. Automatic removal of eye movement and blink artifacts from EEG data using blind com-13. ponent separation. Psychophysiology 2004; 41(2):313-25.
Kowalczyk L. Badanie dynamiki aktywności bioelektrycznej mózgu w warunkach stymulacji z zastosowaniem metod oceny 14. podobieństwa sygnałów. Tezy pracy doktorskiej. Warszawa: IBIB PAN; 2006.
Leigh JR, Zee DS. The neurology of eye movements. 4th ed. New York (NY): Oxford University Press; 2006. 15.
Matsuo F, Peters JF, Reilly EL. Electrical phenomena associated with movements of the eyelid. Electroenceph Clin Neurophy-16. siol, 1975; 38(5):507-511.
Miszczak J, Dec S, Zalewska E. Signifi cance of EEG variability during suppression reaction for interpretation of EEG performer 17. in pilots with open eyes during activities. Polski Przegląd Medycyny Lotniczej 2011; 17(2):145-176.
Miszczak J, Zalewska E, Dec S, Kowalczyk L. Badania porównawcze charakterystyki epizodów czynności napadowej rejestro-18. wanych w zapisach EEG klinicznie zdrowych kandydatów do lotnictwa i osób chorych na padaczkę. Polski Przegląd Medycyny Lotniczej, 2010; 16(2):113-129.
Picton TW, von Roon P, Armillo ML, Berg P, Ille N, Scherg M. The correction of ocular artifacts: a topographic perspective. Clin 19. Neurophysiol 2000; 111(1):53-65.
Sobieszek A. Problemy identyfi kacji i kwalifi kacji zjawisk o charakterze napadowym występujących we wzorze czynności 20. bioelektrycznej ośrodkowego układu nerwowego. Przegląd Lekarski 2010; 67(9): 745-49.
Sobieszek A. Wzory zapisu EEG o charakterze napadowym. Postępy Nauk Medycznych vol. XXVI 2013; 10:683-90.21.
Stone J, Campbell K, Sharma N, Carson A, Warlow CP, Sharpe M. What should we call pseudoseizures? The patient’s per-22. spective. Seizure 2003; 12(8):568-72.
van Vugt MK, Sederberg PB, Kahana MJ. Comparison of spectral analysis methods for characterizing brain oscillations. J Neurosci 23. Methods. 2007 15;162(1-2):49-63.
Cite this article as: Miszczak J, Dec S, Zalewska E. Analysis of Relationship Between Oculomotor and Pseudoseizure Activity in EEG
Examinations of Aviation Personnel. Pol J Aviat Med Psychol 2014; 20(2):5-16. DOI: 10.13174/pjamp.20.02.2014.1
AUTHORS’ DECLARATION:
Study Design: Jan Miszczak, Stanisław Dec, Ewa Zalewska; Data Collection: Jan Miszczak, Stani-sław Dec, Ewa Zalewska; Statistical Analysis: Jan Miszczak, Stanisław Dec, Ewa Zalewska; Manuscript
Preparation: Jan Miszczak, Stanisław Dec, Ewa Zalewska; Funds Collection: Jan Miszczak, Stanisław Dec, Ewa Zalewska. The Authors declare that there is no confl ict of interest.