Analysis of Power Dynamics and Livelihood Assets in...
11
International Journal of Natural Resource Ecology and Management 2016; 1(3): 88-98 http://www.sciencepublishinggroup.com/j/ijnrem doi: 10.11648/j.ijnrem.20160103.14 Analysis of Power Dynamics and Livelihood Assets in Participatory Forest Management: Experience from Bangladesh K. K. Islam 1, 2, * , Masakazu Tani 3 , Kazuo Asahiro 3 , M. Zulfikar Rahman 4 , Kimihiko Hyakumura 5 , Takahiro Fujiwara 5 , Noriko Sato 2 1 Department of Agroforestry, Bangladesh Agricultural University, Mymensingh City, Bangladesh 2 Forest Policy laboratory, Faculty of Agriculture, Kyushu University, Fukuoka City, Japan 3 Department of Environmental Design, Faculty of Design, Kyushu University, Fukuoka City, Japan 4 Department of Agricultural Extension Education, Bangladesh Agricultural University, Mymensingh City, Bangladesh 5 Institute of Tropical Agriculture, Kyushu University, Fukuoka City, Japan Email address: [email protected] (K. K. Islam) * Corresponding author To cite this article: K. K. Islam, Masakazu Tani, Kazuo Asahiro, M. Zulfikar Rahman, Kimihiko Hyakumura, Takahiro Fujiwara, Noriko Sato. Analysis of Power Dynamics and Livelihood Assets in Participatory Forest Management: Experience from Bangladesh. International Journal of Natural Resource Ecology and Management. Vol. 1, No. 3, 2016, pp. 88-98. doi: 10.11648/j.ijnrem.20160103.14 Received: July 13, 2016; Accepted: July 25, 2016; Published: August 10, 2016 Abstract: Participatory forestry (PF) plays a significant role to involve local communities and different actors in resources management and livelihood improvements. However, the power of important actors to misuse the PF for their self-interest has been stated as a key obstacle to success. Hence, this study seeks to identify the most powerful actors and the extent to which they affect PF decision- making and also to measure and evaluate the livelihood assets of participants. Empirical data were collected from Madhupur and Teknaf PF sites of Bangladesh during the different time intervals. The actors’ power analysis found out that the forest administration evidenced itself as the most powerful and influential actors in PF. In the case of livelihood analysis, the overall results indicated that the total value of PF members’ livelihood assets were 0.82 and 0.75 for Madhupur and Teknaf study sites. Livelihood asset conditions were significantly different between the PF members’ and non-members’ (0.65 and 0.62 for non-members’). However, the development of social and financial assets did not reveal a notable increase considering natural, physical and human assets. Therefore, it is very important to pay more attention to accelerate social and financial assets through intensive training, establishing conflicts resolution mechanism and adopting proper tree-crop technologies, and also provide alternative livelihood approaches to the forest dependent people. In addition, there is an immediate need to empower local PF members, by which the general members play the central role in decision making and governing all of their development activities. Keywords: Actor, Power, Participatory Forestry, Livelihood Assets, Bangladesh 1. Introduction In recent decades, there has been growing recognition internationally of the shift in forests resource management away from top-down, traditional management towards a participatory approach, which integrates local communities and all stakeholders in decision-making [1, 2]. Many countries have already developed or are in the process of developing changes to state laws and policies, which institutionalize PF management approaches. However, the experiences of PF throughout the world have revealed that although decentralization and devolution policies yield benefits for local people, in reality there are also lots of limiting factors [2, 3, 4]. The PF is characterized by many stakeholders due to the economic, ecological and social functions and values that forests delivers. Besides the local communities, other groups at regional, national and international levels also have an impact on local communities/peoples’ access to forests [5].
Transcript of Analysis of Power Dynamics and Livelihood Assets in...

International Journal of Natural Resource Ecology and Management 2016; 1(3): 88-98
http://www.sciencepublishinggroup.com/j/ijnrem
doi: 10.11648/j.ijnrem.20160103.14
Analysis of Power Dynamics and Livelihood Assets in Participatory Forest Management: Experience from Bangladesh
K. K. Islam1, 2, *
, Masakazu Tani3, Kazuo Asahiro
3, M. Zulfikar Rahman
4, Kimihiko Hyakumura
5,
Takahiro Fujiwara5, Noriko Sato
2
1Department of Agroforestry, Bangladesh Agricultural University, Mymensingh City, Bangladesh 2Forest Policy laboratory, Faculty of Agriculture, Kyushu University, Fukuoka City, Japan 3Department of Environmental Design, Faculty of Design, Kyushu University, Fukuoka City, Japan 4Department of Agricultural Extension Education, Bangladesh Agricultural University, Mymensingh City, Bangladesh 5Institute of Tropical Agriculture, Kyushu University, Fukuoka City, Japan
Email address: [email protected] (K. K. Islam) *Corresponding author
To cite this article: K. K. Islam, Masakazu Tani, Kazuo Asahiro, M. Zulfikar Rahman, Kimihiko Hyakumura, Takahiro Fujiwara, Noriko Sato. Analysis of Power
Dynamics and Livelihood Assets in Participatory Forest Management: Experience from Bangladesh. International Journal of Natural
Resource Ecology and Management. Vol. 1, No. 3, 2016, pp. 88-98. doi: 10.11648/j.ijnrem.20160103.14
Received: July 13, 2016; Accepted: July 25, 2016; Published: August 10, 2016
Abstract: Participatory forestry (PF) plays a significant role to involve local communities and different actors in resources
management and livelihood improvements. However, the power of important actors to misuse the PF for their self-interest has
been stated as a key obstacle to success. Hence, this study seeks to identify the most powerful actors and the extent to which they
affect PF decision- making and also to measure and evaluate the livelihood assets of participants. Empirical data were collected
from Madhupur and Teknaf PF sites of Bangladesh during the different time intervals. The actors’ power analysis found out that
the forest administration evidenced itself as the most powerful and influential actors in PF. In the case of livelihood analysis, the
overall results indicated that the total value of PF members’ livelihood assets were 0.82 and 0.75 for Madhupur and Teknaf study
sites. Livelihood asset conditions were significantly different between the PF members’ and non-members’ (0.65 and 0.62 for
non-members’). However, the development of social and financial assets did not reveal a notable increase considering natural,
physical and human assets. Therefore, it is very important to pay more attention to accelerate social and financial assets through
intensive training, establishing conflicts resolution mechanism and adopting proper tree-crop technologies, and also provide
alternative livelihood approaches to the forest dependent people. In addition, there is an immediate need to empower local PF
members, by which the general members play the central role in decision making and governing all of their development
activities.
Keywords: Actor, Power, Participatory Forestry, Livelihood Assets, Bangladesh
1. Introduction
In recent decades, there has been growing recognition
internationally of the shift in forests resource management
away from top-down, traditional management towards a
participatory approach, which integrates local communities
and all stakeholders in decision-making [1, 2]. Many countries
have already developed or are in the process of developing
changes to state laws and policies, which institutionalize PF
management approaches. However, the experiences of PF
throughout the world have revealed that although
decentralization and devolution policies yield benefits for local
people, in reality there are also lots of limiting factors [2, 3, 4].
The PF is characterized by many stakeholders due to the
economic, ecological and social functions and values that
forests delivers. Besides the local communities, other groups
at regional, national and international levels also have an
impact on local communities/peoples’ access to forests [5].

International Journal of Natural Resource Ecology and Management 2016; 1(3): 88-98 89
Theoretically four broad stakeholders are involved in forestry:
the state, the local community, the private sector and the
donors [6, 7]. All four stakeholders are important in forest
management, and their cooperation is needed for sustainable
forest management; often the state showed the most dominant
and strongest role over other stakeholders [8, 9, 10].
In Bangladesh, PF management started in 1980s with the
funding of donor agencies [11]. Till then PF was a government
controlled and donor funded project in Bangladesh [3]. It has
also had a political in nature due to its contestant type of
access and control over forests in social and power relations.
Bangladesh forests ecosystems, which are composed of the
hill, sal and mangrove forests, display a great richness and
diversity of culture and people, geographical features and
biodiversity. PF covered both hill and sal forests while
mangrove forests are restricted as a world heritage site.
Forests management approaches in these forests have created
great diversity in the social relations and interests among the
actors. Therefore, the PF initiated an emblematic struggle
between the diverse kind of actors in terms of dominance and
power relations. Nevertheless, power has played a
progressively important role in forest policy analysis since the
implementation of PF programs in Bangladesh. It looks at PF
from the perspective of local communities and main actors
who use the forests in different ways for a wide variety of
reasons [3, 9, 12, 13]. So, there is an immediate need to
pinpoint the key issues relating to power, interests and
outcomes in PF activities and their influence on the policy
cycle in Bangladesh.
In developing countries, many forest resource management
activities have been undertaken with the hope that they will
simultaneously address the problem of the decline rural
livelihoods and resources degradation [3, 14, 15]. The
majority of the forest management regimes have tended to
focus more on conservation than on helping to sustain local
livelihoods. Conversely, PF is a better approach in forest
management that has been applied to sustain livelihood and
forest conservation. It is a people oriented, community based,
resource focused and partnership based management approach,
it is best to focus on the community and emphasize positive
cooperation of different stakeholders in livelihood
improvement and resource management [16, 17]. From a
literature review, it is clear that PF does have the potential to
contribute positively to the betterment of rural livelihoods and
poverty alleviation [1, 18, 19] Similarly, the success of PF
throughout the world has revealed that decentralization and
devolution of power among the PF actors often yield benefits
to local participants [2, 20]. So, there is an enormous
relationship between the actors’ power and livelihood
development in PF.
Livelihood analysis, particularly in a quantitative aspect, is
a critical task because most scientists focus on qualitative
analysis of livelihoods. Moreover, how to analyze changes in
livelihood assets under the impact of PF is another challenge.
Within the context of Bangladesh, these challenges are really
immense due to the lack of previous research and reliable data.
Therefore, the study first seeks to identify the most powerful
actors and the extent to which they affect PF decision-making
and secondly, to measure and evaluate the livelihood assets of
participants in the process of involvement in PF programs.
These two objectives will outline a series of questions. Who
are the participating actors and of them, who are the most
powerful actors? How do we measure livelihood assets
pentagon in the study areas? How changes in livelihood assets
should be measured on a temporal scale? And how should
livelihood assets be improved in the future in terms of data the
study obtained from different indicators?
Theoretical Frameworks
Power in general refers to the ‘ability to impose one’s will
or advance one’s own interest” [adopted from 21]. It is also
anticipated that participation can overcome power imbalance
by involving all actors in a process that meets their interests,
and this study addresses the issue that power may alter the
outcome of participation behavior. Maryudi (2011) defines
actor-centered power as ‘a social relationship in which the
actor ‘A’ alters the behavior of actor ‘B’ without recognizing
B’s will’. Actor-centered power influences participatory forest
management in aspects of the most powerful actors and their
diversified interests. The research for this study, therefore,
relies on Webber’s (1964) theory on power against resistance
(coercion and incentives) with a new dimension of power
without resistance (trust) [22]; so power is clearly composed
of coercion, incentives and trust elements. According to
Webber (1964) acts of resistance could bring light power
resting within social relations, and the resistance could be
broken forcefully through coercion or softly by incentives. In
addition to Webber’s thinking, there is the possibility that
power relation can be present without resistance, i.e. ‘trust’.
So, the study’s elements of actor-centered power consist of
coercion, incentives and trust [22, 23]. Simply, trust is a power
element through which the subordinate changes his behavior
by accepting the potentate’s information [9]. Power is
exercised by use of information. The practice whereby an
individual or a group of people are forced by a different party
to involuntarily behave in a certain manner is coercion. This is
made possible by either action or inaction [24]. However,
incentives are financial or non-financial factors that alternate a
subordinate’s behavior by motivation. Here motivation is the
initiation of goal-oriented attitude and also the expectation of
benefits that encourages people to change their behavior. So,
the actor-centered power conception is regarded as more
useful for the analysis of power in the case of forest
management and policy issues.
A livelihood is comprised of the capabilities, various assets,
strategies, activities and various factors required for a means
of living [25]. A livelihood is sustainable when it copes with
and recovers from stress and shocks, maintains or enhances its
capabilities and assets, while not undermining the natural
resource base [25]. A number of institutes (e.g. CARE, IISD,
DFID) have been developing the Sustainable Livelihood
Analysis (SLA) approach, and SLA’s definition is based on the
ability of a social unit to improve its assets under outside
impacts [26]. SLA framework looks at the basic dynamics of
livelihoods and how people are represented on a set of assets

90 K. K. Islam et al.: Analysis of Power Dynamics and Livelihood Assets in Participatory Forest
Management: Experience from Bangladesh
as a basis for their livelihoods [27, 28]. So, SLA first looks to
identify important assets, such as physical, human, social,
natural and financial aspects related to livelihood. This study
has focused on DFID’s SLA framework in which the assets are
represented as human capital (knowledge, skill, labor, good
health), physical capital (infrastructure, transport, shelter and
communication), social capital (relationship of trust and
reciprocity, networks and membership of groups), natural
capital (land, forests, water, wildlife and biodiversity) and
financial capital (monetary resources- savings, credit and
remittances). Improvements of the five livelihood assets could
be termed as strong SLA, whereas improvement in only some
of the assets that compensate for any decline in other assets
could be termed as weak or poor SLA [29]. Participatory
forest management is people oriented, community based,
resource focused and a partnership-based resources model,
which focuses on community and emphasizes natural resource
management and livelihood development [16, 30]. Therefore,
the study has attempted to measure the livelihood assets of
participating people influenced by participatory forest
management programs in the study areas.
2. Methodology
2.1. Study Area
In Bangladesh, the moist deciduous Sal forests and tropical
evergreen and semi-evergreen forests cover an area of 120,000
ha and 670,000 ha respectively, and these forests are owned by
the Bangladesh Forest Department [3, 31]. Sal forests are
distributed over the relatively drier central and north-western
part of the country consisting of mainly Tangail, Mymensingh,
Gazipur and Dhaka districts. The majority of the Bangladesh
Sal forests are located at the Tangail and Mymensing districts,
which is called Madhupur Sal forests and considered one of
the most successful PF programs in Bangladesh [3, 32]. The
tropical evergreen and semi-evergreen forests are extended
over the southern part of the country, consisting of Chittagong,
Cox’z Bazar, Chittagong Hill Tracts and Sylhet districts. The
study was conducted at the Madhupur Sal forests and Teknaf
(also a potential PF site) under the Cox’z Bazar tropical
evergreen and semi-evergreen forests area (Figure 1).
Figure 1. Forests cover map of Bangladesh showing study area.
2.2. Description of the Participatory Forestry Program
The criteria, rules and regulations are similar for all
participatory forestry (also called Social Forestry) programs in
Bangladesh. In this program, each member was allocated 1 ha
of degraded forest land for a PF plantation duration of 10 year
rotation cycle. Each farmer can continue up to three rotation
cycles (30 years) if he/she maintains the PF criteria properly.
The fast growing firewood tree species (e.g. Acacia

International Journal of Natural Resource Ecology and Management 2016; 1(3): 88-98 91
auriculiformis) was selected for plantation with a space of
2m×2m (total 2500 tree/ha) (Figure 2). After 4 years, 50% of
the standing trees were thinned out (1st thinning), and this
technique was repeated after 7 years (2nd
thinning). The
remaining 625 (approximately) trees were finally harvested at
the end of the 10-year cycle. The FD and members shared the
benefit of the 2nd
thinning and final tree harvest outputs at a
ratio of 45%:45%, and the remaining 10% benefit will store
for the next rotation tree plantations which is called (Tree
Farming Fund = TFF). The member could grow annual crops
in association with trees at any time of the 10-year rotation
cycle, and the crops together with 1st thinning benefits were
granted solely to the member. These types of people-oriented
programs gained popularity all over the Bangladesh.
Figure 2. Participatory forestry programs at the study area.
2.3. Data Collection
This study collected both quantitative and qualitative data,
and quantitative data were collected through a semi-structure
questionnaire survey. For qualitative data this study used
discussion with FD staff, local people, focus group discussion,
personal observation and literature review. Participatory
forestry programs were mainly implemented with the active
guidance of forest Beat offices (lowest FD administrative
office) and Madhupur Sal forests consisting of 12 Beat offices
in which participatory forestry programs were executed under
10 Beat offices. Teknaf forests consist of 11 Beat offices, and
the study covered 7 Beats. It was also noted here that only the
poor people (such as landless) of the community have been
selected for PF programs. Although there were some
exceptions but majority of the poor people were involving in
PF programs which was also mentioned by Muhammad et al.
(2008); Islam et al. 2012 in their studies. In total 3,327
members were involved in Madhupur and about 200 running
PF programs at Teknaf area, and this study randomly selected
80 and 40 poor members from Madhupr and Teknaf PF area.
In addition, this study selected 30 and 15 non-PF members
respectively who were poor and possessed similar
socioeconomic conditions as the PF members (before PF
started) in order to compare and visualize the changes of
livelihood assets. Non-members’ were selected according to
the FD lists which had a strong evidence that both people were
poor before involved in PF [24]. During field visits, actors
were asked about their views on other actors, and this study
tried to cover all PF actors listed in the result section.
Furthermore, the most powerful actors were re-interviewed in
order to assess the outcome analysis using semi-structured
questionnaires. Interview questionnaire were pretested and
improved before conducting the final interview, and a research
team consisting of 5 members was involved in the data
collection at the Madhupur area during different months of
2011 to 2013. However, a 7 member research team was
involved in data collection at the Teknaf area during the
months of March to September 2014.
2.4. Analytical Frameworks
The study’s questionnaires collected information that
identifies power status, based on the power elements of trust,
coercion and incentives by actors within the PF networks. The
study covered every actor and also asked each actor their
judgment on the power elements coercion, incentives and trust
of the other actors. The findings on three power elements were
categorized using a scale of 0 to 3 (0= not power and 3=
complete/highest power), and each actor gave specific power
dimension of other actors in the networks. Finally, the average
round value of each actor was used and overall value of all
actors to a particular actor was coded, determining the most
powerful actor and the less powerful one: the study applied a
dominance degree analysis model [33] which categorized the
most powerful actors. The analytical techniques used to
differentiate the most powerful actors from the less powerful
ones was developed by Schusser (2013) in which the
individual relative power (Xi) and dominance degree (Di)
were used to identify the powerful groups in PF networks by
using the following formulas: (Source: 34, 35)
92 K. K. Islam et al.: Analysis of Power Dynamics and Livelihood Assets in Participatory Forest
Management: Experience from Bangladesh
ℎ� = ��∑ �����
and ≤ � �� =�ℎ��
��� �� =
���
1 − ��� − �
Here, n= total number of actors identified, Xi= sum of answer per actor, hi= is
the ration of power per actor and power element (i), with 0>hi≥1, r= number of
powerful actors considered.
The above formulas were used for analyzing the dominance
degree (Di) is calculated by first sorting the data from the
highest value to the lowest. After that all values (Xi) are
bought in relation by calculating the relation (hi) between the
individual power element per actor (i) and the sum of the
power elements for all actors. After calculating hi of each actor
under each power elements, the cumulative accumulated value
(CRi) of each actor in the network can be calculated. Finally,
the dominance degree (Di) can be calculated with the above
formulas.
On the contrary, this study selected the most important
indicators (see Table 3) to measure the livelihood assets,
which are related to the reality of local peoples’ livelihood
conditions and the characteristics of PF performance in the
selected areas. Various scaling and indexing methods was
adapted to measure the human, physical, social, natural and
financial assets so that it was possible to make them
comparable and to allow meaningful interpretation. Most of
the indicators would make determinations using rating scale
methods in terms of different weight: 0.33, 0.66 and 1.0
interpreted as poor, medium/average and good. The questions
have three answer choice measured as: I= Good% ×1 +
Medium% × 0.66 + Poor%×0.33 (Chen et al. 2013). The two
answers to questions like Yes or No were interpreted as: I=
Yes%×1 + No%×0. The economic benefit questions related to
money were measured in different ways. Less than the mean
value was classified as poor with weight of 0.33; more than
the mean but less than 1.5×mean treated as medium/average
with weighty of 0.66; and more than 1.5×mean was classified
as good with a weight of 1.0. Similar types of calculation
procedure were followed for participants’ tree stocks and
livestock indicators. After weight calculations of each
indicator, we calculated the value of each type of livelihood
asset and finally the overall livelihood assets value.
3. Results
3.1. Actors Power Analysis
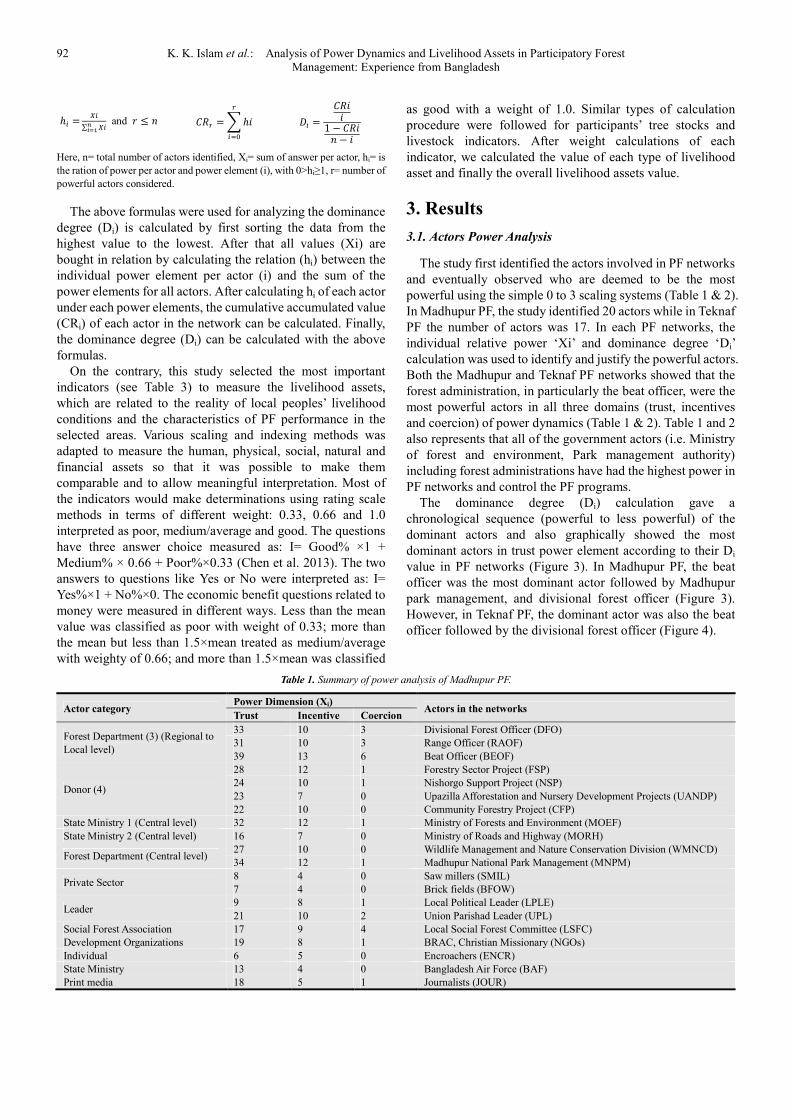
The study first identified the actors involved in PF networks
and eventually observed who are deemed to be the most
powerful using the simple 0 to 3 scaling systems (Table 1 & 2).
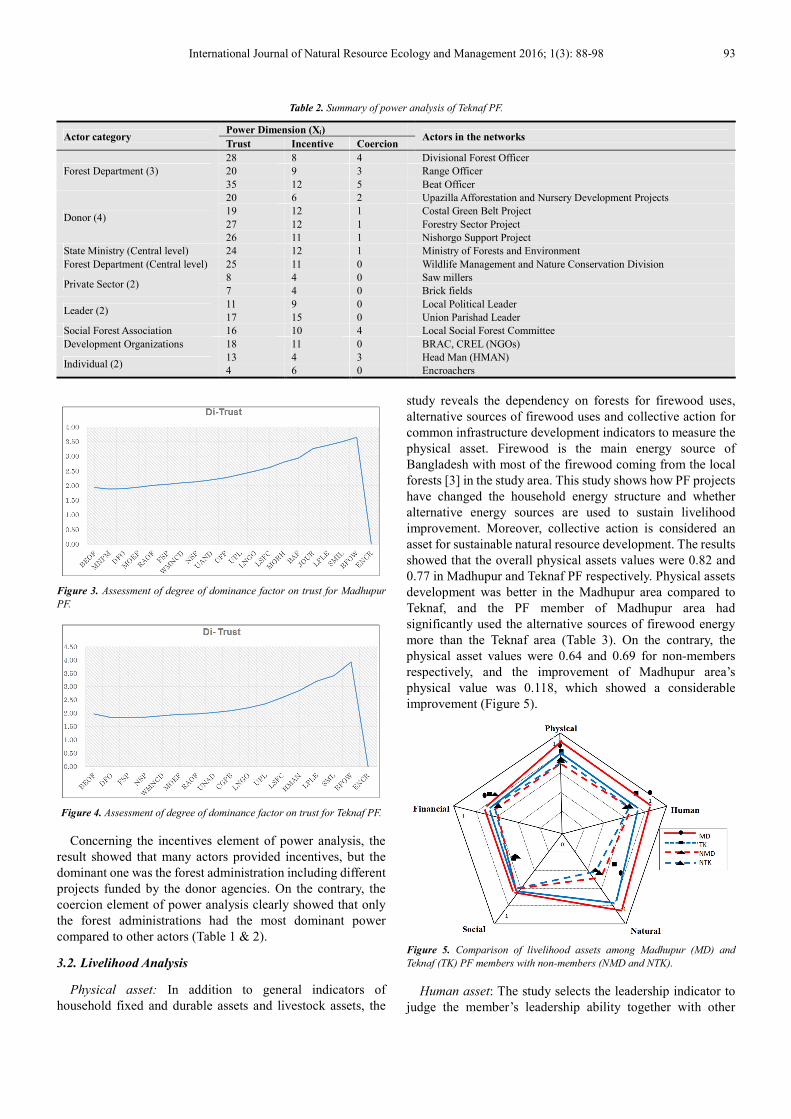
In Madhupur PF, the study identified 20 actors while in Teknaf
PF the number of actors was 17. In each PF networks, the
individual relative power ‘Xi’ and dominance degree ‘Di’
calculation was used to identify and justify the powerful actors.
Both the Madhupur and Teknaf PF networks showed that the
forest administration, in particularly the beat officer, were the
most powerful actors in all three domains (trust, incentives
and coercion) of power dynamics (Table 1 & 2). Table 1 and 2
also represents that all of the government actors (i.e. Ministry
of forest and environment, Park management authority)
including forest administrations have had the highest power in
PF networks and control the PF programs.
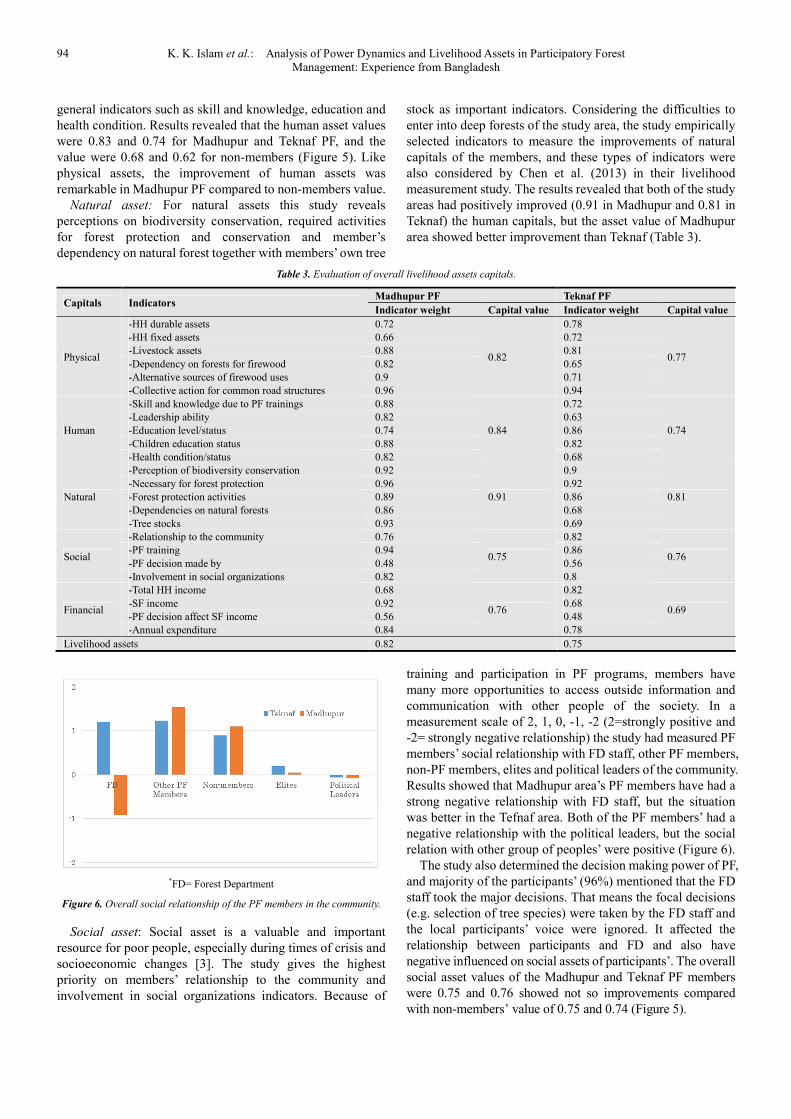
The dominance degree (Di) calculation gave a
chronological sequence (powerful to less powerful) of the
dominant actors and also graphically showed the most
dominant actors in trust power element according to their Di
value in PF networks (Figure 3). In Madhupur PF, the beat
officer was the most dominant actor followed by Madhupur
park management, and divisional forest officer (Figure 3).
However, in Teknaf PF, the dominant actor was also the beat
officer followed by the divisional forest officer (Figure 4).
Table 1. Summary of power analysis of Madhupur PF.
Actor category Power Dimension (Xi)
Actors in the networks Trust Incentive Coercion
Forest Department (3) (Regional to
Local level)
33 10 3 Divisional Forest Officer (DFO)
31 10 3 Range Officer (RAOF)
39 13 6 Beat Officer (BEOF)
Donor (4)
28 12 1 Forestry Sector Project (FSP)
24 10 1 Nishorgo Support Project (NSP)
23 7 0 Upazilla Afforestation and Nursery Development Projects (UANDP)
22 10 0 Community Forestry Project (CFP)
State Ministry 1 (Central level) 32 12 1 Ministry of Forests and Environment (MOEF)
State Ministry 2 (Central level) 16 7 0 Ministry of Roads and Highway (MORH)
Forest Department (Central level) 27 10 0 Wildlife Management and Nature Conservation Division (WMNCD)
34 12 1 Madhupur National Park Management (MNPM)
Private Sector 8 4 0 Saw millers (SMIL)
7 4 0 Brick fields (BFOW)
Leader 9 8 1 Local Political Leader (LPLE)
21 10 2 Union Parishad Leader (UPL)
Social Forest Association 17 9 4 Local Social Forest Committee (LSFC)
Development Organizations 19 8 1 BRAC, Christian Missionary (NGOs)
Individual 6 5 0 Encroachers (ENCR)
State Ministry 13 4 0 Bangladesh Air Force (BAF)
Print media 18 5 1 Journalists (JOUR)
International Journal of Natural Resource Ecology and Management 2016; 1(3): 88-98 93
Table 2. Summary of power analysis of Teknaf PF.
Actor category Power Dimension (Xi)
Actors in the networks Trust Incentive Coercion
Forest Department (3)
28 8 4 Divisional Forest Officer
20 9 3 Range Officer
35 12 5 Beat Officer
Donor (4)
20 6 2 Upazilla Afforestation and Nursery Development Projects
19 12 1 Costal Green Belt Project
27 12 1 Forestry Sector Project
26 11 1 Nishorgo Support Project
State Ministry (Central level) 24 12 1 Ministry of Forests and Environment
Forest Department (Central level) 25 11 0 Wildlife Management and Nature Conservation Division
Private Sector (2) 8 4 0 Saw millers
7 4 0 Brick fields
Leader (2) 11 9 0 Local Political Leader
17 15 0 Union Parishad Leader
Social Forest Association 16 10 4 Local Social Forest Committee
Development Organizations 18 11 0 BRAC, CREL (NGOs)
Individual (2) 13 4 3 Head Man (HMAN)
4 6 0 Encroachers
Figure 3. Assessment of degree of dominance factor on trust for Madhupur
PF.
Figure 4. Assessment of degree of dominance factor on trust for Teknaf PF.
Concerning the incentives element of power analysis, the
result showed that many actors provided incentives, but the
dominant one was the forest administration including different
projects funded by the donor agencies. On the contrary, the
coercion element of power analysis clearly showed that only
the forest administrations had the most dominant power
compared to other actors (Table 1 & 2).
3.2. Livelihood Analysis
Physical asset: In addition to general indicators of
household fixed and durable assets and livestock assets, the
study reveals the dependency on forests for firewood uses,
alternative sources of firewood uses and collective action for
common infrastructure development indicators to measure the
physical asset. Firewood is the main energy source of
Bangladesh with most of the firewood coming from the local
forests [3] in the study area. This study shows how PF projects
have changed the household energy structure and whether
alternative energy sources are used to sustain livelihood
improvement. Moreover, collective action is considered an
asset for sustainable natural resource development. The results
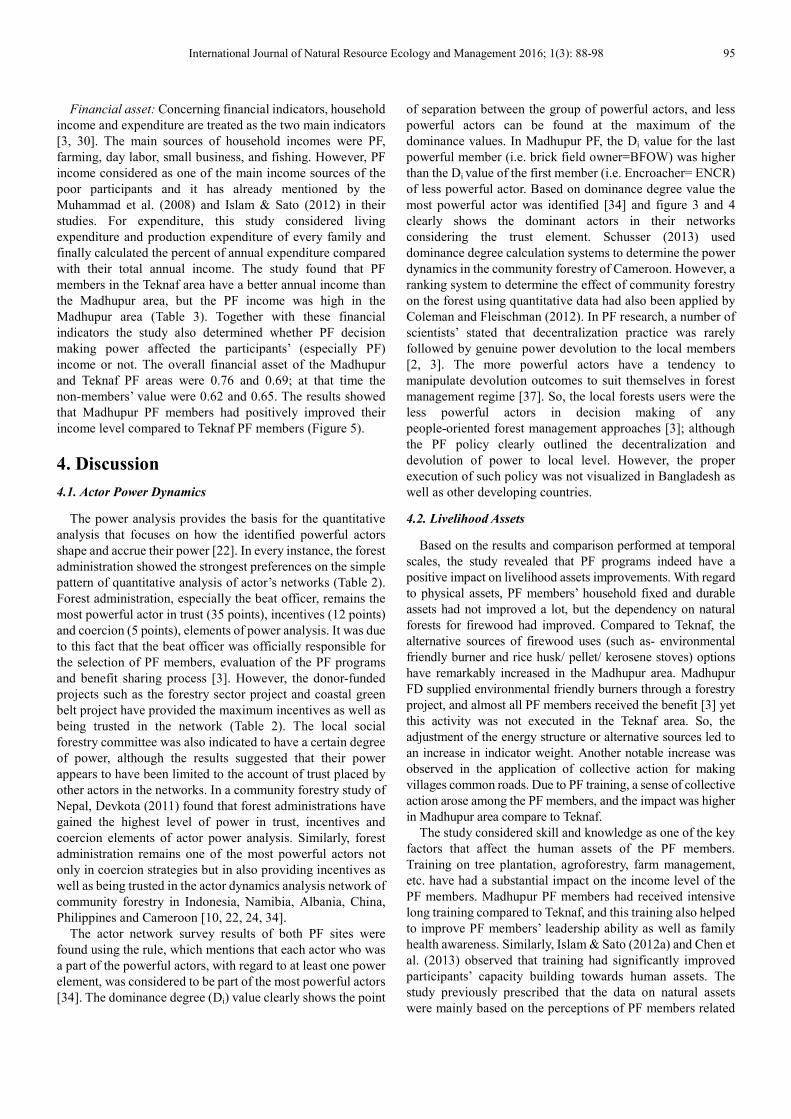
showed that the overall physical assets values were 0.82 and
0.77 in Madhupur and Teknaf PF respectively. Physical assets
development was better in the Madhupur area compared to
Teknaf, and the PF member of Madhupur area had
significantly used the alternative sources of firewood energy
more than the Teknaf area (Table 3). On the contrary, the
physical asset values were 0.64 and 0.69 for non-members
respectively, and the improvement of Madhupur area’s
physical value was 0.118, which showed a considerable
improvement (Figure 5).
Figure 5. Comparison of livelihood assets among Madhupur (MD) and
Teknaf (TK) PF members with non-members (NMD and NTK).
Human asset: The study selects the leadership indicator to
judge the member’s leadership ability together with other
94 K. K. Islam et al.: Analysis of Power Dynamics and Livelihood Assets in Participatory Forest
Management: Experience from Bangladesh
general indicators such as skill and knowledge, education and
health condition. Results revealed that the human asset values
were 0.83 and 0.74 for Madhupur and Teknaf PF, and the
value were 0.68 and 0.62 for non-members (Figure 5). Like
physical assets, the improvement of human assets was
remarkable in Madhupur PF compared to non-members value.
Natural asset: For natural assets this study reveals
perceptions on biodiversity conservation, required activities
for forest protection and conservation and member’s
dependency on natural forest together with members’ own tree
stock as important indicators. Considering the difficulties to
enter into deep forests of the study area, the study empirically
selected indicators to measure the improvements of natural
capitals of the members, and these types of indicators were
also considered by Chen et al. (2013) in their livelihood
measurement study. The results revealed that both of the study
areas had positively improved (0.91 in Madhupur and 0.81 in
Teknaf) the human capitals, but the asset value of Madhupur
area showed better improvement than Teknaf (Table 3).
Table 3. Evaluation of overall livelihood assets capitals.
Capitals Indicators Madhupur PF Teknaf PF
Indicator weight Capital value Indicator weight Capital value
Physical
-HH durable assets 0.72
0.82
0.78
0.77
-HH fixed assets 0.66 0.72
-Livestock assets 0.88 0.81
-Dependency on forests for firewood 0.82 0.65
-Alternative sources of firewood uses 0.9 0.71
-Collective action for common road structures 0.96 0.94
Human
-Skill and knowledge due to PF trainings 0.88
0.84
0.72
0.74
-Leadership ability 0.82 0.63
-Education level/status 0.74 0.86
-Children education status 0.88 0.82
-Health condition/status 0.82 0.68
Natural
-Perception of biodiversity conservation 0.92
0.91
0.9
0.81
-Necessary for forest protection 0.96 0.92
-Forest protection activities 0.89 0.86
-Dependencies on natural forests 0.86 0.68
-Tree stocks 0.93 0.69
Social
-Relationship to the community 0.76
0.75
0.82
0.76 -PF training 0.94 0.86
-PF decision made by 0.48 0.56
-Involvement in social organizations 0.82 0.8
Financial
-Total HH income 0.68
0.76
0.82
0.69 -SF income 0.92 0.68
-PF decision affect SF income 0.56 0.48
-Annual expenditure 0.84 0.78
Livelihood assets 0.82 0.75
*FD= Forest Department
Figure 6. Overall social relationship of the PF members in the community.
Social asset: Social asset is a valuable and important
resource for poor people, especially during times of crisis and
socioeconomic changes [3]. The study gives the highest
priority on members’ relationship to the community and
involvement in social organizations indicators. Because of
training and participation in PF programs, members have
many more opportunities to access outside information and
communication with other people of the society. In a
measurement scale of 2, 1, 0, -1, -2 (2=strongly positive and
-2= strongly negative relationship) the study had measured PF
members’ social relationship with FD staff, other PF members,
non-PF members, elites and political leaders of the community.
Results showed that Madhupur area’s PF members have had a
strong negative relationship with FD staff, but the situation
was better in the Tefnaf area. Both of the PF members’ had a
negative relationship with the political leaders, but the social
relation with other group of peoples’ were positive (Figure 6).
The study also determined the decision making power of PF,
and majority of the participants’ (96%) mentioned that the FD
staff took the major decisions. That means the focal decisions
(e.g. selection of tree species) were taken by the FD staff and
the local participants’ voice were ignored. It affected the
relationship between participants and FD and also have
negative influenced on social assets of participants’. The overall
social asset values of the Madhupur and Teknaf PF members
were 0.75 and 0.76 showed not so improvements compared
with non-members’ value of 0.75 and 0.74 (Figure 5).
International Journal of Natural Resource Ecology and Management 2016; 1(3): 88-98 95
Financial asset: Concerning financial indicators, household
income and expenditure are treated as the two main indicators
[3, 30]. The main sources of household incomes were PF,
farming, day labor, small business, and fishing. However, PF
income considered as one of the main income sources of the
poor participants and it has already mentioned by the
Muhammad et al. (2008) and Islam & Sato (2012) in their
studies. For expenditure, this study considered living
expenditure and production expenditure of every family and
finally calculated the percent of annual expenditure compared
with their total annual income. The study found that PF
members in the Teknaf area have a better annual income than
the Madhupur area, but the PF income was high in the
Madhupur area (Table 3). Together with these financial
indicators the study also determined whether PF decision
making power affected the participants’ (especially PF)
income or not. The overall financial asset of the Madhupur
and Teknaf PF areas were 0.76 and 0.69; at that time the
non-members’ value were 0.62 and 0.65. The results showed
that Madhupur PF members had positively improved their
income level compared to Teknaf PF members (Figure 5).
4. Discussion
4.1. Actor Power Dynamics
The power analysis provides the basis for the quantitative
analysis that focuses on how the identified powerful actors
shape and accrue their power [22]. In every instance, the forest
administration showed the strongest preferences on the simple
pattern of quantitative analysis of actor’s networks (Table 2).
Forest administration, especially the beat officer, remains the
most powerful actor in trust (35 points), incentives (12 points)
and coercion (5 points), elements of power analysis. It was due
to this fact that the beat officer was officially responsible for
the selection of PF members, evaluation of the PF programs
and benefit sharing process [3]. However, the donor-funded
projects such as the forestry sector project and coastal green
belt project have provided the maximum incentives as well as
being trusted in the network (Table 2). The local social
forestry committee was also indicated to have a certain degree
of power, although the results suggested that their power
appears to have been limited to the account of trust placed by
other actors in the networks. In a community forestry study of
Nepal, Devkota (2011) found that forest administrations have
gained the highest level of power in trust, incentives and
coercion elements of actor power analysis. Similarly, forest
administration remains one of the most powerful actors not
only in coercion strategies but in also providing incentives as
well as being trusted in the actor dynamics analysis network of
community forestry in Indonesia, Namibia, Albania, China,
Philippines and Cameroon [10, 22, 24, 34].
The actor network survey results of both PF sites were
found using the rule, which mentions that each actor who was
a part of the powerful actors, with regard to at least one power
element, was considered to be part of the most powerful actors
[34]. The dominance degree (Di) value clearly shows the point
of separation between the group of powerful actors, and less
powerful actors can be found at the maximum of the
dominance values. In Madhupur PF, the Di value for the last
powerful member (i.e. brick field owner=BFOW) was higher
than the Di value of the first member (i.e. Encroacher= ENCR)
of less powerful actor. Based on dominance degree value the
most powerful actor was identified [34] and figure 3 and 4
clearly shows the dominant actors in their networks
considering the trust element. Schusser (2013) used
dominance degree calculation systems to determine the power
dynamics in the community forestry of Cameroon. However, a
ranking system to determine the effect of community forestry
on the forest using quantitative data had also been applied by
Coleman and Fleischman (2012). In PF research, a number of
scientists’ stated that decentralization practice was rarely
followed by genuine power devolution to the local members
[2, 3]. The more powerful actors have a tendency to
manipulate devolution outcomes to suit themselves in forest
management regime [37]. So, the local forests users were the
less powerful actors in decision making of any
people-oriented forest management approaches [3]; although
the PF policy clearly outlined the decentralization and
devolution of power to local level. However, the proper
execution of such policy was not visualized in Bangladesh as
well as other developing countries.
4.2. Livelihood Assets
Based on the results and comparison performed at temporal
scales, the study revealed that PF programs indeed have a
positive impact on livelihood assets improvements. With regard
to physical assets, PF members’ household fixed and durable
assets had not improved a lot, but the dependency on natural
forests for firewood had improved. Compared to Teknaf, the
alternative sources of firewood uses (such as- environmental
friendly burner and rice husk/ pellet/ kerosene stoves) options
have remarkably increased in the Madhupur area. Madhupur
FD supplied environmental friendly burners through a forestry
project, and almost all PF members received the benefit [3] yet
this activity was not executed in the Teknaf area. So, the
adjustment of the energy structure or alternative sources led to
an increase in indicator weight. Another notable increase was
observed in the application of collective action for making
villages common roads. Due to PF training, a sense of collective
action arose among the PF members, and the impact was higher
in Madhupur area compare to Teknaf.
The study considered skill and knowledge as one of the key
factors that affect the human assets of the PF members.
Training on tree plantation, agroforestry, farm management,
etc. have had a substantial impact on the income level of the
PF members. Madhupur PF members had received intensive
long training compared to Teknaf, and this training also helped
to improve PF members’ leadership ability as well as family
health awareness. Similarly, Islam & Sato (2012a) and Chen et
al. (2013) observed that training had significantly improved
participants’ capacity building towards human assets. The
study previously prescribed that the data on natural assets
were mainly based on the perceptions of PF members related

96 K. K. Islam et al.: Analysis of Power Dynamics and Livelihood Assets in Participatory Forest
Management: Experience from Bangladesh
to biodiversity conservation and forest protections activities.
The natural asset value of 0.91 and 0.81 in Madhupur and
Teknaf area indicted that the majority of the local community
was willing to protect forests resources and biodiversity. The
overall value of natural assets was significantly different
between PF members and non-members in both of the study
areas. It indicated that the PF programs objectives and
processes have had a noteworthy effect on the local
communities. However, the dependency on natural forest
indicator revealed that still the Teknaf area’s people have
relied on forests resources for a living, but the scenario was
better in Madhupur area.
The social asset is an attribute of an individual in a social
aspect [38]; the development of social asset depends on the
relationship, institutions, attitudes and values that govern
interactions among the peoples and contribute to the economic
and social development [39] and are therefore difficult to
measure. Together with the common social indicators, this
study also tried to measure the social relationship of the PF
members. Figure 6 clearly shows a remarkable difference
between the relationship of Madhupur and Teknaf areas PF
members with the FD. Due to sever conflicts on forests land
tenure, the local communities of Madhupur have revealed a
negative relationship with local FD [3, 40]. On the contrary,
Teknaf area’s people have maintained a good relationship with
local FD. The most negative side of the social assets was the
decision making ability that solely controlled by the FD. That
means the local participants’ had totally ignored to take any
decision regarding to the planning and management aspects of
PF. In a study on Sal forests, Islam & Sato (2012) also
mentioned that the FD had controlled the PF program which
was severely affected their social assets. In general, the PF
programs have created a small social network among the
members and other peoples’ of the communities to some
extent. Lastly, the financial asset of the study showed a minor
increases, and a small difference was detected between PF
members and non-members. However, the PF income
positively differs in the Madhupur and Teknaf areas, and the
result showed an enhancement in the Madhupur PF area. The
study found that the PF-members in Madhupur have cultivated
seasonal/annual crops in association with trees; thus, the
members received a good amount of additional income
throughout the year. In Madhupur area, the seasonal crops
yield of PF programs generated financial capital and seasonal
cash flow to the farmers [3, 41]. Almost all PF members have
invested their PF income toward their children education and
family health care and also to cover the household expenditure
that partly sustains their livelihoods.
4.3. Linking Actors Power and Livelihood Outcomes
The study also determined the linkage between various
outcomes and powerful actors’ power/interests who have
expressed their influence through the power dynamics of the
PF networks. It was clear that FD influenced and negotiate
donor in order to get funds, and also imposed donor criteria to
the lower level by means of legal authority and technical
orders. Moreover, formal rules and restrictions on Sal forests
have given FD ability to control PF activities whenever
required [3, 11, 40]. The study observed that PF have been
limiting the accessibility and decision making capacity of
members’; hence, the expected social outcomes become
limited or not at desirable level. This study on the other hand,
told us that real empowerment remains rhetoric in PF. Here,
empowering participants’ means encouraging them to plan
and develop own strategies for improving their livelihoods
with the emphasis on different access on livelihood assets and
related resources. Moreover, financial benefits from the PF
clearly fall short of the expectation and it was due to the
improper tree species selection by the FD officer. The FD did
not considered the market value of planted tree species, rather
they followed the imposed criteria of top official and donors
and it was also mentioned by Islam and Sato (2012a, 2013) in
their study on Sal forests. Formally, all powerful actors have
desired to improve forest condition and healthy species; thus,
the ecological/natural assets were positive. However, the other
powerful actors’ such as political leader and elites were mainly
influences the participants’ selection and local level decision
making process, strategically collaborated and exercised
power with the FD that allows them to continue their influence
in the outcomes of PF [3]. So, the ongoing decision-making
process of PF showed an unbalance power relationship
between FD and members’ which would facilitate conflicts
and obstacle the usual outcomes [3, 41]. Nevertheless, FD
have overlooked local or traditional knowledge on PF
management. For example, majority of the participants’
mentioned that the exotic tree species decided by the FD as a
part of maintaining donor criteria had reduced the PF income
as well questioning the forest future [3, 41].
The overall evaluation of the actors’ power and outcomes of
this study holds that the power of powerful actors had driven
the PF outcomes, hence they can easily influence the PF
process to suit their interests. PF outcomes especially social
and economic highly reflect the interests of powerful actors;
thus, the study may summarize that there is a strong link
between the actors’ power and livelihood development in PF.
Although the PF has some negative impacts due to the
imbalance of power among the actors, the overall results
included many impressive results concerning the development
of the livelihood assets of the participants. Some positive
outcomes were - increased interaction among the actors,
participants’ capacity building through intensive training,
improvements of livelihood assets, increased overall incomes
and revenues, marginal and disadvantaged groups have
involved in forest management, infrastructure development,
increased awareness and collective action along with the
sustainable management of forests. Therefore, the overall
discussions argue that PF has clearly impacted the local level
and livelihoods of the local communities augmented; however,
the powerful actors are highly relevant for the sustainable
livelihood development in Bangladesh.
5. Conclusions
Participatory forestry programs in Bangladesh have no

International Journal of Natural Resource Ecology and Management 2016; 1(3): 88-98 97
doubt introduced a new interpretation of forest
management with an approach to include local
communities together with rural development and resource
conservations. This approach also includes many actors due
to the economic, ecological and social functions and values
that forests deliver. In both study sites, the results found out
that the forest administration proved itself as the most
powerful and influential actors in PF. The forest
administration is the most powerful actor in all three power
elements of actors’ power analysis, and they gained
numerous power features through the bureaucratic forest
management and policies of the country. The actors’ power
analysis of this study argued that there is an immediate need
to empower the local people and their committees, in which
the PF members plays the central role in decision making
and governing all of their development initiatives. The
study also revealed that PF has impacted the livelihood
assets and the changes in livelihood assets among the PF
members and non-members were considerably different. So,
PF is an effective management approach which provides
certain insights regarding the microcosm of livelihood
assets development. However, the PF had not received
desirable livelihood support from the output of the social
and financial assets. Often social and economic outcomes
depends on the interests and power of the powerful actors.
Therefore, it is very important that more emphasis should
be given to enhancing social and financial assets through
empowering local participants’, intensive training,
adopting appropriate tree-crop production technologies,
workshop and awareness building according to the local
needs. Likewise, an iterated approach including alternative
livelihood options are necessary to deal with the basic
needs of the forest dependent people and the sustainable
management of forests.
References
[1] Brown, F. P. (2009). Participatory forest management discourse in South Africa: ecological moderation in the developing world. Ph. D. Thesis; University of KwaZulu-Natal, Durban, South Africa.
[2] Ribot, J. C. (2004). Waiting for democracy: the politics of choice in natural resource decentralization. World Resource Institute, Washington DC, USA, p. 140.
[3] Islam, K. K. & Sato, N. (2012a). Participatory forestry in Bangladesh: has it helped to increase the livelihoods of Sal forests dependent people. Southern Forest: A Journal of Forest Science, 74 (2): 89-101.
[4] Larson, A. M. & Ribot, J. C. (2007). The poverty of forest policy: double standards on an uneven playing field. Sustainability Science, 2 (2): 189-204.
[5] Peluso, N. L., Tumer, M. & Fortman, L. (1994). Introducing community forestry: Aaaotated Listing of Tropics and Readings, Rome, FAO, UN.
[6] Hobley, M. (2004). Players in the Sector- Civil Society, Private Sector and Donor Agencies. Available at:
http://www.cambodia-forestsector.net/docs-part2.htm. Accessed 12. 06. 2014.
[7] Sharma, N. N. & Acharya, B. (2004). Good governance in Nepal’s community forestry: translating concepts into action. In: Kanel, K. R., Mathema, P., Kandel, B. R., Niraula, D. R., Sharma, A. R. and Gautam, M. (Eds.). Proceeding of the 4th national workshop on community forestry, 2004, August 4-6, Kathmandu, Nepal.
[8] Barrow, E., Clarke. J., Grundy, I., Jones, K. R. & Tessema, Y. (2002). Analysis of Stakeholder based natural resource management: creating space for local people to participate and benefit? Natural Resource Perspectives. Berkeley: University of California Press. p. 320.
[9] Devkota, M. (2010). Interests and power as drivers of community forestry: a case study of Nepal. Ph. D. Thesis; University of Gottingen, Germany.
[10] Krott, M. (2005). Forest policy analysis. Dordrecht, the Netherlands, Springer.
[11] Islam, K. K. & Sato, N. (2012b). Deforestation, land conversion and illegal logging in Bangladesh: the case of the Sal forests. iForest, 5: 171-178.
[12] Islam, K. K., Ullah, M. O., Hoogstra, M. & Sato, N. (2012). Economic contribution of participatory Agroforestry program to poverty alleviation: a case from Sal forests, Bangladesh. Journal of Forestry Research, 23 (2): 323-332.
[13] Muhammed, N., Koike, M., Haque, F. & Miah, M. D. (2008). Quantitative assessment of people oriented forestry in Bangladesh: A case study from Tangail Forest Division. Journal of Environmental Management, 88 (1): 83-92.
[14] Sharma, B. P. (2006). Poverty alleviation through forest resource management: an analysis of leasehold forestry practice in Nepal. Available at: http://www.sandeeonline.com/uploads/general_docs/research_guidlines/bishnusharma.pdf. Accessed 22. 11. 2013.
[15] Tyler, S. D. (2006). Community based natural resource management: a research approach to rural poverty and environmental degradation. International Development Research Centre. Available at: http://www.idrc.ca/en/ev-103630-201-1-DO_TOPIC.html. Accessed 22. 12. 2013.
[16] Bond, A., Davis, C. N., Nott, K. & Stuart, G. (2006). Community based natural resource manual. WWF- World Wide Fund. pp. 24-52.
[17] Barrett, C. B. & Swallow, B. M. (2004). Dynamics poverty traps and rural livelihoods. In: Ellis, F and Freeman, A (Eds.). Rural livelihood and poverty reduction policies. Routledge, London, pp. 103-165.
[18] Fometer, T. & Vermaak, J. (2001). Community forestry and poverty. Rural Development Forestry Network. Network Paper, Vol. 25h. Overseas Development Institute, UK. pp. 1-8.
[19] Shahbaz, B. (2009). Dilemmas in participatory forest management in northwest Pakistan: a livelihoods perspective. Human Geography Series, 25: 15-16.
[20] West, W. F. (2004). Formal procedures, informal processes, accountability, and responsiveness in bureaucratic policy making: an institutional policy analysis. Public Administration Review, 64 (1): 66-80.

98 K. K. Islam et al.: Analysis of Power Dynamics and Livelihood Assets in Participatory Forest
Management: Experience from Bangladesh
[21] Maryudi, A. (2011). The contesting aspiration in the forests: actors, interests and power in community forestry in Java, Indonesia. Ph. D. Thesis; University of Gottingen, Germany.
[22] Webber, M. (1964). Basic concept of sociology. New York, USA.
[23] Krott, M., Bader, A., Schusser, C., Devkota, R. & Maryudi, A. (2013). Actor-centered power: the driving force in decentralized community based forest governance. Forest Policy and Economics, In press.
[24] Chambers, R. & Conway, G. (1992). Sustainable rural livelihoods: practical concepts for the 21st Century. IDS Discussion Paper 296, Institute for Development Studies, Brighton, UK.
[25] Stephen, M, Nora, M. & Moses, A. (2009). Livelihood approach: a critical analysis of theory and practice. Geographical Paper No 189. University of Reading, UK. pp. 4-23.
[26] Carney, D. (1998). Sustainable rural livelihoods; what contribution can we make? Department for International Development, London.
[27] Hussein, K. & Nelson, J. (1998). Sustainable Livelihood and Livelihood Diversification, IDS Working Paper, No. 69. Brighton, Institute of Development Studies.
[28] Das, N. (2009). Can joint forest management programme sustain rural life: a livelihood analysis from community-based forest management groups? MPRA Paper No. 15305. Available at: http://www.mpra.ub.uni-muenchen.de/15305/. Accessed 20. 11. 2013.
[29] Chen, H., Zhu, T., Krott, M., Calvo, J. F., Ganesh, S. P. & Makoto I. (2013). Measurement and evaluation of livelihood assets in sustainable forest commons governance. Land Use Policy, 30: 908-914.
[30] FD (Forest Department). (2014). Land and forest area. Official website of Bangladesh Forest Department, Government of Forest. Available at: http://www.bforest.gov.bd/act.php. Last accessed 02. 10. 2014.
[31] Islam, K. K. & Sato, N. (2013). Protected Sal forests and livelihoods of ethnic minority: Experience from Bangladesh. Sustainable Forestry, 32 (4): 412-436.
[32] Schmidt, V. A. (2000). Democracy and discourse in an integrating Europe and a globalizing world. Security, 24 (4): 5-38.
[33] Schusser, C. (2013). Comparative analysis of community forestry: theoretical and methodological requirements. Ph. D. Thesis; University of Gottingen, Germany.
[34] Jonas, N. & Pfisterer, L. (2010). Measurement of concentration and market power. Available at: http://www.wiwi.unikl.de/dekanat/blank/Segelseminar2010/11/Marktmacht.pdf. Last accessed 20. 07. 2014.
[35] Coleman, E. A. & Fleischman, F. D. (2012). Comparing forest decentralization and local institutional change in Bolivia, Kenya, Mexico, and Uganda. World Development, 40 (4): 836–849.
[36] Shackleton, S., Campbell, B., Wollenberg, E. & Edmunds, D. (2002). Devolution and community based natural resource management: creating space for local people to participate and benefit? Natural Resource Perspective, 76: 1–6.
[37] Sobel, J. (2002). Can We Trust Social Capital? Journal of Economic Literature, 40 (1): 139-154.
[38] World Bank. (2002). Impact on migration on economic and social development: a review of evidence and emerging issue. Available at: http://siteresources.worldbank.org/TOPICS/Resources/2149701288877981391/Migration&Development-Ratha-GFMD_2010a.pdf. Accessed 13. 05. 2014.
[39] Gain, P. (2002). The last forest of Bangladesh. Society for Environmental and Human Development (SEHD), Dhaka, Bangladesh.
[40] Safa, M. S. (2004). The effect of participatory forest management on the livelihood of the settlers in a rehabilitation program of degraded forest in Bangladesh. Small-scale Forest Economics, Management and Policy, 3 (2): 223-238.