Analysis of Platinum Group Metals with the iCAP 7400 … · Analysis of platinum group metals with...
4
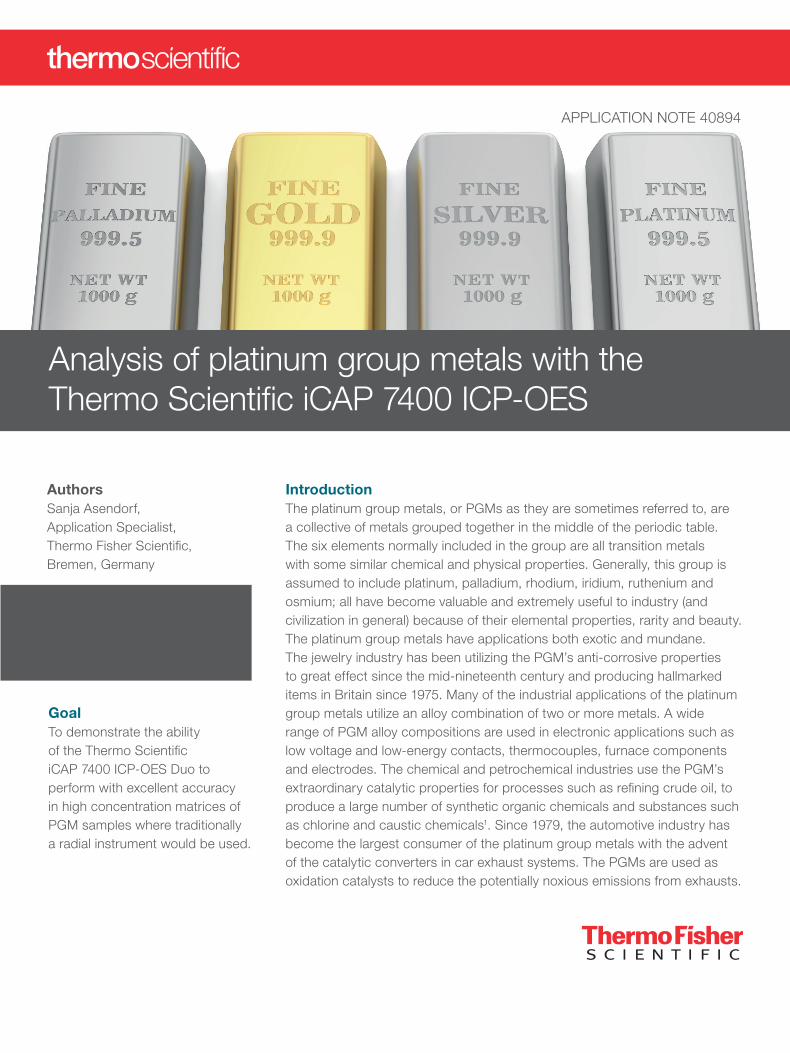
Analysis of platinum group metals with the Thermo Scientific iCAP 7400 ICP-OES APPLICATION NOTE 40894 Authors Sanja Asendorf, Application Specialist, Thermo Fisher Scientific, Bremen, Germany Keywords Catalyst, Electronics, Jewelry, Metallurgy, Microwave digestion, PGM, Platinum group metals Introduction The platinum group metals, or PGMs as they are sometimes referred to, are a collective of metals grouped together in the middle of the periodic table. The six elements normally included in the group are all transition metals with some similar chemical and physical properties. Generally, this group is assumed to include platinum, palladium, rhodium, iridium, ruthenium and osmium; all have become valuable and extremely useful to industry (and civilization in general) because of their elemental properties, rarity and beauty. The platinum group metals have applications both exotic and mundane. The jewelry industry has been utilizing the PGM’s anti-corrosive properties to great effect since the mid-nineteenth century and producing hallmarked items in Britain since 1975. Many of the industrial applications of the platinum group metals utilize an alloy combination of two or more metals. A wide range of PGM alloy compositions are used in electronic applications such as low voltage and low-energy contacts, thermocouples, furnace components and electrodes. The chemical and petrochemical industries use the PGM’s extraordinary catalytic properties for processes such as refining crude oil, to produce a large number of synthetic organic chemicals and substances such as chlorine and caustic chemicals 1 . Since 1979, the automotive industry has become the largest consumer of the platinum group metals with the advent of the catalytic converters in car exhaust systems. The PGMs are used as oxidation catalysts to reduce the potentially noxious emissions from exhausts. Goal To demonstrate the ability of the Thermo Scientific iCAP 7400 ICP-OES Duo to perform with excellent accuracy in high concentration matrices of PGM samples where traditionally a radial instrument would be used.
-
Upload
nguyenduong -
Category
Documents
-
view
234 -
download
2
Transcript of Analysis of Platinum Group Metals with the iCAP 7400 … · Analysis of platinum group metals with...
Analysis of platinum group metals with the Thermo Scientific iCAP 7400 ICP-OES
APPLICATION NOTE 40894
AuthorsSanja Asendorf, Application Specialist, Thermo Fisher Scientific, Bremen, Germany
KeywordsCatalyst, Electronics, Jewelry, Metallurgy, Microwave digestion, PGM, Platinum group metals
IntroductionThe platinum group metals, or PGMs as they are sometimes referred to, are a collective of metals grouped together in the middle of the periodic table. The six elements normally included in the group are all transition metals with some similar chemical and physical properties. Generally, this group is assumed to include platinum, palladium, rhodium, iridium, ruthenium and osmium; all have become valuable and extremely useful to industry (and civilization in general) because of their elemental properties, rarity and beauty. The platinum group metals have applications both exotic and mundane. The jewelry industry has been utilizing the PGM’s anti-corrosive properties to great effect since the mid-nineteenth century and producing hallmarked items in Britain since 1975. Many of the industrial applications of the platinum group metals utilize an alloy combination of two or more metals. A wide range of PGM alloy compositions are used in electronic applications such as low voltage and low-energy contacts, thermocouples, furnace components and electrodes. The chemical and petrochemical industries use the PGM’s extraordinary catalytic properties for processes such as refining crude oil, to produce a large number of synthetic organic chemicals and substances such as chlorine and caustic chemicals1. Since 1979, the automotive industry has become the largest consumer of the platinum group metals with the advent of the catalytic converters in car exhaust systems. The PGMs are used as oxidation catalysts to reduce the potentially noxious emissions from exhausts.
GoalTo demonstrate the ability of the Thermo Scientific iCAP 7400 ICP-OES Duo to perform with excellent accuracy in high concentration matrices of PGM samples where traditionally a radial instrument would be used.
Parameter Setting
Pump Tubing (Standard Pump)
Sample Tygon® orange/whiteDrain Tygon® white/white
Pump Speed 50 rpm
Nebulizer Glass concentric
Nebulizer Gas Flow 0.65 L·min-1
Spray Chamber Glass cyclonic
Auxiliary Gas Flow 0.5 L·min-1
Coolant Gas Flow 12 L·min-1
Center Tube 2 mm
RF Power 1150 W
Exposure Time Axial Vis 15 s
InstrumentationA Thermo Scientific™ iCAP™ 7400 ICP-OES Duo equipped with a standard aqueous sample introduction kit was used for this work. The instrument parameters used during analysis are shown in Table 1. The Thermo Scientific iCAP 7000 Plus Series ICP-OES includes high-resolution Echelle optics and an improved fourth generation Charge Injection Device (CID) detector. Advancements in CID technology allow this detector to feature higher sensitivity and lower noise than any of its predecessors. All of these performance improvements make it ideal for precise and accurate measurements of both high-grade and low-grade PGM samples.
Table 1. Instrument and method parameters.
Sample and standard preparationThe samples used for this application note are a mixture of low to mid-grade PGMs and various base metals in high concentrations. The samples were kindly donated by a major world-wide PGM producer where they are used as in-house control standards. The samples have sufficiently high concentrations of PGMs so that no pre-concentration or separation was required. However, without the separation of base metals, it is necessary to use a high-resolution ICP-OES with full wavelength coverage to make sure that there are no interferences.
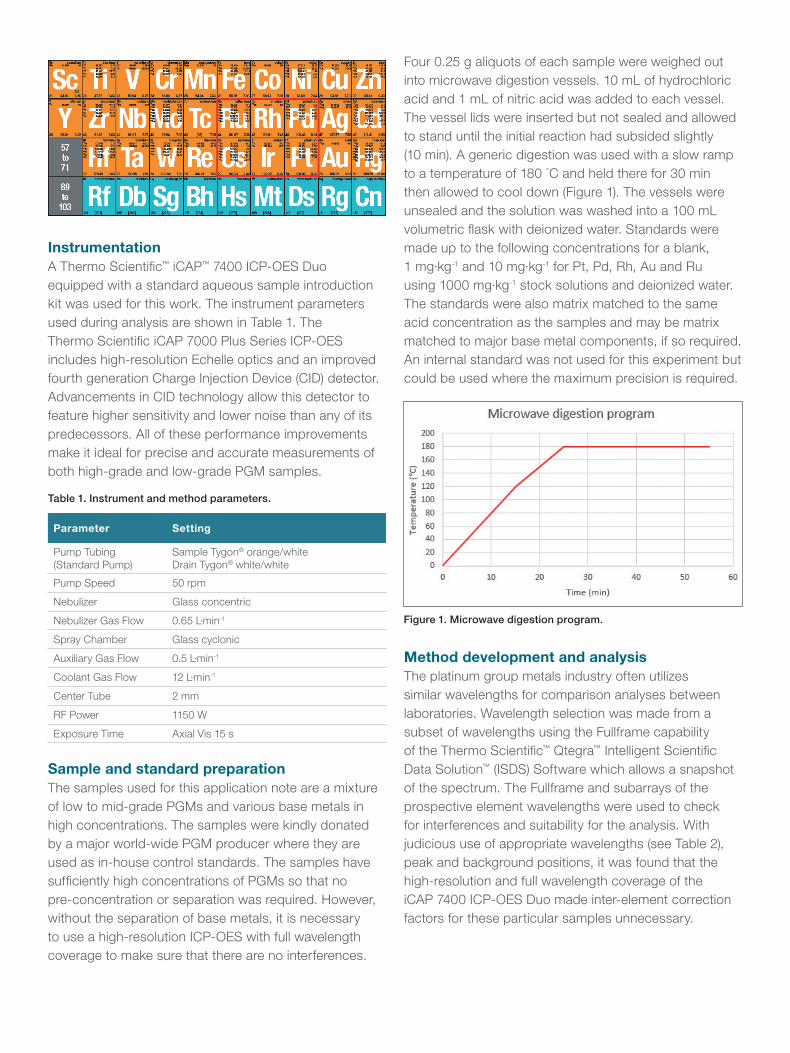
Four 0.25 g aliquots of each sample were weighed out into microwave digestion vessels. 10 mL of hydrochloric acid and 1 mL of nitric acid was added to each vessel. The vessel lids were inserted but not sealed and allowed to stand until the initial reaction had subsided slightly (10 min). A generic digestion was used with a slow ramp to a temperature of 180 °C and held there for 30 min then allowed to cool down (Figure 1). The vessels were unsealed and the solution was washed into a 100 mL volumetric flask with deionized water. Standards were made up to the following concentrations for a blank, 1 mg·kg-1 and 10 mg·kg-1 for Pt, Pd, Rh, Au and Ru using 1000 mg·kg-1 stock solutions and deionized water. The standards were also matrix matched to the same acid concentration as the samples and may be matrix matched to major base metal components, if so required. An internal standard was not used for this experiment but could be used where the maximum precision is required.
Figure 1. Microwave digestion program.
Method development and analysisThe platinum group metals industry often utilizes similar wavelengths for comparison analyses between laboratories. Wavelength selection was made from a subset of wavelengths using the Fullframe capability of the Thermo Scientific™ Qtegra™ Intelligent Scientific Data Solution™ (ISDS) Software which allows a snapshot of the spectrum. The Fullframe and subarrays of the prospective element wavelengths were used to check for interferences and suitability for the analysis. With judicious use of appropriate wavelengths (see Table 2), peak and background positions, it was found that the high-resolution and full wavelength coverage of the iCAP 7400 ICP-OES Duo made inter-element correction factors for these particular samples unnecessary.
Element Wavelength (nm) Plasma view
Au 267.595 Axial
Pd 340.458 Axial
Pt 265.945 Axial
Rh 343.489 Axial
Ru 267.876 Axial
Element Ni Cu Co Fe S
Concentration range (% in solid)
29-48 25-43 0.3-2.2 0.4-2.7 20-24
Element Aliquot 1 Aliquot 2 Aliquot 3 Average Expected
(± 2SD)
Au 67.0 70.6 70.0 69.2 67.9 ± 1.7
Pd 784 813 849 815 817 ± 26
Pt 1250 1383 1283 1305 1305 ± 44
Rh 186 197 203 195 193 ± 8
Ru 475 513 520 503 489 ± 18
Table 2. Selected wavelength and view for each analyzed element.
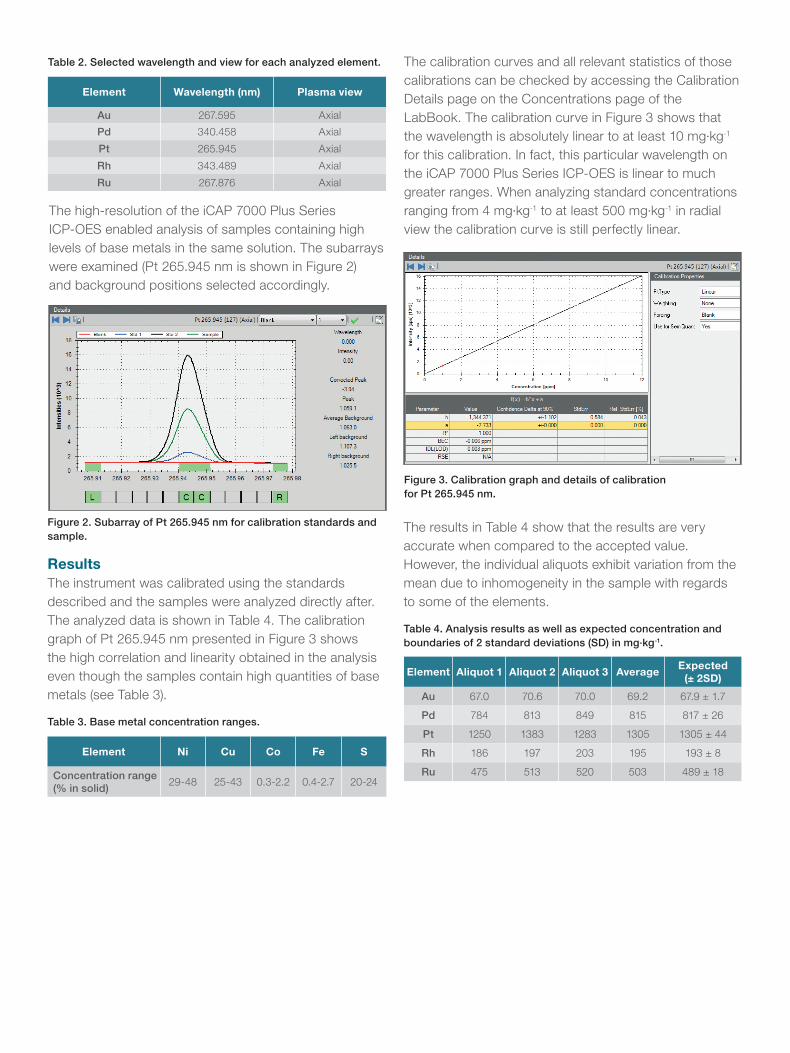
Figure 2. Subarray of Pt 265.945 nm for calibration standards and sample.
Table 3. Base metal concentration ranges.
The high-resolution of the iCAP 7000 Plus Series ICP-OES enabled analysis of samples containing high levels of base metals in the same solution. The subarrays were examined (Pt 265.945 nm is shown in Figure 2) and background positions selected accordingly.
ResultsThe instrument was calibrated using the standards described and the samples were analyzed directly after. The analyzed data is shown in Table 4. The calibration graph of Pt 265.945 nm presented in Figure 3 shows the high correlation and linearity obtained in the analysis even though the samples contain high quantities of base metals (see Table 3).
The calibration curves and all relevant statistics of those calibrations can be checked by accessing the Calibration Details page on the Concentrations page of the LabBook. The calibration curve in Figure 3 shows that the wavelength is absolutely linear to at least 10 mg·kg-1 for this calibration. In fact, this particular wavelength on the iCAP 7000 Plus Series ICP-OES is linear to much greater ranges. When analyzing standard concentrations ranging from 4 mg·kg-1 to at least 500 mg·kg-1 in radial view the calibration curve is still perfectly linear.
Figure 3. Calibration graph and details of calibration for Pt 265.945 nm.
The results in Table 4 show that the results are very accurate when compared to the accepted value. However, the individual aliquots exhibit variation from the mean due to inhomogeneity in the sample with regards to some of the elements.
Table 4. Analysis results as well as expected concentration and boundaries of 2 standard deviations (SD) in mg·kg-1.
For Research Use Only. Not for use in diagnostic procedures. ©2017 Thermo Fisher Scientific Inc. All rights reserved. Tygon is a trademark of Saint-Gobain Corporation. All other trademarks are the property of Thermo Fisher Scientific and its subsidiaries. This information is presented as an example of the capabilities of Thermo Fisher Scientific products. It is not intended to encourage use of these products in any manner that might infringe the intellectual property rights of others. Specifications, terms and pricing are subject to change. Not all products are available in all countries. Please consult your local sales representative for details. AN40894-EN 0817
Find out more at thermofisher.com/ICP-OES
Conclusion The data shown in Table 4 demonstrates that the results are well within the PGM producer’s in-house accuracy boundaries. The boundaries are based on sound statistical principles using 2 standard deviations of a mean. This mean was generated by repeated “Round Robin” analysis of these samples by numerous different laboratories in the same group of companies. The simultaneous analysis of the PGM samples was comparatively simple with the high-resolution and full wavelength coverage capabilities of the Thermo Scientific iCAP 7000 Plus Series ICP-OES. The results are excellent even though the plasma conditions were not specifically optimized with the Plasma Optimization feature of the Qtegra ISDS Software. Background and peak selection was simplified by dragging and dropping the measured regions in the subarray.
References1. http://minerals.usgs.gov/minerals/pubs/commodity/platinum/
The iCAP 7400 ICP-OES Duo shows its versatility by analyzing samples with high concentrations of base metals while still achieving low detection limits and high accuracy. Traditionally, this application would have been performed on a radial instrument but the iCAP 7400 ICP-OES Duo has shown that it can perform excellently in high concentration matrices as well.