Analysis of Pipeline and Hazardous Materials Safety...
32
Analysis of Pipeline and Hazardous Materials Safety Administration Proposed New Safety Rules Pipeline Blowdown Emissions and Mitigation Options June 2016 CONCORD, MA - WASHINGTON, DC 47 JUNCTION SQUARE DRIVE CONCORD, MA 01742 978-405-1275 www.mjbradley.com
Transcript of Analysis of Pipeline and Hazardous Materials Safety...

Analysis of Pipeline and Hazardous
Materials Safety Administration
Proposed New Safety Rules
Pipeline Blowdown Emissions
and Mitigation Options June 2016
CONCORD, MA - WASHINGTON, DC
47 JUNCTION SQUARE DRIVE CONCORD, MA 01742
978-405-1275
www.mjbradley.com

AUTHORS: Dana Lowell, Brian Jones, David Seamonds, and Pye Russell
M.J. Bradley & Associates LLC
PREPARED BY: M.J. Bradley & Associates LLC
47 Junction Square Drive
Concord, MA 01742
(978) 405-1275
FOR SUBMISSION TO:
Environmental Defense Fund 123 Mission St, 28th Floor San Francisco, CA 94105
Pipeline Safety Trust 300 N. Commercial St., Suite B Bellingham, WA 98225
About M.J. Bradley & Associates LLC
M.J. Bradley & Associates LLC (MJB&A) provides strategic and technical advisory services to address
critical energy and environmental matters including: energy policy, regulatory compliance, emission
markets, energy efficiency, renewable energy, and advanced technologies.
Our multi-national client base includes electric and natural gas utilities, major transportation fleet
operators, clean technology firms, environmental groups and government agencies.
We bring insights to executives, operating managers, and advocates. We help you find opportunity in
environmental markets, anticipate and respond smartly to changes in administrative law and policy at
federal and state levels. We emphasize both vision and implementation, and offer timely access to
information along with ideas for using it to the best advantage.
Pipeline Blowdown Emissions & Mitigation Options
3 | P a g e
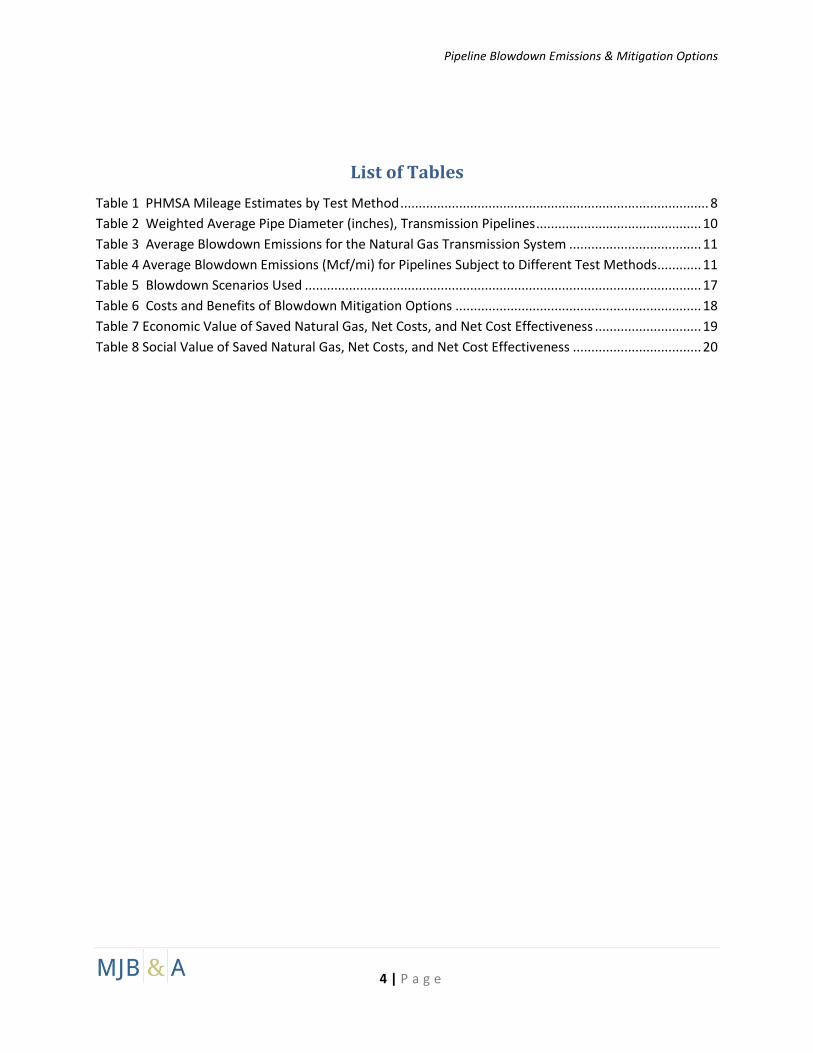
Table of Contents
Executive Summary ....................................................................................................................................... 5
1 Background – Proposed PHMSA Rules ................................................................................................. 7
2 Estimated Blowdown Emissions ........................................................................................................... 9
2.1 Pipe Diameter ............................................................................................................................... 9
2.2 Pipeline Operating Pressure ....................................................................................................... 10
2.3 Average per-Mile Blowdown Emissions ...................................................................................... 11
2.4 Blowdown Mileage ..................................................................................................................... 12
2.5 Total Blowdown Emissions ......................................................................................................... 13
3 Blowdown Mitigation Options ............................................................................................................ 14
3.1 Description of Mitigation Options .............................................................................................. 14
3.1.1 Flaring .................................................................................................................................. 14
3.1.2 Pressure Reduction with In-Line Compressors ................................................................... 14
3.1.3 Pressure Reduction with Mobile Compressors ................................................................... 15
3.1.4 Transfer of Gas to Low Pressure System ............................................................................. 16
3.1.5 Isolate Small Section Using Stopples .................................................................................. 16
3.2 Blowdown Mitigation Costs & Benefits ...................................................................................... 17
3.3 Sensitivity Analysis ...................................................................................................................... 20
3.4 Summary/Conclusions ................................................................................................................ 23
REFERENCES ................................................................................................................................................ 25
APPENDIX A ................................................................................................................................................. 27
APPENDIX B ................................................................................................................................................. 29
APPENDIX C ................................................................................................................................................. 32
List of Figures
Figure 1 Net Cost of Blowdown Mitigation Using In-line Compression versus Blowdown Mileage .......... 22
Figure 2 Net Cost of Blowdown Mitigation Using Mobile Compressor versus Blowdown Mileage ........... 22
Figure 3 Net Cost of Blowdown Mitigation Using Mobile Compressor versus natural Gas Value ............. 23
Figure 4 Blowdown Emission (Mcf/mi) Versus Pipe Diameter and Pressure ............................................ 28
Pipeline Blowdown Emissions & Mitigation Options
4 | P a g e
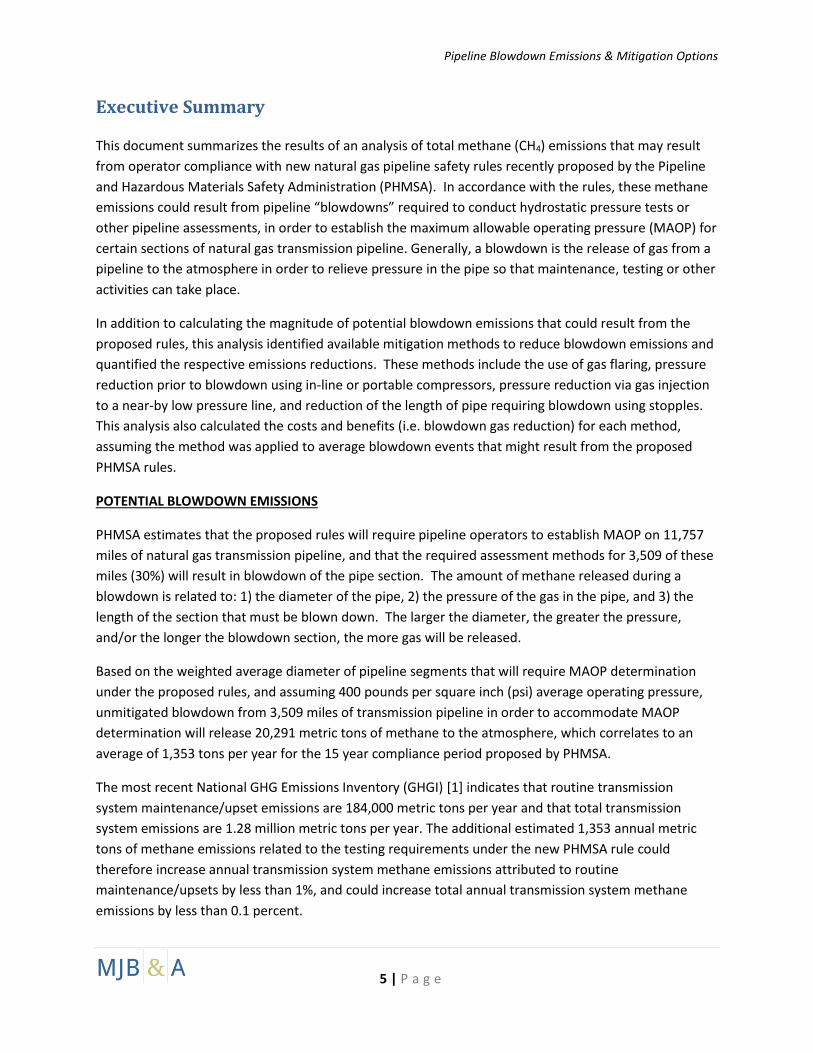
List of Tables
Table 1 PHMSA Mileage Estimates by Test Method .................................................................................... 8
Table 2 Weighted Average Pipe Diameter (inches), Transmission Pipelines ............................................. 10
Table 3 Average Blowdown Emissions for the Natural Gas Transmission System .................................... 11
Table 4 Average Blowdown Emissions (Mcf/mi) for Pipelines Subject to Different Test Methods............ 11
Table 5 Blowdown Scenarios Used ............................................................................................................ 17
Table 6 Costs and Benefits of Blowdown Mitigation Options ................................................................... 18
Table 7 Economic Value of Saved Natural Gas, Net Costs, and Net Cost Effectiveness ............................. 19
Table 8 Social Value of Saved Natural Gas, Net Costs, and Net Cost Effectiveness ................................... 20
Pipeline Blowdown Emissions & Mitigation Options
5 | P a g e
Executive Summary
This document summarizes the results of an analysis of total methane (CH4) emissions that may result
from operator compliance with new natural gas pipeline safety rules recently proposed by the Pipeline
and Hazardous Materials Safety Administration (PHMSA). In accordance with the rules, these methane
emissions could result from pipeline “blowdowns” required to conduct hydrostatic pressure tests or
other pipeline assessments, in order to establish the maximum allowable operating pressure (MAOP) for
certain sections of natural gas transmission pipeline. Generally, a blowdown is the release of gas from a
pipeline to the atmosphere in order to relieve pressure in the pipe so that maintenance, testing or other
activities can take place.
In addition to calculating the magnitude of potential blowdown emissions that could result from the
proposed rules, this analysis identified available mitigation methods to reduce blowdown emissions and
quantified the respective emissions reductions. These methods include the use of gas flaring, pressure
reduction prior to blowdown using in-line or portable compressors, pressure reduction via gas injection
to a near-by low pressure line, and reduction of the length of pipe requiring blowdown using stopples.
This analysis also calculated the costs and benefits (i.e. blowdown gas reduction) for each method,
assuming the method was applied to average blowdown events that might result from the proposed
PHMSA rules.
POTENTIAL BLOWDOWN EMISSIONS
PHMSA estimates that the proposed rules will require pipeline operators to establish MAOP on 11,757
miles of natural gas transmission pipeline, and that the required assessment methods for 3,509 of these
miles (30%) will result in blowdown of the pipe section. The amount of methane released during a
blowdown is related to: 1) the diameter of the pipe, 2) the pressure of the gas in the pipe, and 3) the
length of the section that must be blown down. The larger the diameter, the greater the pressure,
and/or the longer the blowdown section, the more gas will be released.
Based on the weighted average diameter of pipeline segments that will require MAOP determination
under the proposed rules, and assuming 400 pounds per square inch (psi) average operating pressure,
unmitigated blowdown from 3,509 miles of transmission pipeline in order to accommodate MAOP
determination will release 20,291 metric tons of methane to the atmosphere, which correlates to an
average of 1,353 tons per year for the 15 year compliance period proposed by PHMSA.
The most recent National GHG Emissions Inventory (GHGI) [1] indicates that routine transmission
system maintenance/upset emissions are 184,000 metric tons per year and that total transmission
system emissions are 1.28 million metric tons per year. The additional estimated 1,353 annual metric
tons of methane emissions related to the testing requirements under the new PHMSA rule could
therefore increase annual transmission system methane emissions attributed to routine
maintenance/upsets by less than 1%, and could increase total annual transmission system methane
emissions by less than 0.1 percent.

Pipeline Blowdown Emissions & Mitigation Options
6 | P a g e
BLOWDOWN MITIGATION OPTIONS
Using the five blowdown mitigation options investigated, pipeline operators could reduce blowdown
methane emissions by 50% to 90%. Estimated out of pocket costs for blowdown mitigation, as applied
to projects associated with MAOP determination, will average between $17 per metric ton (MT) and
$1,161/MT of avoided methane emissions. The most cost effective option is use of in-line compression,
followed by transfer of gas to a low pressure system, and flaring, with costs ranging from $17/MT to
$32/MT. Use of a mobile compressor is significantly more expensive than these other options, at
$127/MT to $232/MT, but the use of stopples is by far the most expensive option ($613/MT to
$1,161/MT).
However, for all mitigation options except flaring and the use of stopples, the economic value of the
natural gas that is saved is greater than the cost of mitigation, resulting in net cost savings to the
pipeline operator. Transfer of gas to a low pressure system creates the highest net savings per event,
while in-line compression creates the highest net savings per ton of methane mitigated. Net savings
from blowdown mitigation ranges from $77/MT to $188/MT of methane saved.
Additionally, there is a social benefit to avoiding methane emissions from pipelines via blowdown
mitigation. This value, associated with the avoided future climate damages of methane emissions, does
not accrue to the pipeline operator, but to society at large.
The societal benefits of reducing blowdown methane emissions are significantly greater than mitigation
costs for every mitigation option investigated. Net societal benefits range from $524/MT to $1,665/MT
of avoided emissions. This analysis indicates that mitigating blowdown emissions associated with MAOP
determination to comply with the proposed rules would yield net societal benefits of $13 million or
more.
Pipeline Blowdown Emissions & Mitigation Options
7 | P a g e
1 Background – Proposed PHMSA Rules
On April 8, 2016 PHMSA issued a Notice of Proposed Rule Making related to Safety of Gas Transmission
and Gathering Pipelines [2]. The proposed changes to existing pipeline safety rules include a
requirement for pipeline operators to establish, or re-establish, maximum allowable operating pressure
(MAOP) for certain sections of transmission pipeline for which MAOP had not previously been
established, or for which the prior methods used to establish MAOP are deemed inadequate. The
specific sections of pipeline for which PHMSA is proposing that MAOP must now be established include:
Pre-1970 pipe in high consequence areas (HCA)1 that operates at greater than 20% of specified minimum yield strength (SMYS)2.
Any pipe in an HCA, or in a Class 3 or 43 non-HCA, for which PHMSA has “inadequate records” on MAOP.
Any pipe in a Class 3 or 4 area which has never been tested.
Pipe in newly designated “medium consequence areas” (MCA)4.
PHMSA’s pipeline safety rules that require the establishment of MAOP using specific test methods were
first issued in the 1970’s, and at that time existing (pre-1970) pipe was grandfathered, so much of that
pipe has never been tested to establish MAOP.
Based on data submitted annually by pipeline operators, PHMSA determined that 11,757 miles of
transmission pipeline (out of a total of 297,885 on-shore miles) would be subject to the proposed new
requirements to establish, or re-establish, MAOP. PHMSA allows three different assessment methods to
establish MAOP: 1) inline inspection (ILI), 2) hydrostatic pressure testing (PT), and 3) direct assessment
(DA).
In-line inspection involves the use of in-line inspection tools (“smart pigs”) that are inserted inside the
pipeline and which measure and record data on interior pipe condition as they move through the pipe.
ILI does not directly require gas to be removed from the pipe (i.e. does not require blowdown);
however, to use ILI the specific section of pipeline must be equipped with launcher and receiver ports
1 High Consequence Areas are specific locations designated by PHMSA where a pipeline gas release could have the most significant adverse consequences. HCAs are defined as locations where the “potential impact circle” from a pipeline incident contains: 20 or more structures intended for human occupancy; buildings that would be hard to evacuate (e.g., nursing homes, schools); or buildings and outside areas occupied by more than 20 persons on a specified minimum number of days each year. 2 SYMS is the “specified minimum yield strength” of a pipe, which is based on the dimensions of the pipe and its material properties. SYMS is an indication of the minimum stress a pipe may experience that will cause permanent deformation. The higher the pressure at which a pipe operates the higher the percentage of SMYS. 3 PHMSA divides all areas along pipelines into Classes based on the density of buildings within 220 yards on either side of the center line of the pipe. Class 3 areas are those with more than 46 buildings per mile intended for human occupancy in this zone. Class 4 areas are those where buildings with four or more stories above ground are prevalent. 4 The proposed definition of Medium Consequence Areas is locations where the “potential impact circle” from a pipeline incident contains 5 or more structures intended for human occupancy.

Pipeline Blowdown Emissions & Mitigation Options
8 | P a g e
for the in-line tools, and not all pipelines are currently equipped with a launcher and receiver.
Upgrading a non-equipped section of pipeline for ILI would involve blowdown of some portion of the
affected section in order to install the launcher and receiver ports on the pipe.
Hydrostatic pressure testing requires a pipeline section to be isolated and blown down, after which the
section is filled with water and pressurized to a specific test pressure, then held at that pressure for a
specified period of time.
Direct assessment is based on collection and analysis of various data which is then used to calculate
MAOP based on engineering calculations. Establishment of MAOP using direct assessment does not
require blowdown of the pipe section.
Using data submitted annually by pipeline operators, and judgement based on industry experience,
PHMSA estimates that MAOP for 70% of the pipe mileage subject to the proposed requirements to
establish MAOP will be determined either by using direct assessment or by using ILI on segments already
ILI-equipped. PHMSA estimates that pipeline operators will establish MAOP using hydrostatic pressure
testing for 1,283 miles of pipe (11%), and that the remaining 2,226 miles (19%) of pipe subject to the
new rules will be upgraded to be ILI capable, after which ILI will be used to establish MAOP. See Table 1
for a summary of PHMSA’s analysis.
Table 1 PHMSA Mileage Estimates by Test Method
Interstate Intrastate TOTAL
Mileage for Which MAOP will be established by
Pressure Test 197 1,086 1,283
ILI Upgrade 578 1,648 2,226
TOTAL 776 2,733 3,509
Source: PHMSA, Regulatory Impact Assessment, Notice of Proposed Rulemaking- Pipeline Safety: Safety of Gas
Transmission and Gathering Pipeline, March 2016.
PHMSA estimates that a total of 3,509 miles of pipe will therefore have MAOP established based on
methods that will require pipeline blowdown (e.g. pressure test or ILI upgrade). PHMSA is proposing to
allow industry 15 years to accomplish this testing. In order to comply with the proposed rules
approximately 234 miles of pipe per year will need to have MAOP established based on methods that
will require pipeline blowdown.
MJB&A has fully reviewed the methodology used by PHMSA to calculate these values, including verifying
many of the baseline assumptions based on review and analysis of the underlying data from which they
were developed. The reviewed assumptions include industry reported mileage of previously untested
pipe by type (interstate, intrastate) location (HCA, non-HCA) and pressure (% SMYS); and historical data
on miles of pipe for which MAOP was determined with different test methods. Based on our review we

Pipeline Blowdown Emissions & Mitigation Options
9 | P a g e
believe that, within the constraints of available information, this is an accurate assessment of pipeline
mileage that will require MAOP to be established based on methods requiring pipeline blowdown.
2 Estimated Blowdown Emissions
See Appendix A for the equation used to calculate potential blowdown emissions for this analysis5. In
accordance with this calculation, the amount of methane released during a blowdown is proportional to:
1) the cross sectional area of the pipe, 2) the pressure of the gas in the pipe, and 3) the length of the
section that must be blown down. The larger the pipe diameter, the greater the pressure, and/or the
longer the blowdown section, the more gas will be released.
The natural gas transmission pipeline system is highly varied: pipe diameters range from less than four
inches to more than 48 inches, and operating pressures range from 200 to 1500 pounds per square inch
(PSI). As such, the magnitude of blowdown emissions (per mile of pipe) will vary significantly across the
system. The approach taken by PHMSA in the proposed rule regulatory impact assessment to calculate
total blowdown emissions that would result from the proposed rules was to calculate average per-mile
blowdown emission (thousand cubic feet per mile, Mcf/mi) based on the weighted average pipe
diameter and pressure of the sections of pipe which will require blowdown to establish MAOP, and to
multiply this by the length (miles) of these sections. MJB&A has reviewed PHMSA’s methodology and
believe that it is a valid approach, but there are some significant uncertainties associated with the values
chosen for some key assumptions, especially the values for weighted average pressure and pipeline
blowdown length.
As such, each of these major assumptions required to calculate blowdown emissions (pipe diameter,
pressure, and pipe length) are discussed separately below, followed by a discussion of the magnitude of
potential blowdown emissions that result from these assumptions.
2.1 Pipe Diameter
Using data submitted annually to PHMSA by pipeline operators [4] it is possible to calculate the
weighted average pipe diameter for interstate and intrastate transmission pipelines in various size bins,
as well as the percentage of pipeline mileage which falls into each bin, as shown in Table 2.
As shown, interstate pipelines have, on average, a slightly larger diameter (22 inches) than intrastate
pipelines (15.2 inches). The values shown in Table 2 for over-all weighted average pipe diameter were
used by PHMSA to calculate blowdown emissions from the proposed regulations; these are also the
values used in this analysis.
While individual sections of interstate or intrastate transmission pipeline that would be subject to the
proposed regulations might have significantly different diameter than the values shown in Table 2, these
5 MJB&A used the same equation that was used by PHMSA to calculate blowdown emissions for the Regulatory Impact Assessment, with only minor modification. See Appendix A.

Pipeline Blowdown Emissions & Mitigation Options
10 | P a g e
values are appropriate for calculating average emissions (Mcf/mi) and total emissions that could result
from the need to establish MAOP under the proposed regulations.
Table 2 Weighted Average Pipe Diameter (inches), Transmission Pipelines
Size Bin
Interstate Intrastate
WTD AVG Diameter
[in]
% of Pipeline Mileage
WTD AVG Diameter
[in]
% of Pipeline Mileage
< 12 inches 8.0 27% 8.2 56%
12 – 34 inches 24.3 57% 21.7 37%
>34 inches 37.8 16% 38.7 7%
OVERALL WTD AVG 22.0 15.2
Source: PHMSA, Regulatory Impact Assessment, Notice of Proposed Rulemaking- Pipeline Safety: Safety of Gas
Transmission and Gathering Pipeline, March 2016.
2.2 Pipeline Operating Pressure
PHMSA used a value of 400 pounds per square inch (psi) as the weighted average operating pressure of
the pipeline sections, both interstate and intrastate, that would need to be blown down to establish
MAOP. There is little information in PHMSA’s RIA document to justify this value, however a PHMSA
representative indicated that it was based on conversations with industry representative and
“professional judgement”.
MJB&A was not able to independently verify the accuracy of this value for weighted average operating
pressure, due to a lack of publicly available data. The data submitted annually to PHMSA by pipeline
operators does not include direct information about pipeline operating pressure6. Numerous industry
publications reference the range of operating pressures for the natural gas transmission system as 200
psi to 1500 psi [5], but none give information about what percentage of pipeline mileage operates at
each pressure. Discussion with representatives of several different pipeline operators confirmed the
above range of values for operating pressure, but did not uncover any data source that could be used to
independently calculate a system-wide weighted average pressure. One operator indicated that it
thought the average pressure of its system was closer to 800 psi, but this was based on a general
6 This information includes data on the percentage of pipe operating at various percentages of SMYS, which could be used to back-calculate operating pressure if it could be correlated to pipe diameter. However, the structure of the PHMSA database that contains this information does not allow for this calculation.

Pipeline Blowdown Emissions & Mitigation Options
11 | P a g e
impression not a specific analysis of data. Another operator indicated that the operating pressures in its
system varied widely, but might average to between 400 psi and 600 psi.
Given the lack of data that could be used to support the choice of a different assumption, for this
analysis MJB&A has used PHMSA’s assumption of 400 psi as the average operating pressure of pipeline
sections that would need to be blown down to establish MAOP to comply with the proposed
regulations. See section 3.3 (sensitivity analysis) and Appendix A for a discussion of how different
pressure assumptions would affect the results.
2.3 Average per-Mile Blowdown Emissions
Using the assumptions for average pipe diameter and average operating pressure discussed above,
MJB&A used the equation shown in Appendix A to calculate average blowdown emissions for the
interstate and intrastate transmission system (Mcf/mi). These values are shown in Table 3. Table 3
includes values for the volume of natural gas released (Mcf/mi) as well as the mass of methane (metric
tons per mile, MT/mi) released.7 As shown, average blowdown emissions will be higher from interstate
pipelines than from intrastate pipelines due their larger weighted average diameter.
See Table 4 for a summary of estimated average blowdown emissions (Mcf/mi) from sections of pipeline
that will have MAOP established based on pressure testing and ILI upgrade; these values were
calculated by applying the values shown in Table 2 to PHMSA’s estimates of interstate and intrastate
pipeline mileage that would be subject to each test method (Table 1). Also shown in Table 4 are the
equivalent values calculated and reported in PHMSA’s regulatory impact assessment [6].
Table 3 Average Blowdown Emissions for the Natural Gas Transmission System
Interstate Intrastate
Average Blowdown Emissions
Natural Gas (Mcf/mi) 443.1 234.2
Methane (MT/mi) 9.1 4.8
Source: MJB&A Analysis.
Table 4 Average Blowdown Emissions (Mcf/mi) for Pipelines Subject to Different Test Methods
Pressure Test ILI Upgrade WTD AVG
Average Blowdown Emissions
MJB&A Analysis (Mcf/mi) 266.3 288.5 280.4
PHMSA Analysis (MT/mi) 297.3 316.0 309.8
Source: PHMSA RIA, MJB&A Analysis.
7 The methane calculation assumes that natural gas will, on average be 95.7% methane and have a density of 21.6 g/scf. These are the same assumptions used by PHMSA.

Pipeline Blowdown Emissions & Mitigation Options
12 | P a g e
As shown in Table 4, the values calculated by MJB&A for average blowdown emissions (Mcf/mi) by test
method are approximately 10% lower than the values calculated by PHMSA. This difference is explained
by the use of a higher gas compressibility factor and potential differences in how temperatures and
pressures were applied in the blowdown calculation; see Appendix A.
2.4 Blowdown Mileage
In the regulatory impact assessment for the proposed rule, PHMSA multiplied the values shown in Table
3 (average Mcf/mi) times the mileage shown in Table 1 to calculate total blowdown emissions from the
proposed regulations. This implies that regardless of test method (pressure test or ILI upgrade)
establishment of MAOP for one mile of pipe will require one mile of pipe to be blown down; however,
this is not necessarily true given the complexity of the pipeline system and the practical constraints
imposed by system layout. There are situations in which pressure testing would require more than one
mile of pipe to be blown down per mile tested. Conversely, upgrading a section of pipe to accept ILI
tools so that ILI can be used to establish MAOP may require significantly fewer miles to be blown down
than the miles ultimately tested by ILI.
In order to blowdown a section of pipe, that section must be isolated from upstream and downstream
pipe sections by closing valves. Valve spacing varies across the system but is generally ten to twenty
miles between valves [17]. This means that, without installing a new temporary valve (see Section 3),
the minimum distance that can be blown down in order to allow for establishment of MAOP using
pressure testing is 10 – 20 miles (i.e. the valve spacing on that segment of pipeline). As such, if only a
two-mile section of pipe between valves needed to be pressure tested (for example because it was pre-
1970 pipe in an HCA) but the rest of the section between the valves did not need to be tested (because
it was not in an HCA), then the total miles that would need to be blown down to accommodate the
pressure testing could be five to ten times longer than the actual pressure test mileage.
Upgrading a pipeline to accept ILI tools requires adding a launcher port, and a receiver port further
downstream, so that a smart pig can be inserted and removed. If MAOP needed to be determined on a
very long section of pipe, say 100 miles, then it might be possible to accommodate this testing via ILI
upgrade by blowing down as little as 20 miles of pipe (one section between valves on either end),
resulting in blowdown emissions from as little as 20% of the pipe mileage that was ultimately tested to
determine MAOP.
Unfortunately it is very difficult to determine the average blowdown mileage per mile of pipe for which
MAOP must be determined. As noted above, in the regulatory impact assessment PHMSA implicitly
assumes a one-to-one correlation (one mile of blowdown per mile of pipe for which MAOP must be
determined). However, PHMSA does not provide any justification or discussion about this assumption.
Absent better information, this analysis is consistent with PHMSA’s regulatory impact assessment;
estimated total blowdown emissions discussed below are based on 3,509 miles of blowdown, to
accommodate MAOP determination on 3,509 miles of transmission pipeline.

Pipeline Blowdown Emissions & Mitigation Options
13 | P a g e
2.5 Total Blowdown Emissions
Based on the assumptions discussed in sections 2.1 – 2.4, MJB&A estimates that PHMSA’s proposed
regulations requiring MAOP determination on various transmission pipeline segments will result in
20,291 metric tons of methane being released to the atmosphere as blowdown emissions, if pipeline
operators do not implement blowdown mitigation measures. Annual additional blowdown emissions
resulting from the proposed rule would average 1,353 tons per year for 15 years. This estimate is within
10% of PHMSA’s estimate as presented in the regulatory impact assessment.
As noted in Sections 2.1- 2.4, there is significant uncertainty associated with two key assumptions used
to derive this estimate, namely the weighted average pressure at which the affected pipeline segments
operate, and the ratio of blowdown mileage to mileage for which MAOP must be determined. As such,
this estimate may understate total blowdown emissions, since the actual weighted average pressure at
which affected pipeline segments operate could be higher than assumed here. Alternately this estimate
may overstate total blowdown emissions by overstating the miles of pipeline that would be required to
be blown down to establish MAOP. See section 3.3 below (sensitivity analysis).
In addition, as noted by PHMSA pipeline operators “are already required to complete integrity
management assessments of HCA segments under Subpart O of the Pipeline Safety Regulations. The
MAOP re-verification tests required under the proposed rule [in subpart L] would fulfil the operator’s
obligation to complete integrity management assessments”8. As such, up to 93%9 of the blowdown
emissions estimated here would likely be required at some point under existing rules, in order for
pipeline operators to fulfill existing integrity management obligations, and would therefore not
represent an absolute increase in emissions attributable specifically to the currently proposed
rules. The proposed rules will, however, likely shift some emissions from later to earlier years based on
PHMSA’s proposed completion date for testing under the new rules.
To put this estimate of blowdown emissions in perspective, the 2014 National Inventory of Greenhouse
Gases and Sinks [1] indicates that total methane emissions from the natural gas sector were 7.05 million
metric tons in 2014. Of these, 1.28 million metric tons (18%) were from the natural gas transmission
and storage segment. Of the emissions from the transmission and storage segment, 184,000 metric
tons (0.014%) were from “routine maintenance/upsets” (i.e. blowdowns).
This analysis indicates that PHMSA’s proposed rule could increase annual transmission system methane
emissions attributed to routine maintenance/upsets by less than 1%, and could increase total annual
transmission system methane emissions by less than 0.1 percent.
8 PHMSA Preliminary Regulatory Impact Assessment, Pg. 45 9 Approximately 7% of the estimated blowdown emissions are associated with MAOP determination in the newly designated MCAs, which currently do not require integrity management assessments under subpart O.

Pipeline Blowdown Emissions & Mitigation Options
14 | P a g e
3 Blowdown Mitigation Options
Based on a literature review and discussion with industry representatives, MJB&A identified five options
that a pipeline operator could use to mitigate pipeline blowdown emissions. Using these methods, an
operator could reduce total blowdown methane emissions by 50% - 90%. This section provides a brief
description of each option and discusses an analysis of the costs and benefits if applied to blowdowns
associated with determination of MAOP for transmission pipelines, to comply with PHMSA’s proposed
new safety rules.
3.1 Description of Mitigation Options
Each of the five blowdown mitigation options is described briefly below.
3.1.1 Flaring
Rather than venting natural gas released from a pipeline to the atmosphere, the gas can be combusted
in a flare. Mobile flares (trailer or skid-mounted) designed for temporary use are commercially available
for this purpose. The capital costs for a flare sized to handle the volume from a 12 to 36 inch
transmission pipeline range from $10,000 to $50,000, and annual maintenance costs could be $1,000
per year [7] [8] [9] [10]. Set-up and removal of the flare will take approximately eight man-hours, and
one to two people will be required to be present while the flare is operating [10].
Flaring operations for a ten mile section of transmission pipeline could take 10 - 30 hours, depending on
starting pressure level and flare size. In practical terms a flare can reduce pipeline pressure down to 10
– 20 psi, resulting in a 95% pressure reduction from a 400 psi starting pressure. Methane destruction
efficiency of flares ranges from 95% to 98%, for a net reduction in blowdown methane emissions of up
to 95%. For every metric ton of methane destroyed in the flare 2.75 tons of carbon dioxide (CO2) is
produced; net GHG reductions in carbon dioxide equivalents (CO2-e) would therefore be as high as 95%
compared to releasing the natural gas to the atmosphere.10
3.1.2 Pressure Reduction with In-Line Compressors
The pressure in a section of pipeline can be reduced from normal operating pressure, prior to
blowdown, by continuing to operate downstream compressors after the upstream valve has been closed
to isolate the section. The pressure can only be reduced to the minimum suction pressure of existing
downstream in-line compressors, which is often about 50% of operating pressure for the line. As such,
the practical reduction in blowdown methane emissions that can be achieved using in-line compression
is often approximately 50% [11].
Using in-line compression to reduce pressure prior to blowdown does not require any new capital
equipment and does not incur any labor costs for set up. However, there are costs associated with
10 Assuming a GWP20 of 84, consistent with the 20-year GWP for methane in the most recent IPCC report (AR5). Using a value of 25 for GWP100, per the current EPA GHG inventory, the net reductions in CO2-e would be 87%.

Pipeline Blowdown Emissions & Mitigation Options
15 | P a g e
planning for the event and for monitoring system pressure during pump down. The duration of pump
down for a ten mile section of transmission pipeline could be 5 - 30 hours, depending on starting
pressure level, in-line compressor size, and system layout. Note that while valve spacing on pipelines is
typically 10 – 20 miles, compressor stations are typically 50 to 100 miles apart. As such, a much longer
section of pipe may need to be pumped down than the section of pipe which is ultimately isolated and
vented. This affects both the time required for pump down, as well as the amount of fuel used by the
in-line compressors for the pump down.
Many compressors on the natural gas transmission system are powered by natural gas from the pipeline
on which they operate. In most cases, the volume of natural gas used by in-line compressors to reduce
operating pressure prior to blowdown would be significantly less that the volume of gas that would
otherwise have been released to the atmosphere if the pump down had not taken place. As such, there
is no net “cost” associated with this fuel, but it does reduce the “savings” associated with the economic
value of the retained natural gas (not blown down).
3.1.3 Pressure Reduction with Mobile Compressors
After a section of pipeline is isolated by valves, and prior to blowdown, the pressure in the line can be
reduced from normal operating pressure by using a mobile compressor(s) to pump gas from that section
to a downstream section of the pipeline.
The necessary mobile compressor(s) can be skid, truck, or trailer mounted. A typical set-up sized for use
on a transmission pipeline might include an 8,500 scfm compressor powered by a 750 kW natural gas
engine; such a system could cost $500,000 to $1.6 million, and annual maintenance costs could be
$10,000 [10] [11] [12] [13]. There is at least one service company that currently rents compression
equipment/provides temporary compression services to pipeline operators for this purpose [14].
Set up and removal of the mobile compressor equipment will take approximately 30 man-hours, and
two people will be required on-site for the duration of the pump down [10].
Pump down operations for a ten mile section of transmission pipeline using a mobile compressor could
take 5 - 20 hours, depending on starting pressure level and compressor size. Mobile compressors can
reduce pipeline pressure down to 80 – 90 psi (minimum suction pressure) [13], resulting in an 80%
pressure reduction from a 400 psi starting pressure, and an 80% reduction in blowdown methane
emissions.
These mobile compressors are typically powered by natural gas from the pipeline they are pumping
down. The volume of natural gas used by mobile compressors to reduce operating pressure prior to
blowdown will always be significantly less than the volume of gas that would otherwise have been
released to the atmosphere if the pump down had not taken place. As such, there is no net “cost”
associated with this fuel, but it does reduce the “savings” associated with the economic value of the
retained natural gas (not blown down).

Pipeline Blowdown Emissions & Mitigation Options
16 | P a g e
3.1.4 Transfer of Gas to Low Pressure System
In limited cases it may be possible to reduce the pressure in a section of transmission pipeline by
transferring the gas to a near-by transmission or distribution pipeline that operates at lower pressure, if
such a system is available. In this instance, pipeline pressure can only be reduced to the pressure of the
system being transferred to; for example, if the pipeline to be blown down operates at 400 psi and the
lower pressure system operates at 200 psi then blowdown emission could be reduced by 50% via the
transfer.
The required equipment (piping, valves, regulator) could cost $10,000 or more, and might take 10 man-
hours or more to set up and remove. At least one person would be required on-site for the duration of
the transfer, which could take 5 – 15 hours depending on the size of the systems [9] [15] [16].
3.1.5 Isolate Small Section Using Stopples
A small section of pipe between existing valves can be isolated using temporary isolation valves, or
stopples. In some instances this method could be employed to reduce total blowdown emissions by
reducing the length of pipe required to be blown down. For example, if a four mile section of pipe
needed to be pressure tested, but valves on that section of pipe were 16 miles apart, the entire 16-mile
section between valves would need to be blown down to accomplish the pressure testing. The use of
stopples to isolate only the section that required pressure testing, prior to blowdown, could therefore
reduce blowdown emissions by as much as 75%.
Capital costs for the required stopples and fittings could be as high as $90,000 depending on the size of
the pipeline, and much of this equipment can often only be used once [17]. Installation could take 50
man-hours or more, and requires specialized skills (i.e. welders).

Pipeline Blowdown Emissions & Mitigation Options
17 | P a g e
3.2 Blowdown Mitigation Costs & Benefits
This analysis evaluated the potential costs and benefits of the five blowdown mitigation options
discussed in Section 3.1, as applied to blowdowns that might be associated with MAOP determination in
accordance with the recently proposed PHMSA safety rules. In order to conduct this analysis we
developed a “typical” or “average” blowdown scenario which is consistent with the analysis of
blowdown emissions in Section 2.
The details of this blowdown scenario
are shown in Table 5. As shown, this
scenario assumes that an average
blowdown event would require
blowdown of 15 miles of pipeline,
which represents a typical distance
between valves on the pipeline system.
Based on the analysis described in
Section 2, the average interstate
pipeline segment subject to MAOP
determination would contain 443.1 Mcf
of natural gas per mile, so 6,647 Mcf of
gas would be blown down from a 15-
mile segment, releasing 137.1 metric
tons of methane to the atmosphere.
The economic value of this released gas
would be $27,982 dollars11 [18].
Consistent with the analysis in Section
2, a 15-mile blowdown event of an
average intrastate pipeline segment subject to MAOP determination would release only 72.4 MT of
methane to the atmosphere (worth $14,789) due to its smaller diameter.
Table 5 also shows the “Social Cost” of the methane released via blowdown, based on EPA analysis of
methane’s climate impacts12 [19]. Since the effects of methane in the atmosphere vary over time, the
net social cost varies significantly depending on one’s choice of discount rate. Table 5 includes a range
of values for the social cost of blown down methane, based on discount rates from 2.5% to 5%. As
11 This assumes that natural gas is worth $4.21/Mcf. This is the average value used by PHMSA in the Regulatory Impact Assessment. See section 3.3 (sensitivity analysis) for the effect of varying the gas value from $2.06/Mcf (current Henry Hub spot price) to $6.07/Mcf (average Henry Hub spot price over the next 15 years, as projected by the Energy Information Administration). 12 The values used for social cost of methane range from $685/MT (5% discount rate, average result) to $3,966/MT (3% discount rate, 95th percentile result). For this analysis EPA values for the years 2015 – 2030 were averaged, and escalated from 2012$ to 2016$ using the GDP Price Deflator Index. See Appendix C.
Table 5 Blowdown Scenarios Used
Source: MJB&A Analysis.
Interstate Intrastate
mi/event 15.0 15.0
Mcf/mi 443.1 234.2
Mcf/event 6,647 3,513
MT/mi 9.1 4.8
MT/event 137.1 72.4
$/mi $1,865 $986
$/event $27,982 $14,789
$/mi $6,256 $3,306
$/event $93,837 $49,595
$/mi $13,526 $7,149
$/event $202,892 $107,233
$/mi $17,632 $9,319
$/event $264,484 $139,786
$/mi $36,231 $19,149
$/event $543,460 $287,231
unitPipeline Type
Blowdown Length
Parameter
Blowdown Natural Gas
Volume
Blowdown Methane Mass
Blowdown Natural Gas
Economic Value
Social Cost of
Blowdown
Methane
5% AVG
3% AVG
2.5% AVG
3% 95th
Perc

Pipeline Blowdown Emissions & Mitigation Options
18 | P a g e
shown, the social cost varies from $94,000 to $543,000 per event for blowdowns from interstate
pipelines and from $50,000 to $287,000 per event for blowdowns from intrastate pipelines.
See Table 6 for a summary of the estimated out of pocket costs13 (not including the value of saved gas),
associated methane reductions, and the average mitigation cost per metric ton of the blowdown
mitigation options applied to the average blowdown scenarios shown in Table 5. The details of how
these costs and benefits were calculated are included in Appendix B. Note that the costs in Table 6 do
not account for the value of the saved gas or for the social cost benefits of methane reductions.
Table 6 Costs and Benefits of Blowdown Mitigation Options
MITIGATION OPTION
Cost
($/event)
Methane Reduction (MT/event)
Average Cost ($/MT)
Interstate Intrastate Interstate Intrastate Interstate Intrastate
Flaring $2,665 $2,014 123.7 65.4 $22 $31
In-line Compression $1,013 $710 61.2 32.3 $17 $22
Mobile Compressor $13,747 $13,282 108.3 57.3 $127 $232
Transfer to Low Pressure $1,309 $1,164 68.5 36.2 $19 $32
Stopples $63,059 $63,059 102.8 54.3 $613 $1,161
Source: MJB&A Analysis.
As shown, estimated out of pocket costs for blowdown mitigation, as applied to projects associated with
MAOP determination, will on average cost between $17/MT and $1,160/MT of avoided methane
emissions. The most cost-effective option is use of in-line compression, followed by transfer of gas to a
low pressure system, and flaring, with costs ranging from $17/MT to $32/MT. Use of a mobile
compressor is significantly more expensive than these other options, at $127 - $232/MT, but the use of
stopples is by far the most expensive option ($613 – $1,161/MT).
Note that the cost assumptions used to estimate mitigation costs are conservative. In particular, we
have assumed that mobile compressors would only be used 15 times per year. At this utilization level
amortized equipment costs account for 80% of the cost of mitigation using mobile compressors. Given
enough demand, a third party leasing company might be able to utilize a mobile compressor for 40 or
more mitigation events per year14. At this level of utilization the cost of blowdown mitigation using a
mobile compressor would fall to $63 - $112/MT.
13 Out of pocket costs include labor, capital, and maintenance costs for mitigation, before gas savings 14 As shown in Appendix B, this analysis assumes that mobile compressors used for blowdown mitigation would be leased from a third party, and that per-event lease costs would be sufficient to amortize capital costs and annual maintenance costs, based on 15 mitigation events per year, plus 50% for overhead and profit of the leasing company.

Pipeline Blowdown Emissions & Mitigation Options
19 | P a g e
See Table 7 for a summary of the private economic value of the natural gas that would be saved by the
various blowdown mitigation options, as well net costs and average net cost of methane mitigation
when this value is taken into account. Flaring converts to carbon dioxide the methane that would
otherwise be emitted to the atmosphere, so there is no value associated with saved gas for this option.
All other mitigation options keep gas in the pipeline that would otherwise be released, so these options
do “save” natural gas for which there is an associated private economic value. Note the net cost figures
in Table 7 do not include social cost benefits of methane reductions.
Table 7 Economic Value of Saved Natural Gas, Net Costs, and Net Cost Effectiveness
MITIGATION OPTION
Value of Saved Natural Gas
($/event)
Net Cost (Savings) of Methane Mitigation
($/event)
Average Net Cost
($/MT)
Interstate Intrastate Interstate Intrastate Interstate Intrastate
Flaring $0 $0 $2,665 $2,014 $22 $31
In-line Compression
$12,485 $6,599 ($11,473) ($5,889) ($188) ($182)
Mobile Compressor $22,115 $11,688 ($8,367) $1,594 ($77) $28
Transfer to Low Pressure
$13,991 $7,395 ($12,682) ($6,231) ($185) ($172)
Stopples $20,986 $11,092 $42,073 $51,967 $409 $956
Source: MJB&A Analysis.
As shown in Table 7, for all mitigation options except flaring, the use of mobile compressors on
intrastate pipelines, and the use of stopples, the private economic value of the natural gas that is saved
is greater than the cost of mitigation, resulting in net cost savings. Transfer of gas to a low pressure
system creates the highest net savings per event, while in-line compression creates the highest net
savings per ton of methane mitigated.
Given that transmission pipeline operators typically do not own the gas in their pipelines, it might be
assumed that they cannot accrue the benefit of saved gas from blowdown mitigation, but in most cases
operators actually can accrue these benefits. Pipeline operators earn a fixed fee for every unit of gas
transferred through their pipes, based on contracts with natural gas suppliers or marketers [17]. It is
understood by both parties that some gas will be lost during the process – through leaks or blowdowns,
or to power pipeline compressors. Delivery contracts therefore typically specify a loss rate. In the event
that the actual loss rate is higher than specified the pipeline operator must make up the difference to
account for gas not delivered. In the event that the actual loss rate is lower than specified the supplier
or marketer must pay the pipeline company for the extra gas that was delivered. In this way, pipeline
operators may recover the value of the natural gas that is retained in the pipeline via the
implementation of blowdown mitigation measures, either from avoiding fees for undelivered gas or via
compensation for extra gas delivered.

Pipeline Blowdown Emissions & Mitigation Options
20 | P a g e
If methane is retained in a pipeline via blowdown mitigation, rather than being emitted to the
atmosphere, there is social value associated with future damages not incurred because the methane
was not emitted. This value does not accrue to the pipeline operator, but to society at large.
See Table 8 for a summary of the social value associated with methane reductions from each mitigation
option as applied to the blowdown scenarios. The values in Table 8 are based on the social cost of
methane emissions calculated with a 3% discount rate. The net cost and cost-effectiveness figures in
Table 8 include both the social cost value and the saved gas value.
As shown, the societal benefits of reducing blowdown methane emissions are significantly greater than
mitigation costs, for every mitigation option. Net societal benefits are generally higher than $1,300/MT
of methane saved when using a discount rate of 3%. Even using the more conservative discount rate of
5%, net societal benefits are higher than $600/MT for all mitigation options except the use of stopples.
Table 8 Social Value of Saved Natural Gas, Net Costs, and Net Cost Effectiveness
MITIGATION OPTION
Social Value of Methane not Emitted
[3% discount rate]
($/event)
Net Cost (Savings) of Methane Mitigation
($/event)
Net Cost Effectiveness
($/MT)
Interstate Intrastate Interstate Intrastate Interstate Intrastate
Flaring $166,199 $87,840 ($163,534) ($85,826) ($1,322) ($1,313)
In-line Compression $89,521 $47,314 ($100,994) ($53,203) ($1,651) ($1,646)
Mobile Compressor $160,167 $84,652 ($168,534) ($83,058) ($1,556) ($1,451)
Transfer to Low Pressure
$101,446 $53,617 ($114,128) ($59,847) ($1,665) ($1,652)
Stopples $152,169 $80,425 ($110,096) ($28,457) ($1,071) ($524)
Source: MJB&A Analysis.
3.3 Sensitivity Analysis
The costs and benefits of blowdown mitigation discussed in Section 3.2 represent industry average costs
and benefits for all blowdowns that might be associated with MAOP determination on the pipeline
segments subject to PHMSA’s recently proposed safety requirements. As discussed in Section 3.2,
pressure reduction using either in-line compression or mobile compressors will, on average, produce net
cost savings for pipeline operators when the economic value of the natural gas that is saved is taken into
account.
However, individual projects may not produce net savings from blowdown mitigation depending on the
scope of the project. Differences in operating pressure, pipeline diameter, blowdown length, and
natural gas value will result in variable costs and benefits. See figures 1 - 3 which explore these trade-
offs.

Pipeline Blowdown Emissions & Mitigation Options
21 | P a g e
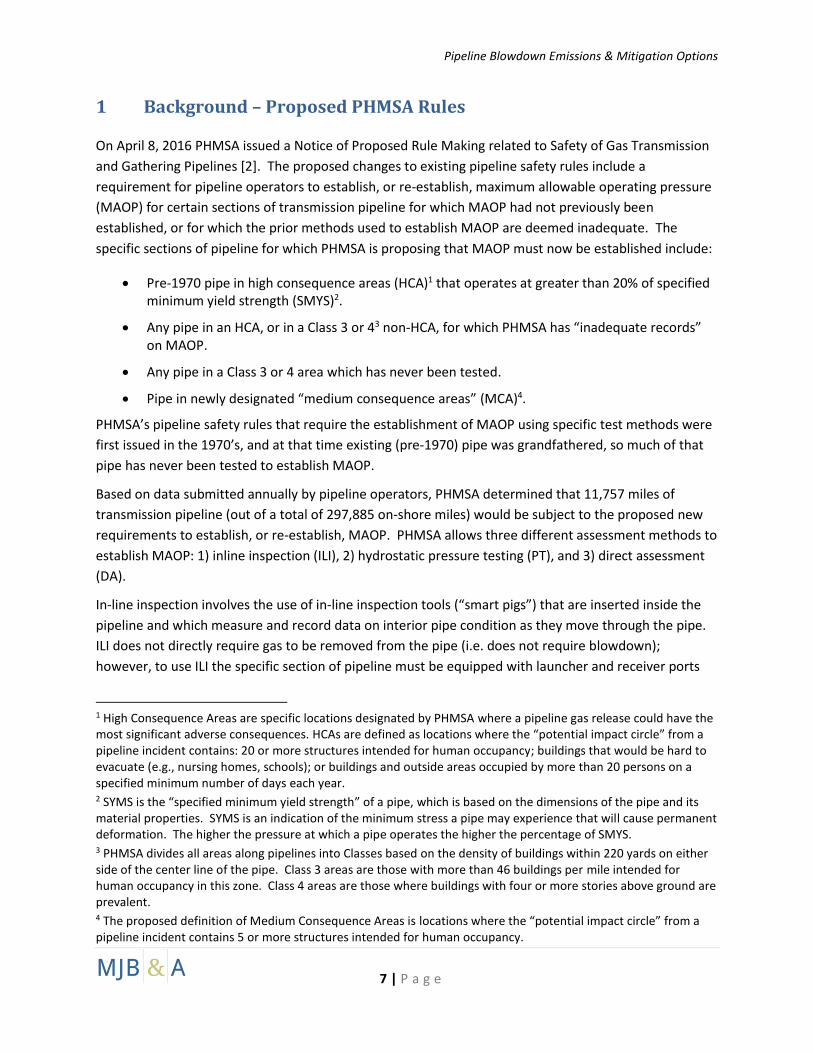
Figure 1 plots the net cost of blowdown mitigation using in-line compression ($/event) versus blowdown
mileage, for different diameter pipelines (18 inch and 24 inch) operating at different pressures (200 psi,
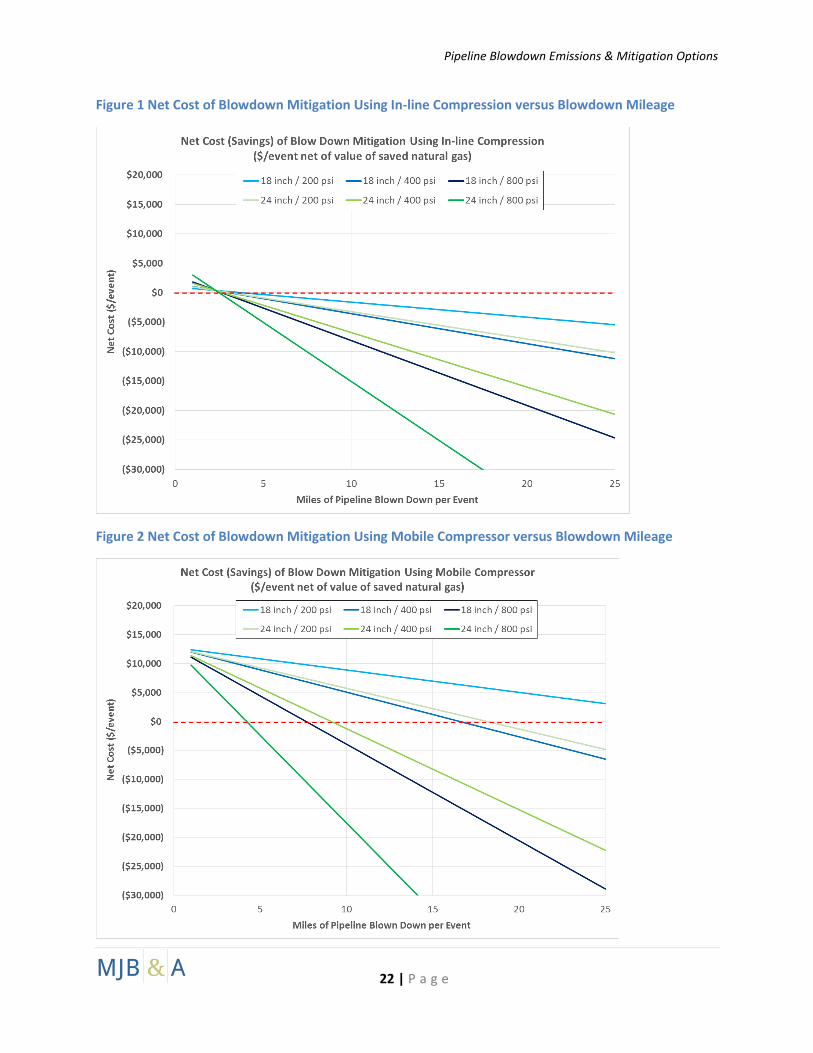
400 psi, and 800 psi), and assuming a gas value of $4.21/Mcf. Figure 2 plots the same data for
blowdown mitigation using mobile compressors.
Figure 3 plots the net cost of blowdown mitigation using mobile compressors versus blowdown mileage
at different gas values, for an 18-inch pipeline operating at 200 psi (worst case) and for a 24-inch
pipeline operating at 800 psi (best case). In Figure 3 the gas values vary from $2.06/Mcf (current value)
to $4.21/Mcf (value used by PHMSA) to $6.07/Mcf (projected average value over the next 15 years).
As shown in Figure 1, with a gas value of $4.21/Mcf, the “breakeven” point at which blowdown
mitigation using in-line compression will produce a net cost savings is between two and five miles of
blowdown mileage, for pipe diameters between 18 and 24 inches, and operating pressures between 200
and 800 psi.
Blowdown mitigation using mobile compressors has significantly different economics. For a 24 inch
pipeline operating at 800 psi the breakeven point is less than five miles of blowdown mileage. However,
for an 18 inch pipeline operating at 200 psi, blowdown mitigation using a mobile compressor will have
net cost even if 25 miles of pipeline are blown down (assuming $4.21/Mcf gas value).
The data in Figure 2 is based on a relatively low utilization rate for mobile compressors (15 events per
year). Higher utilization of this expensive equipment would drive down net costs per event and would
move all of the curves in Figure 2 to the left – reducing the breakeven blowdown mileage necessary to
achieve net savings.
Also note that blowdown mitigation using in-line compression for a section of 18-inch pipeline operating
at 200 psi (worst case shown in Figures 1 and 2) less than one mile long will have social benefits that
exceed mitigation costs (using average social value of methane calculated with 3% discount rate). The
breakeven point for having net social benefits from blowdown mitigation of an 18 inch pipeline
operating at 200 psi using mobile compressors is four miles of blowdown per event.
Pipeline Blowdown Emissions & Mitigation Options
22 | P a g e
Figure 1 Net Cost of Blowdown Mitigation Using In-line Compression versus Blowdown Mileage
Figure 2 Net Cost of Blowdown Mitigation Using Mobile Compressor versus Blowdown Mileage

Pipeline Blowdown Emissions & Mitigation Options
23 | P a g e
As shown in Figure 3, the higher the value of natural gas ($/Mcf) the lower the break-even mileage at
which blowdown mitigation using mobile compressors will produce a net cost savings. At gas values
below about $5.00/Mcf blowdown mitigation using mobile compressors for an 18-inch pipeline
operating at 200 psi will have net cost, even if more than 25 miles or pipe is blown down. However, at
$6.07/Mcf gas value blowdown mitigation using mobile compressors will produce net savings for
pipeline sections longer than about 22 miles.
For a 24 inch pipeline operating at 800 psi, an increase in gas value from $2.06/Mcf to $6.07/Mcf will
reduce from nine miles to about three miles the breakeven blowdown mileage at which blowdown
mitigation using mobile compressors will produce a net cost savings.
Figure 3 Net Cost of Blowdown Mitigation Using Mobile Compressor versus natural Gas Value
3.4 Summary/Conclusions
This analysis indicates that additional blowdown emissions related to compliance with PHMSA’s
proposed rules requiring MAOP determination on sections of transmission pipeline will be small
compared to existing methane emissions from the gas transmission sector. Nonetheless, the blowdown
mitigation options investigated are highly cost-effective and will, on average, result in net savings to
pipeline operators when accounting for the value of saved gas.
Pipeline Blowdown Emissions & Mitigation Options
24 | P a g e
In addition, the societal benefits from reduced methane emissions ($/MT) are several orders of
magnitude greater than out-of-pocket mitigation costs, (i.e., costs not including the value of saved
natural gas). Not pursuing blowdown mitigation associated with MAOP determination under PHMSA’s
proposed rules would result in a net societal loss of $13 million or more15, due to future climate
damages from the released methane.
15 See table 8; this assumes a 50% reduction in blowdown emissions (10,145 MT) and net societal savings of at least $1,300/MT.

Pipeline Blowdown Emissions & Mitigation Options
25 | P a g e
REFERENCES
[1] U.S. EPA (2016) “Inventory of U.S. Greenhouse Gas Emissions and Sinks: 1990-2014”.
https://www3.epa.gov/climatechange/Downloads/ghgemissions/US-GHG-Inventory-2016-Main-
Text.pdf. Accessed May 26, 2016.
U.S. EPA (2016) “Inventory of U.S. Greenhouse Gas Emissions and Sinks: 1990-2014 Annex 3”.
https://www3.epa.gov/climatechange/Downloads/ghgemissions/US-GHG-Inventory-2016-
Annex-3-Additional-Source-or-Sink-Categories-Part-A.pdf. Accessed May 26, 2016.
[2] Department of Transportation, Pipeline and Hazardous Materials Administration, Pipeline
Safety: Safety of Gas Transmission and Gathering Pipelines, Notice of proposed rulemaking;
Docket No. PHMSA-2011-0023; RIN 2137-AE72; Federal Register, Vol. 81, No. 68, April 8, 2016
[3] Department of Transportation, Pipeline and Hazardous Materials Administration, Preliminary
Regulatory Impact Assessment, Notice of Proposed Rulemaking – Pipeline Safety: Safety of Gas
Transmission and Gathering Pipelines, March 2016
[4] U.S. Department of Transportation, Pipeline and Hazardous Materials Safety Administration,
Annual Report For Calendar Year 2014 Natural and Other Gas Transmission and Gathering
Pipeline Systems, Form PHMSA F 7100.2-1 (rev 10-2014)
[5] The Transportation of Natural Gas, Interstate Natural Gas Pipelines, NaturalGas.org
American Gas Association, HOW DOES THE NATURAL GAS DELIVERY SYSTEM WORK?,
www.aga.org/how-does-natural-gas-delivery-system-work
[6] Department of Transportation, Pipeline and Hazardous Materials Administration, Preliminary
Regulatory Impact Assessment, Notice of Proposed Rulemaking – Pipeline Safety: Safety of Gas
Transmission and Gathering Pipelines, March 2016, Table 3-50, Table 3-54
[7] Gas STAR Electronic Flare: U.S. EPA, “Install Electronic Flare Ignition Devices”. 2011. Available
at: https://www3.epa.gov/gasstar/documents/installelectronicflareignitiondevices.pdf
[8] Gas STAR Flare: U.S. EPA, “Install Flares”. 2011. Available at:
https://www3.epa.gov/gasstar/documents/installflares.pdf
[9] Sempra 2015: Sempra, “Natural Gas Leakage Workshop: Working Group Workshop on Best
Practices”. October 27, 2015. Available at:
http://www.cpuc.ca.gov/WorkArea/DownloadAsset.aspx?id=8467
[10] NW NATURAL, Methane Abatement Carbon Solutions Project, Draft Proposal 1, February 2015

Pipeline Blowdown Emissions & Mitigation Options
26 | P a g e
[11] Gas STAR Pipeline: U.S. EPA, “Using Pipeline Pump-Down Techniques to Lower Gas Line
Pressure Before Maintenance”. October 2006. Available at:
https://www3.epa.gov/gasstar/documents/ll_pipeline.pdf
[12] TransCanada 2009: TransCanada, “Pipeline ‘Pumpdown’ Compression Barriers to
Implementation”. October 20, 2009. Available at:
https://www3.epa.gov/gasstar/documents/workshops/2009-annual-conf/14cormack.pdf
[13] Hadick, Christian and Scherello, Axel; Avoiding climate-damaging methane emissions during
pipeline repairs; Open Grid Europe, the gas Wheel; Krakow, October 14th, 2011
[14] http://www.reserveequipment.com/about-us.php
[15] Gas STAR Low Pressure: U.S. EPA, “Inject Blowdown Gas into Low Pressure Mains of Fuel Gas
System”. 2011. Available at: https://www3.epa.gov/gasstar/documents/injectblowdowngas.pdf
[16] CPUC 2016: California Public Utilities Commission, “Natural Gas Leakage Abatement, Summary
of Best Practices Working Group Activities and Staff Recommendations, Attachment A”. January
2016. http://www.cpuc.ca.gov/WorkArea/DownloadAsset.aspx?id=10435
[17] Personal communication with industry representatives.
[18] U.S. Energy Information Administration, Annual Energy Outlook 2016 early release, May 2016;
Reference Case, Table 13, Natural Gas Supply, Disposition, and Prices; Natural Gas Spot Price at
Henry Hub, nominal dollars; average 2017 – 2031
[19] Environmental Protection Agency, Regulatory Impact Analysis of the Final Oil and Natural Gas
Sector: Emission Standards for New, Reconstructed, and Modified Sources, EPA-452/R-16-002,
May 2016, Table 4-3; For this analysis EPA values for social costs of methane in years 2015 –
2030 were averaged, and escalated from 2012$ to 2016$ using the GDP Price Deflator Index
[20] Blue Source Canada, Blowdown Protocol for Pipeline Systems, Appendix A GAS DEVIATION
FACTOR QUANTIFICATION, April 2011

Pipeline Blowdown Emissions & Mitigation Options
27 | P a g e
APPENDIX A
This is the same equation used by PHMSA to calculate blowdown emissions for its Regulatory Impact
Assessment (see Equation 1 in PHMSA RIA, page 37 [3]). However, it is not clear from the description in
the RIA document whether or not PHMSA used temperature designated in degrees K in the proposed
rule analysis, and whether or not they used absolute pressure (as opposed to gauge pressure). In
addition, PHMSA used a value of 0.88 for Zavg while MJB&A used a value of 0.926, corresponding to a
pressure of 400 psig [20].
See Figure 3 for a Summary of Blowdown emissions (Mcf/mi) based on pipe diameter and pressure, per
the above equation.
Natural Gas Volume [Mcf/mi] =[(28.798 x Davg2) x (Tstd/Pstd) x (Pavg/(Zavg x Tavg)]/1000
Tstd = Standard temperature (deg F) = 59.0 = 288.15 deg K
Pstd = Atmospheric Pressure (psia) = 14.70 = 101.328 kPa
Pavg = Average starting pipeline pressure (kPa) before blowdown
Tavg = Average starting pipeline temperature (deg K) before blowdown
Zavg = Gas compressibility factor
Davg = Average inside diameter of pipe (inches)
NOTE: In this equation temperture must be in degrees K and pressure must be in kPa absolute
Mcf = 1000 standard cubic feet
Formula for Blowdown Emissions

Pipeline Blowdown Emissions & Mitigation Options
28 | P a g e
Figure 4 Blowdown Emission (Mcf/mi) Versus Pipe Diameter and Pressure

Pipeline Blowdown Emissions & Mitigation Options
29 | P a g e
APPENDIX B
Table B1: AVERAGE BLOWDOWN EVENT WITHOUT MITIGATION
Interstate Intrastate
mi/event 15.0 15.0 Industry average distance between valves
Mcf/mi 443.1 234.2
Mcf/event 6,647 3,513
MT/mi 9.1 4.8
MT/event 137.1 72.4
$/mi $1,865 $986 Assumes $4.210 per Mcf.
$/event $27,982 $14,789 Source: PHMSA assumption, regulatory impact analysis
$/mi $6,256 $3,306 Assumes
$/event $93,837 $49,595 CH4 CO2
$/mi $13,526 $7,149 $685 $15 /MT at 5% discount rate, average
$/event $202,892 $107,233 $1,480 $50 /MT at 3% discount rate, average
$/mi $17,632 $9,319 $1,930 $74 /MT at 2.5% discount rate, average
$/event $264,484 $139,786 $3,965 $148 /MT at 3% discount rate, 95th perc
$/mi $36,231 $19,149
$/event $543,460 $287,231
From MJB&A analysis of PHMSA RIA data,
based on average pipe diameter and pressure
From MJB&A analysis of PHMSA RIA data,
based on average natural gas composition
CH4: Average values over compliance period, in 2016$;
Source: "Incremental CH4 and N2O mitigation benefits
consistent with the US government’s SC-CO2 estimates."
Marten AL, Kopits EA, Griffiths CW, Newbold SC,
Wolverton A. 2014. Climate Policy
DOI:10.1080/14693062.2014.912981.
CO2: Average values over compliance period in 2016$,
Source: EPA Technical Support Document, Technical
Update of the Social Cost of Carbon for Regulatory Impact
Analysis Under Executive Order 12866 (May 2013, Revised
July 2015)
unitPipeline Type
Blowdown Length
Parameter
Blowdown Natural Gas
Volume
Blowdown Methane Mass
Blowdown Natural Gas
Economic Value
Social Cost of
Blowdown
Methane
5% AVG
3% AVG
2.5% AVG
3% 95th
Perc

Pipeline Blowdown Emissions & Mitigation Options
30 | P a g e
Table B2: BLOWDOWN MITIGATION OPTIONS
Starting Ending Interstate Intrastate Interstate Intrastate Interstate Intrastate Interstate Intrastate
[psig] [psig] [%] [%] [MT/event][MT/event] [Mcf/hr] [hr/event] [hr/event] Mcf/event Mcf/event MT/event MT/event
Flaring 400 20 95% 95% 123.7 65.4 318 19.9 10.5 340.2 179.8
In-line Compressor 400 200 50% 61.2 32.3 1,000 11.1 5.9 357.6 189.0 20.3 10.7
Inject to Low Pressure System 400 200 50% 68.5 36.2 500 6.6 3.5
Mobile Compressor 400 80 80% 108.3 57.3 500 10.6 5.6 64.4 34.0 3.7 1.9
Stopples 75% 102.8 54.3 NA NA NA
Table B3: VALUE OF MITIGATED BLOWDOWN GAS ($/event)
5% AVG 3% AVG 2.5% AVG 3% 95P 5% AVG 3% AVG 2.5% AVG 3% 95P
[$/event] [$/event] [$/event] [$/event] [$/event] [$/event] [$/event] [$/event] [$/event] [$/event]
Flaring $0 $0 $79,537 $166,199 $213,525 $440,130 $42,037 $87,840 $112,853 $232,619
In-line Compressor $12,485 $6,599 $41,563 $89,521 $116,511 $239,489 $21,967 $47,314 $61,579 $126,575
Inject to Low Pressure System $13,991 $7,395 $46,919 $101,446 $132,242 $271,730 $24,798 $53,617 $69,893 $143,616
Mobile Compressor $22,115 $11,688 $74,106 $160,167 $208,756 $428,965 $39,167 $84,652 $110,332 $226,718
Stopples $20,986 $11,092 $70,378 $152,169 $198,363 $407,595 $37,196 $80,425 $104,839 $215,424
Table B4: BLOWDOWN MITIGATION COST ELEMENTS (per event)
Interstate Intrastate Interstate Intrastate
[$] [$] [yr] [Events/yr] [$/event] [man-hrs] [man-hrs] [FTE] [man-hrs] [man-hrs] [$/event] [$/event]
Flaring $50,000 $1,000 7 15 $543 8.0 8.0 1.50 45.8 31.7 $2,122 $1,471
In-line Compressor NA NA NA NA $0 8.0 0.0 1.25 21.8 15.3 $1,013 $710
Inject to Low Pressure System $10,000 $500 5 15 $167 8.0 10.0 1.00 24.6 21.5 $1,142 $997
Mobile Compressor $1,000,000 $10,000 10 15 $11,000 8.0 30.0 2.00 59.3 49.2 $2,747 $2,282
Stopples $60,000 $0 1 1 $60,000 16.0 50.0 NA 66.0 66.0 $3,059 $3,059
Table B5: BLOWDOWN MITIGATION TOTAL COSTS ($/event)
Interstate Intrastate Interstate Intrastate 5% AVG 3% AVG 2.5% AVG 3% 95P 5% AVG 3% AVG 2.5% AVG 3% 95P
[$/event] [$/event] [$/event] [$/event] [$/event] [$/event] [$/event] [$/event] [$/event] [$/event] [$/event] [$/event]
Flaring $2,665 $2,014 $2,665 $2,014 ($76,873) ($163,534) ($210,860) ($437,465) ($40,023) ($85,826) ($110,839) ($230,605)
In-line Compressor $1,013 $710 ($11,473) ($5,889) ($53,036) ($100,994) ($127,984) ($250,961) ($27,856) ($53,203) ($67,468) ($132,464)
Inject to Low Pressure System $1,309 $1,164 ($12,682) ($6,231) ($59,601) ($114,128) ($144,924) ($284,412) ($31,028) ($59,847) ($76,124) ($149,846)
Mobile Compressor $13,747 $13,282 ($8,367) $1,594 ($82,473) ($168,534) ($217,123) ($437,332) ($37,572) ($83,058) ($108,738) ($225,123)
Stopples $63,059 $63,059 $42,073 $51,967 ($28,305) ($110,096) ($156,290) ($365,522) $14,771 ($28,457) ($52,872) ($163,456)
Table B6: AVERAGE METHANE MITIGATION COST ($/MT)
Interstate Intrastate Interstate Intrastate 5% AVG 3% AVG 2.5% AVG 3% 95P 5% AVG 3% AVG 2.5% AVG 3% 95P
[$/MT] [$/MT] [$/MT] [$/MT] [$/MT] [$/Mt] [$/Mt] [$/Mt] [$/Mt] [$/Mt] [$/Mt] [$/Mt]
Flaring $22 $31 $22 $31 ($621) ($1,322) ($1,704) ($3,536) ($612) ($1,313) ($1,695) ($3,527)
In-line Compressor $17 $22 ($188) ($182) ($867) ($1,651) ($2,093) ($4,103) ($862) ($1,646) ($2,087) ($4,098)
Inject to Low Pressure System $19 $32 ($185) ($172) ($870) ($1,665) ($2,115) ($4,150) ($857) ($1,652) ($2,102) ($4,137)
Mobile Compressor $127 $232 ($77) $28 ($761) ($1,556) ($2,004) ($4,037) ($656) ($1,451) ($1,899) ($3,932)
Stopples $613 $1,161 $409 $956 ($275) ($1,071) ($1,520) ($3,555) $272 ($524) ($973) ($3,008)
Natural Gas 1
Compressor Fuel Use
Total Labor per Event
LABOR
TOTAL LABOR COST 5Set-Up
and
Removal
On-site
During
Blowdown
Interstate Intrastate
Planning
Intrastate
net of NG Economic Value and Methane Social Value
Average Mitigation Cost (Savings)
NA
OPTION
Duration of Mitigation
Operation 3
Social Value of Non-emmitted Methane 4
Interstate Intrastate
Gas
Removal
Rate 2
CO2 EmissionsPipeline Pressure Blowdown
Reduction
Destruc-
tion
Efficiency
Equip-
ment LifeUtilization
CAPITAL EQUIPMENT
Purchase
Cost
Reduction in Emitted
CH4 1
OPTIONIntrastate
Economic Value of
Saved Natural Gas
Interstate
Annual
Maint
Methane Mitigation
Cost
Methane Mitigation
Cost Net of NG
Economic Value
Methane Mitigation Cost net of NG Economic Value and Methane Social Value
OPTION
OPTION
OPTION
Amortized
Equip Cost
Interstate
Costnet of Natural Gas
Economic Value
Pipeline Blowdown Emissions & Mitigation Options
31 | P a g e
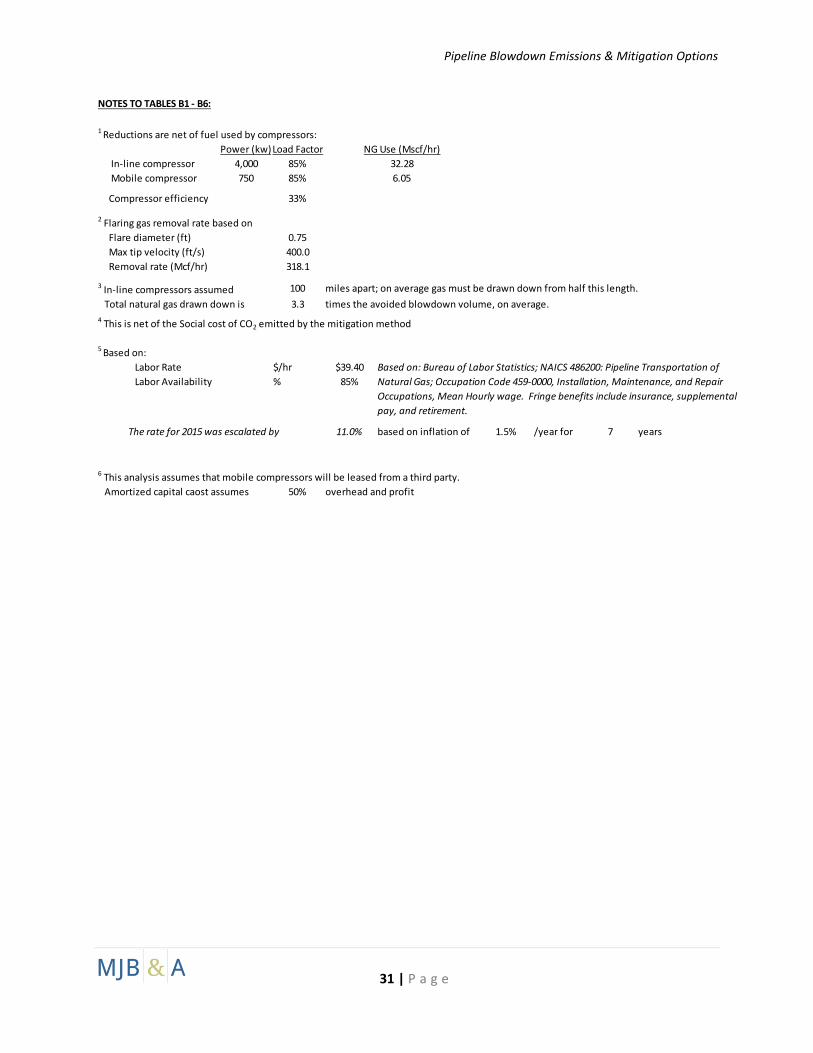
NOTES TO TABLES B1 - B6:
1 Reductions are net of fuel used by compressors:
Power (kw)Load Factor NG Use (Mscf/hr)
In-line compressor 4,000 85% 32.28
Mobile compressor 750 85% 6.05
Compressor efficiency 33%
2 Flaring gas removal rate based on
Flare diameter (ft) 0.75
Max tip velocity (ft/s) 400.0
Removal rate (Mcf/hr) 318.1
3 In-line compressors assumed 100 miles apart; on average gas must be drawn down from half this length.
Total natural gas drawn down is 3.3 times the avoided blowdown volume, on average.
4 This is net of the Social cost of CO2 emitted by the mitigation method
5 Based on:
Labor Rate $/hr $39.40
Labor Availability % 85%
The rate for 2015 was escalated by 11.0% based on inflation of 1.5% /year for 7 years
6 This analysis assumes that mobile compressors will be leased from a third party.
Amortized capital caost assumes 50% overhead and profit
Based on: Bureau of Labor Statistics; NAICS 486200: Pipeline Transportation of
Natural Gas; Occupation Code 459-0000, Installation, Maintenance, and Repair
Occupations, Mean Hourly wage. Fringe benefits include insurance, supplemental
pay, and retirement.

Pipeline Blowdown Emissions & Mitigation Options
32 | P a g e
APPENDIX C
EPA NSPS RIA Table 4-3
Social Cost of Methane (Source: Marten et al , 2014)
2.5% AVG 3% AVG 5% AVG 3% 95th perc
2012 $1,400 $1,000 $430 $2,800
2015 $1,500 $1,100 $490 $3,000
2020 $1,700 $1,300 $580 $3,500
2025 $1,900 $1,500 $700 $4,000
2030 $2,200 $1,700 $820 $4,500
2035 $2,500 $1,900 $970 $5,300
2040 $2,800 $2,200 $1,100 $5,900
2045 $3,000 $2,500 $1,300 $6,600
2050 $3,300 $2,700 $1,400 $7,200
MJB&A Analysis
AVG 2015 -
2030 (2012$)$1,825 $1,400 $648 $3,750
AVG 2015 -
2030 (2016$)$1,930 $1,480 $685 $3,965
2012 2016 Ratio
GDP Price Deflator 104.47 110.45 1.057
5%
Average
3%
Average
2.5%
Average
3%
95th perce
ntile
2015 $11 $36 $56 $105
2020 $12 $42 $62 $123
2025 $14 $46 $68 $138
2030 $16 $50 $73 $152
2035 $18 $55 $78 $168
2040 $21 $60 $84 $183
2045 $23 $64 $89 $197
2050 $26 $69 $95 $212
MJB&A Analysis
AVG 2015 -
2030 (2012$)$13 $44 $65 $130
AVG 2015 -
2030 (2016$)$15 $50 $74 $148
2007 2016 Ratio
GDP Price Deflator 96.65 110.45 1.143
https://research.stlouisfed.org/fred2/series/GDPDEF
Social Cost of Methane (2012$)
Discount rateYEAR
Discount Rate
Social Cost of CO2, 2015-2050 ($/MT, 2007$)
Source: Technical Support Document (PDF, 21 pp, 1 MB): Technical
Update of the Social Cost of Carbon for Regulatory Impact Analysis
Under Executive Order 12866 (May 2013, Revised July 2015)
Year