Analysis of Operator Response to Station · PDF fileAnalysis of Operator Response to Station...
43
Analysis of Operator Response to Station Analysis of Operator Response to Station BlackOut BlackOut Alex MATEV Alex MATEV Eskom Research & Innovation Centre Eskom Research & Innovation Centre
Transcript of Analysis of Operator Response to Station · PDF fileAnalysis of Operator Response to Station...
Analysis of Operator Response to Station Analysis of Operator Response to Station
BlackOutBlackOut
Alex MATEVAlex MATEV
Eskom Research & Innovation CentreEskom Research & Innovation Centre

IntroductionIntroduction
MIT Nov/Dec 004
Pretoria
Johannesburg
Bloemfontein
Cape TownEast London
Port Elizabeth
Durban
Maputo
MOZAMBIQUE
LESOTHO
NAMIBIA
TT
TTTT
TT
TTT
TH
H
H
G
GN
H
SWAZILAND
BOTSWANA
ESKOM POWER STATIONST

IntroductionIntroduction
Coal fired87.3%
Nuclear6.8%
Imported4.1%
Pumped Storage1.4%
Hydroelectric0.4%
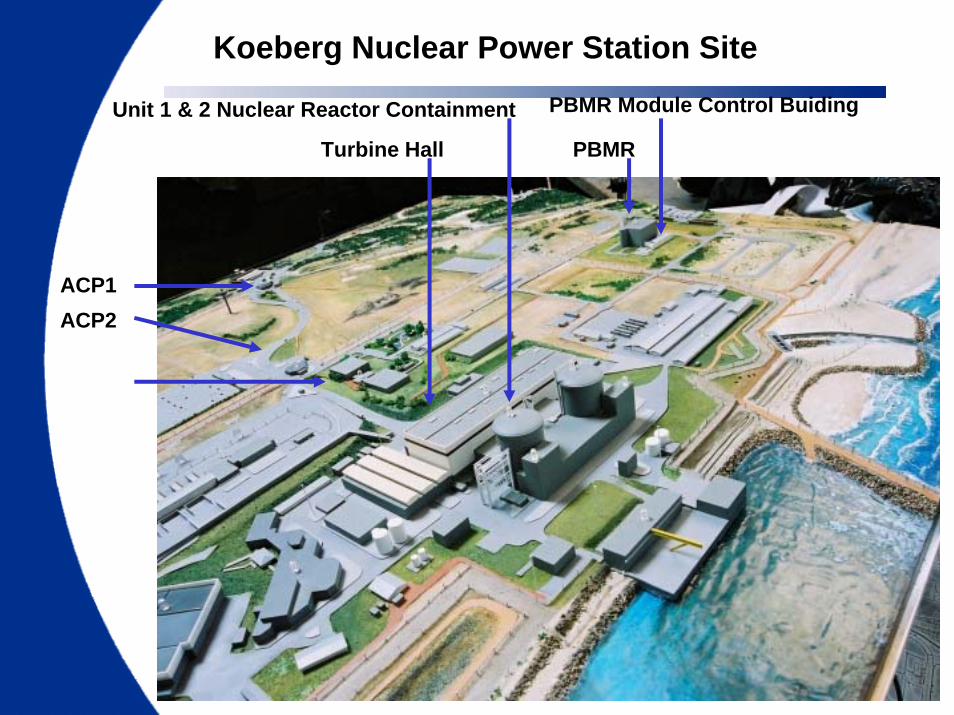
Koeberg Nuclear Power Station SitePBMR Module Control Buiding
Turbine Hall
Unit 1 & 2 Nuclear Reactor Containment
PBMR
ACP1ACP2

Koeberg Nuclear Power Station Site
PBMR Module Control Buiding
Turbine Hall
Unit 1 & 2 Nuclear Reactor Containment
PBMR

IntroductionIntroduction
Station BlackOut (SBO): Simultaneous loss of all offsite and onsite AC power sources
SBO results in:• Loss of primary charging pumps providing RCP sealing water• Loss of Component Cooling Water causes loss of RCP thermal
shield cooling
Safety concern:• Failure of RCP seals due to their overheating • Safety Injection unavailability due to SBO • Unmitigated LOCA, inadequate core cooling, fuel failure

Reactor Coolant PumpsReactor Coolant Pumps’’ Seals DesignSeals Design
RCP Seals DesignRCP Seals Design
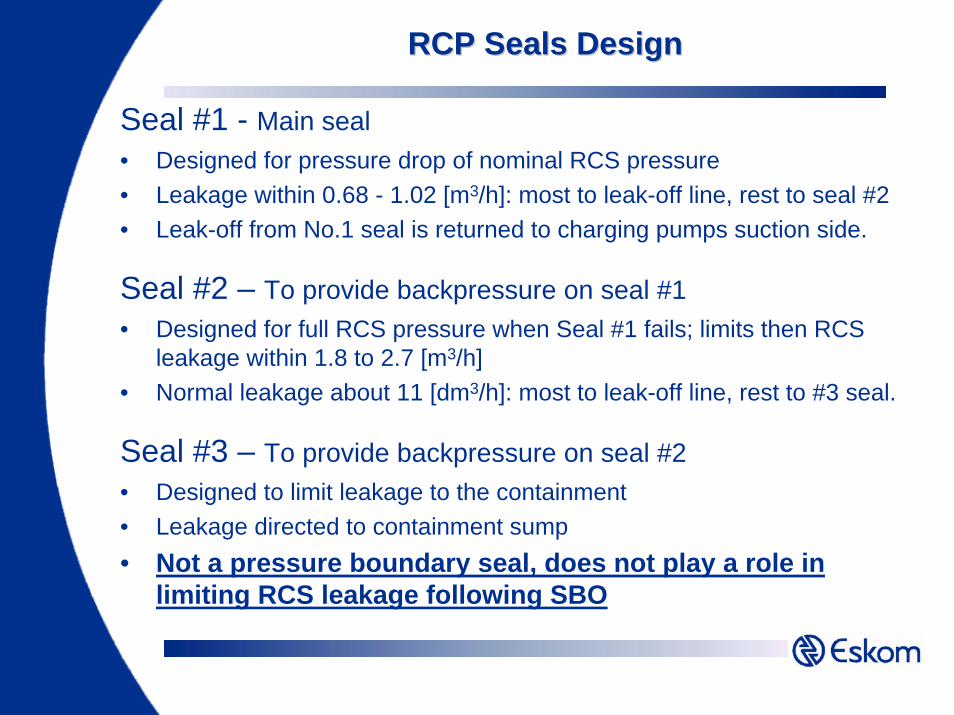
Seal #1 - Main seal • Designed for pressure drop of nominal RCS pressure• Leakage within 0.68 - 1.02 [m3/h]: most to leak-off line, rest to seal #2• Leak-off from No.1 seal is returned to charging pumps suction side.
Seal #2 – To provide backpressure on seal #1 • Designed for full RCS pressure when Seal #1 fails; limits then RCS
leakage within 1.8 to 2.7 [m3/h]• Normal leakage about 11 [dm3/h]: most to leak-off line, rest to #3 seal.
Seal #3 – To provide backpressure on seal #2• Designed to limit leakage to the containment• Leakage directed to containment sump• Not a pressure boundary seal, does not play a role in
limiting RCS leakage following SBO

RCP SealsRCP Seals’’ CoolingCooling
Normal Operating Conditions: 1) RCP seal injection flow (from RCS charging pumps)• Seal injection flow acts as a buffer to prevent reactor coolant from entering the pump seal and bearing section.• A portion of the seal injection flows down the pump shaft and into RCS, the remainder flows up through the seals system
2) RCP thermal barrier cooled by Component Cooling Water• Heat exchanger to cool the incoming reactor coolant before it enters the RCP bearing and seals• Reservoir of cool water: When sealing flow lost, it takes several minutes to leak cool water through RCP seals before hot reactor coolant fills the volume and approaches bearing and seal #1
Abnormal Operating Conditions: At least one cooling system should be restored within several minutes
RCP Seals Leakage ModelsRCP Seals Leakage Models
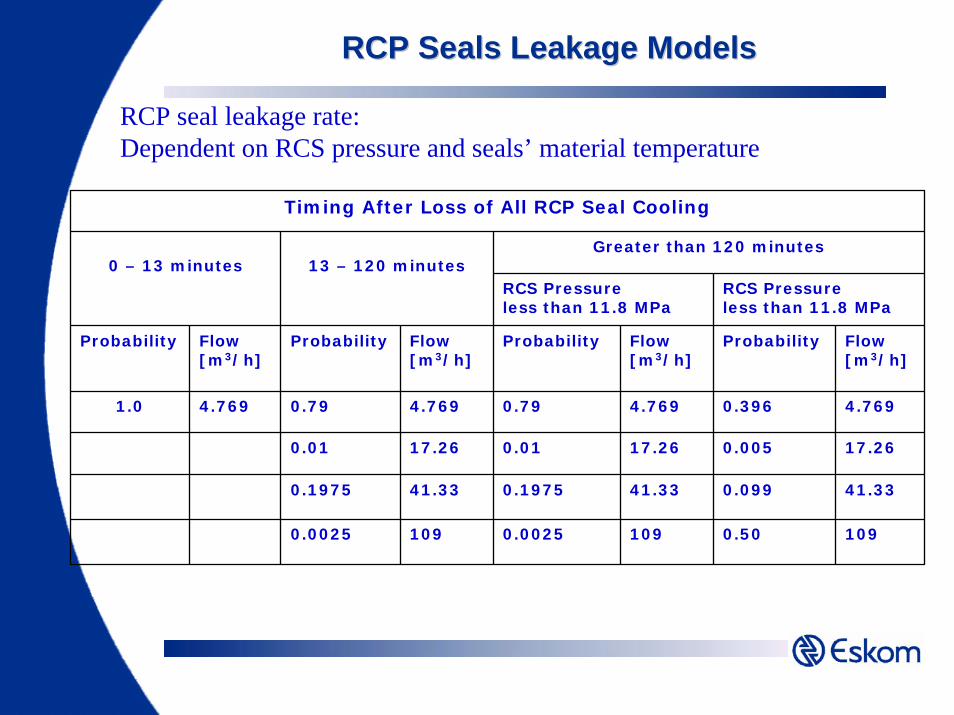
RCP seal leakage rate: Dependent on RCS pressure and seals’ material temperature
Timing After Loss of All RCP Seal Cooling
Greater than 120 minutes0 – 13 minutes 13 – 120 minutes
RCS Pressure less than 11.8 MPa
RCS Pressureless than 11.8 MPa
Probability Flow [m3/h]
Probability Flow[m3/h]
Probability Flow [m3/h]
Probability Flow [m3/h]
1.0 4.769 0.79 4.769 0.79 4.769 0.396 4.769
0.01 17.26 0.01 17.26 0.005 17.26
0.1975 41.33 0.1975 41.33 0.099 41.33
0.0025 109 0.0025 109 0.50 109
RCP Seals Leakage ModelsRCP Seals Leakage Models
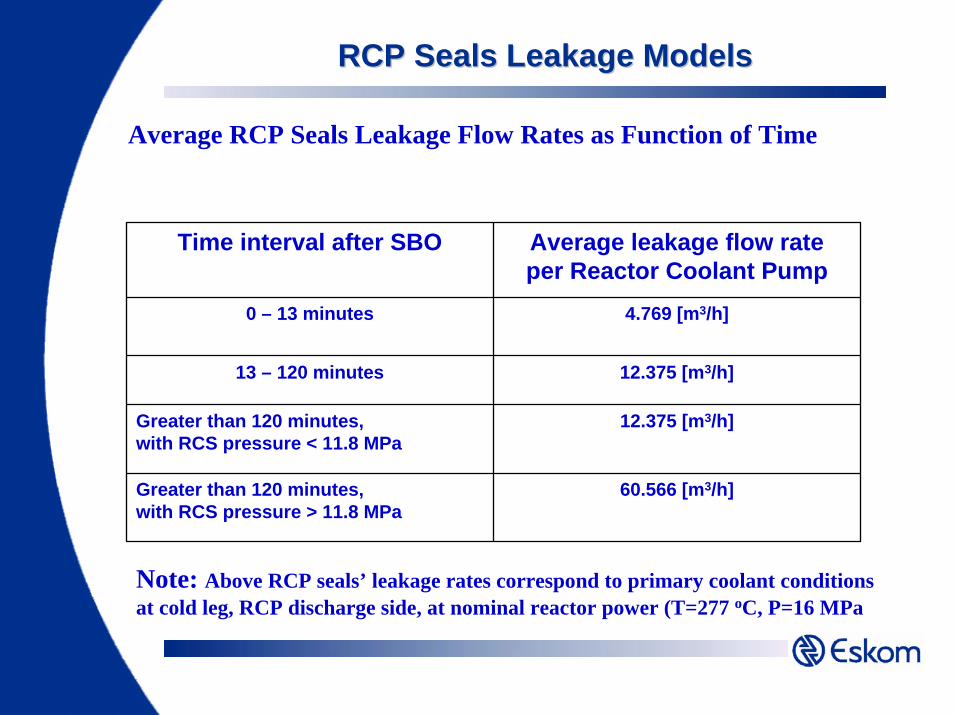
Average RCP Seals Leakage Flow Rates as Function of Time
Time interval after SBO Average leakage flow rate per Reactor Coolant Pump
0 – 13 minutes 4.769 [m3/h]
13 – 120 minutes 12.375 [m3/h]
Greater than 120 minutes,with RCS pressure < 11.8 MPa
12.375 [m3/h]
Greater than 120 minutes,with RCS pressure > 11.8 MPa
60.566 [m3/h]
Note: Above RCP seals’ leakage rates correspond to primary coolant conditions at cold leg, RCP discharge side, at nominal reactor power (T=277 oC, P=16 MPa
Operator Response to Station Black OutOperator Response to Station Black Out
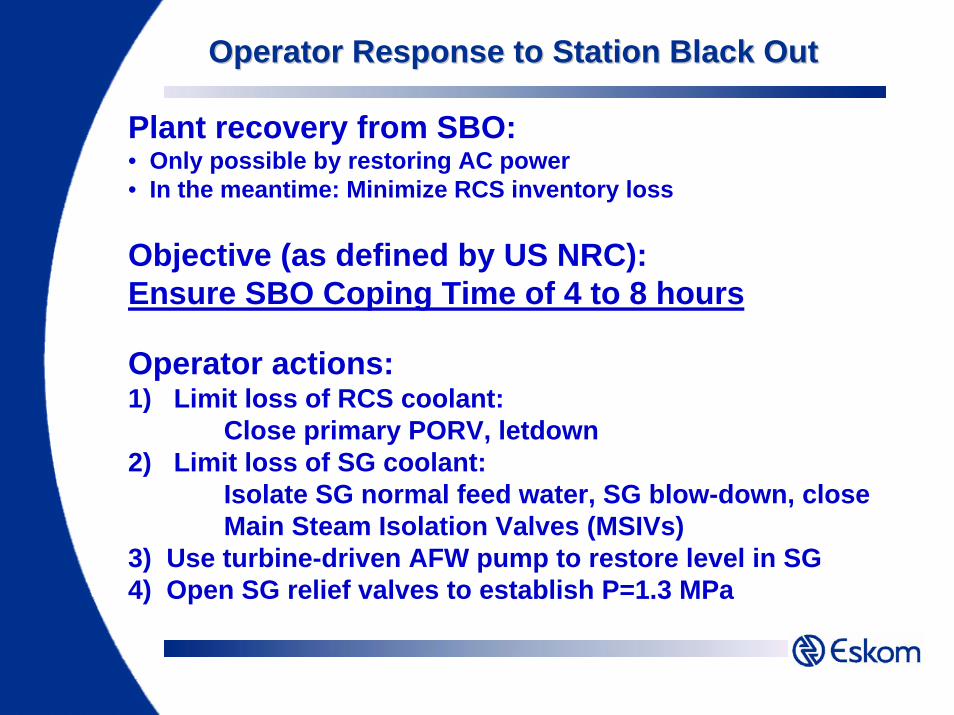
Plant recovery from SBO: • Only possible by restoring AC power • In the meantime: Minimize RCS inventory loss
Objective (as defined by US NRC):Ensure SBO Coping Time of 4 to 8 hours
Operator actions:1) Limit loss of RCS coolant:
Close primary PORV, letdown 2) Limit loss of SG coolant:
Isolate SG normal feed water, SG blow-down, close Main Steam Isolation Valves (MSIVs)
3) Use turbine-driven AFW pump to restore level in SG 4) Open SG relief valves to establish P=1.3 MPa

RCS RCS CooldownCooldown Benefits and ConstraintsBenefits and Constraints
Benefits: • Reduced rate of RCS coolant leakage through RCP seals postpones fuel overheating• Cooler fluid leaking through RCP seals reduces heat load on seals• Discharge of borated coolant from hydro-accumulators into RCS increases shutdown margin (SDM)
Constraints:1) Possible purging of hydro-accumulators nitrogen into RCS: To prevent it, keep RCS pressure above 0.6 MPa by closing SG steam relief valve
2) Deep cooldown can cause core recriticality: Possible when low ShutDown Margin (e.g. fail to insert rods, little Xe135)
RCS RCS CooldownCooldown Benefits and ConstraintsBenefits and Constraints
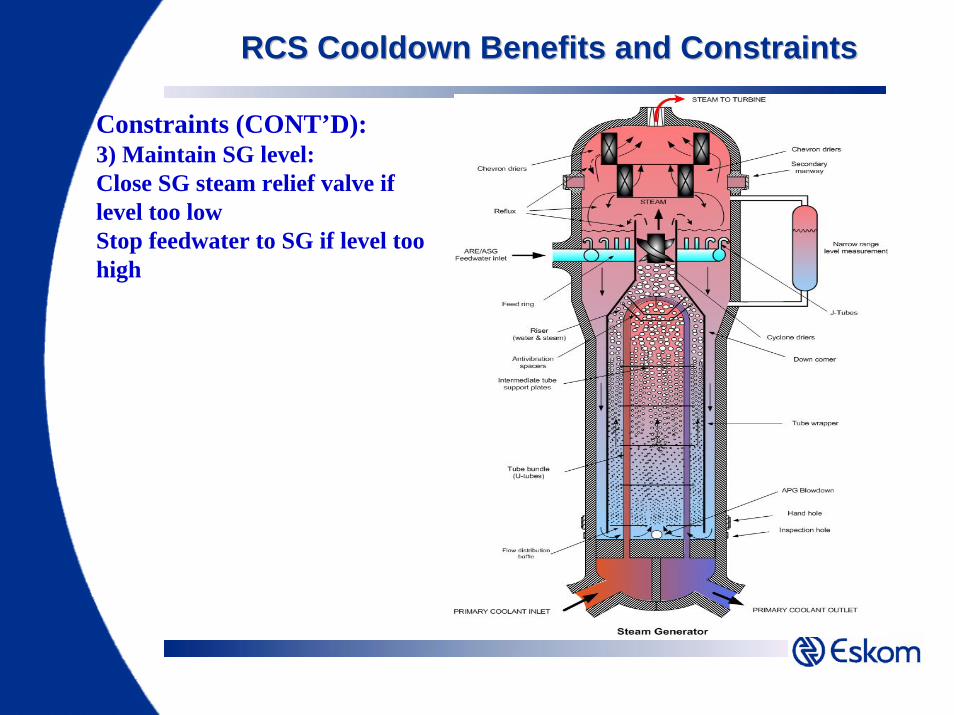
Constraints (CONT’D):3) Maintain SG level: Close SG steam relief valve if level too lowStop feedwater to SG if level too high

Simulation Results
Case #0: SBO without SG DepressurizationAssumptions:• Initial plant state: Nominal full power• Only SG#1 available for depressurization• Turbine-driven AFW pump flow only to SG#1: 80 [m3/h] when
secondary side pressure P=7.03 [MPa] or higher• Steam dump to atmosphere only via SG safety valves (POPEN=7.4
[MPa]• All MSIVs closed at time T=TSBO+10 min• Operator controls secondary coolant level in SG#1 by opening
AFW valve at SG level < -0.9 [m] and closing it at level > 0.2 [m]
Simulation Results
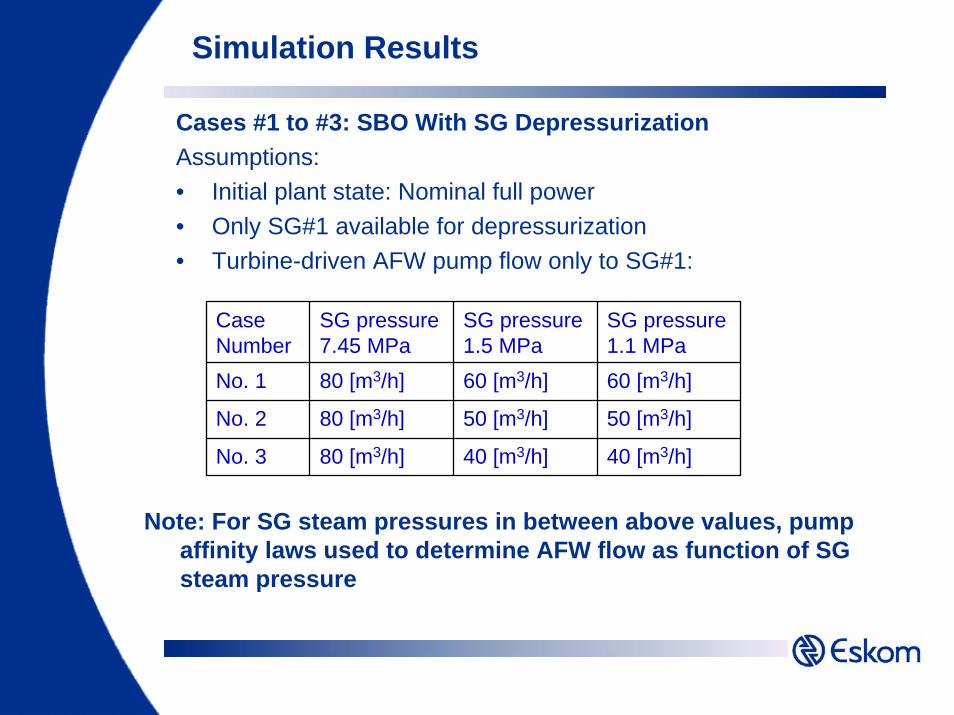
Cases #1 to #3: SBO With SG DepressurizationAssumptions:• Initial plant state: Nominal full power• Only SG#1 available for depressurization• Turbine-driven AFW pump flow only to SG#1:
Case Number
SG pressure7.45 MPa
SG pressure1.5 MPa
SG pressure1.1 MPa
No. 1 80 [m3/h] 60 [m3/h] 60 [m3/h]
No. 2 80 [m3/h] 50 [m3/h] 50 [m3/h]
No. 3 80 [m3/h] 40 [m3/h] 40 [m3/h]
Note: For SG steam pressures in between above values, pump affinity laws used to determine AFW flow as function of SG steam pressure

Simulation Results - Assumptions
Cases #1 to #3: SBO With SG DepressurizationAssumptions:All MSIVs closed at time T=TSBO+10 min• Steam dump to atmosphere only via SG safety valves
(POPEN=7.4 [MPa] until time T=TSBO+15 min• Operator opens at time T=TSBO+15 min SG#1 relief valve and
dumps steam to establish SG secondary side steam pressurePSG=1.3±0.2 [MPa]
• Operator closes SG#1 relief valve and stops steam dump every time the SG level becomes lower than -1.2 [m]
• Operator controls secondary coolant level in SG#1 by opening AFW valve at SG level < -0.9 [m] and closing it at level > 0.2 [m]

Primary Coolant Pressure
Station Black Out Without Depressurization Of Secondary SideAFW Flow Rate 80 [m3/h] to SG#1 Only
Fig. 0.1. Primary Coolant Pressure
6.5
7
7.5
8
8.5
9
9.5
10
10.5
11
11.5
12
12.5
13
13.5
14
14.5
15
15.5
16
16.5
-0.5 0 0.5 1 1.5 2 2.5 3 3.5 4 4.5 5 5.5 6 6.5
Time [hours]
Pres
sure
[MPa
]

Primary Coolant Pressure
Station Black Out With Steam Generator #1 DepressurizationDifferent Auxiliary Feedwater Flows to SG #1 at Steam Pressure 1.3 MPa
Fig.1.1. Primary Coolant Pressure
1
2
3
4
5
6
7
8
9
10
11
12
13
14
15
16
-1 0 1 2 3 4 5 6 7 8 9 10 11 12 13 14 15 16 17 18
Time [hours]
Pres
sure
[MPa
]
40 m3/h50 m3/h60 m3/h
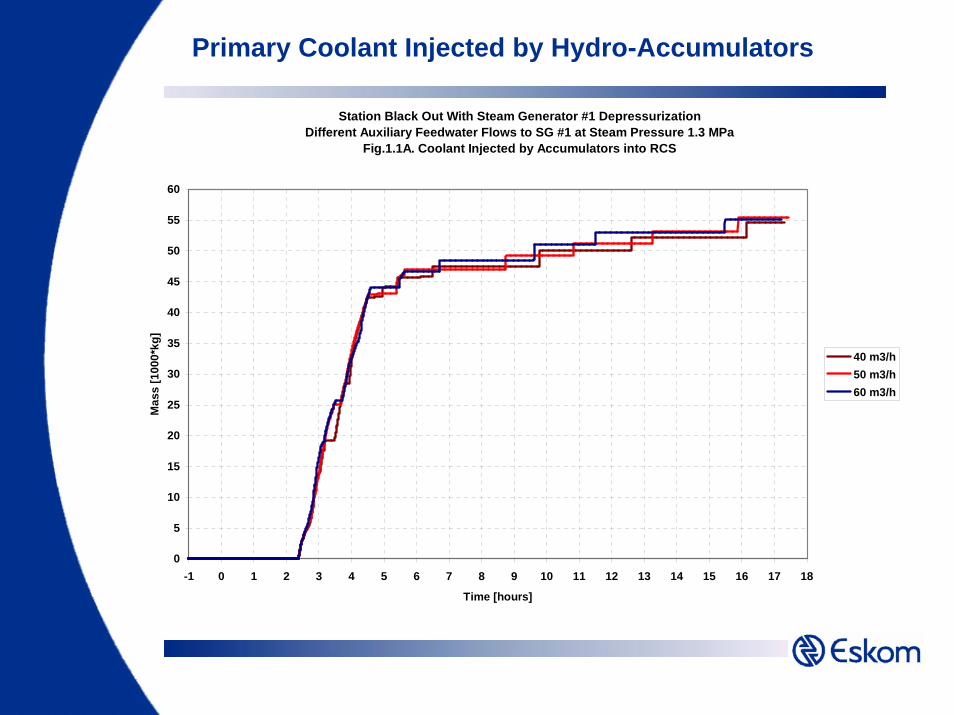
Primary Coolant Injected by Hydro-Accumulators
Station Black Out With Steam Generator #1 DepressurizationDifferent Auxiliary Feedwater Flows to SG #1 at Steam Pressure 1.3 MPa
Fig.1.1A. Coolant Injected by Accumulators into RCS
0
5
10
15
20
25
30
35
40
45
50
55
60
-1 0 1 2 3 4 5 6 7 8 9 10 11 12 13 14 15 16 17 18
Time [hours]
Mas
s [1
000*
kg]
40 m3/h50 m3/h60 m3/h
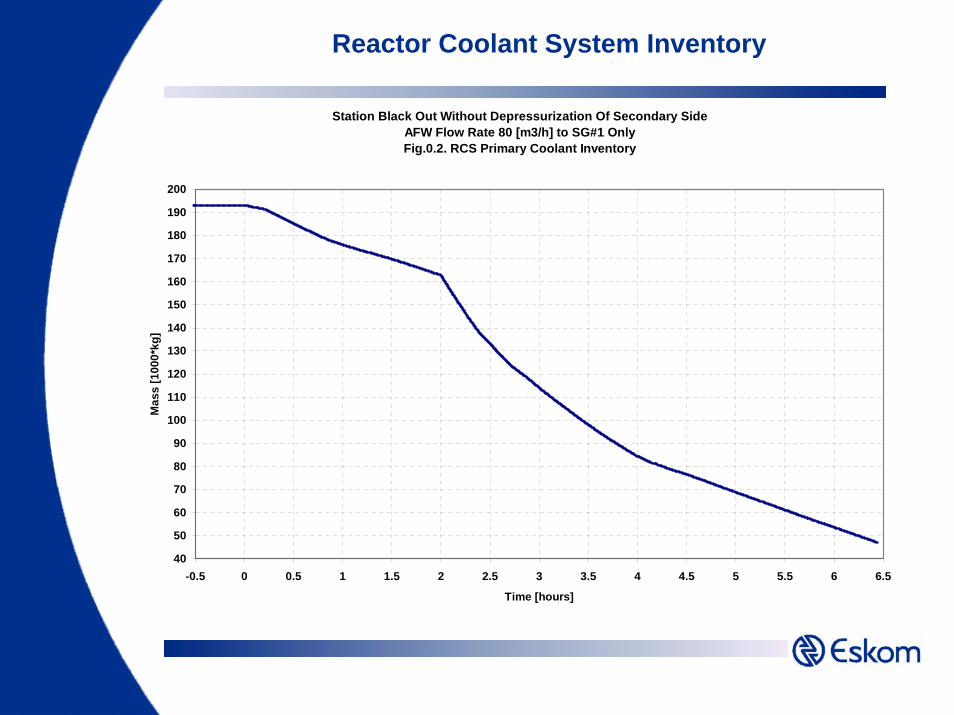
Reactor Coolant System Inventory
Station Black Out Without Depressurization Of Secondary SideAFW Flow Rate 80 [m3/h] to SG#1 Only Fig.0.2. RCS Primary Coolant Inventory
40
50
60
70
80
90
100
110
120
130
140
150
160
170
180
190
200
-0.5 0 0.5 1 1.5 2 2.5 3 3.5 4 4.5 5 5.5 6 6.5
Time [hours]
Mas
s [1
000*
kg]

Reactor Coolant System Inventory
Station Black Out With Steam Generator #1 DepressurizationDifferent Auxiliary Feedwater Flows to SG #1 at Steam Pressure 1.3 MPa
Fig.1.2. RCS Coolant Inventory
50
60
70
80
90
100
110
120
130
140
150
160
170
180
190
200
-1 0 1 2 3 4 5 6 7 8 9 10 11 12 13 14 15 16 17 18
Time [hours]
Mas
s [1
000*
kg]
40 m3/h50 m3/h60 m3/h
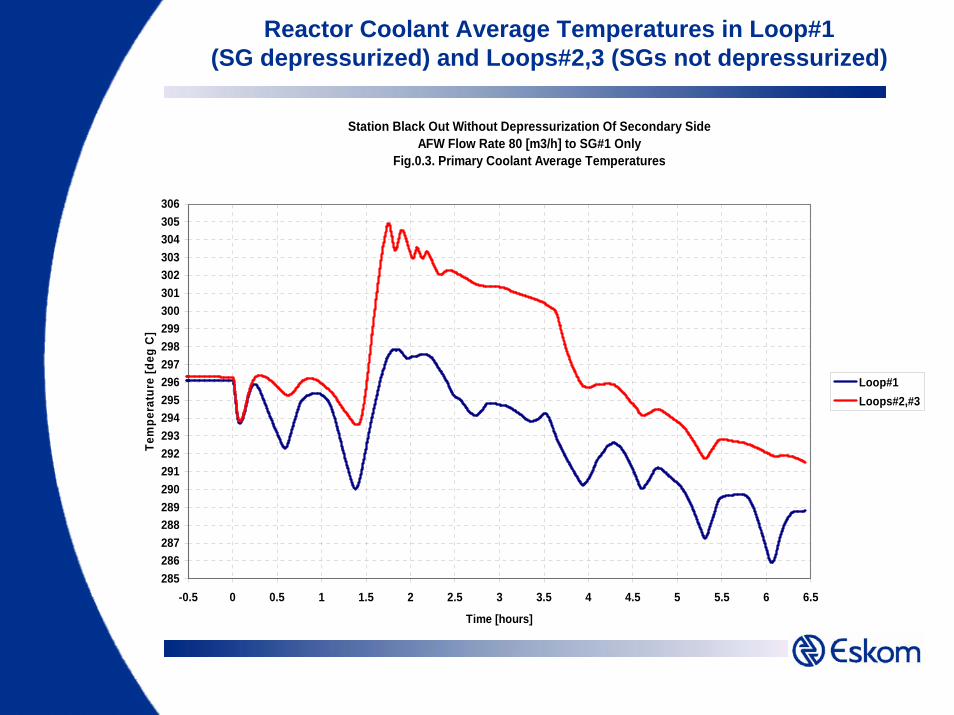
Reactor Coolant Average Temperatures in Loop#1 (SG depressurized) and Loops#2,3 (SGs not depressurized)
Station Black Out Without Depressurization Of Secondary SideAFW Flow Rate 80 [m3/h] to SG#1 Only
Fig.0.3. Primary Coolant Average Temperatures
285286287288289290291292293294295296297298299300301302303304305306
-0.5 0 0.5 1 1.5 2 2.5 3 3.5 4 4.5 5 5.5 6 6.5
Time [hours]
Tem
pera
ture
[deg
C]
Loop#1Loops#2,#3
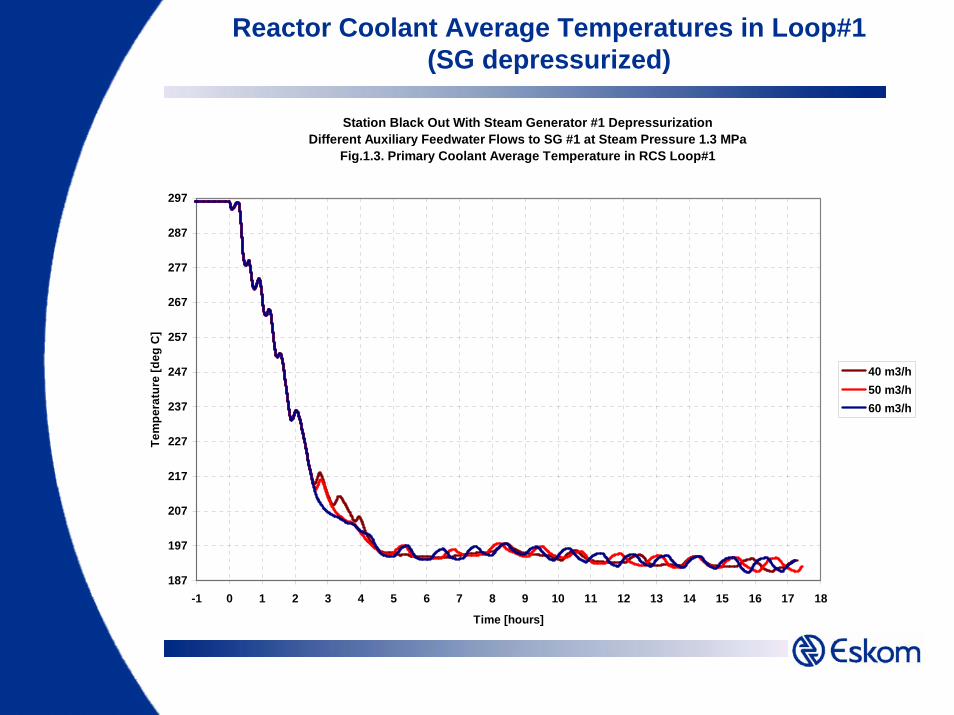
Reactor Coolant Average Temperatures in Loop#1 (SG depressurized)
Station Black Out With Steam Generator #1 DepressurizationDifferent Auxiliary Feedwater Flows to SG #1 at Steam Pressure 1.3 MPa
Fig.1.3. Primary Coolant Average Temperature in RCS Loop#1
187
197
207
217
227
237
247
257
267
277
287
297
-1 0 1 2 3 4 5 6 7 8 9 10 11 12 13 14 15 16 17 18
Time [hours]
Tem
pera
ture
[deg
C]
40 m3/h50 m3/h60 m3/h
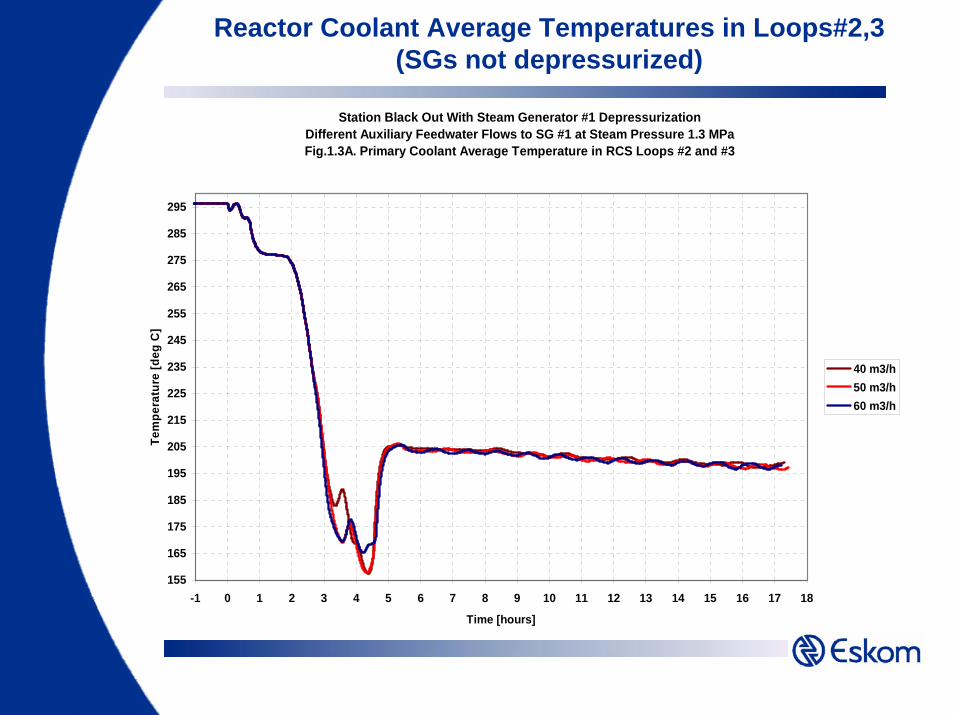
Reactor Coolant Average Temperatures in Loops#2,3 (SGs not depressurized)
Station Black Out With Steam Generator #1 DepressurizationDifferent Auxiliary Feedwater Flows to SG #1 at Steam Pressure 1.3 MPa Fig.1.3A. Primary Coolant Average Temperature in RCS Loops #2 and #3
155
165
175
185
195
205
215
225
235
245
255
265
275
285
295
-1 0 1 2 3 4 5 6 7 8 9 10 11 12 13 14 15 16 17 18
Time [hours]
Tem
pera
ture
[deg
C]
40 m3/h50 m3/h60 m3/h
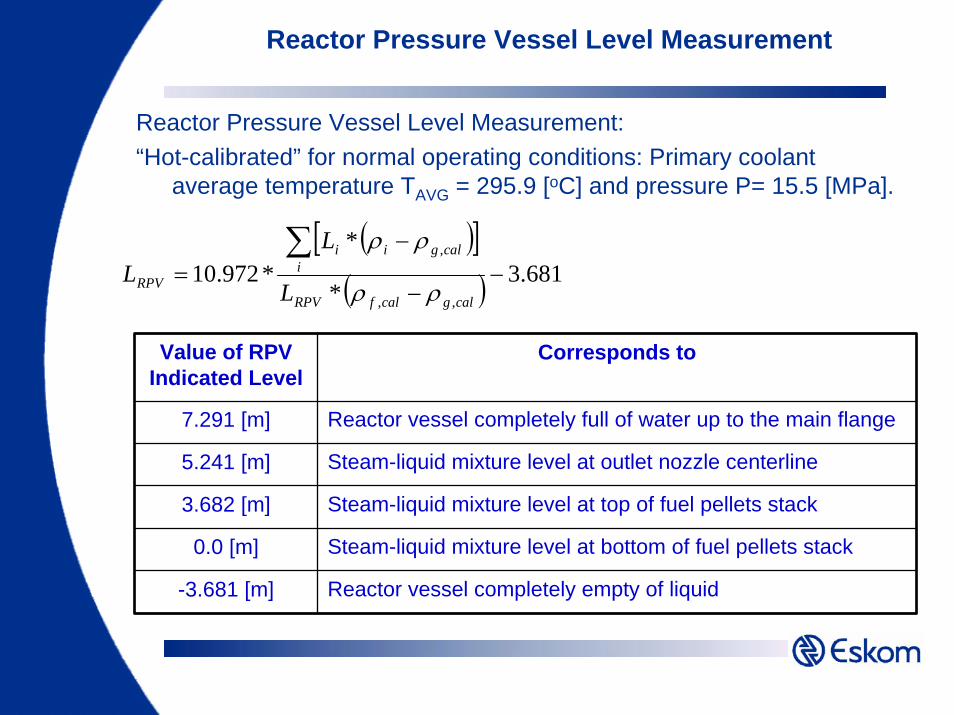
Reactor Pressure Vessel Level Measurement
Reactor Pressure Vessel Level Measurement:“Hot-calibrated” for normal operating conditions: Primary coolant
average temperature TAVG = 295.9 [oC] and pressure P= 15.5 [MPa].
( )[ ]( ) 681.3
*
**972.10
,,
,
−−
−=
∑calgcalfRPV
icalgii
RPV L
LL
ρρ
ρρ
Value of RPVIndicated Level
Corresponds to
7.291 [m] Reactor vessel completely full of water up to the main flange
5.241 [m] Steam-liquid mixture level at outlet nozzle centerline
3.682 [m] Steam-liquid mixture level at top of fuel pellets stack
0.0 [m] Steam-liquid mixture level at bottom of fuel pellets stack
-3.681 [m] Reactor vessel completely empty of liquid

Reactor Pressure Vessel Level Measurement
Station Black Out Without Depressurization Of Secondary SideAFW Flow Rate 80 [m3/h] to SG#1 Only
Fig.0.4. Liquid Level in Reactor Pressure Vessel
0
0.614
1.228
1.842
2.456
3.07
3.684
4.298
4.912
5.526
6.14
6.754
7.368
7.982
-0.5 0 0.5 1 1.5 2 2.5 3 3.5 4 4.5 5 5.5 6 6.5
Time [hours]
Leve
l [m
]
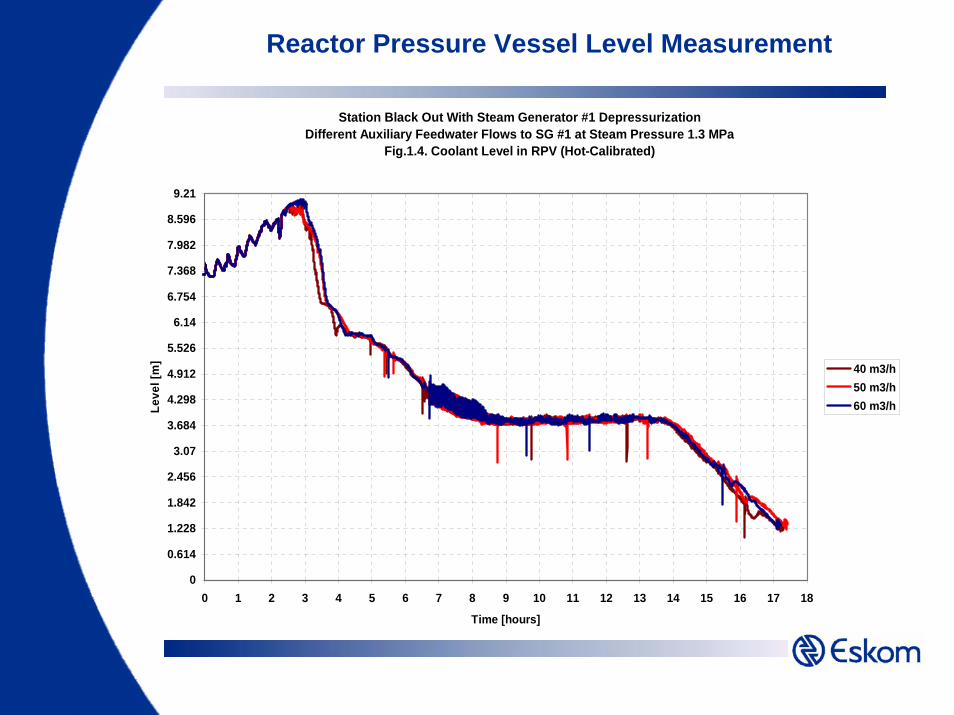
Reactor Pressure Vessel Level Measurement
Station Black Out With Steam Generator #1 DepressurizationDifferent Auxiliary Feedwater Flows to SG #1 at Steam Pressure 1.3 MPa
Fig.1.4. Coolant Level in RPV (Hot-Calibrated)
0
0.614
1.228
1.842
2.456
3.07
3.684
4.298
4.912
5.526
6.14
6.754
7.368
7.982
8.596
9.21
0 1 2 3 4 5 6 7 8 9 10 11 12 13 14 15 16 17 18
Time [hours]
Leve
l [m
] 40 m3/h50 m3/h60 m3/h
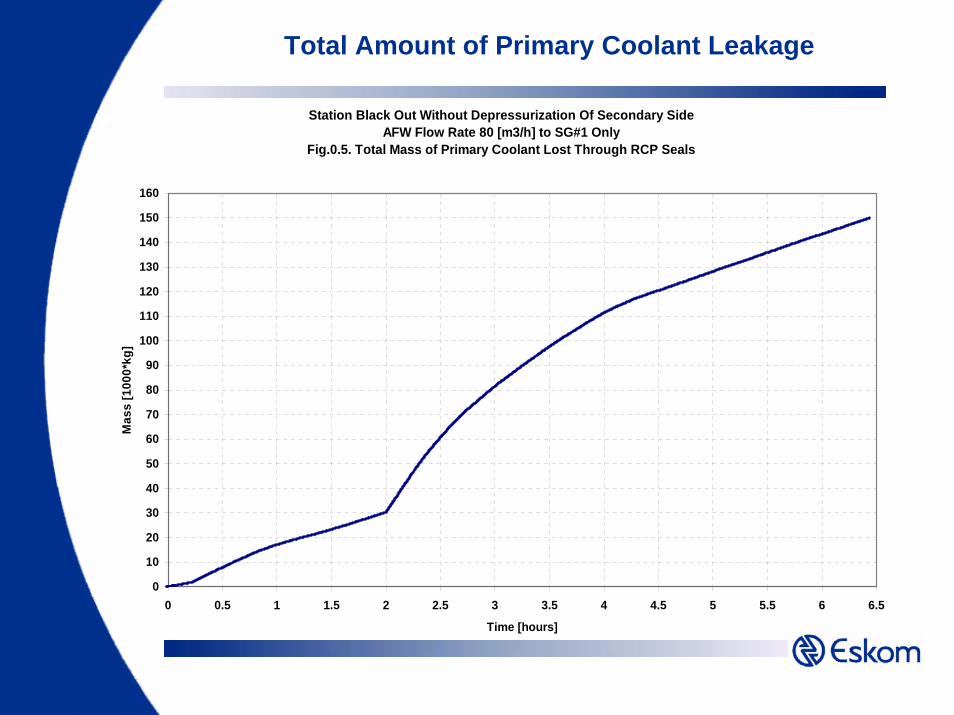
Total Amount of Primary Coolant Leakage
Station Black Out Without Depressurization Of Secondary SideAFW Flow Rate 80 [m3/h] to SG#1 Only
Fig.0.5. Total Mass of Primary Coolant Lost Through RCP Seals
0
10
20
30
40
50
60
70
80
90
100
110
120
130
140
150
160
0 0.5 1 1.5 2 2.5 3 3.5 4 4.5 5 5.5 6 6.5
Time [hours]
Mas
s [1
000*
kg]

Total Amount of Primary Coolant Leakage
Station Black Out With Steam Generator #1 DepressurizationDifferent Auxiliary Feedwater Flows to SG #1 at Steam Pressure 1.3 MPa
Fig.1.5. Coolant Lost Through RCP Seals
0102030405060708090
100110120130140150160170180190200
-1 0 1 2 3 4 5 6 7 8 9 10 11 12 13 14 15 16 17 18
Time [hours]
Mas
s [1
000*
kg]
40 m3/h50 m3/h60 m3/h

Secondary Side Pressure in SG#1 (Depressurized)
Station Black Out Without Depressurization Of Secondary SideAFW Flow Rate 80 [m3/h] to SG#1 Only
Fig.0.6. SG#1 Steam Pressure
0
5
10
15
20
25
30
35
40
45
50
55
60
65
70
75
-0.5 0 0.5 1 1.5 2 2.5 3 3.5 4 4.5 5 5.5 6 6.5
Time [hours]
Pres
sure
[MPa
]
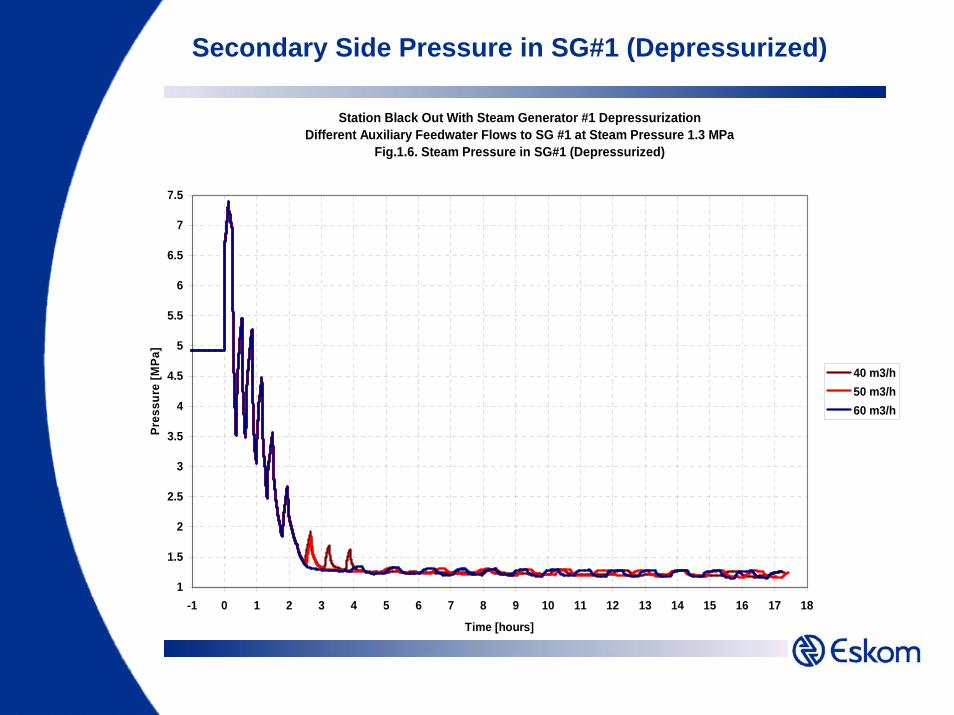
Secondary Side Pressure in SG#1 (Depressurized)
Station Black Out With Steam Generator #1 DepressurizationDifferent Auxiliary Feedwater Flows to SG #1 at Steam Pressure 1.3 MPa
Fig.1.6. Steam Pressure in SG#1 (Depressurized)
1
1.5
2
2.5
3
3.5
4
4.5
5
5.5
6
6.5
7
7.5
-1 0 1 2 3 4 5 6 7 8 9 10 11 12 13 14 15 16 17 18
Time [hours]
Pres
sure
[MPa
]
40 m3/h50 m3/h60 m3/h
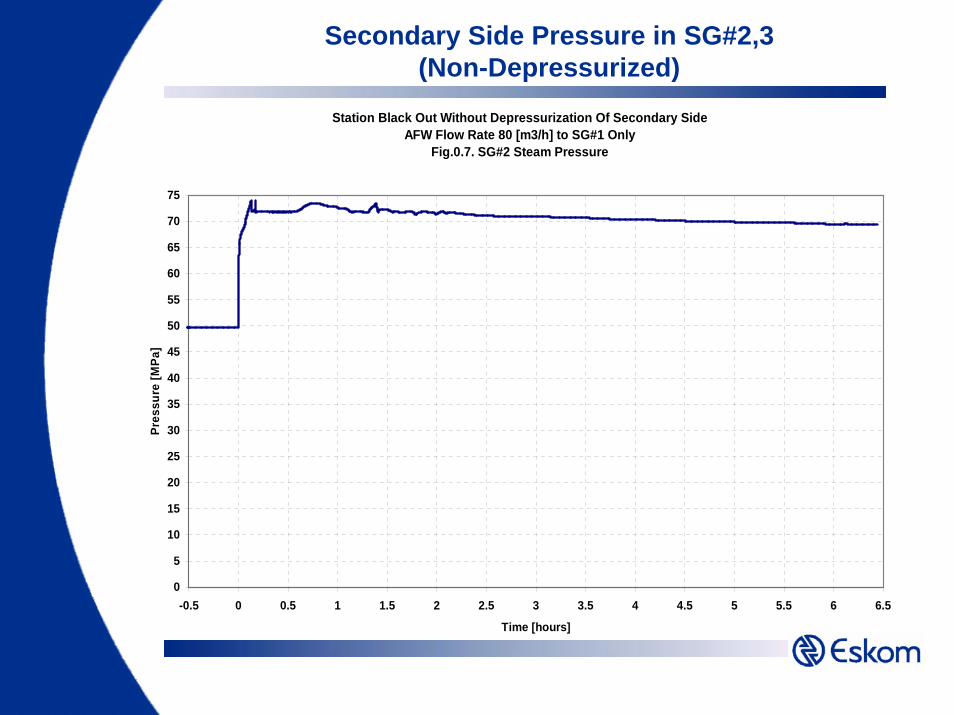
Secondary Side Pressure in SG#2,3 (Non-Depressurized)
Station Black Out Without Depressurization Of Secondary SideAFW Flow Rate 80 [m3/h] to SG#1 Only
Fig.0.7. SG#2 Steam Pressure
0
5
10
15
20
25
30
35
40
45
50
55
60
65
70
75
-0.5 0 0.5 1 1.5 2 2.5 3 3.5 4 4.5 5 5.5 6 6.5
Time [hours]
Pres
sure
[MPa
]
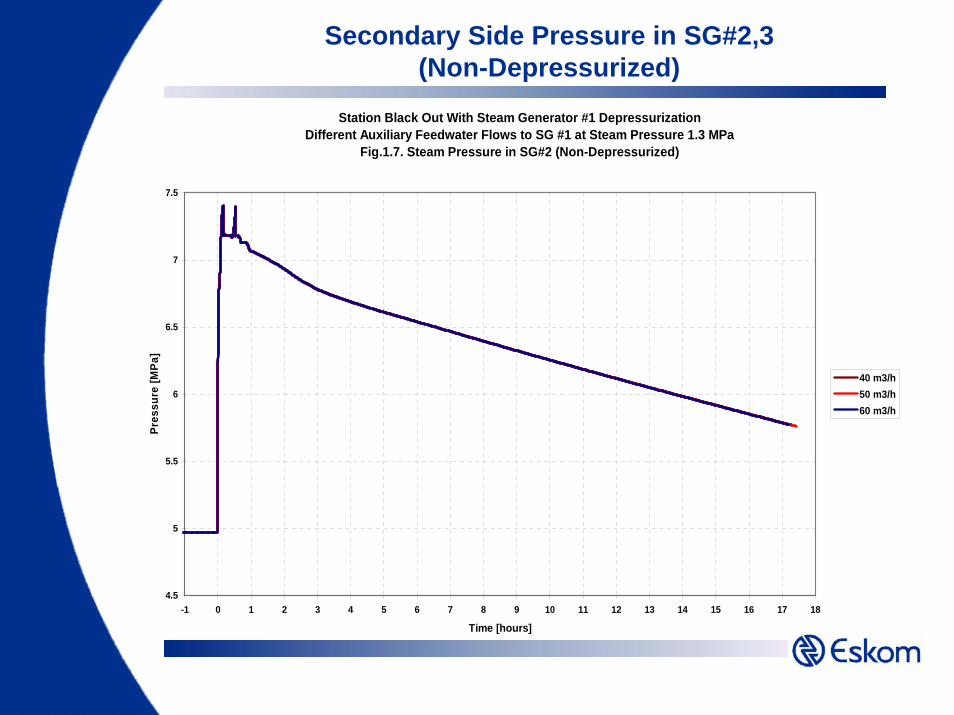
Secondary Side Pressure in SG#2,3 (Non-Depressurized)
Station Black Out With Steam Generator #1 DepressurizationDifferent Auxiliary Feedwater Flows to SG #1 at Steam Pressure 1.3 MPa
Fig.1.7. Steam Pressure in SG#2 (Non-Depressurized)
4.5
5
5.5
6
6.5
7
7.5
-1 0 1 2 3 4 5 6 7 8 9 10 11 12 13 14 15 16 17 18
Time [hours]
Pres
sure
[MPa
]
40 m3/h50 m3/h60 m3/h

Secondary Coolant Inventory in SG#1 (Depressurized)
Station Black Out Without Depressurization Of Secondary SideAFW Flow Rate 80 [cub.m/h] to SG#1
Fig.0.8. SG#1 Secondary Coolant Inventory
45
50
55
60
65
70
75
80
85
-0.5 0 0.5 1 1.5 2 2.5 3 3.5 4 4.5 5 5.5 6 6.5
Time [hours]
Mas
s [1
000*
kg]

Secondary Coolant Inventory in SG#1 (Depressurized)
Station Black Out With Steam Generator #1 DepressurizationDifferent Auxiliary Feedwater Flows to SG #1 at Steam Pressure 1.3 MPa
Fig.1.8. Secondary Coolant Inventory in SG#1 (Depressurized)
44
48
52
56
60
64
68
72
76
80
84
88
92
-1 0 1 2 3 4 5 6 7 8 9 10 11 12 13 14 15 16 17 18
Time [hours]
Mas
s [1
000*
kg]
40 m3/h50 m3/h60 m3/h
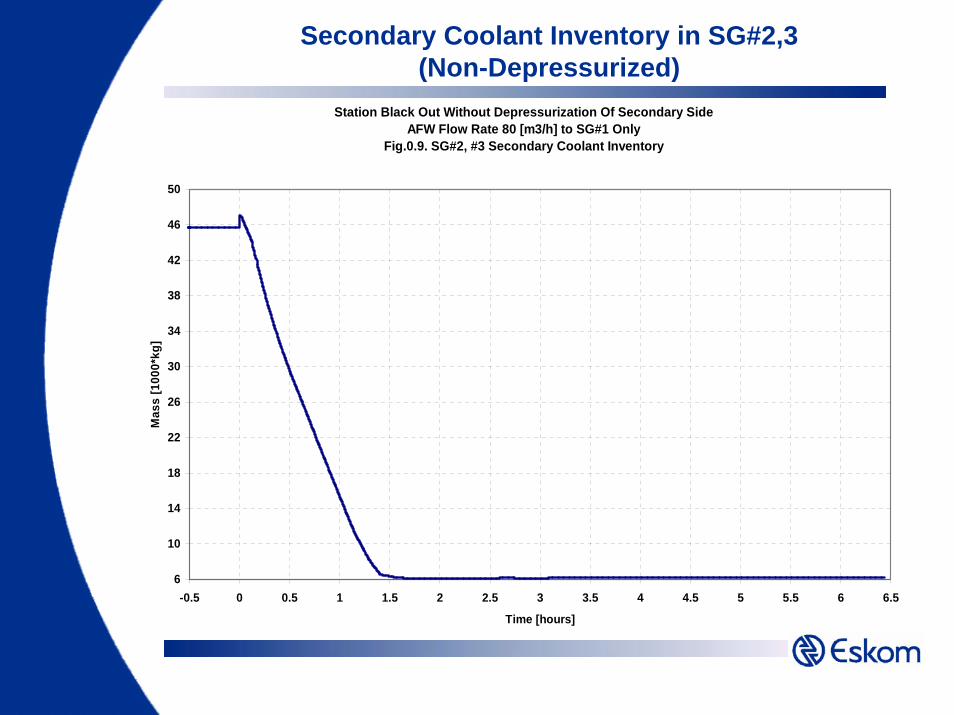
Secondary Coolant Inventory in SG#2,3 (Non-Depressurized)
Station Black Out Without Depressurization Of Secondary SideAFW Flow Rate 80 [m3/h] to SG#1 Only
Fig.0.9. SG#2, #3 Secondary Coolant Inventory
6
10
14
18
22
26
30
34
38
42
46
50
-0.5 0 0.5 1 1.5 2 2.5 3 3.5 4 4.5 5 5.5 6 6.5
Time [hours]
Mas
s [1
000*
kg]
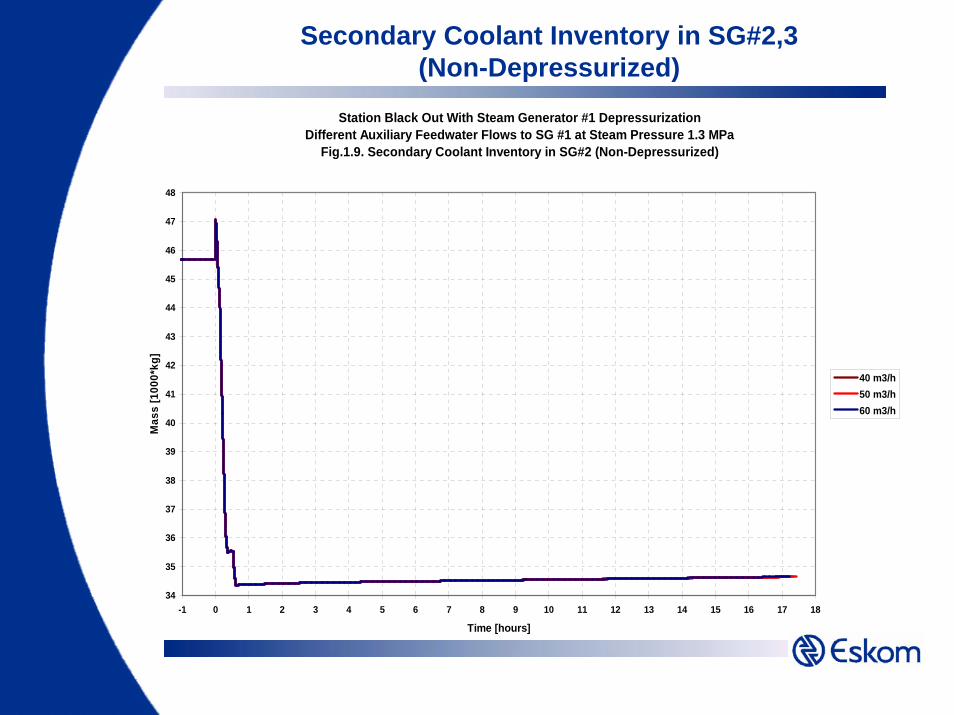
Secondary Coolant Inventory in SG#2,3 (Non-Depressurized)
Station Black Out With Steam Generator #1 DepressurizationDifferent Auxiliary Feedwater Flows to SG #1 at Steam Pressure 1.3 MPa
Fig.1.9. Secondary Coolant Inventory in SG#2 (Non-Depressurized)
34
35
36
37
38
39
40
41
42
43
44
45
46
47
48
-1 0 1 2 3 4 5 6 7 8 9 10 11 12 13 14 15 16 17 18
Time [hours]
Mas
s [1
000*
kg]
40 m3/h50 m3/h60 m3/h

Peak Fuel Cladding Temperature
Station Black Out Without Depressurization Of Secondary SideAFW Flow Rate 80 [m3/h] to SG#1 Only Fig.0.10. Peak Cladding Temperature
523
623
723
823
923
1023
1123
1223
1323
1423
1523
1623
1723
1823
1923
2023
0 0.5 1 1.5 2 2.5 3 3.5 4 4.5 5 5.5 6 6.5
Time [hours]
Tem
pera
ture
[K]

Peak Fuel Cladding Temperature
Station Black Out With Steam Generator #1 DepressurizationDifferent Auxiliary Feedwater Flows to SG #1 at Steam Pressure 1.3 MPa
Fig.1.10. Peak Fuel Cladding Temperature
373
473
573
673
773
873
973
1073
1173
1273
1373
1473
1573
1673
1773
1873
1973
-1 0 1 2 3 4 5 6 7 8 9 10 11 12 13 14 15 16 17 18
Time [hours]
Tem
pera
ture
[K]
40 m3/h50 m3/hhttemp

Maximum Steam Temperature at Core Exit
Station Black Out Without Depressurization Of Secondary SideAFW Flow Rate 80 [m3/h] to SG#1 Only
Fig.0.11. Steam Temperature at Exit from Core Hot Channel
523
573
623
673
723
773
823
873
923
973
1023
-0.5 0 0.5 1 1.5 2 2.5 3 3.5 4 4.5 5 5.5 6 6.5
Time [hours]
Tem
pera
ture
[K]

Maximum Steam Temperature at Core Exit
Station Black Out With Steam Generator #1 DepressurizationDifferent Auxiliary Feedwater Flows to SG #1 at Steam Pressure 1.3 MPa
Fig.1.11. Temperature of Steam at Core Exit
373
423
473
523
573
623
673
723
773
823
873
923
973
1023
1073
-1 0 1 2 3 4 5 6 7 8 9 10 11 12 13 14 15 16 17 18
Time [hours]
Tem
pera
ture
[K]
40 m3/h50 m3/h60 m3/h
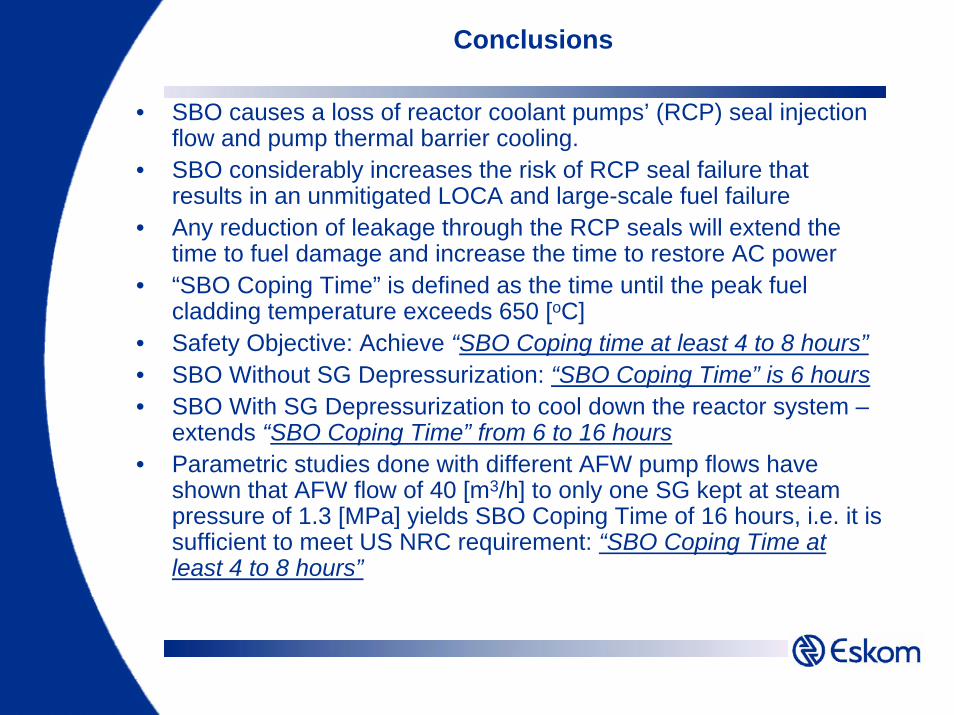
Conclusions
• SBO causes a loss of reactor coolant pumps’ (RCP) seal injection flow and pump thermal barrier cooling.
• SBO considerably increases the risk of RCP seal failure that results in an unmitigated LOCA and large-scale fuel failure
• Any reduction of leakage through the RCP seals will extend the time to fuel damage and increase the time to restore AC power
• “SBO Coping Time” is defined as the time until the peak fuel cladding temperature exceeds 650 [oC]
• Safety Objective: Achieve “SBO Coping time at least 4 to 8 hours”• SBO Without SG Depressurization: “SBO Coping Time” is 6 hours• SBO With SG Depressurization to cool down the reactor system –
extends “SBO Coping Time” from 6 to 16 hours• Parametric studies done with different AFW pump flows have
shown that AFW flow of 40 [m3/h] to only one SG kept at steam pressure of 1.3 [MPa] yields SBO Coping Time of 16 hours, i.e. it is sufficient to meet US NRC requirement: “SBO Coping Time at least 4 to 8 hours”