Analysis of Operations and Support Cost Trends or...
51
1 Analysis of Operations and Support Cost Trends or Why do Aging Aircraft Cost so Much Briefing for Ageing Aircraft Forum October 6-8, 2004 Dr. Laurence W. Stoll NAVAIR Cost Department/Aging Aircraft IPT
Transcript of Analysis of Operations and Support Cost Trends or...

1
Analysis of Operations and Support Cost Trends
or Why do Aging Aircraft Cost so Much
Briefing for Ageing Aircraft ForumOctober 6-8, 2004
Dr. Laurence W. StollNAVAIR Cost Department/Aging Aircraft IPT

AgingACForum.PPT – 10/042
CONTENTS
• Issue of Aircraft Aging• Flying Hour Program (FHP) Cost
Increases• AVDLR “Root Cause” Analysis• New Item Impacts on AVDLR Cost • Consumable Cost Increase Analysis• Consumable Generational Cost Growth• Conclusion and Observations

AgingACForum.PPT – 10/043
A/C Aging Across Almost 100 Years
Aged Old Aircraft
A-4 Skyhawk
First Flight 1954
26+ Production Years with Many Variants
Last Year in Active Fleet 1993
Really Old Aircraft – but not Aging
Trajan Vuia Design – first full size monoplane
First Flight 1906
Common Materials and Parts
Aging Middle Aged Aircraft
AV-8B Harrier
First Flight 1978
Avionics and Systems Upgrades
Currently in Active Fleet
Aging New Aircraft
F/A-18E/F
First Flight 1995
In Production with Road Map Systems Planned
Issue of Aircraft Aging

AgingACForum.PPT – 10/044
Age of Operational AF AircraftOld to New—Current Fleet
Issue of Aircraft Aging
AgingACForum.PPT – 10/045
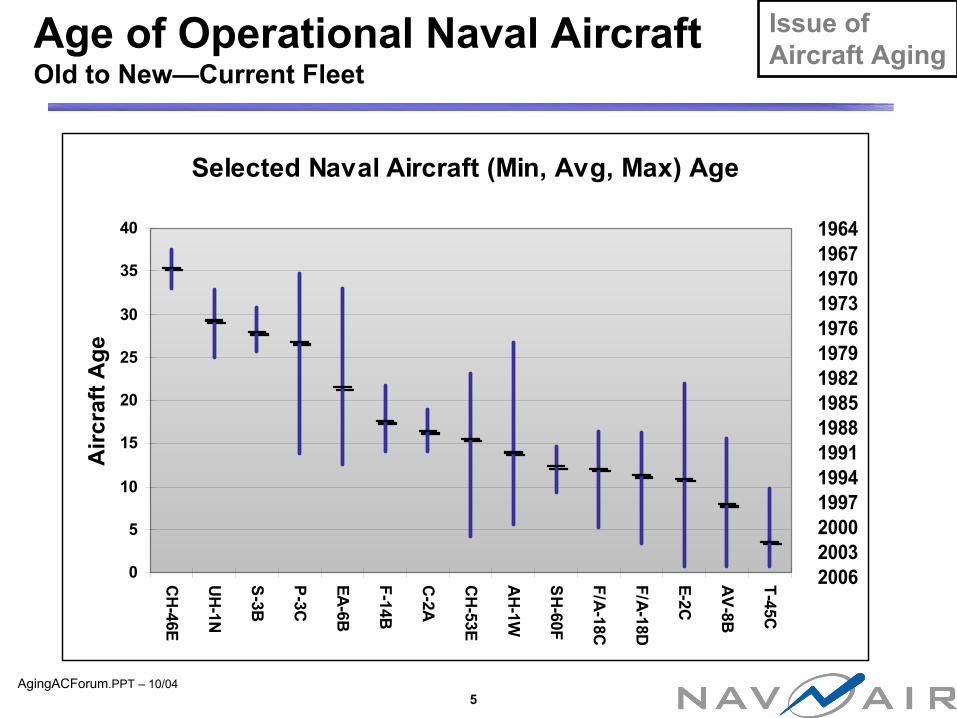
Age of Operational Naval AircraftOld to New—Current Fleet
Selected Naval Aircraft (Min, Avg, Max) Age
0
5
10
15
20
25
30
35
40
CH-46E
UH-1N
S-3B
P-3C
EA-6B
F-14B
C-2A
CH-53E
AH-1W
SH-60F
F/A-18C
F/A-18D
E-2C
AV-8B
T-45C
Airc
raft
Age
196419671970197319761979198219851988199119941997200020032006
Issue of Aircraft Aging

AgingACForum.PPT – 10/046
SELECTED AGE EFFECTS
STRUCTURAL DEGRADATION/CORROSION
EXPIRING WIRING
DYNAMIC COMPONENT WEAR OUT
OUTDATED ELECTRONICS
OVERALL AGING INCLUDING PROPULSION SYSTEMS
Issue of Aircraft Aging
AgingACForum.PPT – 10/047
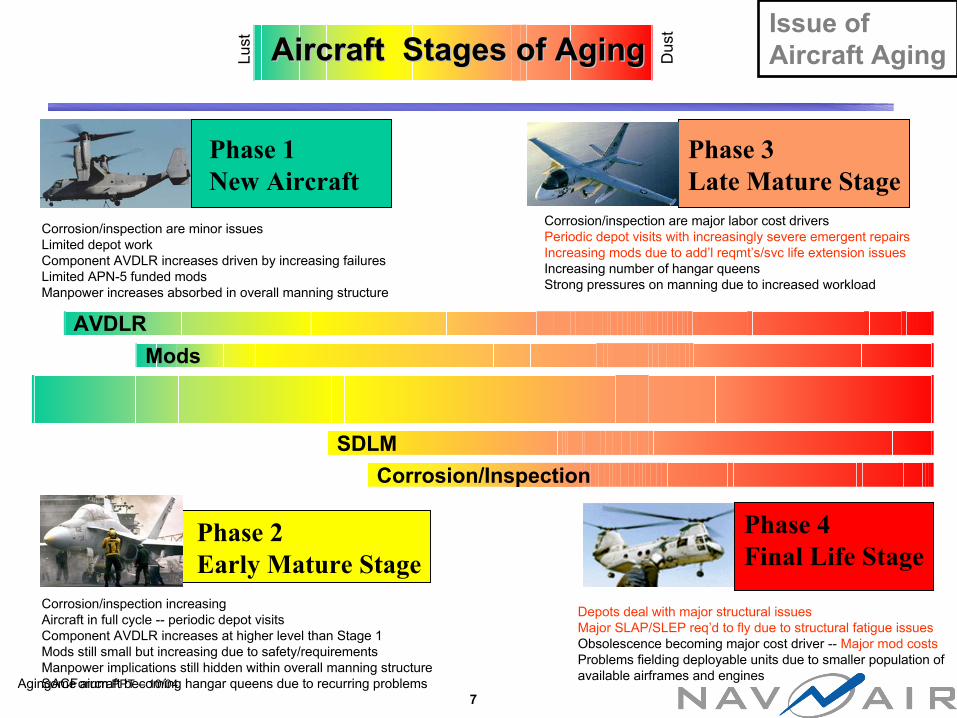
Phase 1 New Aircraft
Corrosion/inspection are minor issuesLimited depot workComponent AVDLR increases driven by increasing failuresLimited APN-5 funded modsManpower increases absorbed in overall manning structure
Phase 3 Late Mature Stage
Corrosion/inspection are major labor cost driversPeriodic depot visits with increasingly severe emergent repairsIncreasing mods due to add’l reqmt’s/svc life extension issuesIncreasing number of hangar queensStrong pressures on manning due to increased workload
Corrosion/inspection increasingAircraft in full cycle -- periodic depot visitsComponent AVDLR increases at higher level than Stage 1Mods still small but increasing due to safety/requirementsManpower implications still hidden within overall manning structureSome aircraft becoming hangar queens due to recurring problems
Phase 2Early Mature Stage
Depots deal with major structural issuesMajor SLAP/SLEP req’d to fly due to structural fatigue issuesObsolescence becoming major cost driver -- Major mod costsProblems fielding deployable units due to smaller population of available airframes and engines
Phase 4 Final Life Stage
Aircraft Stages of AgingAircraft Stages of AgingLust
Dus
t
Mods
SDLM
AVDLR
Corrosion/Inspection
Issue of Aircraft Aging
AgingACForum.PPT – 10/048
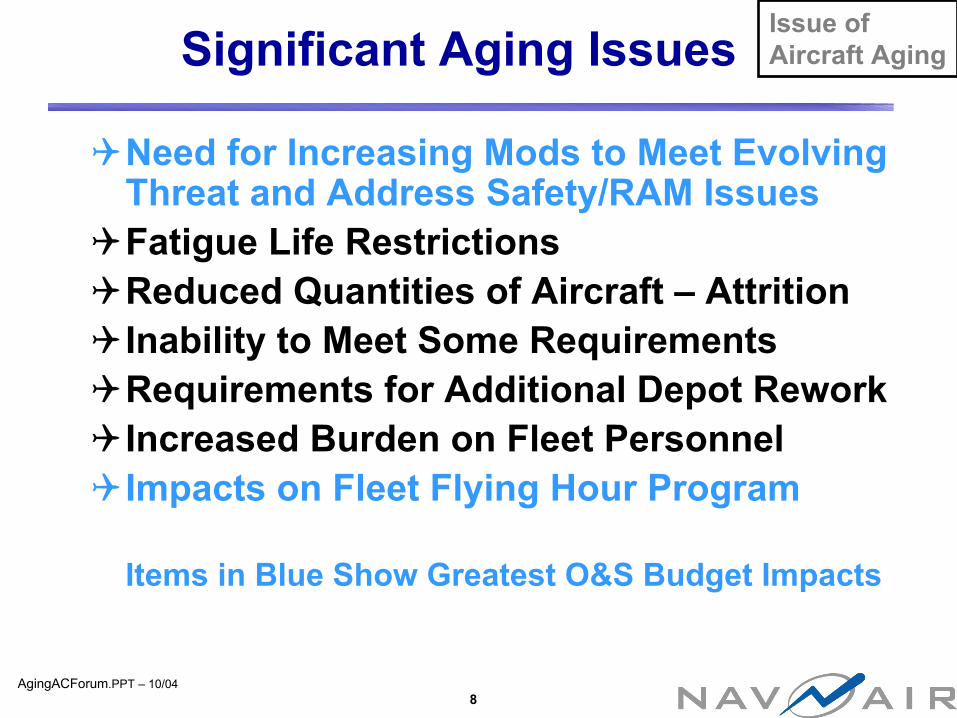
Significant Aging Issues
Need for Increasing Mods to Meet Evolving Threat and Address Safety/RAM IssuesFatigue Life RestrictionsReduced Quantities of Aircraft – AttritionInability to Meet Some RequirementsRequirements for Additional Depot ReworkIncreased Burden on Fleet PersonnelImpacts on Fleet Flying Hour Program
Items in Blue Show Greatest O&S Budget Impacts
Issue of Aircraft Aging

AgingACForum.PPT – 10/049
Naval Aviation O&S Costs
Flying Hour Program AVDLR and Consumables Increasing 6-8% Per Year Including Contribution of Increased Documented CLS Costs
Issue of Aircraft Aging
AgingACForum.PPT – 10/0410
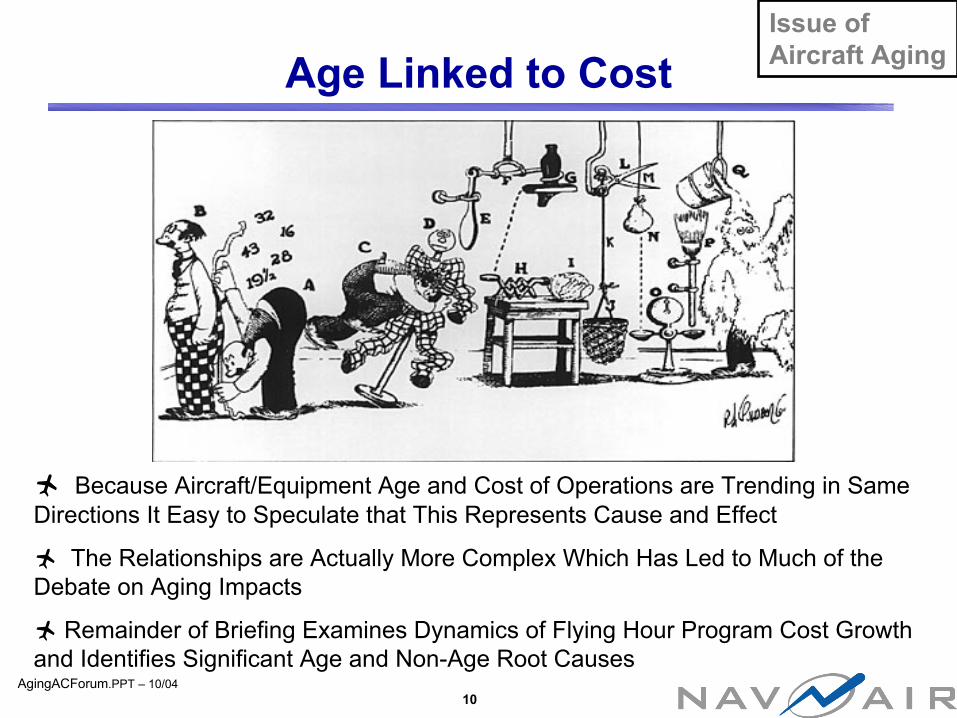
Age Linked to Cost
Because Aircraft/Equipment Age and Cost of Operations are Trending in Same Directions It Easy to Speculate that This Represents Cause and Effect
The Relationships are Actually More Complex Which Has Led to Much of the Debate on Aging Impacts
Remainder of Briefing Examines Dynamics of Flying Hour Program Cost Growth and Identifies Significant Age and Non-Age Root Causes
Issue of Aircraft Aging

AgingACForum.PPT – 10/0411
Flying Hour Program AVDLRCost Increase Big Picture
AVDLR COST GROWTH OVER TIMETotal Force Average Cost Per Hour (FY04 Constant Dollars)
$0
$500
$1,000
$1,500
$2,000
$2,500
$3,000
FY1990
FY1991
FY1992
FY1993
FY1994
FY1995
FY1996
FY1997
FY1998
FY1999
FY2000
FY2001
FY2002
FY2003
FY2004C
ost P
er F
light
Hou
r
Average Annual Rate of Increase (FY90-FY2003) = $108 Pattern “Consistent from FY1990 thru FY2004 FY96 and FY97 Had “Low” Cost Recovery Rates
$1600
Flying Hour Program (FHP) Cost Increases
AgingACForum.PPT – 10/0412
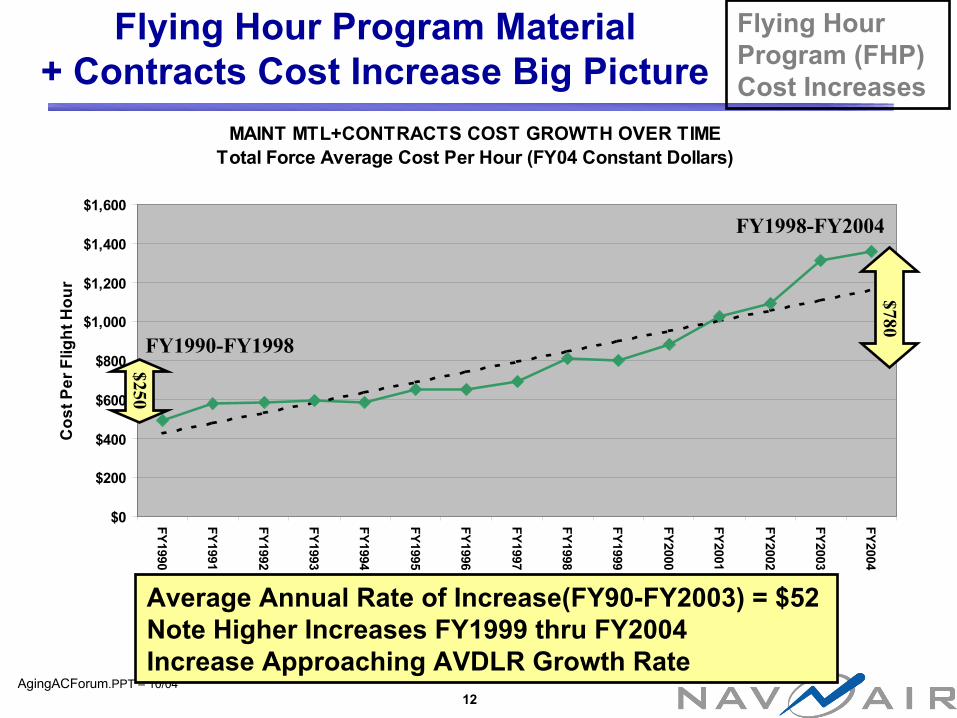
Flying Hour Program Material + Contracts Cost Increase Big Picture
MAINT MTL+CONTRACTS COST GROWTH OVER TIMETotal Force Average Cost Per Hour (FY04 Constant Dollars)
$0
$200
$400
$600
$800
$1,000
$1,200
$1,400
$1,600
FY1990
FY1991
FY1992
FY1993
FY1994
FY1995
FY1996
FY1997
FY1998
FY1999
FY2000
FY2001
FY2002
FY2003
FY2004C
ost P
er F
light
Hou
r
Average Annual Rate of Increase(FY90-FY2003) = $52 Note Higher Increases FY1999 thru FY2004 Increase Approaching AVDLR Growth Rate
$780
$250
FY1990-FY1998
FY1998-FY2004
Flying Hour Program (FHP) Cost Increases
AgingACForum.PPT – 10/0413
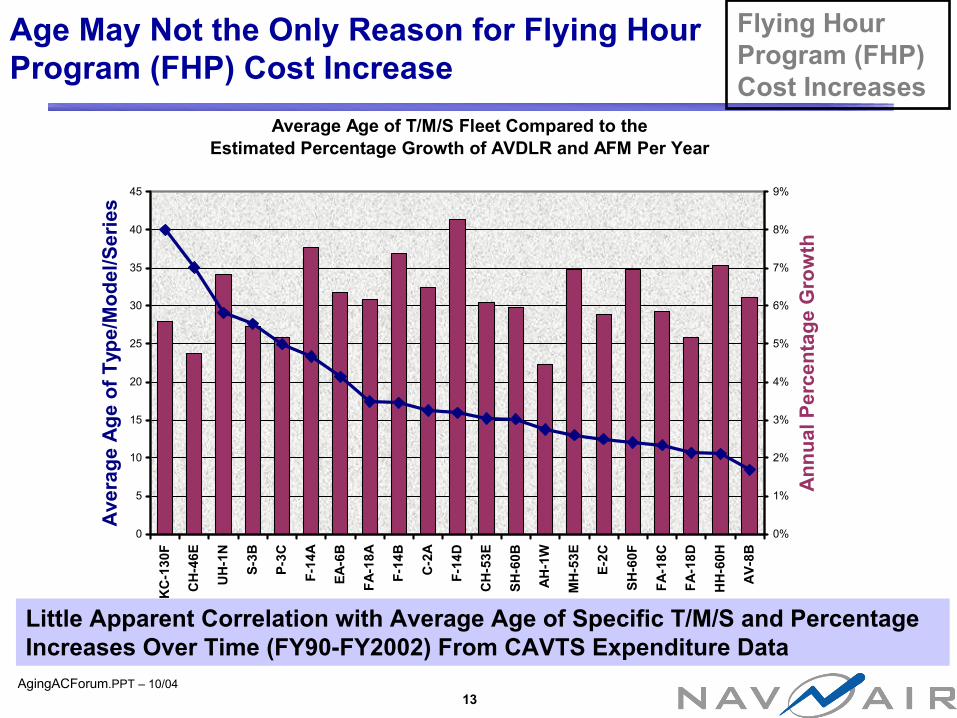
Age May Not the Only Reason for Flying Hour Program (FHP) Cost Increase
Average Age of T/M/S Fleet Compared to theEstimated Percentage Growth of AVDLR and AFM Per Year
0
5
10
15
20
25
30
35
40
45
KC
-130
F
CH
-46E
UH
-1N
S-3B
P-3C
F-14
A
EA-6
B
FA-1
8A
F-14
B
C-2
A
F-14
D
CH
-53E
SH-6
0B
AH
-1W
MH
-53E
E-2C
SH-6
0F
FA-1
8C
FA-1
8D
HH
-60H
AV-
8B
Ave
rage
Age
of T
ype/
Mod
el/S
erie
s
0%
1%
2%
3%
4%
5%
6%
7%
8%
9%
Ann
ual P
erce
ntag
e G
row
th
Little Apparent Correlation with Average Age of Specific T/M/S and Percentage Increases Over Time (FY90-FY2002) From CAVTS Expenditure Data
Flying Hour Program (FHP) Cost Increases
AgingACForum.PPT – 10/0414
Studies To Assess Root Causes for AVDLR Price Increases
• Initial Study on Top 25 Items for Selected Naval T/Ms and Engine TECs Completed Supporting FHP CEBs
• Study Expanded with Air Force Participation in FY2003 as Part of ALB Tasking to Assess Impacts of Aging Fleets on Budgets
• NAVAIR Received Demand and Price Data for AVDLRs from NAVICP for All Items for FY1997-FY2003
• Root Cause Analysis Results Have been Presented to Aviation Logistics Board and JACG
• Causal Factors Include Aging But Also Other Non-Age Related Factors
• NAVAIR Independently Examining Impact of New Items on Current and Future AVDLR costs
AVDLR “Root Cause” Analysis

AgingACForum.PPT – 10/0415
AVDLR Cost GrowthBased on NAVICP Price/Demand History –FY04$
Breakout of Top AVDLR FSC Classifications for Total Demand in TY$ Total Cost Increased 92% in Period FY1997 though FY2003 Top 7 FSCs Accounted for 53% of Total AVDLR in FY2003 Rate of Growth Reasonably Consistent by FSC
$1,263M Increase
AVDLR “Root Cause” Analysis
AgingACForum.PPT – 10/0416
0.0
2.0
4.0
6.0
8.0
10.0
12.0
14.0
16.0
18.0
FY96 FY97 FY98 FY99 FY00 FY01
Mill
ions
0
5
10
15
20
25
30
35
40
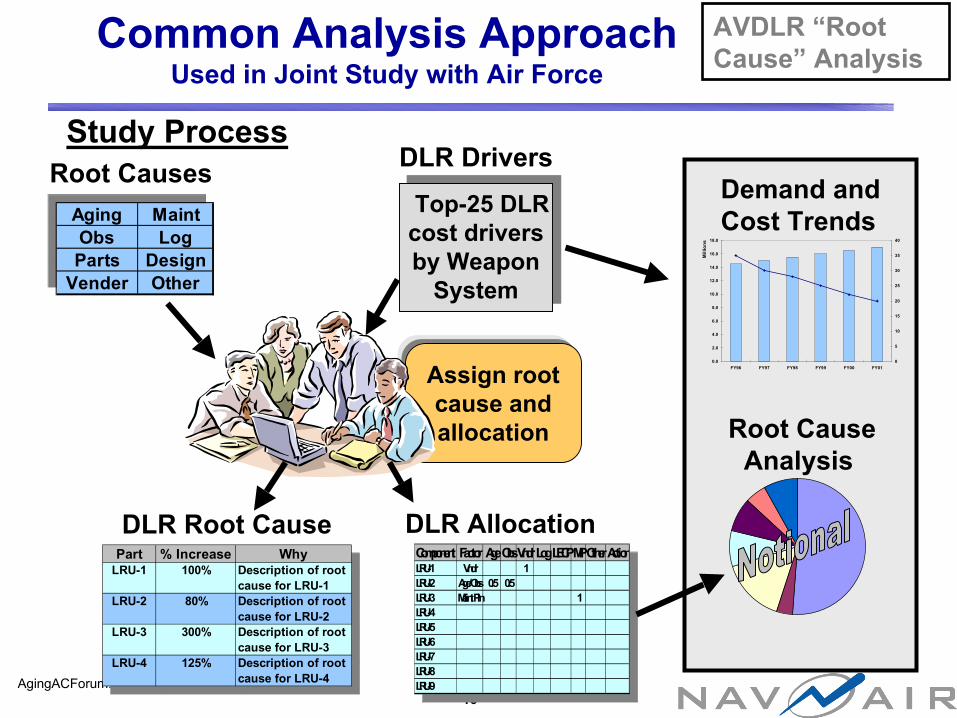
Demand andCost Trends
DLR Root CausePart % Increase Why
LRU-1 100% Description of root cause for LRU-1
LRU-2 80% Description of root cause for LRU-2
LRU-3 300% Description of root cause for LRU-3
LRU-4 125% Description of root cause for LRU-4
Part % Increase WhyLRU-1 100% Description of root
cause for LRU-1LRU-2 80% Description of root
cause for LRU-2LRU-3 300% Description of root
cause for LRU-3LRU-4 125% Description of root
cause for LRU-4
Component Factor AgeObsVndrLogLECPMPOtherActionLRU-1 Vndr 1LRU-2 Age/Obs 0.5 0.5LRU-3 Maint Pln 1LRU-4LRU-5LRU-6LRU-7LRU-8LRU-9
Component Factor AgeObsVndrLogLECPMPOtherActionLRU-1 Vndr 1LRU-2 Age/Obs 0.5 0.5LRU-3 Maint Pln 1LRU-4LRU-5LRU-6LRU-7LRU-8LRU-9
DLR Allocation
Root CauseAnalysis
Assign root cause and allocation
Top-25 DLR cost drivers by Weapon
System
Top-25 DLR cost drivers by Weapon
System
DLR Drivers
Common Analysis ApproachUsed in Joint Study with Air Force
Root CausesAging MaintObs LogParts Design
Vender Other
Aging MaintObs LogParts Design
Vender Other
Study Process
AVDLR “Root Cause” Analysis

AgingACForum.PPT – 10/0417
ROOT CAUSE DEFINITIONS
1. Aging System (Physical aging of equipment)– Reaching life limits– Increased corrosion– Replacement factor for repair parts– “Beyond economic repair” items
2. Obsolescence/Vendor Base/DMS (Causes due to aging of component as type)– Reduced sources/competition– Rework vice replacement of items– Premium prices and Cannibalization
3. New/Replacement parts (Costs attributed to introduction of new parts)– Attrition changes with higher cost materials
4. Vendor Base Changes (costs associated with supplier change)– Changes in vendor sources
5. Maintenance Plan Changes (causes due to maintenance changes)
– 3-level to 2-level maintenance– Discard vice repair– Increased depth of maintenance– Reduction in life limits/increased
frequency
6. Logistics Shortfalls (costs due to lack of logistics plan)
– Support equipment/test equipment– Repair parts– Manpower– Pub updates
7. Design Influences (costs due to design changes)
– Capability growth– Design “mistakes”– Inherent design limitations on R&M
8. Other (not repair process related)Budgetary complications, usage issues, mission changes, threat changes, surcharges & taxes, data problems, etc.
Consensus on Root Causes for DLR cost growth
DLR Analysis Approach
AgingACForum.PPT – 10/0418
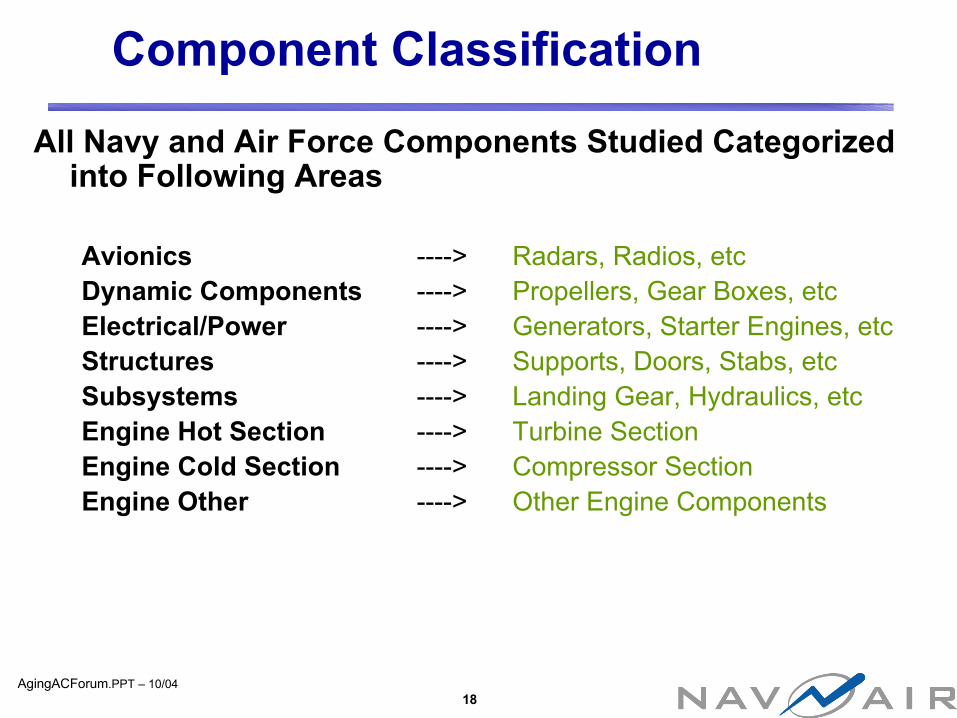
All Navy and Air Force Components Studied Categorized into Following Areas
Avionics ----> Radars, Radios, etcDynamic Components ----> Propellers, Gear Boxes, etcElectrical/Power ----> Generators, Starter Engines, etcStructures ----> Supports, Doors, Stabs, etcSubsystems ----> Landing Gear, Hydraulics, etcEngine Hot Section ----> Turbine SectionEngine Cold Section ----> Compressor SectionEngine Other ----> Other Engine Components
Component Classification

AgingACForum.PPT – 10/0419
Air Force Trend Summary131 Components Analyzed
All AF Components Cost Over Time by Category
-100200300400500600700800900
1,000
FY98 FY99 FY00 FY01 FY02
Mill
ions
Reporting Year
FY98
-FY0
2 D
olla
rs
StructuresSub SystemsEngine OtherEngine ColdEngine HotElectrical/PowerDynamic ComponentAvionics
• Primary Area for Air Force Cost Growth is Engine Component Related
•No Helos or Prop Aircraft in AF DB Minimizes Dynamic Component Area
•Age, New Items and Maintenance Plan Changes All Have Significant AF Impacts
•Vendor Issues Do not Appear to be Significant Root Cause For AF
Root Cause Analysis Age Obs Vndr Dsgn Log New Item Maint PlanAvionics 20.5% 17.7% 5.1% 6.3% 7.5% 22.0% 20.9%Dynamic Component 10.0% 38.0% 0.0% 14.0% 32.0% 0.0% 6.0%Electrical/Power 0.0% 0.0% 0.0% 0.0% 10.8% 72.0% 17.2%Engine Cold 32.2% 0.0% 0.0% 13.4% 3.4% 8.7% 42.3%Engine Hot 48.9% 2.8% 0.0% 12.8% 0.3% 14.5% 20.6%Engine Other 25.0% 0.0% 0.0% 27.5% 0.0% 47.5% 0.0%Structures 66.2% 0.0% 0.0% 0.0% 22.1% 0.0% 11.8%Sub Systems 26.5% 15.9% 5.9% 7.1% 14.7% 24.1% 5.9%
Additional DLR Analysis

AgingACForum.PPT – 10/0420
Navy Trend Summary313 Components Analyzed
• Primary Area for Navy Cost Growth is Dynamic Component and Sub System
•Only Four Engines Studied Reduces Engine Impacts
•Age Appears As Primary Contributor to ALL DLR Categories
•Obsolescence a Key Factor for Avionics Cost Growth
•Maintenance Plan Changes and Vendor Not Primary Causes
All Navy Components Over Time By Category
0
100
200
300
400
500
600
700
800
1997 1998 1999 2000 2001 2002
Mill
ions
Reporting Year
FY98
-FY0
2 D
olla
rs
Sub SystemsStructuresEngine OtherEngine HotEngine ColdElectrical/PowerDynamic ComponentAvionics
Root Cause Analysis Age Obs Vndr Dsgn Log New Item Maint PlanAvionics 27.5% 45.0% 1.3% 8.1% 8.1% 9.4% 0.6%Dynamic Component 61.0% 0.0% 7.3% 3.7% 11.0% 12.2% 4.9%Electrical/Power 40.6% 4.7% 6.3% 37.5% 3.1% 3.1% 4.7%Engine Cold 64.2% 0.0% 0.0% 0.0% 7.7% 28.2% 0.0%Engine Hot 86.2% 0.0% 0.0% 0.0% 0.0% 10.3% 3.4%Engine Other 46.7% 8.3% 0.0% 23.3% 20.0% 1.7% 0.0%Structures 76.7% 3.3% 0.0% 13.3% 0.0% 3.3% 3.3%Sub Systems 52.9% 5.9% 4.4% 10.3% 14.7% 10.3% 1.5%
Additional DLR Analysis

AgingACForum.PPT – 10/0421
Surveillance AircraftNavy P-3, E-2C/C2, S-3
•Most Significant Area of Growth is in Avionics Associated with Mission Systems
• Despite Advanced Age of Navy Surveillance Aircraft DLR Cost Growth of Other Top Components Limited
•Structural DLR Components Insignificant
•Age, Obsolescence and Design Issues Are Primary Root Causes for Surveillance Aircraft
Costs Trends for Surveillance Aircraft
-
20
40
60
80
100
120
140
160
180
200
1998 1999 2000 2001 2002
Mill
ions
Reporting Years
Dol
lars
Sub SystemsStructuresElectrical/PowerDynamic ComponentAvionics
Age Obs Vendor Design Logistics New Item Maint PlanNavy Only 32.2% 23.0% 1.1% 23.6% 9.8% 8.6% 1.7%
Root Cause Analysis:
Additional DLR Analysis

AgingACForum.PPT – 10/0422
Strike Aircraft Navy F/A-18, F-14, EA-6B, AV-8, Air Force F-15, F-16, B-52
• Strike Aircraft Exhibit Significant DLR Increases in All Major Component Areas – One of Two Types With Significant Structural DLRs
•Air Force Has Significant Number of New Items --Reflect Ongoing Modernization
•One Engine Component in F-15 Data Data Responsible for Identified Hot Section
•Navy Age and Obsolescence Root Causes Dominate Strike Community
Costs Trends for Strike Aircraft
-
50
100
150
200
250
300
350
400
450
1998 1999 2000 2001 2002
Mill
ions
Reporting Years
Dol
lars
Sub SystemsStructuresEngine HotElectrical/PowerDynamic ComponentAvionics
Age Obs Vendor Design Logistics New Item Maint PlanAir Force 22.0% 9.9% 2.2% 4.8% 17.4% 30.2% 13.4%Navy 53.9% 21.4% 3.9% 5.2% 10.4% 4.5% 0.6%
Root Cause Analysis:
Additional DLR Analysis
AgingACForum.PPT – 10/0423
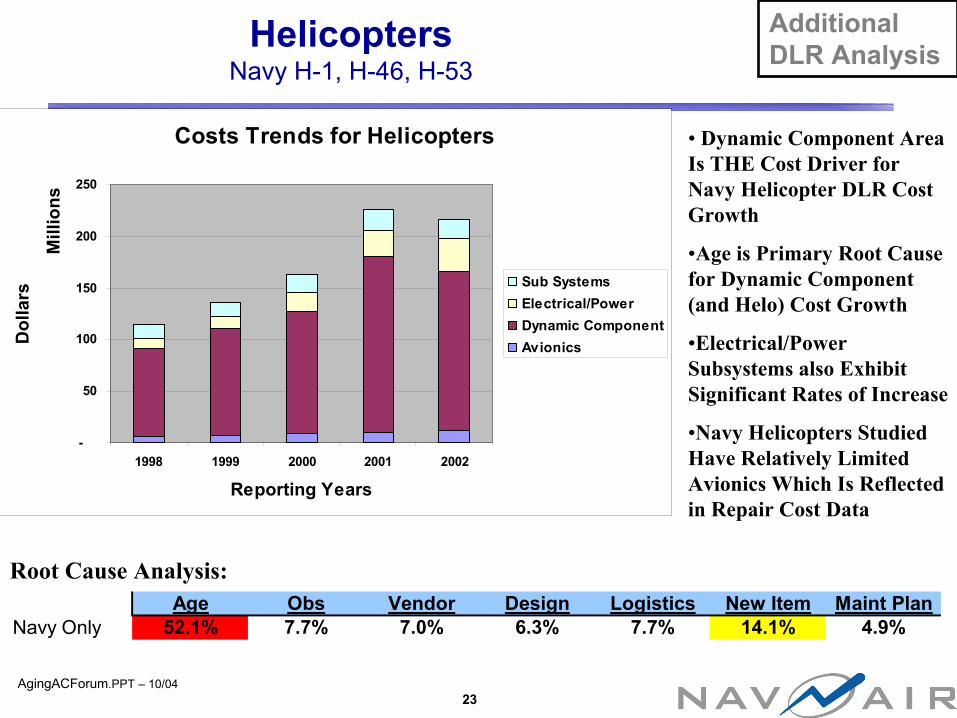
HelicoptersNavy H-1, H-46, H-53
• Dynamic Component Area Is THE Cost Driver for Navy Helicopter DLR Cost Growth
•Age is Primary Root Cause for Dynamic Component (and Helo) Cost Growth
•Electrical/Power Subsystems also Exhibit Significant Rates of Increase
•Navy Helicopters Studied Have Relatively Limited Avionics Which Is Reflected in Repair Cost Data
Costs Trends for Helicopters
-
50
100
150
200
250
1998 1999 2000 2001 2002
Mill
ions
Reporting Years
Dol
lars
Sub SystemsElectrical/PowerDynamic ComponentAvionics
Age Obs Vendor Design Logistics New Item Maint PlanNavy Only 52.1% 7.7% 7.0% 6.3% 7.7% 14.1% 4.9%
Root Cause Analysis:
Additional DLR Analysis

AgingACForum.PPT – 10/0424
Airlift/Tanker AircraftAir Force C-5, C-130
•Root Causes for Cost Increases Closely Grouped Between Design, Age, Obsolescence and Changed Maintenance Plan Issues
•Air Force Data Had Significant Number of Engine Components in Top 25 DLRs for C-5 and C-130
•Structure, Dynamic and Engine Components Responsible for Most of Airlift/Tanker Cost Changes
Costs Trends for Airlift/Tanker Aircraft
-
50
100
150
200
250
1998 1999 2000 2001 2002
Mill
ions
Reporting Years
Dol
lars
Sub SystemsStructuresEngine OtherEngine ColdEngine HotElectrical/PowerDynamic ComponentAvionics
Age Obs Vendor Design Logistics New Item Maint PlanAir Force Only 21.6% 17.6% 4.3% 25.2% 4.0% 11.0% 16.3%
Root Cause Analysis:
Additional DLR Analysis

AgingACForum.PPT – 10/0425
Aircraft EnginesNavy T700,T56, F402, F404 Air Force F100, F110
• Age is Primary Cost Growth Driver for Both Air Force and Navy Engines
•Engine Hot Section Components Contribute Most of Total Cost
•Difference in Maintenance Practices and More Recent Investments Lead to Increased Significance for New Items and Maintenance Plan Changes for Air Force
•Given Stability of Engine Firms Vendor Issues Minimal
Costs Trends for Aircraft Engines
-
100
200
300
400
500
600
700
800
1998 1999 2000 2001 2002
Mill
ions
Reporting Years
Dol
lars Engine Other
Engine ColdEngine Hot
Age Obs Vendor Design Logistics New Item Maint PlanAir Force 50.5% 0.5% 0.0% 2.5% 0.0% 18.6% 27.9%Navy 66.2% 3.4% 0.0% 9.6% 9.6% 9.8% 1.4%
Root Cause Analysis:
Additional DLR Analysis

AgingACForum.PPT – 10/0426
Observations From AVDLR Data Analysis
• Simplistic Explanations that Aging Drives Flying Hour Program DLR Cost Increases Ignore Very Real Differences between Services and Types of Aircraft
•Success Oriented Approaches to Reduce Cost MUST Consider Both Types of Components and Root Causes by Platform Type
•Both Air Force and Navy Datasets Identify Engine Components as the Area Most Directly Tied to Age
• Given Ongoing Modifications to Meet Threats for “Combat” Aircraft New Items Will Be A Major Cost Increase Area Regardless of Airframe Age
• Although Not Noted in Presented Data Top 25 Components Represent a Significant Portion of Total DLR Costs for Studied Platforms
•ALB Data Analysis Set Provides Many Additional Insights that Briefing Format Precludes Addressing
AVDLR “Root Cause” Analysis

AgingACForum.PPT – 10/0427
Study To Assess Impact Of New AVDLR Items Entering the Inventory
• NAVSUP Provided Databases With Demand, Price, and Date of Entry Into Supply System for About 25,000 Different DLR Items
• Data Extracted and Analyzed by Date of Entry to Observe Trends Based on Both Demand (Function of Reliability and Usage) and Unit Repair Price (Function of Complexity, Vendors, Obsolescence)
• Result Charts Represent Summary of Much More Detailed Analysis
New Item Impacts on AVLDR Cost
AgingACForum.PPT – 10/0428
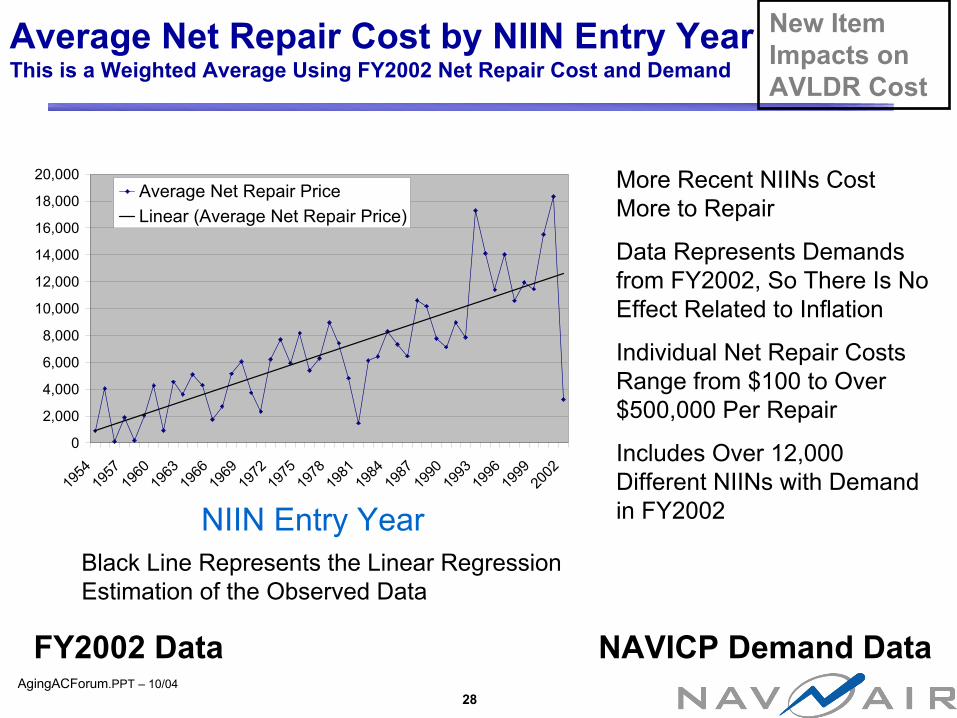
Average Net Repair Cost by NIIN Entry YearThis is a Weighted Average Using FY2002 Net Repair Cost and Demand
0
2,000
4,000
6,000
8,000
10,000
12,000
14,000
16,000
18,000
20,000
1954
1957
1960
1963
1966
1969
1972
1975
1978
1981
1984
1987
1990
1993
1996
1999
2002
Average Net Repair PriceLinear (Average Net Repair Price)
NAVICP Demand DataFY2002 Data
NIIN Entry Year
More Recent NIINs Cost More to Repair
Data Represents Demands from FY2002, So There Is No Effect Related to Inflation
Individual Net Repair Costs Range from $100 to Over $500,000 Per Repair
Includes Over 12,000 Different NIINs with Demand in FY2002
Black Line Represents the Linear Regression Estimation of the Observed Data
New Item Impacts on AVLDR Cost
AgingACForum.PPT – 10/0429
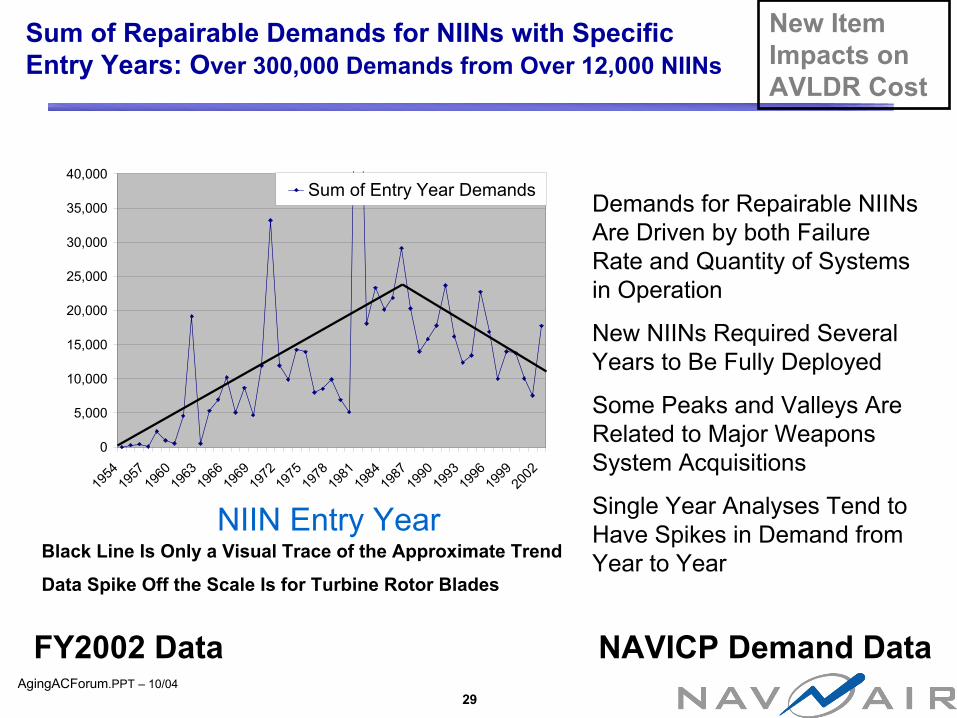
Sum of Repairable Demands for NIINs with Specific Entry Years: Over 300,000 Demands from Over 12,000 NIINs
NAVICP Demand DataFY2002 Data
NIIN Entry Year
Demands for Repairable NIINs Are Driven by both Failure Rate and Quantity of Systems in Operation
New NIINs Required Several Years to Be Fully Deployed
Some Peaks and Valleys Are Related to Major Weapons System Acquisitions
Single Year Analyses Tend to Have Spikes in Demand from Year to YearBlack Line Is Only a Visual Trace of the Approximate Trend
Data Spike Off the Scale Is for Turbine Rotor Blades
0
5,000
10,000
15,000
20,000
25,000
30,000
35,000
40,000
1954
1957
1960
1963
1966
1969
1972
1975
1978
1981
1984
1987
1990
1993
1996
1999
2002
Sum of Entry Year Demands
New Item Impacts on AVLDR Cost

AgingACForum.PPT – 10/0430
FY2002 Cost of DLRs by Entry YearTotal Demand: $2.2Billion
NAVICP Demand DataFY2002 Data
NIIN Entry Year
Newer NIINs Represent the Largest Portion of the Cost of Repairables
Even the Newest NIINs Impact the Overall Cost of Depot Level Repair
Demand and Cost Trail-Off As Systems Retire
It Is Likely Some New NIINs Will Not Have Any Demand for the Initial Years of Deployment.
Black Line Is Only a Visual Trace of the Approximate Trend
0
50
100
150
200
250
300
1954
1957
1960
1963
1966
1969
1972
1975
1978
1981
1984
1987
1990
1993
1996
1999
2002
Mill
ions
Net Price * Demand
New Item Impacts on AVLDR Cost

AgingACForum.PPT – 10/0431
Number of Failures per NIIN Does Not Appear to Change Significantly Between New and Old NIINs
NAVICP Demand DataFY1997-2001 Data
This Chart Uses Five Years of Data to Reduce Some of the Individual Year Spikes
NIIN Entry Year
0
10
20
30
40
50
60
70
80
90
1954
1957
1960
1963
1966
1969
1972
1975
1978
1981
1984
1987
1990
1993
1996
1999
2002
0
100
200
300
400
500
600
700
Dem
ands
per
NIIN
NIIN
s pe
r Ent
ry Y
ear
The Blue Line Shows the Average Number of Demands per NIIN by Entry Year. It Tends to Be Around 25 Demands per NIIN
The Yellow Bars Show the Number of NIINs from Each Entry Year
New Item Impacts on AVLDR Cost

AgingACForum.PPT – 10/0432
1992 Compared to 2001Using Center for Naval Analysis Aging Aircraft Study Data
NIIN Entry Year NIIN Entry Year
Demand Net Repair Price * Demand
1992 - 209,000 Demands
2001 - 216,000 Demands
Approximately Equal Demand
Does Not Include All TMS
1992 - $916 Million
2001 - $1,772 Million
Cost of Repair Is Almost Doubled
“CNA” DataNo New Aircraft Types Have Significantly Influenced the Total Inventory
0
2
4
6
8
10
12
14
16
18
1952
1957
1960
1963
1966
1969
1972
1975
1978
1981
1984
1987
1990
1993
1996
1999
Thou
sand
s
FY2001
FY1992
0
20
40
60
80
100
120
1952
1957
1960
1963
1966
1969
1972
1975
1978
1981
1984
1987
1990
1993
1996
1999
Milli
ons
FY2001
FY1992
New Item Impacts on AVLDR Cost
AgingACForum.PPT – 10/0433
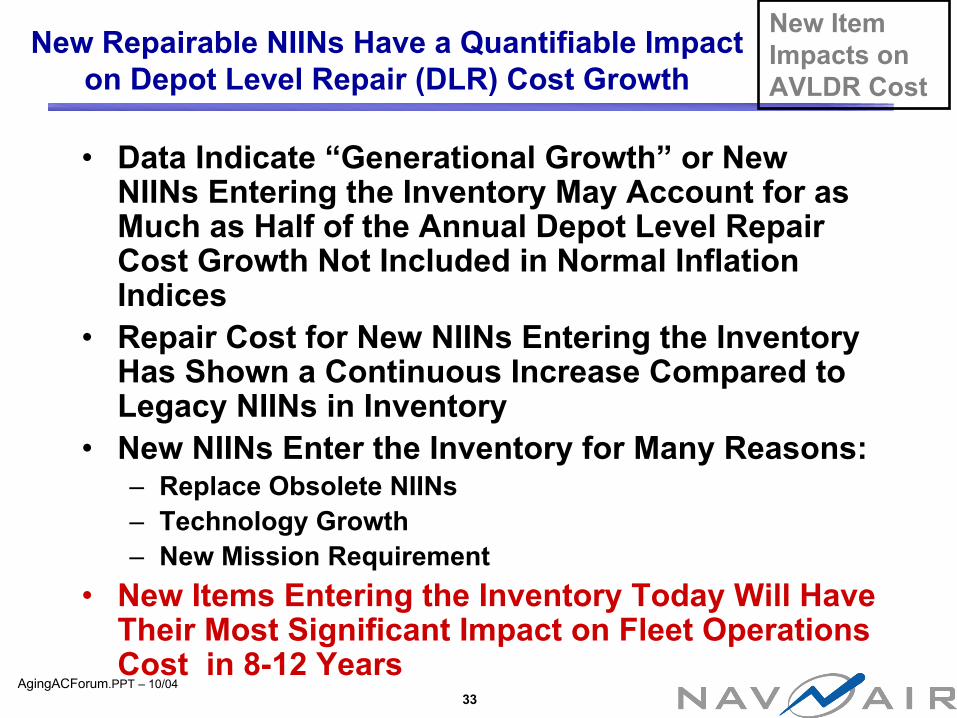
New Repairable NIINs Have a Quantifiable Impact on Depot Level Repair (DLR) Cost Growth
• Data Indicate “Generational Growth” or New NIINs Entering the Inventory May Account for as Much as Half of the Annual Depot Level Repair Cost Growth Not Included in Normal Inflation Indices
• Repair Cost for New NIINs Entering the Inventory Has Shown a Continuous Increase Compared to Legacy NIINs in Inventory
• New NIINs Enter the Inventory for Many Reasons:– Replace Obsolete NIINs– Technology Growth– New Mission Requirement
• New Items Entering the Inventory Today Will Have Their Most Significant Impact on Fleet Operations Cost in 8-12 Years
New Item Impacts on AVLDR Cost

AgingACForum.PPT – 10/0434
Study To Assess Impact of Changes on DLA Managed Consumable Items
• DLA Funding and NAVAIR Aging Aircraft IPT Directing a Study on Consumable Cost Changes
• Considered as Companion to AVDLR Study• DLA Database Provided Covering Over 1 million
aviation consumables for FY1994 thru FY2003• Detailed Analysis Conducted Linked to Weapon
Systems and Federal Supply Classifications to Identify Focus Areas
• Ongoing Analysis to Investigate Root Causes for Selected NSNs
• NAVAIR Independently Examining Impact of New Items
Consumable Cost Increase Analysis

All Aviation Consumable Items Dollar Demand Chart
Dollars Spent based on Standard Prices(Adjusted for Inflation, In Millions)
$0
$1,000
$2,000
$3,000
$4,000
FY93 FY94 FY95 FY96 FY97 FY98 FY99 FY00 FY01 FY02
$2,000M Increase
Consumable Cost Increase Analysis
DLA Managed Consumable Items Have Experienced Significant Increases in Acquisition Costs Over Ten Year Period
AgingACForum.PPT – 10/0436
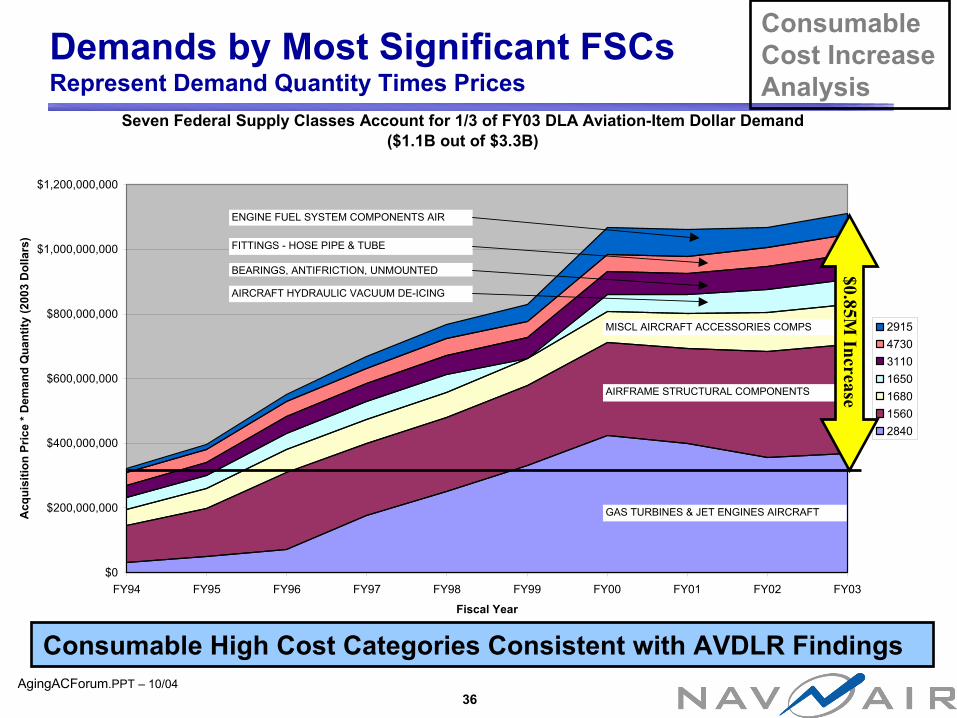
Demands by Most Significant FSCsRepresent Demand Quantity Times Prices
Seven Federal Supply Classes Account for 1/3 of FY03 DLA Aviation-Item Dollar Demand ($1.1B out of $3.3B)
$0
$200,000,000
$400,000,000
$600,000,000
$800,000,000
$1,000,000,000
$1,200,000,000
FY94 FY95 FY96 FY97 FY98 FY99 FY00 FY01 FY02 FY03
Fiscal Year
Acq
uisi
tion
Pric
e * D
eman
d Q
uant
ity (2
003
Dol
lars
)
2915473031101650168015602840
GAS TURBINES & JET ENGINES AIRCRAFT
AIRFRAME STRUCTURAL COMPONENTS
MISCL AIRCRAFT ACCESSORIES COMPS
AIRCRAFT HYDRAULIC VACUUM DE-ICING
BEARINGS, ANTIFRICTION, UNMOUNTED
FITTINGS - HOSE PIPE & TUBE
ENGINE FUEL SYSTEM COMPONENTS AIR
$0.85M Increase
Consumable Cost Increase Analysis
Consumable High Cost Categories Consistent with AVDLR Findings

AgingACForum.PPT – 10/0437
Gas Turbine and Jet Engines Aircraft ChangesFSC 2840 Demands and NSN Count
The Count of Engine Items (FSC 2840) Managed by DLA Has Grown Considerably
$0
$50,000,000
$100,000,000
$150,000,000
$200,000,000
$250,000,000
$300,000,000
$350,000,000
$400,000,000
$450,000,000
FY94 FY95 FY96 FY97 FY98 FY99 FY00 FY01 FY02 FY03
Fiscal Year
Acq
uisi
tion
Pric
e * D
olla
r Dem
and
(200
3 D
olla
rs)
0
2,000
4,000
6,000
8,000
10,000
12,000
14,000
Dollar Demand Count of Priced Items
Consumable Cost Increase Analysis
Significant Increase in FSC2840 Demand Culminating in FY1997
AgingACForum.PPT – 10/0438
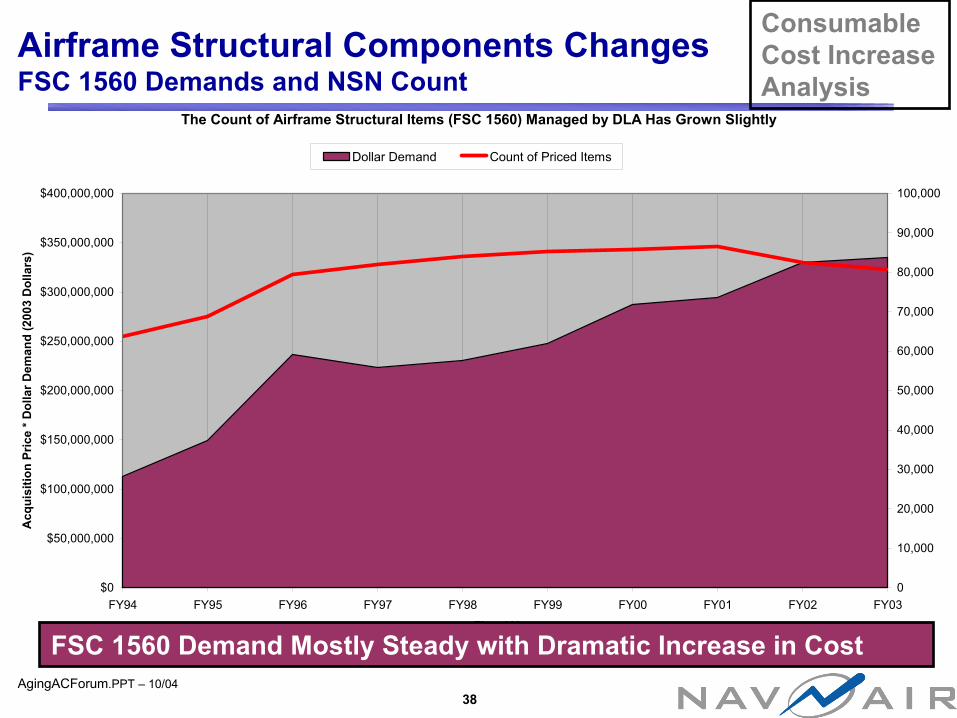
Airframe Structural Components ChangesFSC 1560 Demands and NSN Count
The Count of Airframe Structural Items (FSC 1560) Managed by DLA Has Grown Slightly
$0
$50,000,000
$100,000,000
$150,000,000
$200,000,000
$250,000,000
$300,000,000
$350,000,000
$400,000,000
FY94 FY95 FY96 FY97 FY98 FY99 FY00 FY01 FY02 FY03
Fiscal Year
Acq
uisi
tion
Pric
e * D
olla
r Dem
and
(200
3 D
olla
rs)
0
10,000
20,000
30,000
40,000
50,000
60,000
70,000
80,000
90,000
100,000
Dollar Demand Count of Priced Items
Consumable Cost Increase Analysis
FSC 1560 Demand Mostly Steady with Dramatic Increase in Cost

AgingACForum.PPT – 10/0439
Cost and/or Demand Observed GrowthFurther Investigation Ongoing on Items From “Growth” Group
Consumable Cost Increase Analysis
Regression Analysis Trending Applied to DLA Managed Items Approximately 100,000 Items Have Clear Demand and/or Cost Trends

AgingACForum.PPT – 10/0440
Applying DLR Generational Growth Study Approach to Investigate DLA Consumable Data
• Entry Year Analyses of NIIN Distribution, Demand, Average Acquisition Price and Total Dollar Demand for Consumables Are Similar to Results from the DLR Study
• Data Indicate Consumables Have Considerable Uniform Cost Growth Over Time for All Entry Years Greater than Inflation
• General Observations:– DLA consumable acquisition costs are growing at 8-10% per year – Normal inflation can account for about 1.3% of the growth– New items entering each year can account for perhaps 1%– New items in general cost more than older items in the inventory
and new items have a ramp up in demand over the first 10-15 years of service. This cost and demand growth result in 3-4% growth annually even with constant overall demand.
– There is a general trend across all consumables to increase in acquisition cost 3% per year above inflation.
Consumable Generational Cost Growth
AgingACForum.PPT – 10/0441
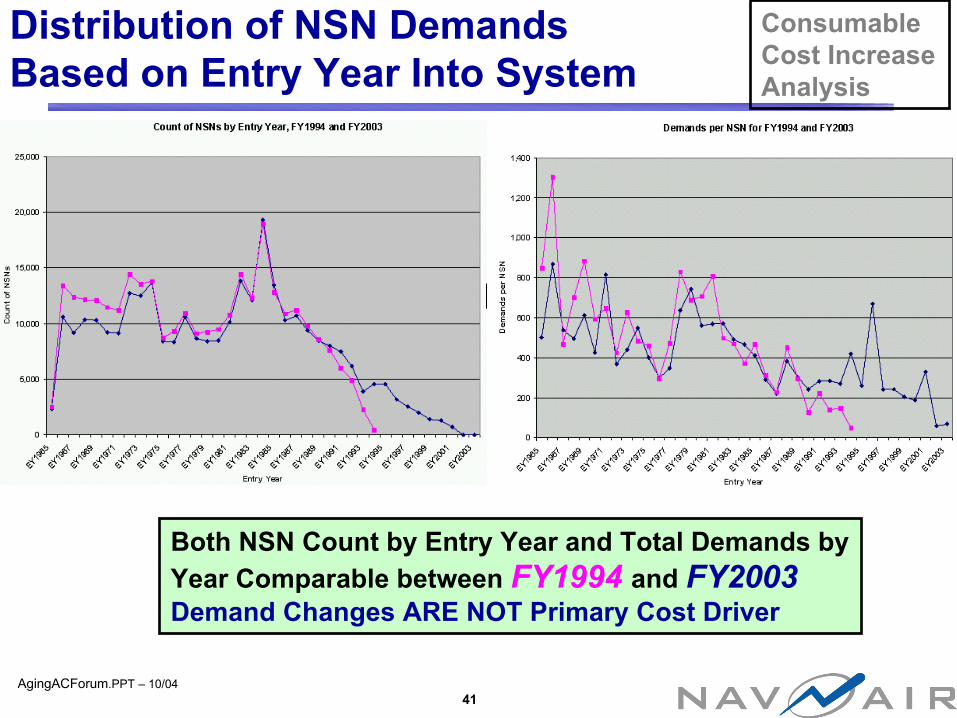
Distribution of NSN Demands Based on Entry Year Into System
Consumable Cost Increase Analysis
Both NSN Count by Entry Year and Total Demands by Year Comparable between FY1994 and FY2003 Demand Changes ARE NOT Primary Cost Driver

AgingACForum.PPT – 10/0442
Average Demand by Entry Year Using FY1994, FY1997, FY2000 and FY2003 Data
0
1
2
3
4
5
6
7
8
9
10
T-39
T-37
T-35
T-33
T-31
T-29
T-27
T-25
T-23
T-21
T-19
T-17
T-15
T-13
T-11 T-9
T-7
T-5
T-3
T-1
Mill
ions
Analysis DemandAverage Observed Demand
The Solid Line Is Used to Compute the Modeled Demand, Price, Cost Growth
The Dashed Line Is the Average Demand by Entry Year. The First Year in Inventory Is Considered “T-0”
Consumable Cost Increase Analysis
Trend Over Time Related to Date of Entry into Inventory ExhibitsConsistent Pattern With New Items Demand Building Over Time
AgingACForum.PPT – 10/0443
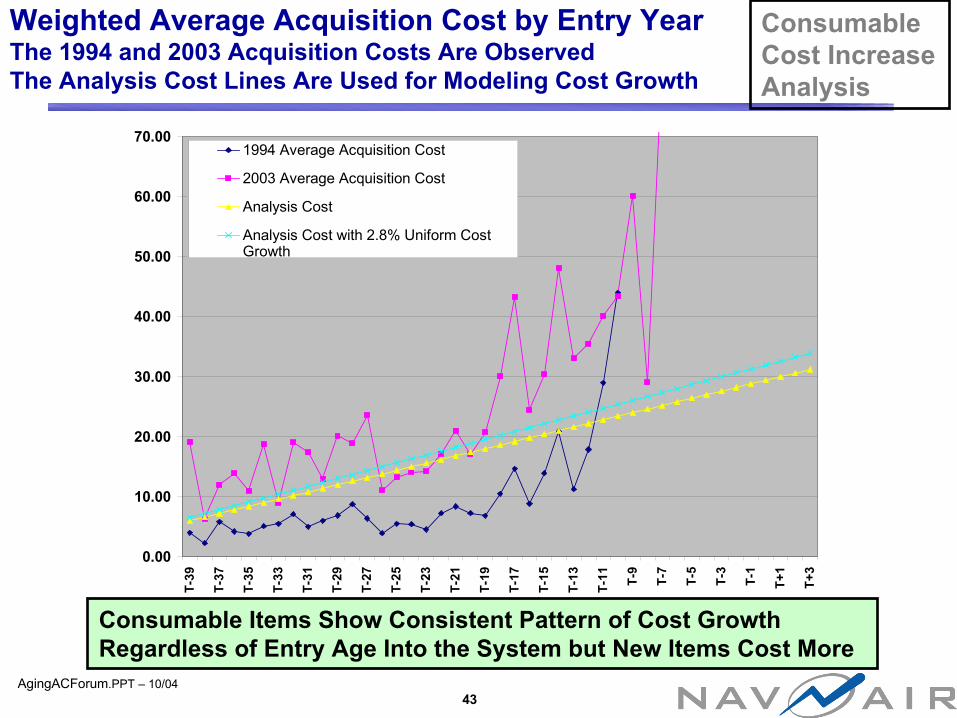
Weighted Average Acquisition Cost by Entry YearThe 1994 and 2003 Acquisition Costs Are ObservedThe Analysis Cost Lines Are Used for Modeling Cost Growth
0.00
10.00
20.00
30.00
40.00
50.00
60.00
70.00
T-39
T-37
T-35
T-33
T-31
T-29
T-27
T-25
T-23
T-21
T-19
T-17
T-15
T-13
T-11 T-
9
T-7
T-5
T-3
T-1
T+1
T+3
1994 Average Acquisition Cost
2003 Average Acquisition Cost
Analysis Cost
Analysis Cost with 2.8% Uniform CostGrowth
Consumable Cost Increase Analysis
Consumable Items Show Consistent Pattern of Cost Growth Regardless of Entry Age Into the System but New Items Cost More

AgingACForum.PPT – 10/0444
Cost Growth T-0 to T+3, Assuming Constant DemandNew Items Drive Leading Edge GrowthUniform Cost Growth Drives Up the Entire Curve
0
20
40
60
80
100
120
140
160
180
T-39
T-37
T-35
T-33
T-31
T-29
T-27
T-25
T-23
T-21
T-19
T-17
T-15
T-13
T-11 T-
9
T-7
T-5
T-3
T-1
T+1
T+3
Mill
ions T-0 Value of Demand
T+3 Value of Demand
FY2000 Observed Value of Demand
FY2003 Observed Value of Demand
T+3 Generational Growth Only
Consumable Cost Increase Analysis
Generational Cost Growth Shifts Value of Demand Curve Higher with Both Demand and Higher Cost as Contributing Factors

AgingACForum.PPT – 10/0445
Sum of Acquisition Cost by Entry Year, FY1994 and FY2003
0
20,000,000
40,000,000
60,000,000
80,000,000
100,000,000
120,000,000
140,000,000
160,000,000
180,000,000
EY1965
EY1967
EY1969
EY1971
EY1973
EY1975
EY1977
EY1979
EY1981
EY1983
EY1985
EY1987
EY1989
EY1991
EY1993
EY1995
EY1997
EY1999
EY2001
EY2003
Entry Year
Valu
e of
Acq
usiti
ons
FY2003FY1994
Consumable Cost Increase Analysis
Both Old and New Consumable Items Experiencing Significant Cost Increase from FY1994 to FY2003
Cost Increases Occurring Across Full Spectrum of Entry Ages
FY1994
FY2003

AgingACForum.PPT – 10/0446
Consumable Conclusions
• Types of Consumable Material Will Have Unique Cost Growth Curves– Fasteners Doubled Over the Past Ten Years– Gas Turbine Engine Parts Increase by Order of Magnitude– Although Total Demand for Circuit Boards Declined the
Acquisition Cost Resulted in an Overall Increase in Total Value of Demand
• Consumable Material Makes Up a Significant % of the Cost of Depot Level Repair and May be a Significant Factor in DLR Cost Growth
Consumable Cost Increase Analysis

AgingACForum.PPT – 10/0447
Engine?
Control Surfaces
Radar?Advanced Sensors?
C4ISR Equipment?
Human Factors Engineering
Canopy Structural Modifications?
Weaponeering?Air Frame and Landing Gear?Engine?
Control Surfaces
Radar?Advanced Sensors?
C4ISR Equipment?
Human Factors Engineering
Canopy Structural Modifications?
Weaponeering?Air Frame and Landing Gear?
Conclusion and Observations
Flying Hour Program Supports Complex Assemblages of Repairable and Consumable Parts Flying in Close Formation Changing Composition of Those Parts Directly Correlates to Changing/Increasing Costs for AVDLR and AFM Accounts
New Parts on Aging Aircraft Significantly Impact Future Costs of Operation
AgingACForum.PPT – 10/0448
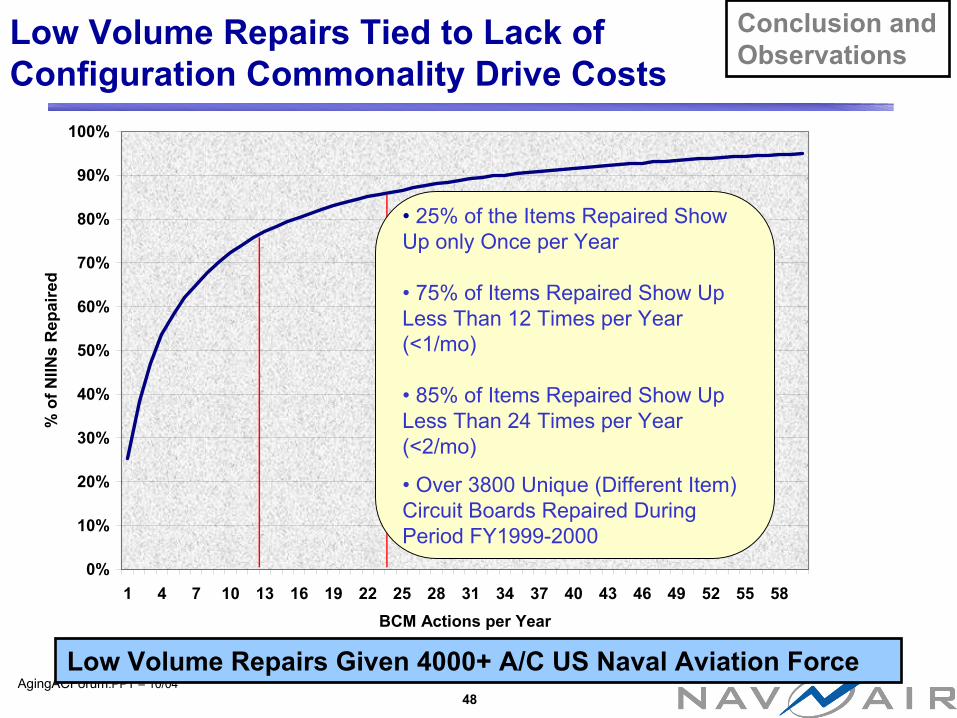
Low Volume Repairs Tied to Lack of Configuration Commonality Drive Costs
0%
10%
20%
30%
40%
50%
60%
70%
80%
90%
100%
1 4 7 10 13 16 19 22 25 28 31 34 37 40 43 46 49 52 55 58BCM Actions per Year
% o
f NIIN
s R
epai
red
• 25% of the Items Repaired Show Up only Once per Year
• 75% of Items Repaired Show Up Less Than 12 Times per Year (<1/mo)
• 85% of Items Repaired Show Up Less Than 24 Times per Year (<2/mo)
• Over 3800 Unique (Different Item) Circuit Boards Repaired During Period FY1999-2000
Conclusion and Observations
Low Volume Repairs Given 4000+ A/C US Naval Aviation Force
AgingACForum.PPT – 10/0449
Other Contributing Factors For“Aging Aircraft O&S Cost Growth”
Benign Neglect of Key Logistics and Depot RequirementsChanges Impacting Supplier BaseInventory Management Policies Including Uneconomic Order QuantitiesChanging Usage RequirementsBudgetary ProcessesInadequate/Misunderstood Maintenance DataLack of Focused Approach to Address Controllable “Age” Factors
Conclusion and Observations

AgingACForum.PPT – 10/0450
00
90 91 92 93 94 95 96 97 98 99 00 01
0.000
AGE
AVDLR/FH
0.00
90 91 92 93 94 95 96 97 98 99 00 01
0
AGE
AVDLR/FH
Age Analysis Conclusion:O&S Cost Changes Over TimeThere is A Complex Calculus Associated with the Issue of Age and Operations and Support Cost Growth within US Naval Forces. Although Age is a very Significant Contributor Other Factors Identified In this Briefing Must Also be Addressed in a Comprehensive Strategy to Mitigate Operations and Support and FHP Cost Growth
Conclusion and Observations
AgingACForum.PPT – 10/0451
Public Affairs Office Clearance