
Analysis of Open in 00 Mal h
134
ANALYSIS OF OPENINGS IN REINFORCED CONCRETE BEAMS by SURENDAR MOHAN MALHOTRA B. E. (Honors) Civil Engineering, 1964 Govt. Engineering College, Jabalpur University Jabalpur, India A MASTER'S THESIS submitted in partial fulfillment of the requirements for the degree MASTER OF SCIENCE Department of Civil Engineering KANSAS STATE UNIVERSITY Manhattan, Kansas 1969 Approved by: Major Professor
-
Upload
alexandresidant -
Category
Documents
-
view
216 -
download
2
description
Analysis of Open in 00 Mal h
Transcript of Analysis of Open in 00 Mal h
ANALYSIS OF OPENINGS IN REINFORCED CONCRETE BEAMS
by
SURENDAR MOHAN MALHOTRA
B. E. (Honors) Civil Engineering, 1964
Govt. Engineering College, Jabalpur University
Jabalpur, India
A MASTER'S THESIS
submitted in partial fulfillment of the
requirements for the degree
MASTER OF SCIENCE
Department of Civil Engineering
KANSAS STATE UNIVERSITY
Manhattan, Kansas
1969
Approved by:
Major Professor

/Jl%K TABLE OF CONTENTS
GENERAL NOMENCLATURE ii
SYNOPSIS v
INTRODUCTION 1
REVIEW OF LITERATURE 3
THEORY 6
DESCRIPTION OF BEAM TESTS 10
RESULTS OF BEAM TESTS 15
CONCLUSIONS 21
APPENDIX I: FIGURES 23
APPENDIX II: TABLES 66
APPENDIX III: DATA REDUCTION 107
APPENDIX IV: DETAILED DESIGN CALCULATIONS 115
ACKNOWLEDGMENTS 123
BIBLIOGRAPHY 124
GENERAL NOMENCLATURE
A = area.
A = total area of longitudinal steel,st a
A = area of tension reinforcement.
A 1 = area of compression reinforcement.s
A = total area of web reinforcement in tension within a distance'S", measured in a direction parallel to the longitudinalreinforcement
.
V II c II
C = compressive force.
D = overall depth of beam.
E = modulus of elasticity of concrete.c
E^ = modulus of elasticity of steel.
F = direct force.
G = modulus of rigidity.
I = moment of inertia.
K = multiplying factor for shear distribution in top chord of
opening.
K = 0.85 for strengths, f , up to 4000 psi.
M = bending moment.
M = ultimate bending moment,u
M = moment capacity at balanced conditions in a column = P, e. .
d j b
P = applied load.
P = ultimate load,u
P = axial load capacity of a column at balanced conditions.
P = axial load capacity of a column when concentrically loaded.
S = spacing of vertical stirrups.
T = tensile force.
. . .
V = shear force.
V = total ultimate shear.u
V = ultimate shear carried by web reinforcement.u
Z = section modulus.
a = depth of equivalent rectangular stress block.
a = depth of equivalent rectangular stress block for balancedconditions = K.. c, .
1 b
b = width of beam.
c = distance from extreme compression fiber to neutral axis.
c, = distance from extreme compression fiber to neutral axis forbalanced conditions = (87000)d/(87000+f ).
d = effective depth.
d' = distance from extreme compression fiber to centroid of
compression reinforcement.
d" = distance from plastic centroid to centroid of tensionreinforcement
.
e = actual eccentricity.
e, = eccentricity of load P, measured from plastic centroid of section,b b
f = compressive stress of concrete at 28 days.
f" = compressive stress of concrete on the day of test.
f = yield stress of reinforcement.y
I = clear span of the beam.
V = length of the chords of the opening.
n = ratio of modulus of elasticity of steel (E ) to that of concrete
<Vp = A /bd .r s
p = reinforcement ratio producing balanced conditions at ultimatestrength.
t = lever arm between C and T.

v shear stress
.
v = shear stress carried by concrete.c
v = nominal ultimate shear .stress.u
u
x
= ultimate shear stress carried by web reinforcement.
v = unit shearing strain,xy
e = horizontal unit strain reading in rosette,a
e, = unit strain reading at 45° with horizontal in rosette,b
c = vertical unit strain reading in rosette.
= longitudinal unit strain.
= vertical unit strain.y
a = longitudinal stress.
x = shearing stress,xy °
SYNOPSIS
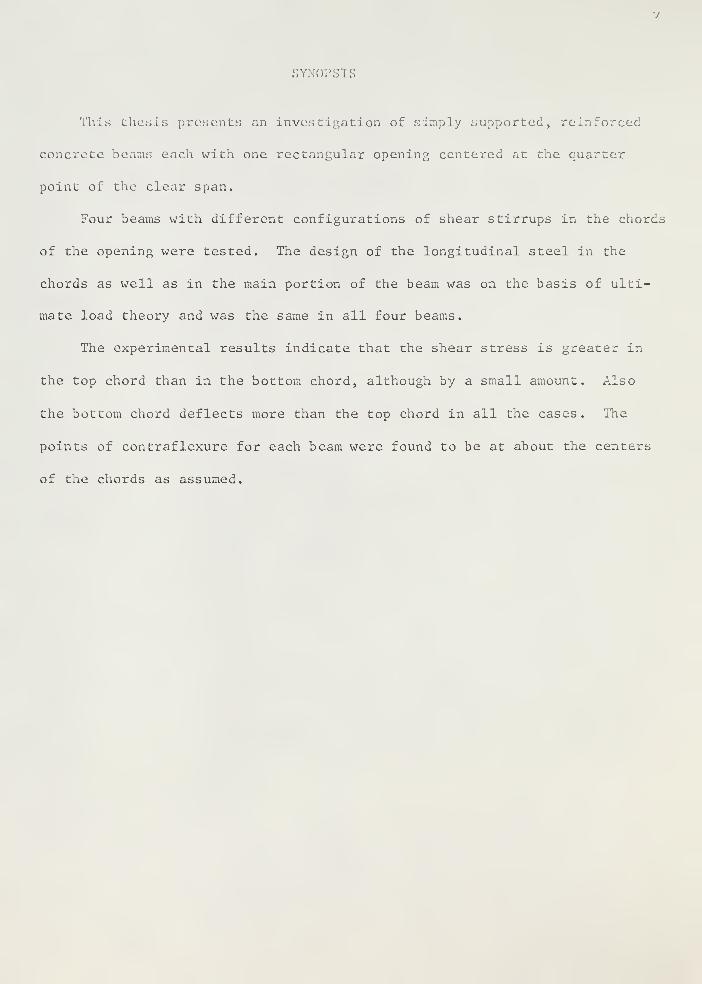
This thesis presents an investigation of simply supported, reinforced
concrete beams each with one rectangular opening centered at the quarter
point of the clear span.
Four beams with different configurations of shear stirrups in the chords
of the opening were tested. The design of the longitudinal steel in the
chords as well as in the main portion of the beam was on the basis of ulti-
mate load theory and was the same in all four beams.
The experimental results indicate that the shear stress is greater in
the top chord than in the bottom chord, although by a small amount. Also
the bottom chord deflects more than the top chord in all the cases. The
points of contraflexure for each beam were found to be at about the centers
of the chords as assumed.
INTRODUCTION
Modern building construction calls for the need to provide passage for
utility ducts and pipes under the roof and between the floors . The present
practice is to pass these ducts under the beams supporting the slab, thus
increasing the space loss between the roof or floor slab and the false ceiling.
Therefore it would be desirable to provide for the design of large openings
in beams to facilitate passage of ducts and pipes through them instead of
under them. This will decrease the dead space in false ceilings and will
thus reduce the story heights of multistoried buildings, which will result
in a more economical design.
Very little research has been done on the problem of hole reinforcement
for reinforced concrete beams. Detailed experimental and theoretical investi-
gations are needed to solve all aspects of this problem.
The basic objects of this thesis are:
(i) To investigate the ratio of distribution of shear stress in the
top and bottom chords surrounding the opening of reinforced con-
crete beams,
(ii) To determine the amount of steel required to resist the shear
stresses
.
(iii) To observe the deflected shape of such a beam and its mode of
failure.
(iv) To determine the ultimate load carrying capacity of the member
under different conditions of shear reinforcement in the rop
and bottom chords of the opening.
In order to attain the objects listed above, tests were carried out on
four reinforced concrete beams each with a single hole. All beams were simply

supported and loaded at the center. The only variable parameter was ount
of shear reinforcement in the chords around the hole.

REVIEW OE LITERATURE
The research on this problem was first started in Sweden. Most of the
literature is published in the Swedish language and only one translation in
English was available; a report by Mogens Lorentsen (2) on holes in reinforced
concrete girders. He used the method of influence lines and ultimate strength
theory for designing the beams with openings. It was found that calculated
loads for ultimate failure were less than those obtained by tests though the
difference was negligible.
A. Acavalos (1) and H. R. Daniel (1) carried out research on reinforced
concrete beams with large openings for their Master's theses at the University
of Saskatchewan, Saskatoon, Canada.
A paper was written by Karim W. Nassar (1) in association with the above-
mentioned engineers, based on their research.
The b^sic assumptions for designing a beam with large opening were taken
by Nassar, A. Acavalos and H. R. Daniel (1) to be:
1. The cop and bottom members of the beam at the opening behave in
a manner similar to the chords of a vierendeel panel.
2. Tne portions of the beams at the opening, when not subjected
to transverse loads, have points of contraflexure at their
midspans
.
3. When portions of the beams at the openings have adequate stirrups,
they carry the external shear in proportion to their cross sectional
areas
.
4. The shear force concentration at the corners is equal to twice the
simple shear force.

Test specimens were designed on the basis of these assumptions and
Whitney's ultimate load theory. The experimental results showed that the
assumptions were substantially correct. However, there were some discrepancies
between th observed results and those predicted by the third assumption.
There was some difference between the predicted and observed ultimate load.
The smallest variation was 6% greater and the largest variation was observed
to be 24% less than the theoretical.
Some work was performed on prototype prestressed concrete beams with large
openings in them by H. S. Ragan and J. Warwark (3). A T-beam was tested to
find the maximum load which could be applied.
In 1963 Edmund P. Segner (4) tested steel beams of I-section and studied
rectangular openings parallel to the neutral axis of the beam. The study was
limited to the reinforcement design of the web of the steel beam around the
holes
.
John E. Bower (5) experimented on steel I-beams with holes in the webs
and the paper was published in the ASCE Structural Division Journal of Oct.
1966. The work was confined to determining the stress concentration around
circular and rectangular holes not exceeding half the web width of steel beams.
In the case of round holes the theory of elasticity seemed to apply but for
rectangular holes the principle of Vierendeel analysis gave more satisfactory
results. However, the extension of Vierendeel analysis to beams with holes
having non-rectangular configurations seemed to be questionable because boundary
conditions at the holes would not be satisfied.
W. Wright and J. G. Bysne (6) carried out some experimental work on stress
concentrations in concrete. Tensile tests were performed on plain thin con-
crete specimens. The purpose was to ascertain the effects of holes of various
shapes on the tensile strength. The results yielded the conclusion that the
stress concentration factors was 3 in circular holes, 5.9 in square holes with
2 acorner radii of 0.014 d and [1 + —] for elliptical holes, where a and b w
the semi-major and semi-minor axes of the ellipse.
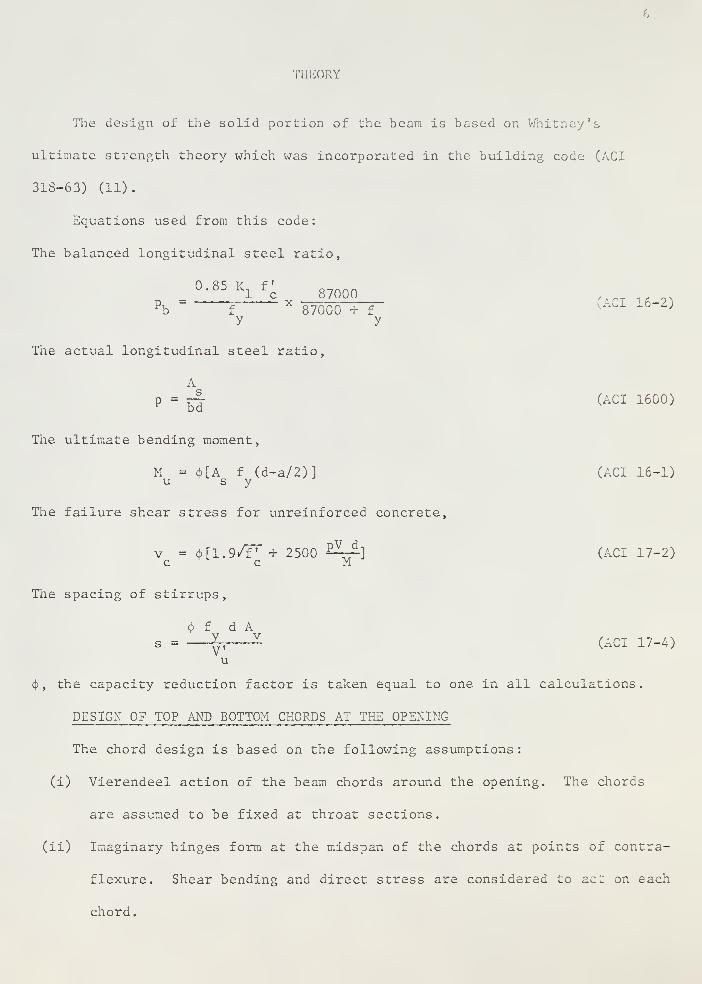
THEORY
The design of the solid portion of the beam is based on Whitney's
ultimate strength theory which was incorporated in the building code (ACI
31S-63) (11).
Equations used from this code:
The balanced longitudinal steel ratio,
0.85 K, f* „____1 c 87000
, A __ .. oNpb
=f
X87000 -r f
ACI i6" 2 '
y y
The actual longitudinal steel ratio,
A
p =^|
(ACI 1600)
The ultimate bending moment,
M = <J>[A f (d-a/2)] (ACI 16-1)u s y
The failure shear stress for unreinforced concrete,
v = (|>[1.9/fT + 2500 E^-r-] (ACI 17-2)
c c M
The spacing of stirrups,
<|> f d As = 2L Z (ACI 17-4)
u
<J> , the capacity reduction factor is taken equal to one in all calculations.
DESIGN OF TOP AND BOTTOM CHORDS AT THE OPENING
The chord design is based on the following assumptions
:
(i) Vierendeel action of the beam chords around the opening. The chords
are assumed to be fixed at throat sections,
(ii) Imaginary hinges form at the midspan of the chords at points of contra-
flexure. Shear bending and direct stress are considered to acz on each
chord.

(iii) The shear is shared by both top and bottom chords in some ratio,
not necessarily according to the cross sectional areas.
The beams were designed to fail in shear around the opening in order to
more clearly observe the effects of the different shear reinforcement ratios
used.
The stresses at the roots of the chords around the opening were obtained
simply by a summation of two effects at the opening: (i) the gross beam bending
moment; and (ii) the shear bending moment. The stresses were calculated as for
a cantilever using the above assumptions and simple column theory applied to
the chord sections above and below the opening.
The assumed portion of the total shear carried by the top chord, K, was
varied in different specimens as
(1"K) =10 5
The direct force in the chord,
M= (midspan) . .
t
where K, . = bending moment, due to load at the center
of beam, at midspan of the chords.
t = lever arm between C and T as shown in
Fig. 1.
M,t. n = V x ^— • (2)
(throat) 2v '
where M,, N
= bending moment at the throat section due to(throat) to
the shear force in the chords
.
£' = length of the chord.
V = shear force at midspan of the chord.
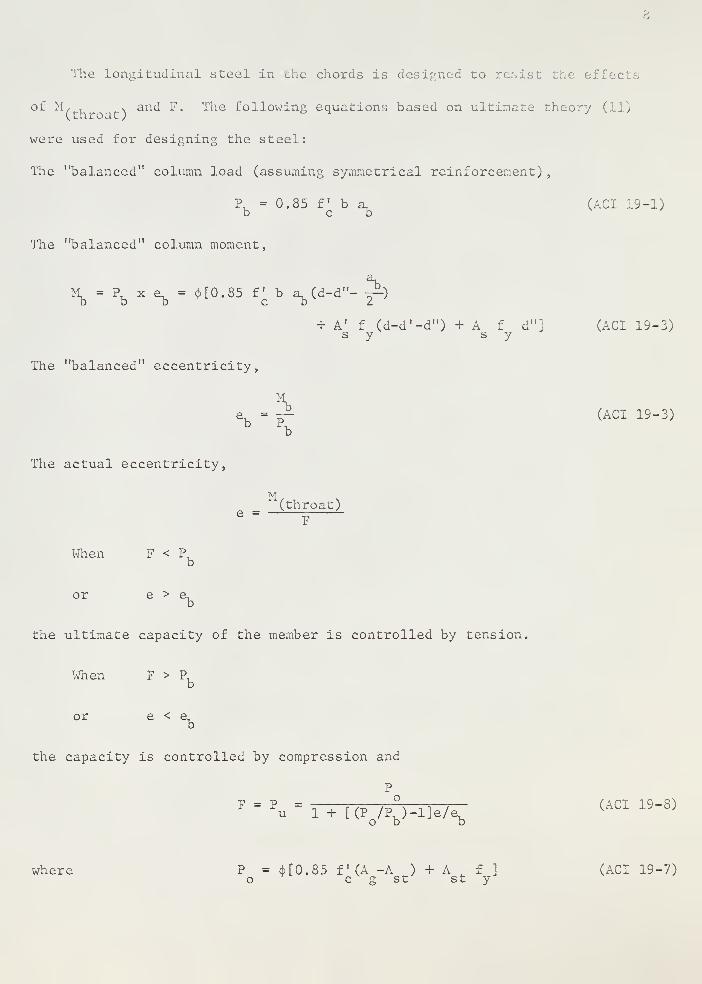
The longitudinal steel in the chords is designed to resist the effec .
of M. . N and F. The following equations based on ultimate theory (11)(throat) o i j
were used for designing the steel:
The "balanced" column load (assuming symmetrical reinforcement)
,
Pb
= 0.85 f b ab
(ACI 19-1)
The "balanced" column moment,
^ - ? x eb
- ^[0.85 f^b a^d-d"-^)
+ A' f (d-d'-d") + A f d"] (ACI 19-3)s y s y
The "balanced" eccentricity
e. = ~ (ACI 19-3)b P
b
The actual eccentricity,
M(throat)
e =F
When F < P,b
or e > e^
the ultimate capacity of the member is controlled by tension.
When F > P,b
or e < e^
the capacity is controlled by compression and
P
F = Pu
= 1+[(P/V _1]e/(ACI 19-8)
O D D
where P = cj>[0.85 f ' (A -A ) + A f ] (ACI 19-7)o c g st st y
DESIGN OF CORNER REINFORCEMENT
Assume a stress concentration at the corner of a rectangular opening to
be twice the shear stress in the member. The reinforcement of the corner is
designed to resist the diagonal tension and the re-bars are placed at an
angle of 45° with the horizontal.
10
DESCRIPTION OF BEAM TESTS
efore fabricating the test beams an investigation was done on the
properties of materials to be used.
For the concrete mix, Type I Portland cement, sand with fineness modulus
of 2.S and aggregate of 3/8" size were used.
Two mixes were tried
:
(i) Cement : Sand:Aggregate - 1:2:4. Water cement ratio: 6 gallons per
sack of cement.
(ii) Cement : Sand:Aggregate - 1:1.5:3. Water cement ratio: 6 gallons per
sack of ce i t
.
These ratios were based on the weight of these materials.
The compressive strength f after 28 days was found to be 2800 psi for
Mix I and 4500 psi for Mix II. It was decided to order "Ready Mix" of 1:2:3
with a water cement ratio of 6 gallons per sack of cement. This would give
f between 3500 psi and 4000 psi.c
Although reinforcing bars were specified by the manufacturer to have a
yield strength of 40 ksi, tensile tests were run to determine the actual f
of the bars.
In order to determine strains on the concrete surface, electric resistance
strain rosettes were used. It was found that wire strain gages of 3/4" size
glued with Duco cement on a well ground, smooth, prepared surface of concrete
will give satisfactory strain measurements up to the point where cracking
starts in the concrete. The curing time of Duco cement was found to be within
the 1 riits of 24 to 36 hours.
Four test beams were designed on the basis of the assumed theory. They
were 6 ft. long, 9 in. deep and 4.5 in. wide with a rectangular opening of the

size 15 in. x 3 in. as shown in Fig. 2. The opening was centered on the
quarter point of the clear span of the beam. Each beam had only one variable
parameter; the amount of shear reinforcement in the chords of the opening.
Beam No. 1 had no web shear reinforcement in either of the tv/o chords of the
opening. Beam No. 2 had all the web shear in the top chord and none in the
bottom chord. In Beam No. 3 equal web shear reinforcement was provided and
Beam No. 4 had 66% and 34% of the total web shear reinforcement, in the top
and bottom chords respectively.
As determined by the design calculations presented in Appendix IV, 3
No. 6 bars were provided in the tension side of the beam, 2 No. 6 bars at the
top to facilitate binding of bars and stirrups, 3 No. 6 bars in the top and
bottom of the top and bottom chords of the opening, and 2 No. 4 bars placed
at 45° to the horizontal at each corner. All the details of steel reinforce-
ment are illustrated in Figs. 2 and 3.
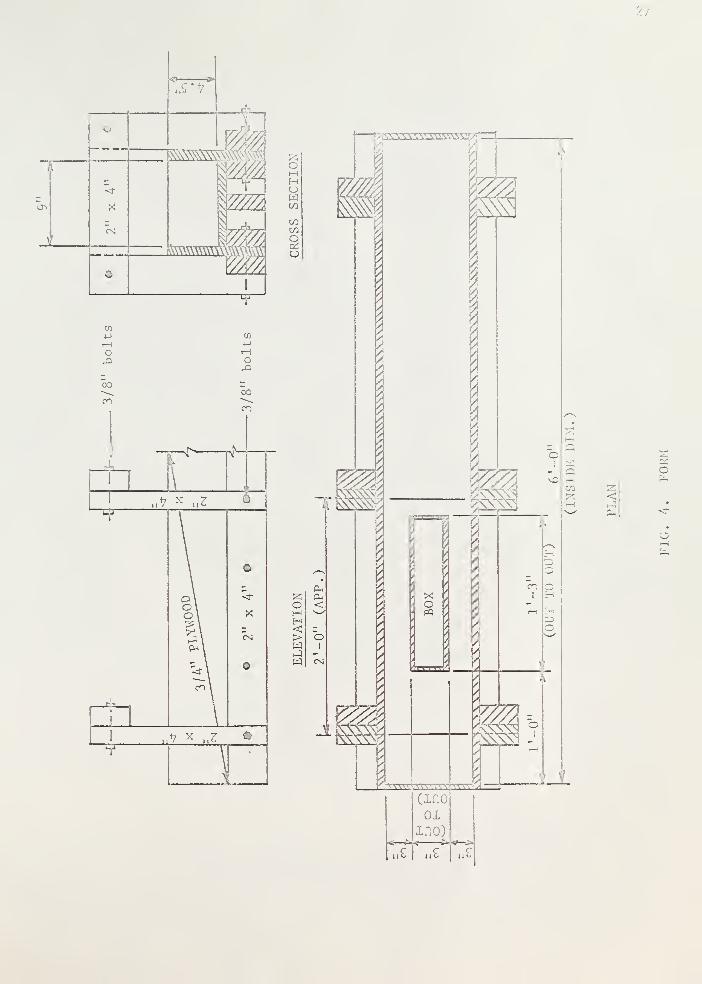
The forms were made with 3/4 in. thick plywood and 2 in. x 4 in. wooden
flats as shown in Fig. 4.
The yield strength of the different bars used as reinforcement obtained
by tensile tests were:
#1 bar f = 78,000 psiy
#2 bar f = 54,000 psiy
#4 bar f = 54,000 psiy
#6 bar f = 44,500 psiy
Before the concreting was started, the forms were thoroughly cleaned and
ensured to be water tight. A thin varnish coat was given inside the forms and
they were left overnight to dry. A thin coating of grease was given to the
inside surface of the forms, just prior to the concreting.
L2
The concrete mix came in one batch and was used for all the ns.
Three cylinders were filled according to ASTM standards in order to run a
compressive strength test after 28 days. Three test cylinders were filled
for each beam in order to determine the actual compressive strength of the
beams on the day of testing. The concrete was vibrated by using an immersion
type vibrator and extra care was taken in areas around the opening to ensure
proper consolidation of the concrete by rodding and surface vibration.
The beams along with the cylinders were moved into the moisture room the
following day. Three cylinders were tested after 28 days of curing and f was
found to be 3.8 ksi.
After 42 days beams and cylinders were taken out of the moisture room.
When the test beams were sufficiently dry, the surface at the midpoints of
the top and bottom chords of the opening was ground with the help of a coarse
emery disc.
The concrete surface could be ground smooth on the face which v/as open
while concreting. This face will from now onward be designated as "face one".
The surface on the form side which looked smooth before grinding, became rough
after the grinding operation. This face will be denoted by "face two". The
reason for these different surface conditions could be that it was easy to
work on "face one" while concreting as compared to "face two" and hence the
aggregate was much better bound by cement on "face one" as compared to "face
two".
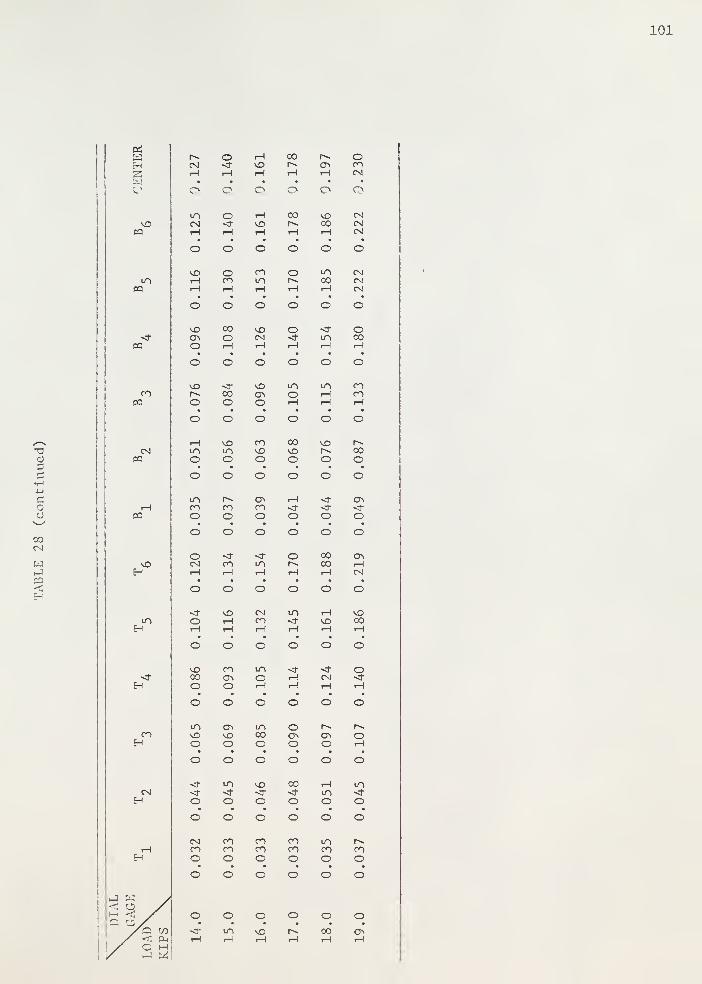
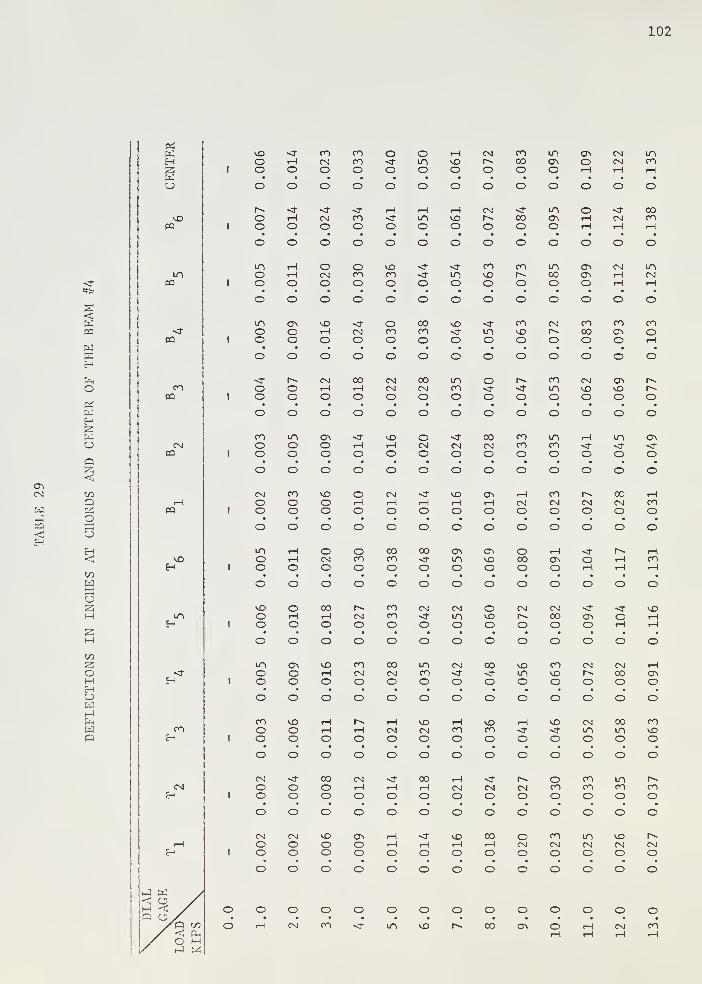
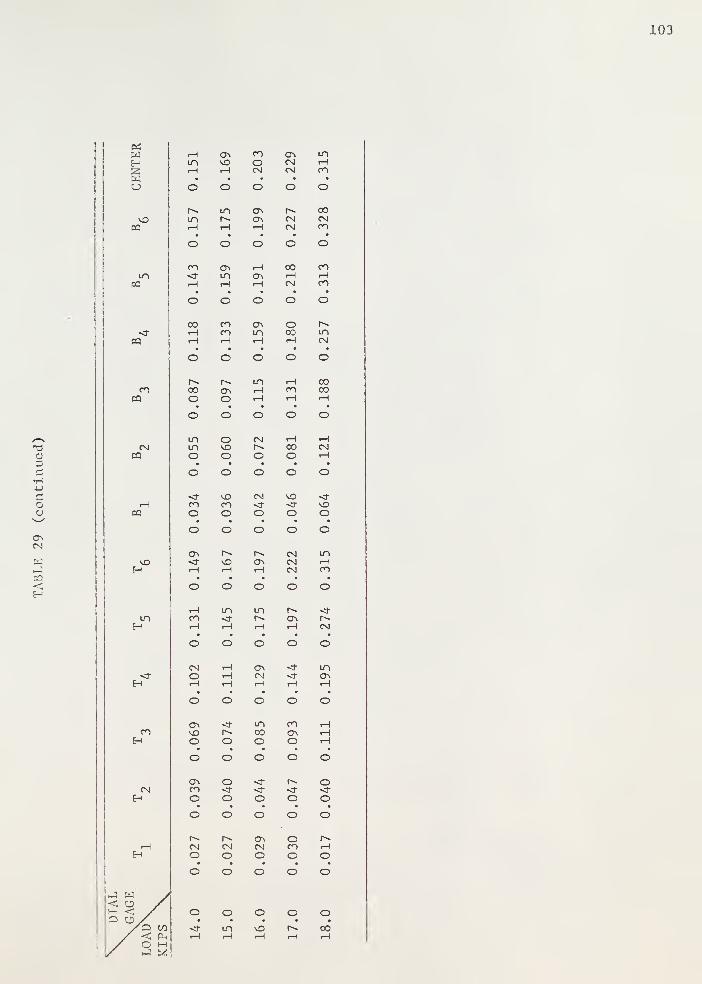
Dial gages were used for measuring the deflections of the top and bottom
chords and the center deflection of the beam. Six gages were mounted on the
top and bottom chords at a spacing of 3 in. as shown in Fig. 5. This arrange-
ment remained the same for all of the test beams.

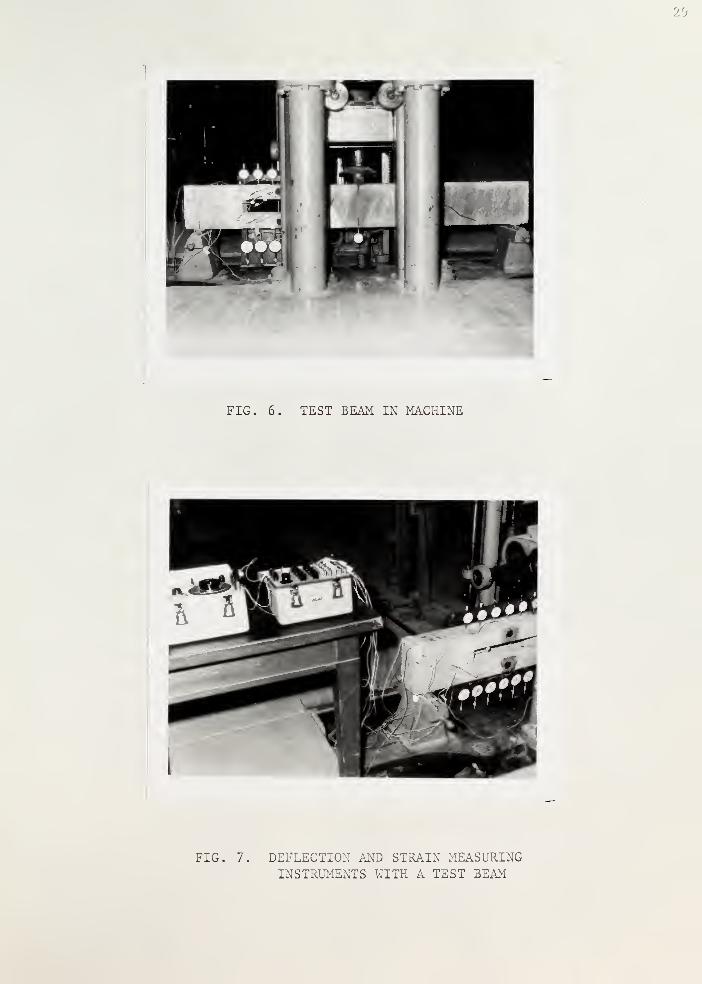
A single concentrated load was applied at the center of the b< - ..id
the beams were simply supported at the ends. Bearing plates were placed under
the beams at the supports. A Tinius Olsen screw type, load testing machine
with a capacity of 1000 kips, was used for loading the test beam as shown in
Fig. 6.
A Budd Strainsert Model HW-1 portable strain indicator was used to measure
the output of the strain gages. The setup of a beam being tested in the machine
along with deflection gages, strain gages and strain indicator is shown in
Fig. 7.
The strain gages used were BLH Electronics Type AR-2-S6 temperature com-
pensated, 45° wire strain rosettes. They were glued at the midpoints of the
top and bottom chords of the opening as illustrated in Fig. 5. Four rosettes
were glued on Beam No. 1; two on "face one" of the beam at assumed points of
contraf lexure of the top and bottom chords and one on "face two" at the point
of contraf lexure of the bottom member. One rosette was glued on the top of
the beam at a distance of 18.5 in. from the end support on the solid side of
the beam. Only longitudinal strains were measured by this gage. The main
purpose of this gage was to compare the experimental results of stresses to
those calculated with conventional theory in order to test the behavior of
the strain gage. The rest of the beams had three rosettes on them; two on
"face one" at midpoints of top and bottom chords and one on "face two" at
the midpoint of the top or bottom chord.
Beam No. 1 was loaded in increments of 500 lbs. until it reached the
ultimate load. It was felt that the load increment could be adopted as 1000
lbs. and so the other three beams were loaded with this increment to their
ultimate failure load.

u
Cracks, as they developed, were painted black with a "magic marker" and
photographs were taken at different times and stages of different beam tests.

15
RESULTS OF BEAM TESTS
All test beams were subjected to a concentrated load applied at the mid-
span of the beam. The opening in all the beams reduced the cross sectional
area by 33 percent. All beams had everything constant except the shear
reinforcement in the top and bottom chords of the opening.
Beam No. 1, as shown in Fig. 2 was provided with no shear reinforcement
in either of the chords of the opening. Four electrical wire rosette strain
gages as described in the last section were glued to the concrete surface.
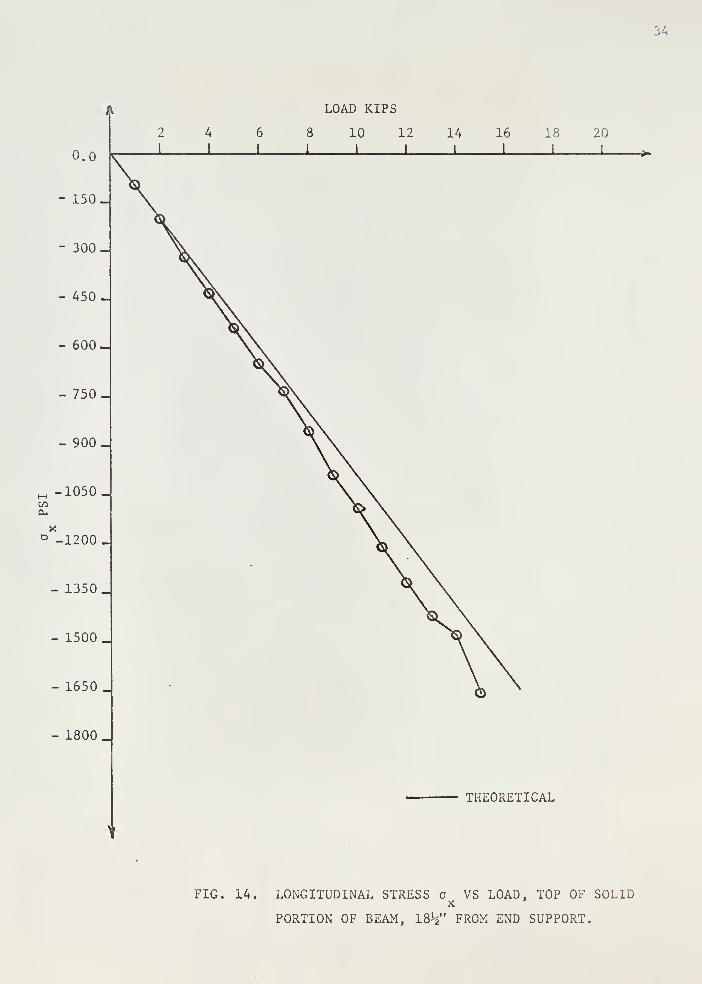
The surface where strain gage No. 1 was applied, was well prepared and smooth.
The curing time of the gage pasted with Duco cement was 24 hours at normal
room temperature. The experimental stress values obtained from this gage for
different load levels show reasonable agreement to those calculated theoret-
ically. Both curves are linear as shown in Fig. 14.
Strain gages No's. 2 and 3 were glued at midspan and middepth of the top
and bottom chords of the opening respectively on "face one" of the beam. In
the top chord the longitudinal stress calculated experimentally showed agree-
ment with the theoretical up to a load of 6 kips. The curve after 7 kips load
was linear up to a load of 10 kips and was almost parallel to the theoretical
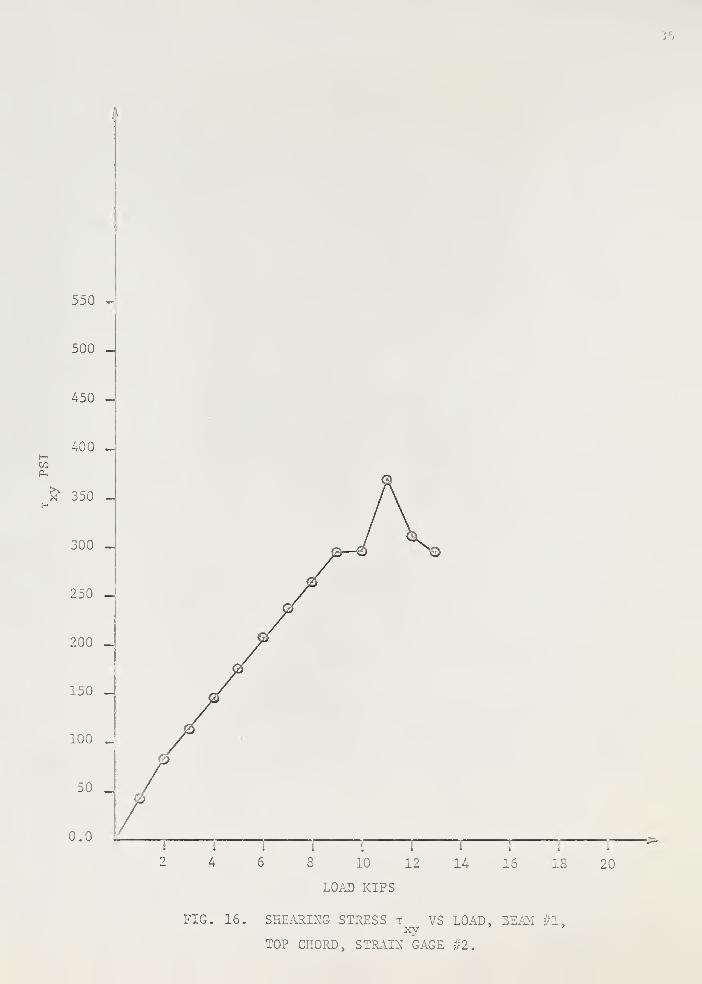
curve as shown in Fig. 15. The shear stress curve varied linearly with load
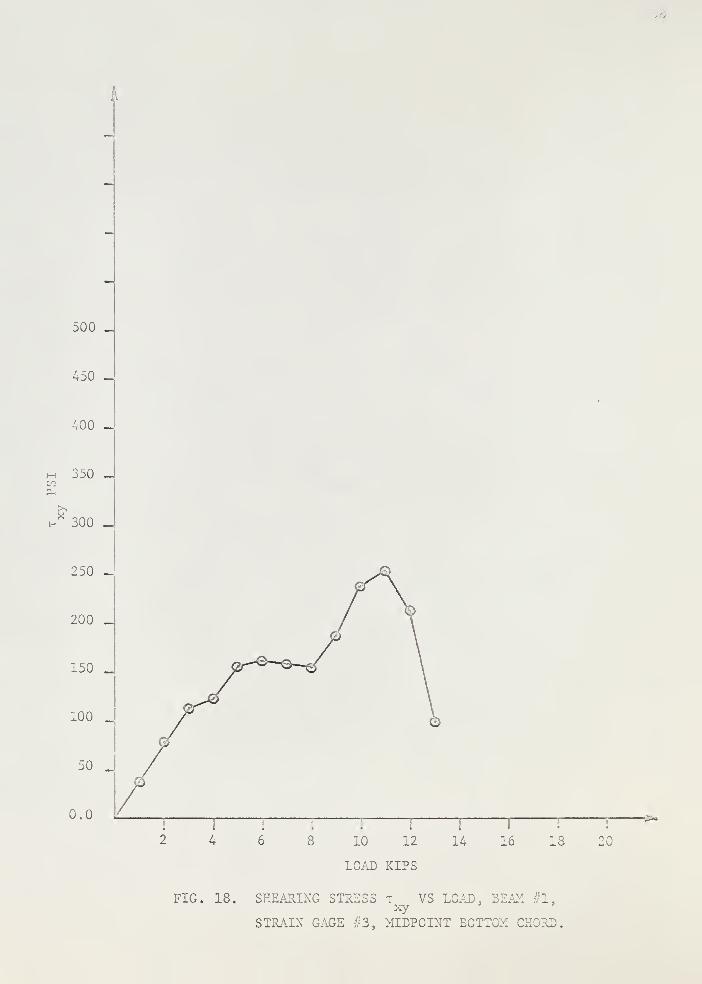
up to a load value of 9 kips as illustrated in Fig. 16. In the bottom chord
the longitudinal stress curve on the basis of strain readings behaved errat-
ically as can be seen in Fig. 17. The stress after falling from a maximum
value of 200 psi at 8 kips load to at about 11 kips load, changed sign
rapidly to a value of -404 psi at a load of 13 kips. The shear stress curve
was linear up to a load of 3 kips followed by an erratic curve as noted in
Fig. 18. Rosette No. 4 had a rough surface under it and did not function

16
well; hence the data obtained from this gage was rejected. This was pasted
at midpoint of the bottom chord on "face two" of the beam.
The ratio of the shear distribution for the bottom to top chord in
general had a tendency to decrease with increasing load, that is, more and
more shear was resisted by the top chord as compared to the bottom chord.
As seen in Fig. 13 the ratio was 0.88 at a load value of 1 kip and came
down Co 0.685 at a load value of 12 kips. Although there are some extreme
variations at a load of 3 kips and 8 kips , the general trend was that the
ratio decreased with increase of load.
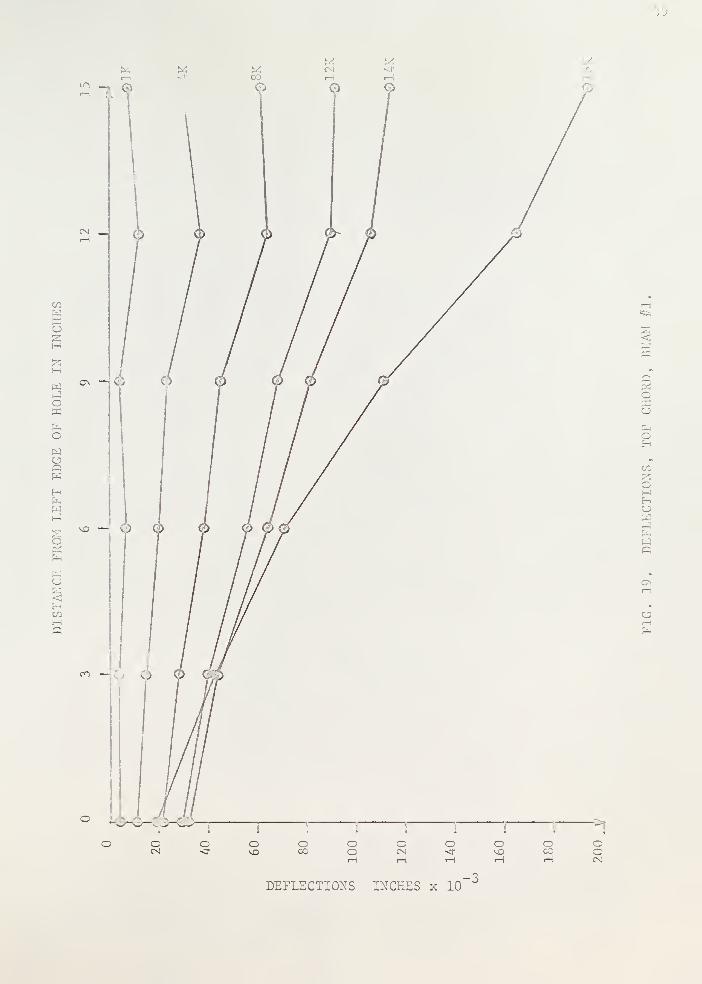
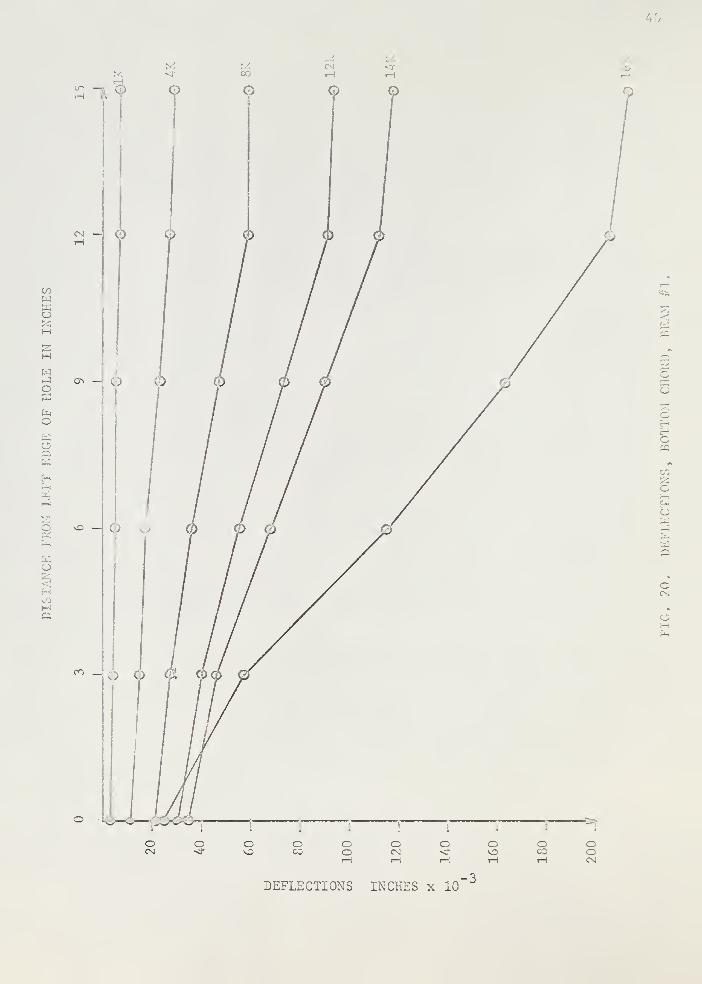
The deflected curve of the chords was "S" shaped as predicted; however,
the bottom chord deflected more than the top chord as can be seen in Figs. 19
and 20. These figures also indicate that points of contraflexure are located
near midspan of the chords.
The corners did not fail and the first corner cracks appeared after the
beam had failed in shear around the opening.
The first shear cracks appeared in the top chord at a load of 14 kips
followed by more shear cracks in the top and bottom chords as the load was
increased. The mode of failure was by shear in the chords of the opening at
an ultimate load of 17 kips. A heavier ultimate load than that calculated
in the design is attributed to the heavy longitudinal re-bars which are
assumed not to share any shear. Shear cracks in the chords after failure are
illustrated in Fig. 8.
Beam No. 2 had three rosettes at midpoints of the chords, Nos . 3 and 4
strain gages were mounted at the top and bottom chords respectively on "face
one", and No. 2 gage was at the top chord on "face two". Gage Nos. 3 and 4
having a smooth surface under them gave satisfactory readings whereas gage

17
No. being on a rough surface behaved erratically and the results were
rejected.
The curve of longitudinal stress in the too chord versus load was linear
up to a load of 8 kips and the values were in agreement with those calculated
theoretically as shown in Fig. 23. The shear stress curve was linear up to
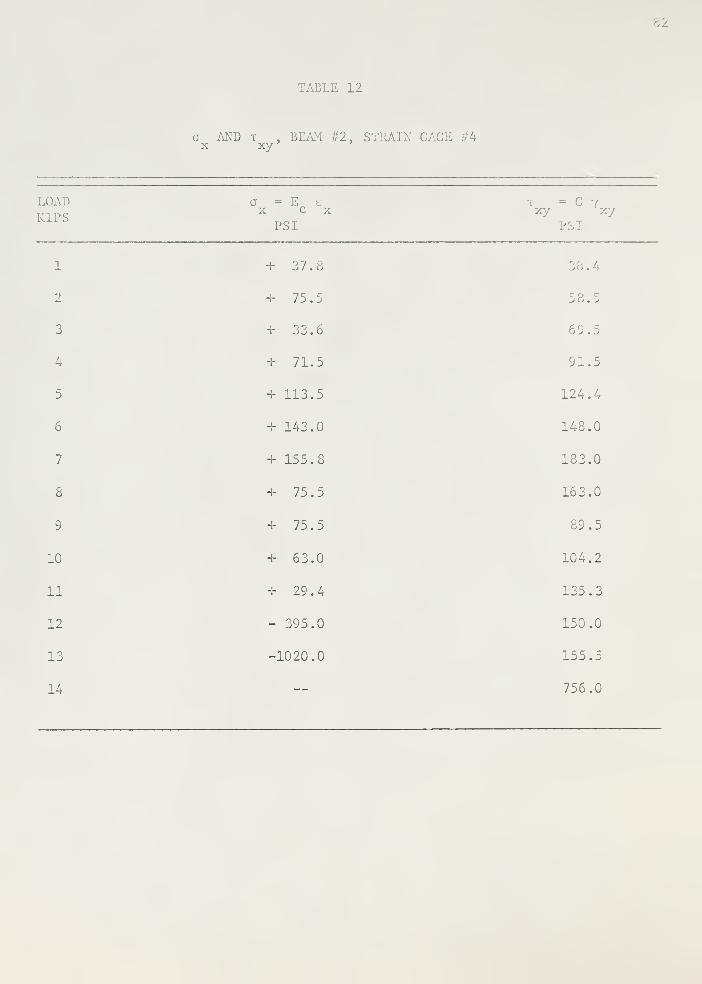
S kips load as shown in Fig. 24. The longitudinal stress curve in the bottom
chord behaved almost in the same manner as in beam No. 1. This curve remained
linear only up to 2 kips load as shown in Fig. 25. The shear stress curve
for this point was linear up to about 6 kips load as can be seen in Fig. 26.
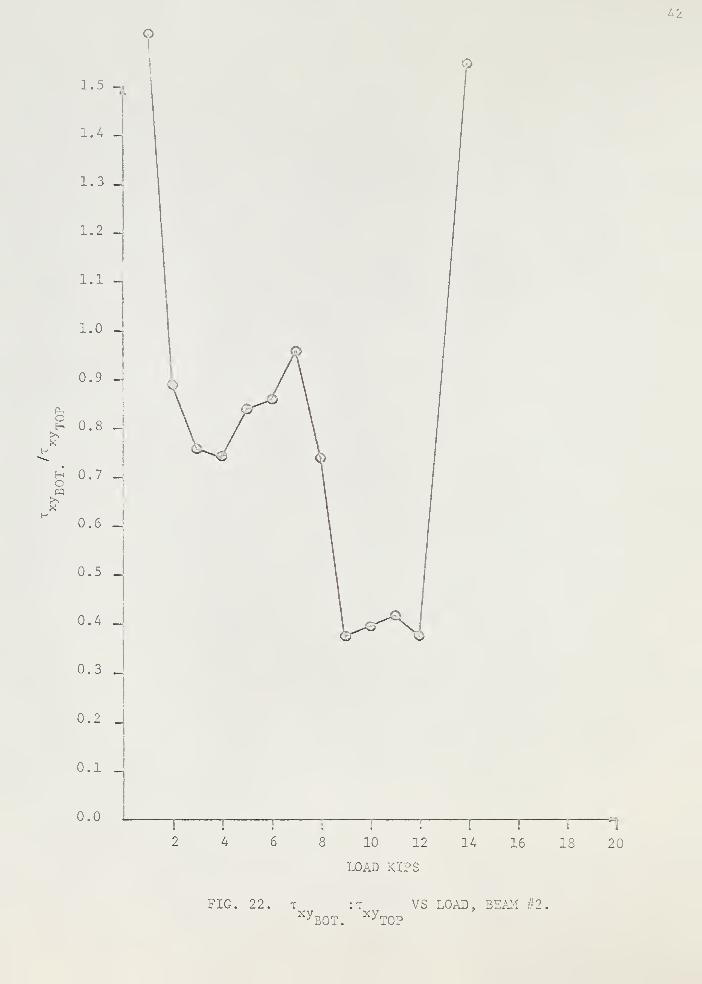
The ratio of the shear distribution between the bottom and top chords,
as can be seen in Fig. 22, in general decreased with increase of load. If we
neglect the ratios at 1 kip load and 13 kips load, the variation is 0.89 at 2
kips load to 0.378 at 12 kips load as can be seen in Fig. 22.
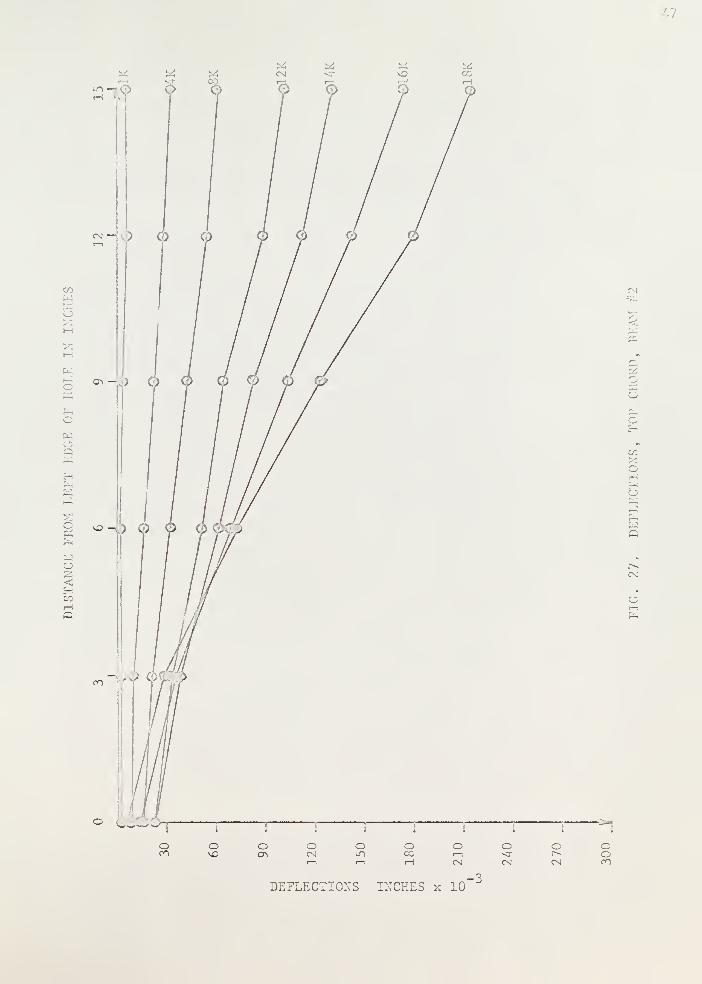
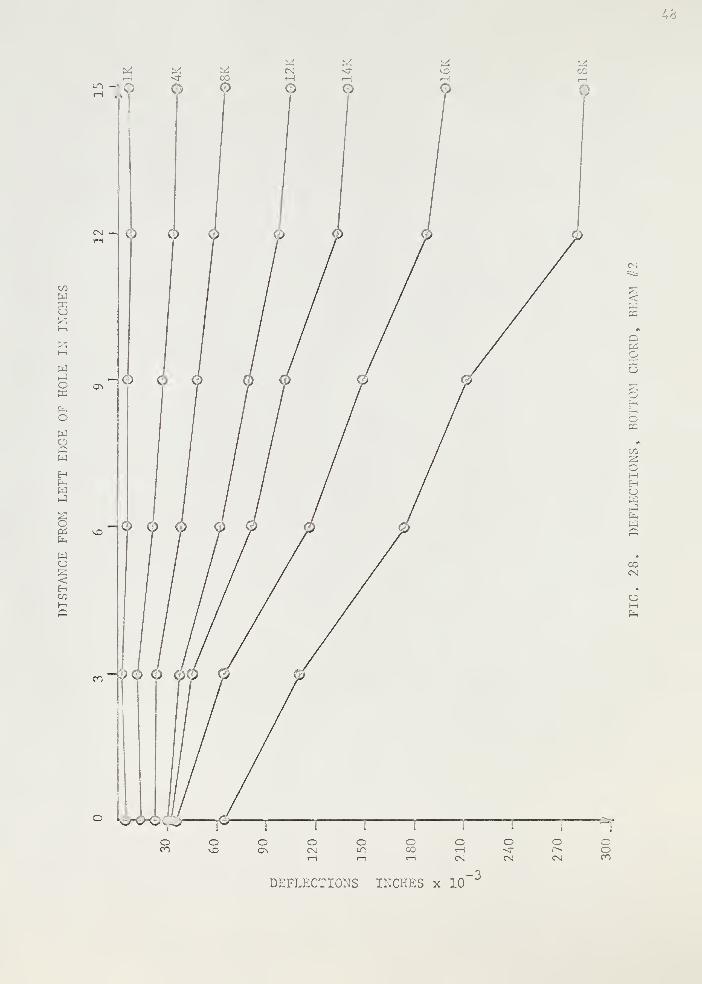
The chords deflected into an "S" shape again with points of contraflexure
around midspans as can be seen in Fig. 27 and 28. The bottom chord also
deflected much more than the top chord. This beam had all the shear rein-
forcement in the top chord and none in the bottom chord hence the top chord
was much stiffer than the bottom chord.
A corner crack developed in the upper corner after the shear failure
occurred as shown in Fig. 9.
Shear cracks were first noted in the bottom chord at a load of 15 kips
followed by cracks in the top chord at 16 kips. The mode of failure was by
shear in the chords at an ultimate load of 18.9 kips. The shear cracks in
the chords around the opening can be seen in Fig. 9.
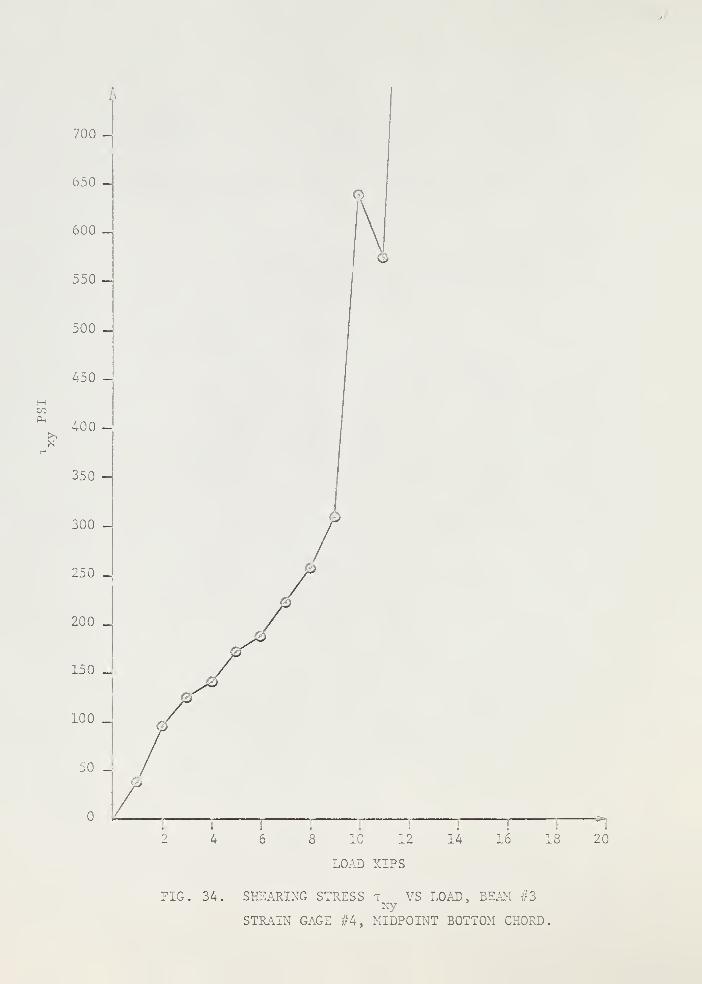
Chree rosettes were pasted on beam No. 3 at the midpoints of the chords.
Rosettes Nos. 2 and 4 in the top and bottom chords at the midpoints respectively
on "face one" were cured for 24 hours. No. 3 strain gage was pasted at the
midpoint of the top chord on "face two" and once again did not behave well.
Thus the data from gage No. 3 was rejected.
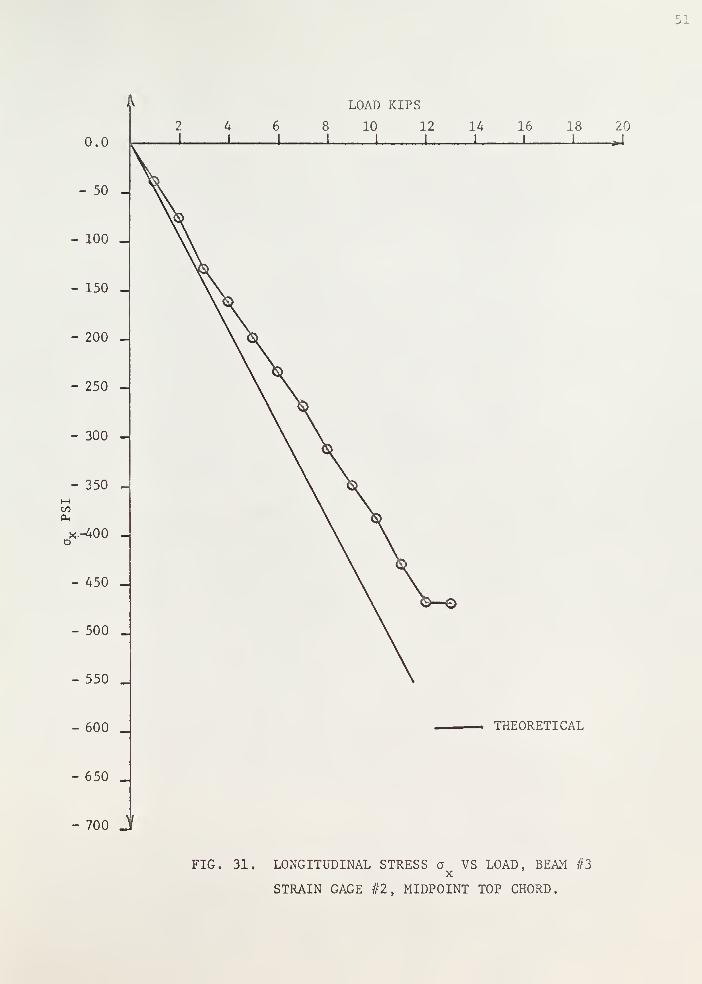
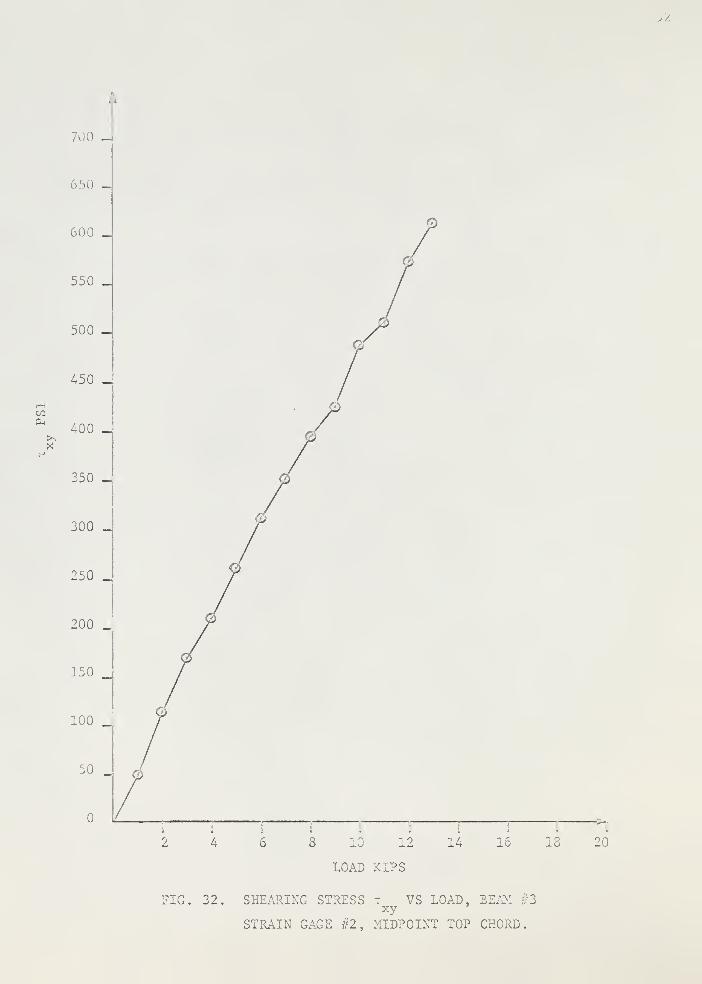
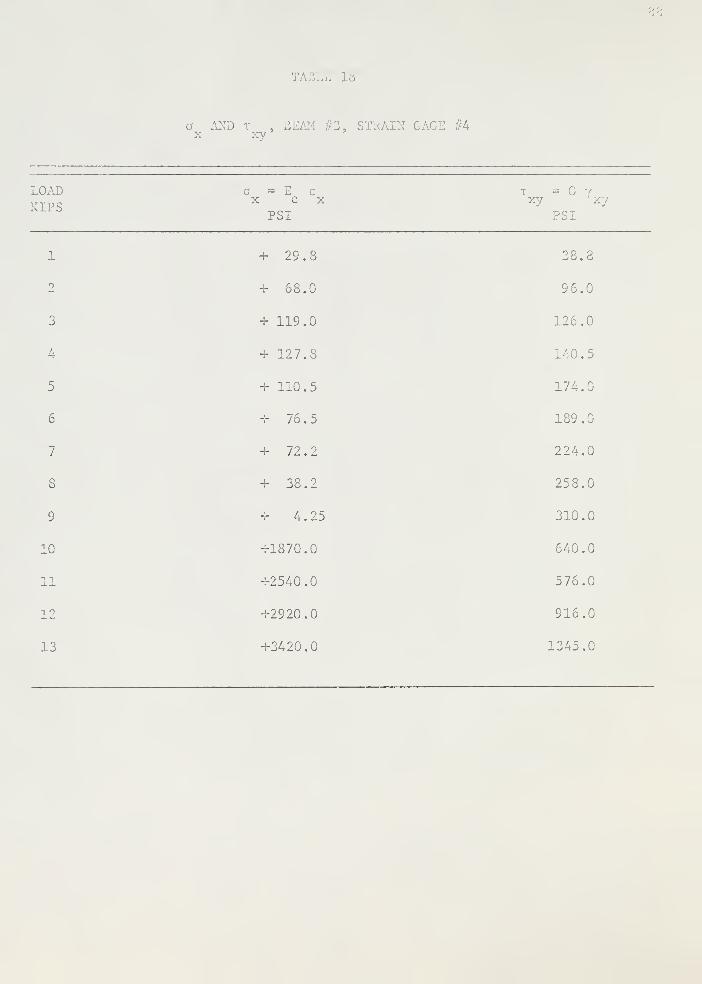
Strain measurements in the top member were satisfactory as shown in
Figs, 31 and 32. But in the bottom chord linear results could be obtained
only up to a load of 4 kips as illustrated in Figs. 33 and 34.
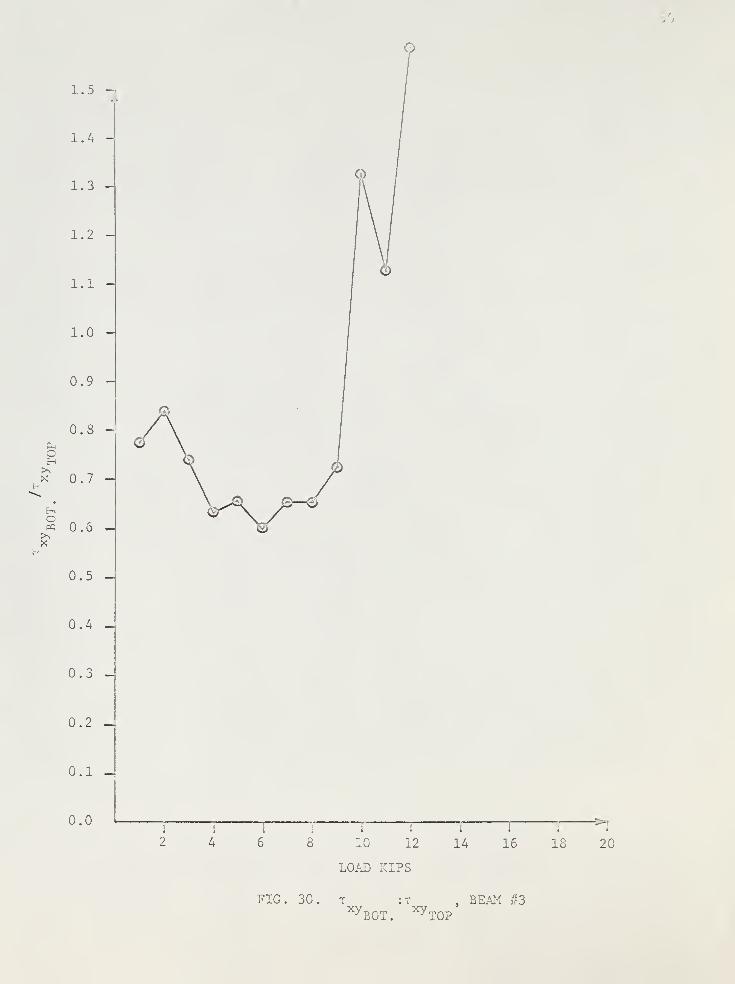
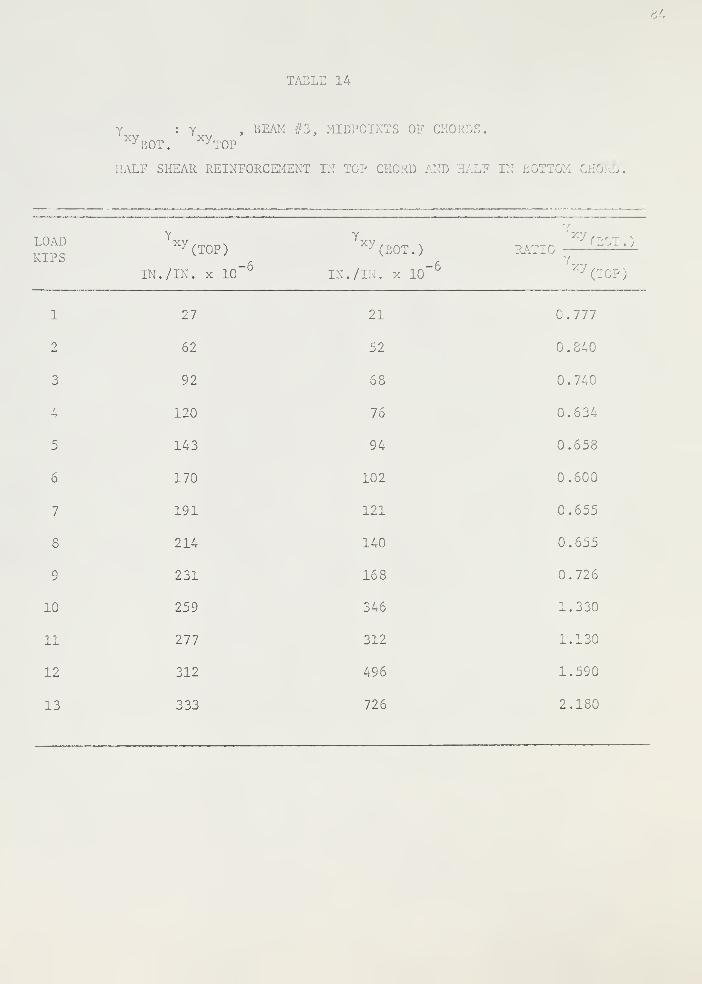
The ratio of shear distribution had in general the same behavior as in
the other beams, the ratio in this case varying from 0.777 at a load of 1 kip
to 0.726 at a load of 9 kips. Values beyond 9 kips load were quite erratic
as shown in Fig. 30 and Table 14.
The deflected shape as shown in Figs. 35 and 36 remained the same as in
the other cases showing points of contraflexure around midspan. However, the
magnitude of the deflections was smaller than all the other cases. The
deflections in the bottom chord were once again greater than those in the top
chord.
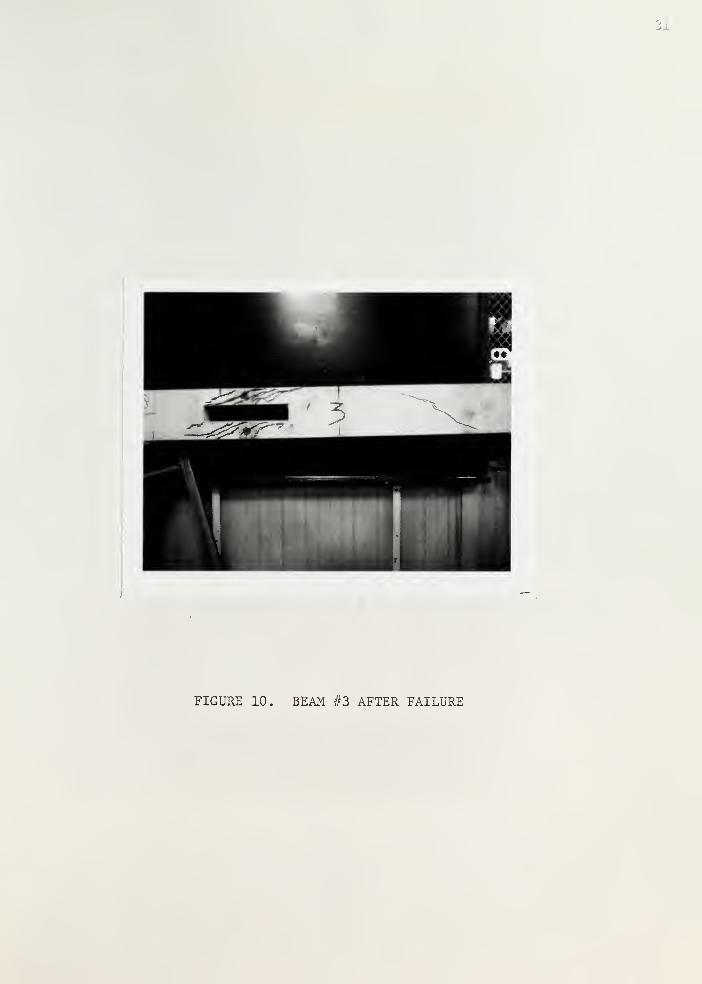
Shear cracks appeared in the top chord first at a load of 17 kips followed
by cracks in the bottom chord. At a load of about 18 kips a shear crack
appeared in the main beam and a corner crack in the lower right hand corner
of the hole as shown in Fig. 10. The corner crack as well as the shear crack
in the main body of the beam did not increase with higher loads. The mode of
failure was by shear in the chords around the opening at an ultimate load of
21.8 kips.
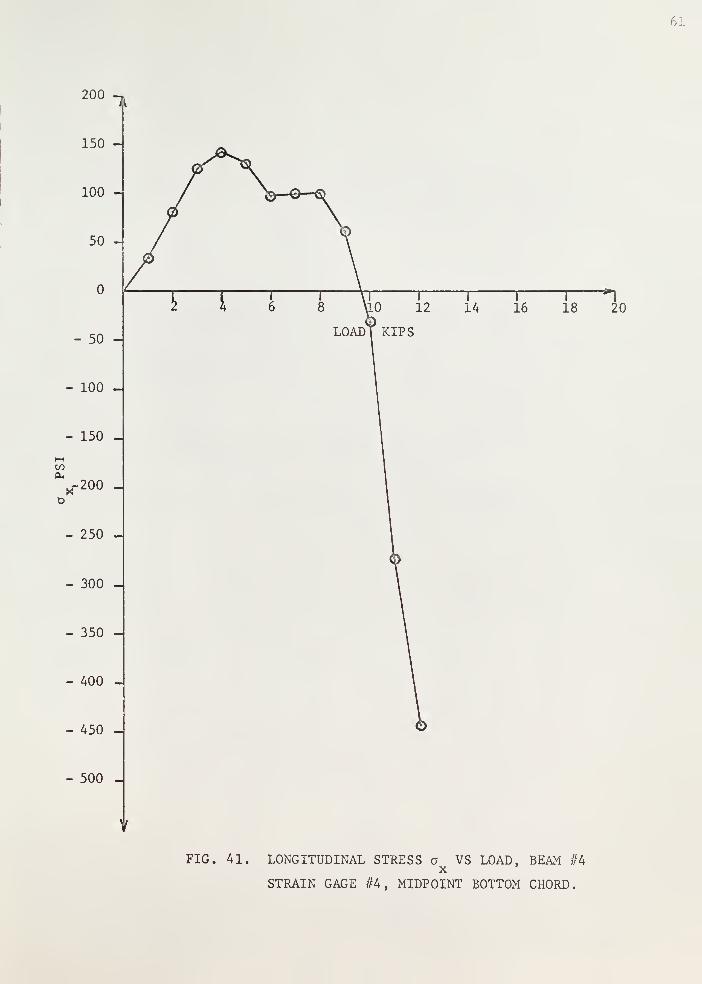
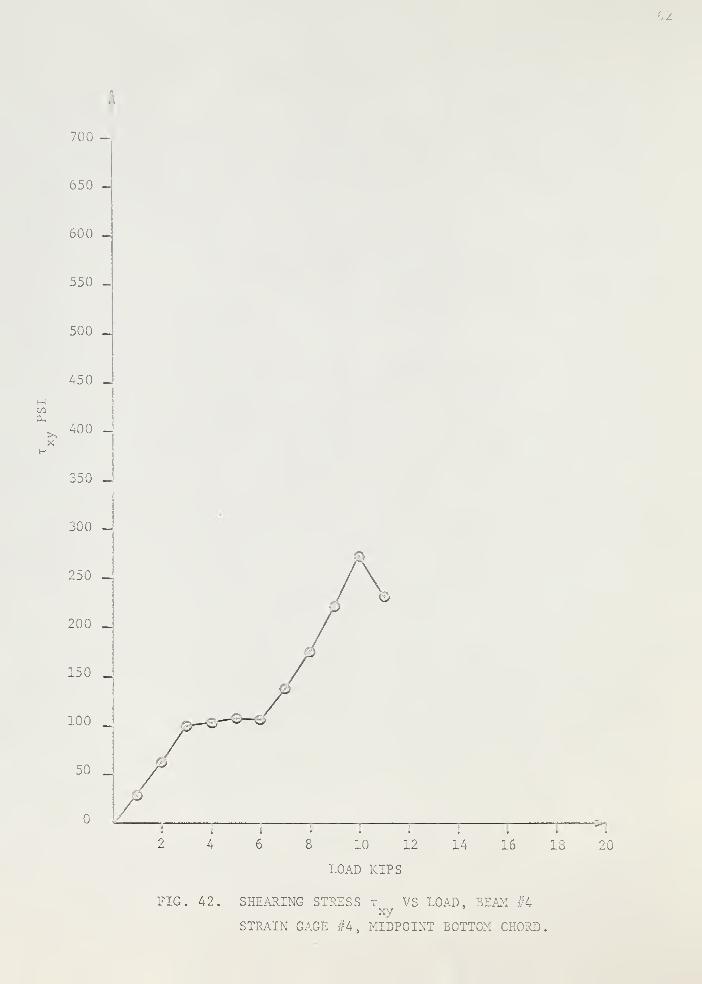
Beam No. 4 had strain gages Nos . 2 and 4 glued on the top and bottom
chords respectively on "face one" at midpoints of the chords. No. 3 rosette
was pasted on "face two" of the top chord at midpoint on a rough surface and
also gave erratic results which were not used. Strain gage Nos. 2 and 4

19
behaved in a manner similar to those at these points in other bear.'.s as can be
seen in Figs. 39 and 40. The stress curves for the top chord were linear up
to 6 kips load and in the case of the bottom chord the curves were linear up
to a load of 3 kips as illustrated in Figs. 39, 40, 41 and 42.
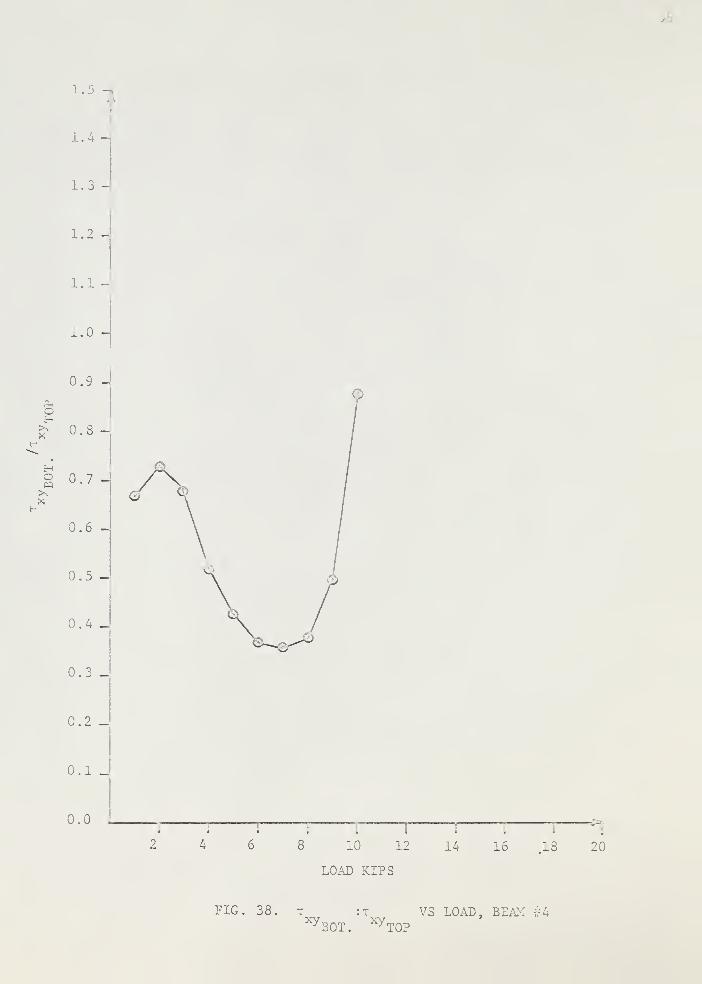
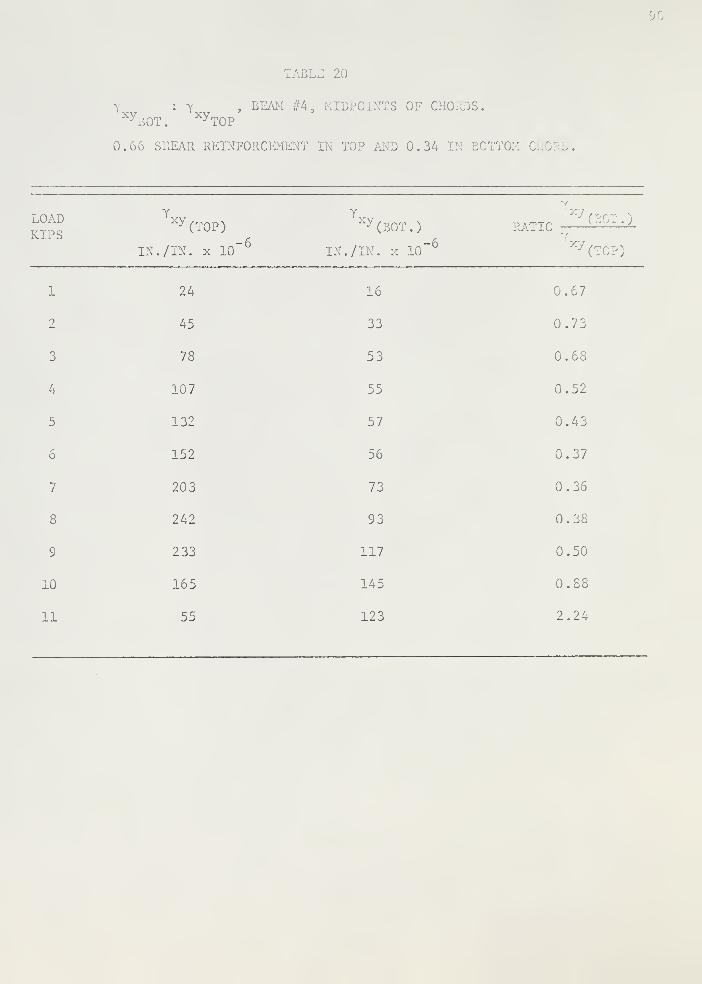
The curve showing the ratio of shear distribution between the botto.
top chords in general decreases with increasing loads, as shown in Fig. 38.
Refering to Fig. 38 and Table 20 the values are seen to vary from 0.73 at 2
kips load to 0.5 at 9 kips load after touching a lowest value of 0.36 at 7 kips
load. The value at 10 kips load is 0.88. All values beyond 10 kips are vary
erratic.
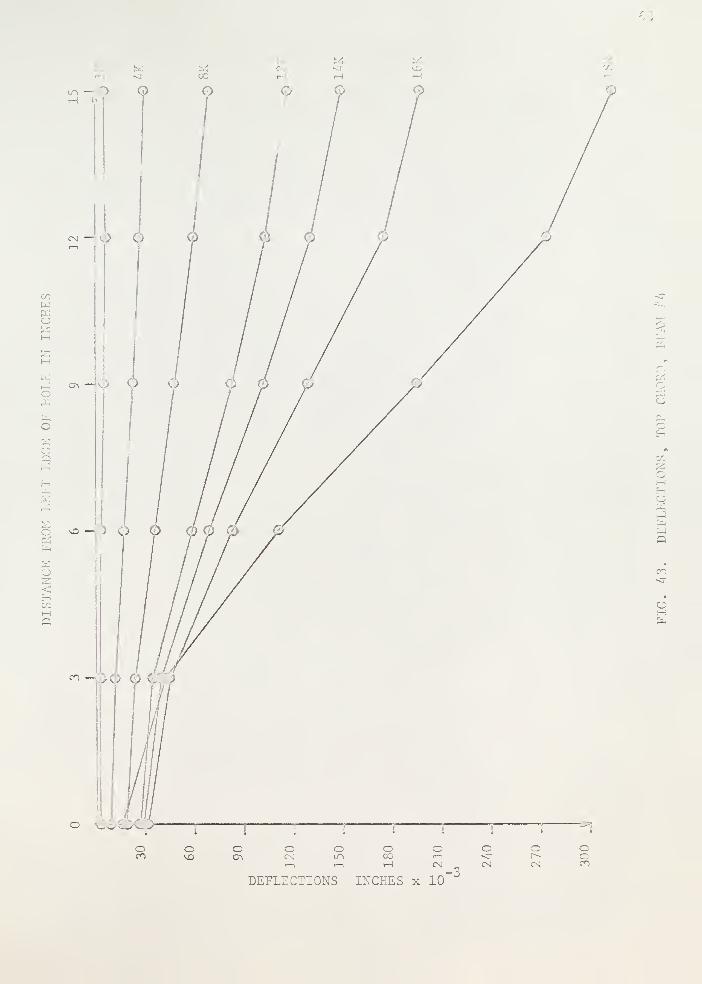
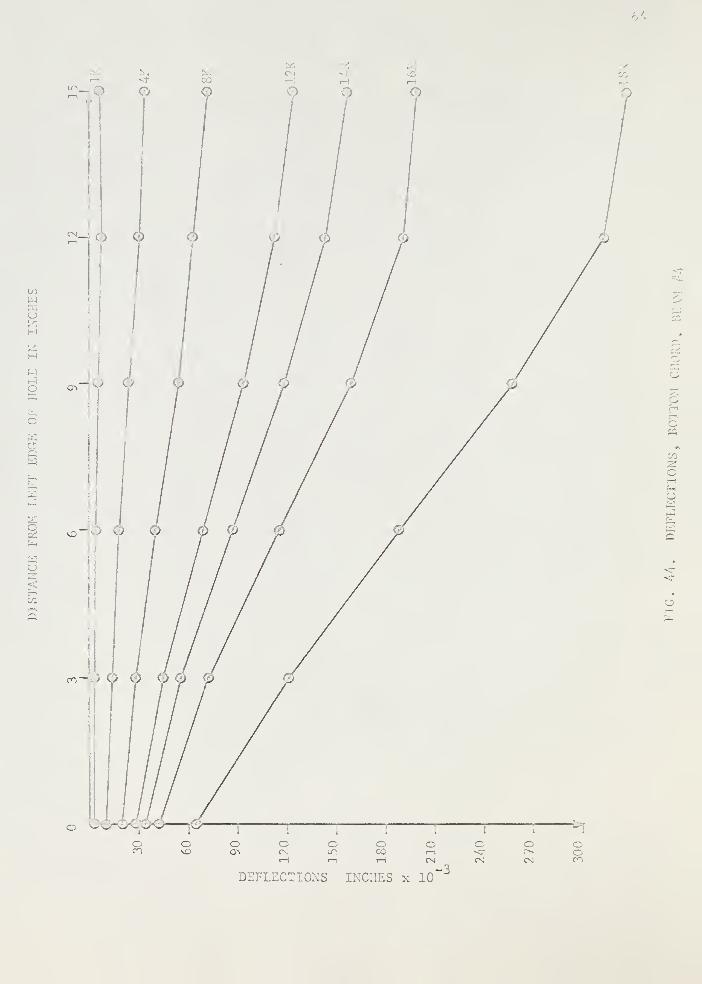
As shown in Figs. 43 and 44, the deflected shape of the chords indicates
that the location of the points of contraflexure are around midspan as assumed.
The magnitude of deflections is much more in the bottom chord than in the top
chord.
First shear cracks were observed in both the chords at a load of 16 kips
followed by corner cracks in the bottom corner on the left hand side of the
opening and the top corner on the right hand side of the opening with a shear
crack in the main body of the solid side of the beam as illustrated in Fig. 11.
The corner cracks and shear crack in the main body of the beam did not increase
with load. The mode of failure was shear in the chord around the opening at
an ultimate load of 18.8 kips.
In Fig. 12 the deflected shape of the chords and the crack patterns are
magnified by loading the beam beyond the ultimate load.
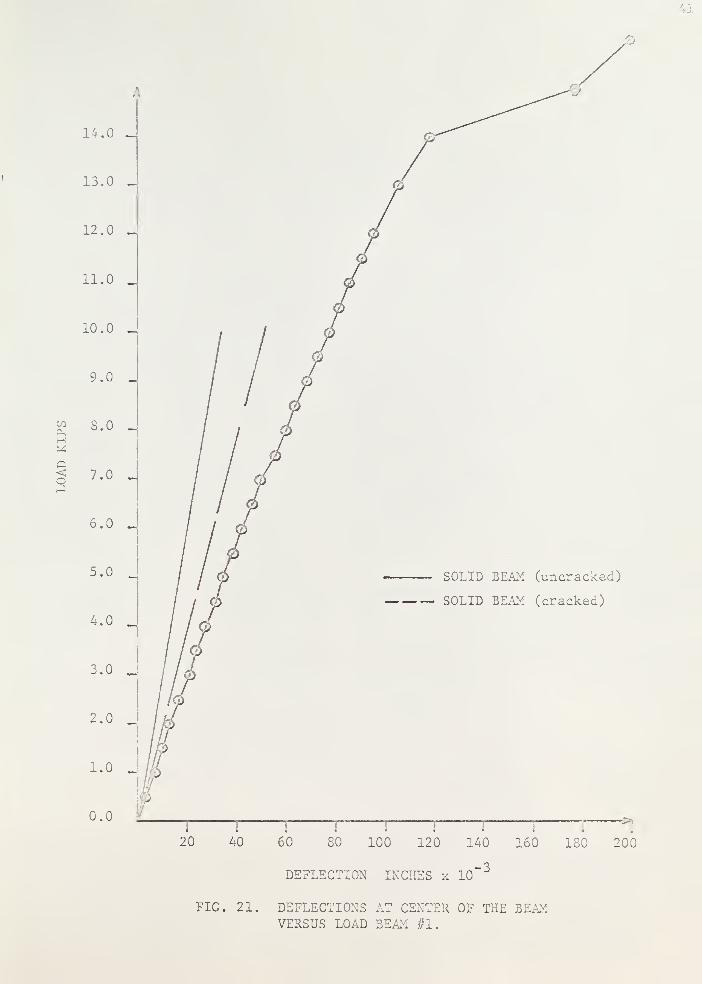
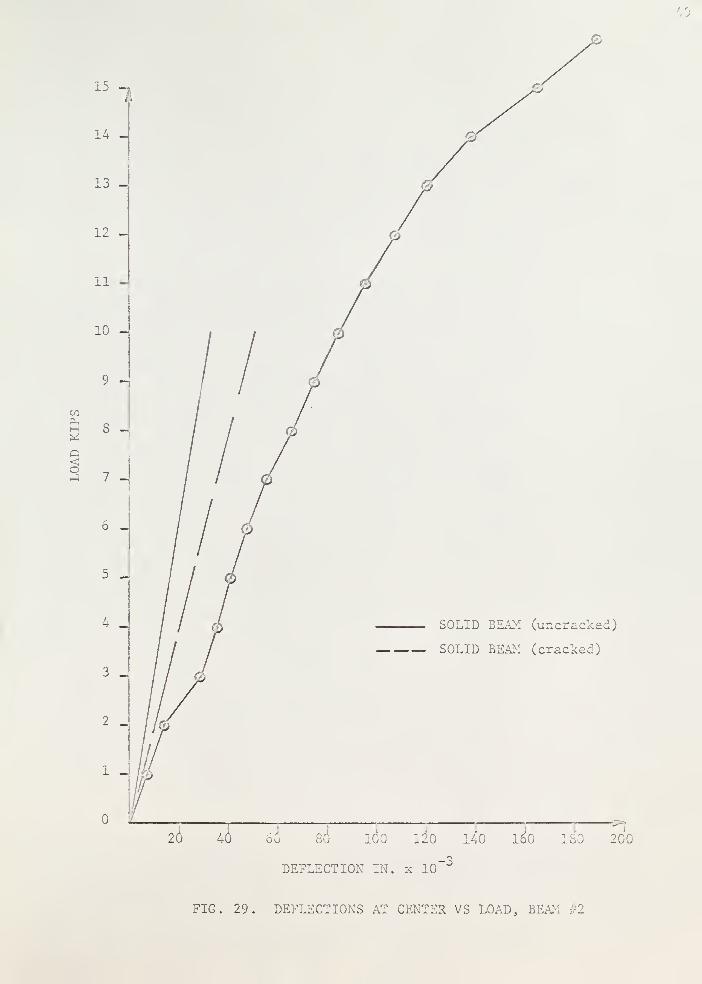
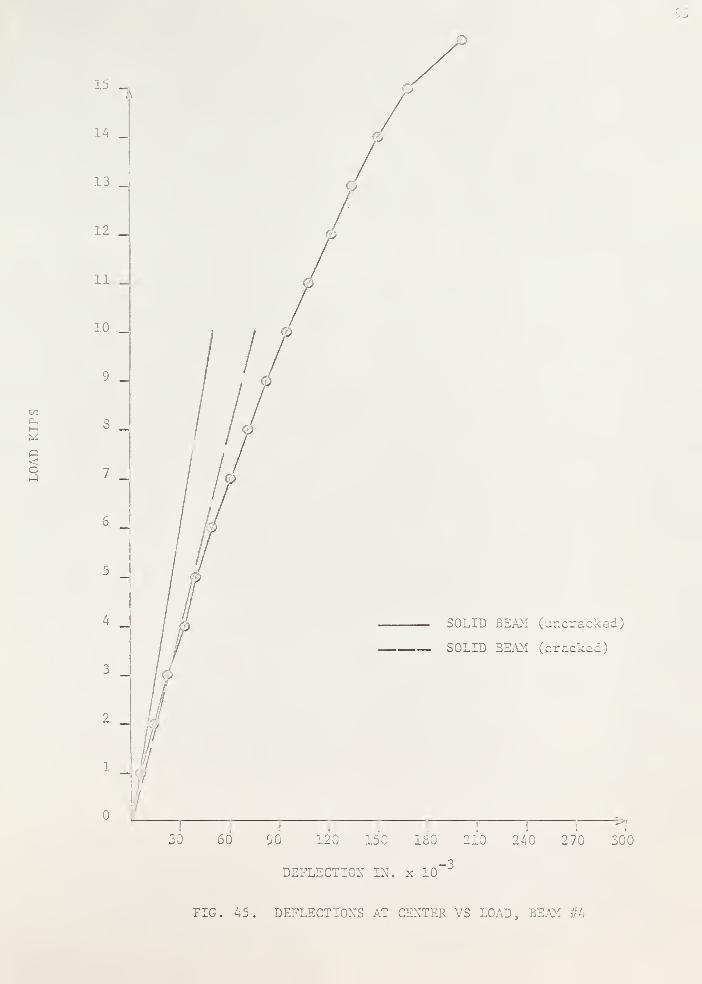
The deflections in the center of the beams, although more than those of
a solid beam of the same properties, gave the type of curve one would other-
wise expect as illustrated in Figs. 21, 29, 37 and 45.
20
It is felt that the reason for the failure of the strain gages glued on
the rough surface was due to the fact that it was not possible to fill the
cavities of the rough surface with Duco cement without having entrapped air.
When there is an air bubble under the strain gage it is not perfectly bonded
to the concrete surface, hence it cannot give true measurements of the strains.
It is observed that the bottom chord deflected more than the top chord
in all the cases. This may be due to the fact that the top chord is in
compression whereas the bottom chord is in tension and concrete does not
contribute as much resistance in tension as in compression.
In all the beams strain measurements in the bottom chords started
becoming erratic at considerably lower loads than those in the top chords.
The reason for this could be that the concrete was cracking in tension. The
mode of failure of all the beams was due to shear in the chords as designed.
By examining Table 33 it is seen that the ultimate load carrying capacity
of the beams varies with the variation in the shear reinforcement in the top
and bottom chords of the opening.
21
CONCLUSIONS
(1) On the basis of the results obtained in this investigation it is observed
that in none of the test beams was the ratio of distribution of shear
between bottom and top chord more than 0.89 with the lowest ratio being
0.36. The corresponding ratios of shear reinforcement provided in the
test beams were 1, 0.5 and and the highest ultimate load was observed
for a ratio of 1. Therefore it is felt that a reinforcement ratio of
0.85 to 0.9 should produce a higher ultimate load by utilizing both
chords to their full capacity for resisting shear. In other words,
(1"K)= 0.9 to 0.85
K.
or K - 0.525 to 0.54 .
It was also observed that when the value of K was kept equal to 0.5,
shear cracks started in the top chord before they were noticed in the
bottom chord, whereas when K was one, the bottom chord started having
shear cracks. When K was kept equal to 0.66, the bottom chord had
shear cracks before the top chord was noticed to have them. Therefore
it seems very likely that 0.525 < K < 0.54 could be the best ratio of
shear reinforcement distribution to make a shear failure occur in top
and bottom chords at the same time.
(2) Points of contraflexure were observed to be at or very near to the
midpoints of the chords of the opening as assumed.
(3) The longitudinal steel for the main beam as well as for the chords
can be satisfactorily designed on the basis of the methods given in the
ACI Code (11).

22
(4) The assumption that the corner stress concentration factor is two
seems to be valid for rectangular openings in concrete beams.
(5) The ultimate load in all cases of failure was observed to be higher
than that predicted.
23
APPENDIX I
FIGURES

p-Q
>PiOH
Q
en<C
W
25OQW<
Io<c1-1
QfnQO
wwPi
OMPn

• • 00w --_
H CM
X(X,
o CN;-.
HH /.
Pi<3 zr-: .
pq <r
o o iH O CN CN i—1 fl H
:
<li ;; II II II fl II II
< - PC - CJ •- o - Q< PQ O 1—1
H
1
CN
1 11
3 5 § §pio
w H W w P^PQ PQ PQ PQ
i
ENS
IONS
AND
REIN
OF
TEST
BEAMS.
H

26
M
-n <»-
:!lf
i" -L'4
ii &
CROSS SECTION Y-YFOR ALL BEAMS
*
4¥
".:
i"
3"o
1"
1"
BEAM - III AND IV
CROSS SECTIONS X-X
-O Q O-
3"
-.—
.
-o—o--
i!\C
BEAM - I BEAM - II
CROSS SECTIONS X-X
FIG. 3. BEAM CROSS SECTIONS
oH

/.''.
-.:
<
o
<Q
Pic
towo<o
1-1
<dPiHCO
Q
COW<
3
&H co
W CO
2: h
Pd (J< <
m
oi—
i
29
FIG. 6. TEST BEAM IN MACHINE
FIG. 7. DEFLECTION AND STRAIN MEASURINGINSTRUMENTS WITH A TEST BEAM
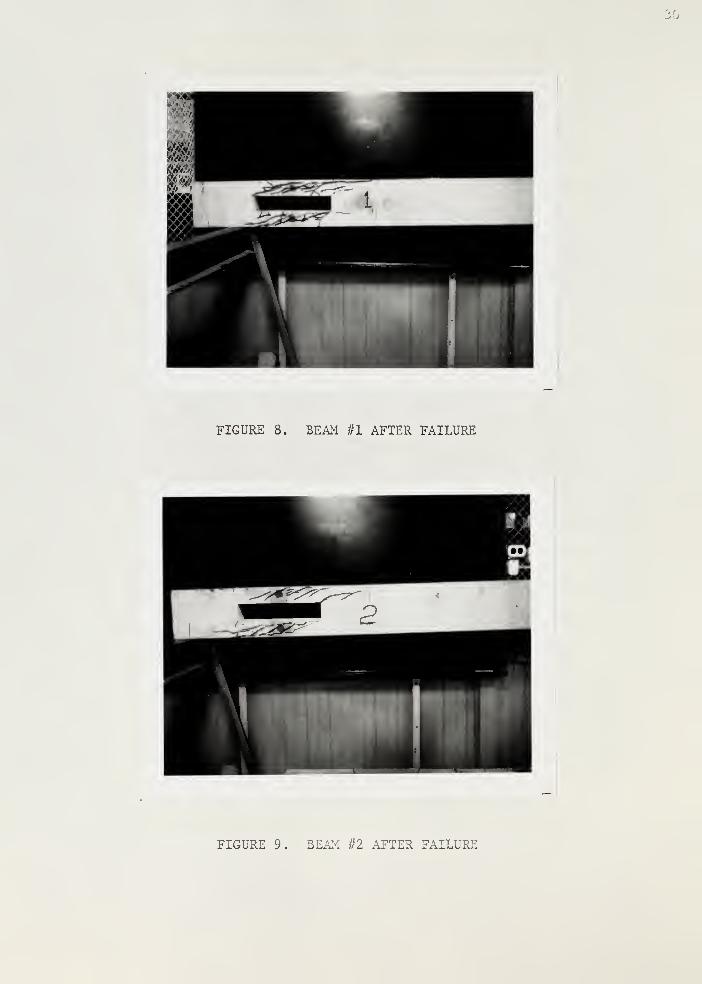
FIGURE 8. BEAM #1 AFTER FAILURE
FIGURE 9. BEAM #2 AFTER FAILURE
i
FIGURE 10. BEAM #3 AFTER FAILURE

32
FIGURE 11. BEAM #4 AFTER FAILURE
FIGURE 12. BEAM #4 WITH THE DEFLECTED SHAPE
OF THE CHORDS ACCENTUATED AFTERFAILURE

L. 4 -
1.3 -
1.2 -
l.i -
1.0 _
o 0.9H
>sX
0.8Hotfl
>^X 0.7
0.6 J
0.5 J
0.4 _
0.3
0.2 _
0.1 _
0.0
FIG. 13. txy
10 12 14 16
LOAD KIPS
VS LOAD, I - . .,-'1.
18 20
BO'xy
TOP
34
LOAD KIPS
8 10 12
- 150 _
- 300-
THEORETICAL
FIG. 14. LONGITUDINAL STRESS a VS LOAD, TOP OF SOLIDx
PORTION OF BEAM, 18V FROM END SUPPORT.

LOAD KIPS
10 12
-650 _
-700 JTHEORETICAL
FIG. 15. LONGITUDINAL STRESS a VS LOAD, BEAM //l,
MIDPOINT TOP CHORD, STRAIN GAGE //2.
CO
550 -
500 -
450 J
400 -4
& 350 -
300 -
250 -
200
150 -
100 -
50 _
0.0
10
LOAD KIPS
I
12 14 16
i
18 20
FIG. 16. SHEARING STRESS x VS LOAD, BEAM #1,xy
TOP CHORD, STRAIN GAGE #2.

FIG. 17. LONGITUDINAL STRESS a VS LOAD, BEAM #1
STRAIN GAGE #3, MIDPOINT BOTTOM CHORD.
500 -j
450 _
400 _
m 350 _iCO
h 300 -J
250 -
200 _
150 _
100 _
50 _
0.0
FIG. 18,
10 12
LOAD KIPS
14 16 18
SHEARING STRESS x VS LOAD. BEAM #1,xy
STRAIN GAGE #3, MIDPOINT BOTTOM CHORD,
39
^ «w ^ CNJ <r00 H i-f
'.
COWCJ2:i-i
i—
i
wo
Pno
oQwHP^W
oPiPn
O
HCO
<PQ
oPic
o
cc
oHHO
Pn
O
DEFLECTIONS INCHES x 10-3
m
CMiH
COwo
MWo
owoQwH;-
Wt-5
OPi
CJ
EhCOM«
CTv
MD —
CO _
oCN
o o oCO
ooiH
OCNr-i
O o oCOiH
OoCNi
w
Piopao
oHC
CO
o—EhCJWJWo
oCN
DEFLECTIONS INCHES x 10-3
M
P<o
so 100 120 140 160 i:: ::;
DEFLECTION INCHES x 10-3
FIG. 21. DEFLECTIONS AT CENTER OF THE BEAMVERSUS LOAD BEAM #1.
1.5 -,
1.4
1.3 -
..2 -
1.1 -
1.0
0.9
h 0.8 _X
h 0.7 _c
0.6
0.5 _
0.4 _
0.3 J
0.2 _
0.1
0.0
10 12
LOAD KIPS
14
i
16 ^o 20
FIG. 22. tXy
B0T.Xy
T0P
VS LOAD, BEAM #2.

- 100 _
-1400
-1500 J
LOAD KIPS
8 10 12
THEORETICAL
FIG. 23. LONGITUDINAL STRESS a VS LOAD, BEAM #2,x
STRAIN GAGE #3, MIDPOINT TOP CHORD.

10 12
LOAD KIPS
I
20
FIG. 24. SHEARING STRESS x VS LOAD, BEAM #2xy
STRAIN GAGE #3, MIDPOINT TO? CHORD.

45
300
- 200 -
- 300 -
- 400 _
w " 500 -A*
D- 600
- 700 _
- 800 _
- 900 -
-1000 J
-1100 _
-1200 _
FIG. 25. LONGITUDINAL STRESS o VS LOAD, BEAM #2x
STRAIN GAGE #4, MIDPOINT BOTTOM CHORD.

1400
1300 -J
1200 —
1100 -
1000 -
CO
X
900 -
800
700 -
600 -
500 -
0.0
8 10 12
LOAD KIPS
FIG. 26. SHEARING STRESS t VS LOAD, BEAM #2,xy
STRAIN GAGE #4, MIDPOINT BOTTOM CHORD.
<w
oo
cH
COISOH
CM
o o o o oCO
OJ
c o o<r r-« oCNi CM CO
DEFLECTIONS INCHES x 10-3
ixi
W W« « cm <r<r CO rH r-:
CO
COwg
wo
owoQWHW
ao
o
HCOM
o Or~» oCM CO
CM
ou
oHHO«
CO
OMHCJw
w
COCM
M
DEFLECTIONS INCHES x 10-3
<o
15
14 J
13 -
12 -
11 -
10
9 -
8 -
7 _
6 _
5 ,
4 _
3 _
1 -i.
SOLID BEAM (uncracked)
SOLID BEAM (cracked)
20 40 ik.
/o cj jujvj ^.zU _-. w IbU ^w^ 200
DEFLECTION IN. x 10
~
3
FIG. 29. DEFLECTIONS AT CENTER VS LOAD, BEAM \\2
50
1 ' 5 ~,
1.4 -
1.3 -
1.2 -
1.1 -
1.0 -
0.9 -
0.8 -
x 0.7 -J
H« 0.6 ^X
0.5 -,
0.4
0.3 -
0.2 _
0.1 -
0.0
FIG. 30
10 12
LOAD KIPS
14 16 18
----
I
20
t :t , BEAM #3Xy
EOT. ^TOP
51
LOAD KIPS
10 12
THEORETICAL
FIG. 31. LONGITUDINAL STRESS o VS LOAD, BEAM #3x
STRAIN GAGE //2 , MIDPOINT TOP CHORD.
700 -
650 _
600
550 _
X
8 10 iz
LOAD KIPS
2 14 16 20
FIG. 32. SHEARING STRESS T VS LOAD, BEAM #3xy
STRAIN GAGE #2, MIDPOINT TOP CHORD.

CO
700 -
650 -
600 -
550 -
500 -
450
400 -
o 350 -
300
250
200
150 _
100
50 -
6 ^ iz
LOAD KIPS
18 20
FIG. 33. LONGITUDINAL STRESS a VS LOAD, BEAM #3
STRAIN GAGE #4, MIDPOINT BOTTOM CHORD.
MCO
X
A
700 -
650
600 _
550 -
500
450 -
400 -
350 -
300 -
250 _
200 _
150 -
100 _
50 -
4 6 b 10 ^2
LOAD KIPS
14
—
r
15 18 20
FIG. 34. SHEARING STRESS t VS LOAD, BEAM #3xy
STRAIN GAGE #4, MIDPOINT BOTTOM CHORD.

COWECCJE3M
o
c
O«wHP-h
WhJ
,-.
wc_>
<HCOH«
CO
pq
QG<_3
OhoH
CO
OHCJW
«
00
DEFLECTIONS INCHES x 10-3
o O OvO OD oiH i—
i
CN

WoH
MWo
PhowCDftw
1-1
cPi
wo<Hcc1-1
ft
m
pq
ft
Oc3
—HO
C/j
Ol—
i
H
J(*.
wft
CO
M
DEFLECTIONS INCHES x 10-3

SOLID BEAM (uncracked)
SOLID BEAM (cracked)
20 40 60 20 140 SO 200
DEFLECTION IN. x 10-J
FIG. 37. DEFLECTIONS AT CENTER VS LOAD, BEAM #3
1.4 -
1.3 -
1.2 -
1.1 -
i.o -:
0.9
o
& 0.8-
° 7
0.6 -,
0.5 -
0.4 -
0.3 _
0.2 _
0.1 _
0.0
10 12
LOAD KIPS
14 .3 20
FIG. 38. t
^BOT. ^TOPVS LOAD, BEAM #4

39
LOAD KIPS
12 14 16 18 20
- 650 -
- 700 -
-750 J
THEORETICAL
FIG. 39. LONGITUDINAL STRESS a VS LOAD, BEAM Hx
STRAIN GAGE #2, MIDPOINT TOP CHORD.

A
700
650 -
600 -
550 _
60
CO
X
500 _
450 -
400 _
350 -
300 _
250 _
200 _
150
I
8 10 12
LOAD KIPS
18 20
FIG. 40. SHEARING STRESS x VS LOAD, BEAM #4xy
STRAIN GAGE #2, MIDPOINT TOP CHORD.
61
200
- 50 -
- 100
- 150 -
X,-200
- 300 -
- 350 -
- 400 -
- 450 -
- 500 -
FIG. 41. LONGITUDINAL STRESS a VS LOAD, BEAM #4x
STRAIN GAGE #4, MIDPOINT BOTTOM CHORD.
62
CO
s?
700 -
650 -
600 -
550 _
500 _
450 -
^00 -
350 J
300 -
250 _
200 _
150 _
100
50 _
12 14 16 18 20
LOAD KIPS
FIG. 42. SHEARING STRESS t VS LOAD, BEAM Hxy
STRAIN GAGE #4, MIDPOINT BOTTOM CHORD,
mH
CN
O
CO —
3
J
(X,
o
oMHCJWJ
G
co
OH
o o o o o O om ^o CT\ r\; m CO rH1—
1
H iH CN CN
o or^ oCN CO
DEFLECTIONS INCHES x 10
00
^ l£o) vO.-1 r-i iH
'.'.
'..<.
o
O
Zo—
s
H
DEFLECTIONS INCHES
p-iM
<c
15"a
14 _
SOLID BEAM (uncracked)
SOLID BEAM (cracked)
2o 60 yU xZu
-1!
l'l
240 270 300
DEFLECTION IN. x 10-3
FIG. 45. DEFLECTIONS AT CENTER VS LOAD, BEAM //4

APPENDIX II
TABLES

TABLE 1
Y : Y >BEAM #1, MIDPOINTS OF CHORDS
XyBOT.
XyTOP
NO SHEAR REINFORCEMENT PROVIDED IN CHORDS.
u
LOADKIPS
YxvXy(TOP)
IN. /IN. x 10
Y^(BOT.)
IN. /IN. x 10
1 25 22
2 48 45
3 65 65
4 83 70
5 100 89
6 119 93
7 136 90
8 150 li.
9 168 107
10 169 135
11 210 144
12 178 122
-o
RATIOXy
(BOT.)
Y,xy(TOP)
0.830
0.936
1.000
0.844
0.890
0.781
0.661
0.586
0.636
0.800
0.685
0.685

68
TABLE 2
a,, BEAM #1, STRAIN GAGE #1 GLUED ON TOP SURFACE OE B]
AT 18V FROM SUPPORT, SOLID SIDE OF BEAM
LOAD e a = 1000 f e
KIPSIN. /IN. x 10~6 PSI
0.5 - 12 - 48.6
1.0 - 24 - 97.2
1.5 - 30 - 121.5
2.0 - 50 - 202.5
2.5 - 62 - 251.0
3.0 - 78 - 316.0
3.5 - 91 - 368.0
4.0 - 107 - 433.0
4.5 - 121 - 490.0
5.0 - 133 - 539.0
5.5 - 146 - 591.0
6.0 - 160 - 648.0
6.5 - 171 - 692.0
7.0 - 181 - 733.0
7.5 - 200 - 810.0
8.0 - 211 - 855.0
8.5 - 226 - 915.0
9.0 - 245 - 991.0
9.5 - 256 -1039.0
10.0 - 270 -1091.0
1C.5 - 295 -1195.0
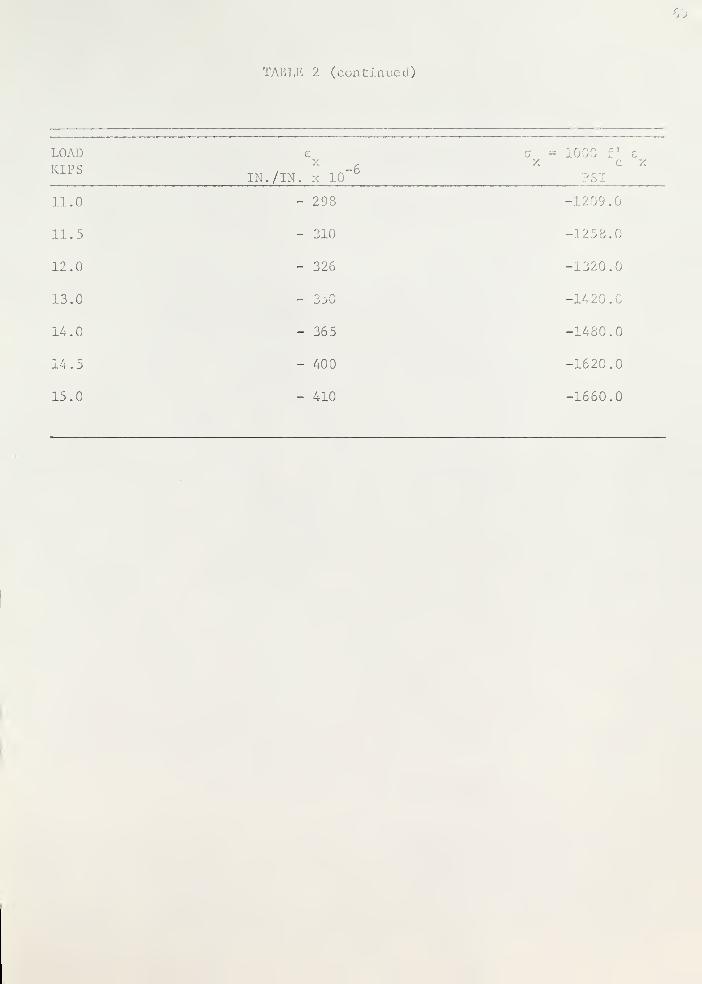
JBLE 2 (continued)
LOAD e a = 1000 f e
KIPSIN. /IN. x 10" 6
PSI
11.0 - 298 -1209.0
11.5 - 310 -1258.0
12.0 - 326 -1320.0
13.0 - 3.:, -1423 .
14.0 - 365 -1480.0
14.5 - 400 -1620.0
15.0 - 410 -1660.0
70
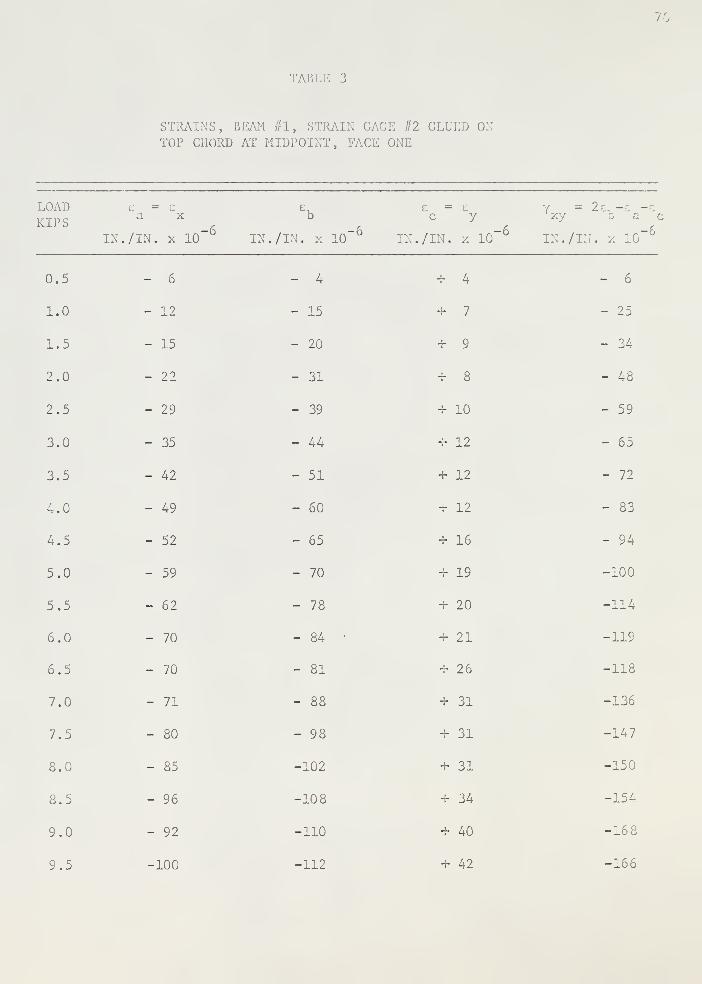
STRAINS, BEAM #1, STRAIN CACE #2 GLU]
TOP CHORD AT MIDPOINT, FACE ONE
LOADKIPS
e = ca x
IN. /IN. x 10~ 6
£b
IN. /IN. x 10" 6
€ = £c y
IN. /IN. x 10" 6
Yxy
/Ii
9 ' _ • -a c
:. x io"6
0.5 - 6 - 4 + 4 - 6
1.0 - 12 - 15 + 7 - 25
1.5 - 15 - 20 + 9 - 34
2.0 - 22 - 31 + 8 - 48
2.5 - 29 - 39 + 10 - 59
3.0 - 35 - 44 + 12 - 65
3.5 - 42 - 51 + 12 - 72
4.0 - 49 - 60 + 12 - 83
4.5 - 52 - 65 + 16 - 94
5.0 - 59 - 70 + 19 -100
5.5 - 62 - 78 + 20 -114
6.0 - 70 - 84 • + 21 -119
6.5 - 70 - 81 + 26 -118
7.0 - 71 - 88 + 31 -136
7.5 - 80 - 98 + 31 -147
8.0 - 85 -102 + 31 -150
8.5 - 96 -108 + 34 -154
9.0 - 92 -no + 40 -168
9.5 -100 -112 + 42 -166
71
TABLE 3 (continued)
KIPSIN,
C = Ea x
./IN. x 10"6 IN.
Cb
./IN. x 10" 6IN,
£ — 8c y
./IN. x 10" 6
Y*y=
IN. /I!
' b ' a
' v LO"6
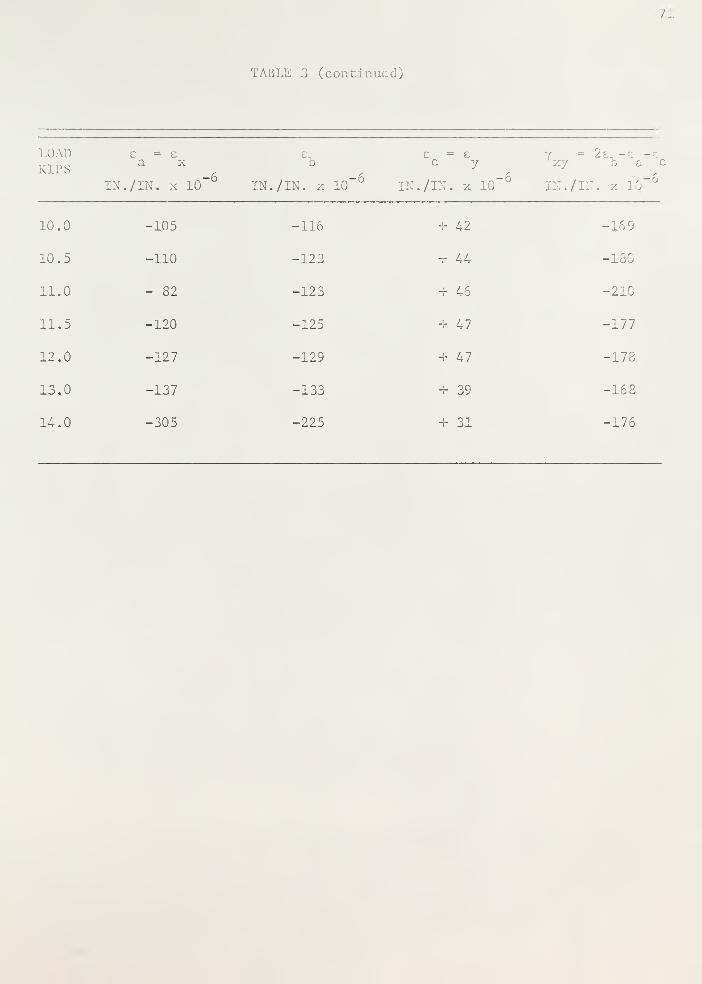
.: . -105 -116 4- 42 -169
10.5 -110 -123 + 44 -180
11.0 - 82 -123 + 46 -210
11.5 -120 -125 + 47 -177
12.0 -127 -129 + 47 -178
13.0 -137 -133 4- 39 -168
14.0 -305 -225 + 31 -176
12
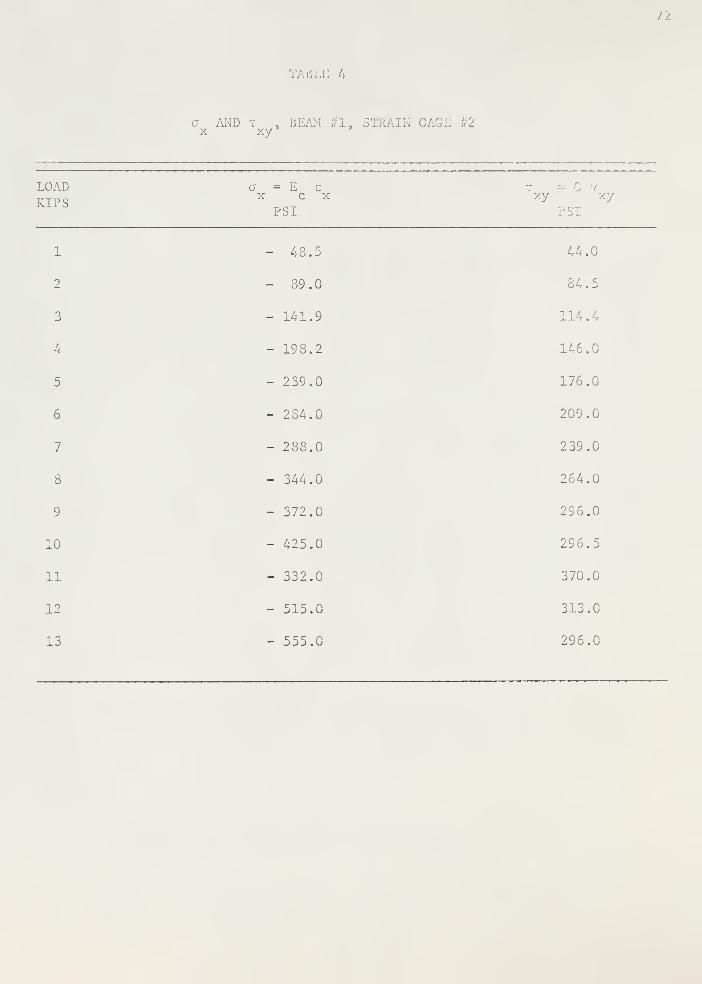
TABLI-: 4
a AND x , BEAM #1, STRAI-. #2x xy
LOAD a = E e
KIPSx ex xy xy
PSI PSI
1 - 48.5 44.0
2 - 39.0 84.5
3 - 141.9 114.4
4 - 198.2 146.0
5 - 239.0 176.0
6 - 234.0 209.0
7 - 288.0 239.0
8 - 344.0 264.0
9 - 372.0 296.0
10 - 425.0 296.5
11 - 332.0 370.0
12 - 515.0 313.0
13 - 555.0 296.0

1
STRAINS, BEAM #1, STRAIN GAGE #3 GLUED ONBOTTOM CHORD AT MIDPOINT, FACE ONE
LOADKIPS
e = ea x
IN. /IN. x 10" 6
£b
IN. /IN. x 10" 6
c y
IN. /IN. x 10~°
Yxy
IN. /H
2z. -e -eo a c
I . x 10
0.5 + 4 + 9 12
1.0 + 12 + 17 22
1.5 + 15 + 24 - 1 34
2.0 + 14 + 28 - 3 45
2.5 + 20 + 36 - 4 56
3.0 + 26 + 41 - 9 65
3.5 + 28 4- 40 - 10 62
4.0 + 31 + 42 - 19 70
4.5 + 32 + 42 - 21 71
5.0 + 38 + 50 - 27 89
5.5 + 40 + 47 - 31 85
6.0 + 41 + 49 - 36 93
6.5 + 43 + 50 + 36 93
7.0 + 45 4- 49 + 37 90
7.5 4- 42 4- 50 - 40 98
8.0 + 50 + 48 - 42 88
8.5 + 39 + 42 - 48 93
9.0 + 38 + 50 - 45 107
9.5 + 39 + 55 - 48 119

/'
LE 5 (continued)
LOADKIPS
IN,
£ = £a x
./IN. x 10"-6
IN../IN. x 10"-6
£ = £c y
IN. /IN. x 10"-6
Y*y
=
IN. /I
- -b a c
N. x 10" 6
10.0 4- 35 + 61 - 48 115
10.5 4- 21 + 59 - 40 137
11.0 + 8 4- 60 - 32 144
11.5 - 28 4- 50 - 15 143
12.0 - 50 + 34 - 4 122
13.0 -100 - 6 4- 32 56
14.0 4-378 4-1885 4-1729 1663

KIPS
6
o AND t , BEAM //l, STRAIN GAGE #3x xy
LOAD a = E e t = G vx c x xy xy
PSI PSI
1 + 48.6 38.7
2 + 56.7 79.1
3 + 105.2 114.4
4 + 125.8 123.0
5 + 154.0 156.5
6 + 166.0 163.5
7 + 182.0 158.1
8 + 202.5 155.0
9 + 154.0 188.0
10 + 142.0 238.0
11 +32.4 254.0
12 - 202.5 214.0
13 - 404.0 98.5

*LE 7
STRAINS, BEAM #1, STRAIN GAGE #4 GLUED ONBOTTOM CHORD AT MIDPOINT, FACE TWO
LOADKIPS
a "x
IN. /IN. x 10~°
£b
IN. /IN. x 10~ 6
c y
IN. /IN. x 10" 6
' xy °b a c
IN. /IN. x 10' 6
0.5 + 11 + 7 - 4 7
1.0 + 16 + 20 - 7 31
1.5 + 24 + 28 - 9 41
2.0 + 30 + 36 - 10 52
2.5 + 40 + 48 - 11 67
3.0 + 46 + 56 - 16 82
3.5 + 50 + 70 - 18 10
4.0 + 35 + 99 - 20 183
4.5 + 30 +112 - 22 216
5.0 + 30 +147 - 22 286
5.5 + 16 +171 - 23 349
6.0 + 3 +198 - 24 417
6.5 - 11 +240 - 20 511
7.0 - 26 +275 - 20 596
7.5 - 40 +324 - 20 708
8.0 - 52 +364 - 22 802
8.5 - 94 +484 - 13 1075
9.0 -132 +601 - 5 1339
9.5 -150 +658 - 3 1469

TABLE 7 (continued)
77
KIPS£ = £
X
IN. /IN. x 10-6
IN. /IN. x 10"
c y
IN. /IN. x 10-6
Y = 2e, -£ -.xy o a c
IN. /IN. x 10-o
10.0 -178
10.5 -210
11.0 -242
11.5 -259
12.0 -271
13.0 -330
14.0 -518
-1-702
+760
+798
+870
+911
+1060
+1166
+ 2
+ 22
+ 49
+135
+184
+340
+509
1580
1708
1789
1864
1909
2110
2341
*This strain gage being on a rough surface did not behave well, hence the data
was rejected.

.
TABLE 8
Y. : Y , BEAM #2, MIDPOINTS OF CHORDS.Xy
BOT .
XyTOP
ALL SHEAR REINFORCEMENT IN TOP, NONE IN BOTTOM CHORD,
LOADKIPS
Xy(TOP)
IN. /IN. x 10~
Xy(BOT.)
IN. /IN. x 10
1 13 21
2 36 32
3 50 38
4 67 50
5 81 68
6 94 81
7 104 100
8 120 89
9 130 49
10 144 57
11 178 74
12 217 82
13 55 85
-6RATIO
'
xy
1.61
>.
0.76
. 745
0.84
0.86
0.96
0.74
0.377
0.396
0.415
0.378
1.55

TABLE 9
STRAINS, BEAM #2, STRAIN GAGE #3 GLUED ONTOP CHORD AT MIDPOINT, FACE INE
LOADKIPS
£ = £a x
IN. /IN. x ID"5
IN.
£b
, /IN. x lO"6
£ *~
C
IN. /IN.
; £y
x 10" 6
Y•xy
l./Il
2e. -£ -£d a c
v 10-6
i - 10 - 11 4- i 13
2 - 18 - 25 + 4 36
3 - 30 - 37 + 6 50
4 - 41 - 50 + 8 67
5 - 50 - 61 4- 9 81
6 - 61 - 72 + 11 94
7 - 70 - 82 + 10 104
8 - 79 - 95 .j. 9 120
9 - 86 -106 + 4 130
10 - 92 -121 - 6 144
11 - 93 -140 - 9 178
12 -105 -163 - 4 217
13 -183 -143 + 52 55
14 -238 -118 4-840 838
15 -385 -162 4-1643 1582
iO
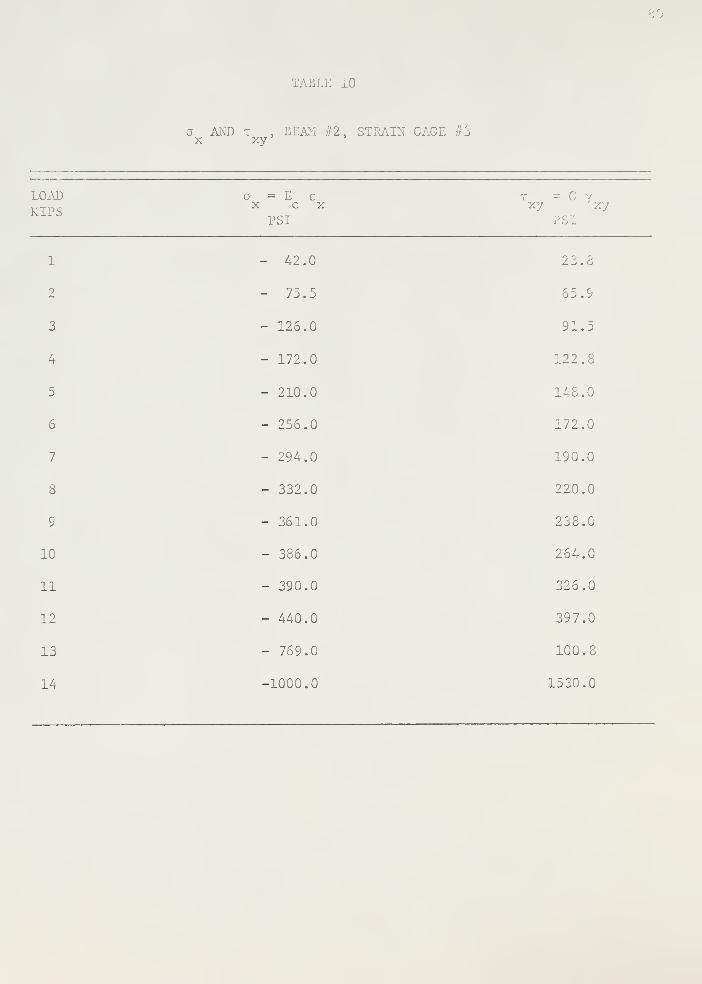
TABLE 10
a AND t , BEAvi #2, STRAIN GAGE #3x xy
LOAD a = E e T = G yKIPS
x ex xy ' xyPSI PSI
1 - 42.0 22.8
2 - 75.5 65.9
3 - 126.0 91.5
4 - 172.0 122.8
5 - 210.0 148.0
6 - 256.0 172.0
7 - 294.0 190.0
8 - 332.0 • 220.0
9 - 361.0 238.0
10 - 386.0 264.0
11 - 390.0 326.0
12 - 440.0 397.0
13 - 769.0 100.8
14 -1000.0 1530.0

TABLE 11
STRAINS, BEAM #2, STRAIN GACE #4 GLUED ONBOTTOM CHORD AT MIDPOINT, FACE ONE
LOADKIPS
e = ea x
IN. /IN. x 10" 6IN. /IN. x 10~ 6
c —c
IN. /IN.
y
x io"6
xy a c
./.: . .: LO"6
1
2
+ 9
4- 18
- 8
- 10
- 4
6
21
32
3 +8 - 19 -fa 38
4 +17 - 22 - 11 50
5 4-27 - 27 - 13 68
6 +34 - 30 - 13 81
7 4-37 - 41 - 19 100
8 4-18 - 46 - 21 89
9 4-18 - 81 - 71 49
10 4-15 - 57 - 72 57
11 4-7 - 75 - 83 74
12 - 94 -123 - 70 82
13 -166 -145 - 39 85
14 -243 - 59 4-539 414
15-75 - 9 57
KIPS
TABLE 12
a AND T , BEAM #2, STRAIN GAGE #4x xy
LOAD a = E ex c x
PSI
= cxy Y
*y
4
58.
69.,5
91,,5
124,.4
148,.0
183,.0
163 .0
89 .5
104 .2
135 .3
150 .0
155 .5
756 .0
1 +37.3
2 +75.5
3 + 33.6
4 + 71.5
5 + 113.5
6 + 143.0
7 +155.8
8 +75.5
9 +75.5
10 + 63.0
11 +29.4
12 - 395.0
13 -1020.0
14

TABLE 13
STRAINS, BEAM #2, STRAIN GAGE #2 GLUED ONTOP CHORD AT MIDPOINT, FACE TWO
LOADKIPS
c = ea x
: = £c y
IN. /IN. x 10-6
IN. /IN. x 10-6
IN. /IN. x 10'
xy b a c
f. x 10" 6
1 - 7
2 - 13
3 + 7
4
5 - 7
6 - 10
7 - 15
8 + 10
9 + 35
10 +156
11 +351
12 +564
13 +888
14 +1219
15 +1677
+ 7
+ 17
+150
+164
+179
+210
+278
+450
+620
+959
+1389
+1882
+2542
+3440
+4954
+ 2
+ 4
+ 89
+ 94
+102
+118
+166
+271
+331
+593
+850
+1196
+1630
+2270
+3251
19
43
204
234
263
312
405
620
874
12C9
1577
2004
2566
3391
4980
*This strain gage being on a rough surface did not behave well, hence the
data was rejected.
xyBOT.
xy.
TABLE 14
, BEAM #3, MIDPOINTS OF CHORDS.TOP
HALF SHEAR REINFORCEMENT IN TOP CHORD AND HAI
LOADKIPS
xy(TOP)
IN. /IN. x 10-6
Xy(BOT .
)
IN. /IN. x 10-6
:-ja : o
xy ,„
l
2
3
4
5
6
7
8
9
10
11
12
13
27
62
92
120
143
170
191
214
231
259
277
312
333
21
52
S8
76
94
102
121
140
168
346
312
496
726
0.777
0.840
0.740
0.634
0.658
0.600
0.655
0.655
0.726
1.330
1.130
1.590
2.180

TABLE 15
STRAINS, BEAM #3, STRAIN GAGE //2 GLUEDTOP CHORD AT MIDPOINT, FACE ONE
LOADKIPS
£ — £a x
IN. /IN. x 10~ 6
%IN. /IN. x 10" 6
£ =C
IN. /IN.
: £y
x io"6
1 - 9 + 11 + 4
2 - 18 + 24 j_ 4
3 - 30 + 34 _:_ 6
4 - 38 + 46 + 10
5 - 47 + 53 _1_ 10
6 - 55 + 63 + 11
7 - 63 + 70 + 12
8 - 73 + 77 + 13
9 - 82 + 83 + 17
10 - 90 + 94 + 19
11 -101 + 97 + 18
12 -110 +112 -1. 22
13 -110 +127 + 31
14 -123 +147 _|_ 48
Y = 2£, --'. -£' xy d a c
. x 10" 6
27
>2
>2
120
143
170
191
214
231
259
277
312
333
369

KIPS
TABLE 16
a AND t , 13, STRAIN GAGE #2x xy
LOAD a = E £ = Gx c x ' xy
PSI 3
1 - 38.2 50
2 - 76.4 115
3 - 127.5 :::
4 - 161.5 212
5 - 200.0 264
6 - 234.0 314
7 - 263.0 354
8 - 310.0 396
9 - 348.0 427
10 - 382.0 480
11 - 430.0 512
12 - 467.0 577
13 - 467.0 615

T
STRAINS, BEAM //3, !
BOTTOM CHORD AT M ; D]
: //A GLUES
KIPS
= £a x
IN. /IN. x 10 IN. /IN. x 10-6
c y
IN. /IN. x 10"
xy b a c
-6IN. /IN. x 10
1 4- 7
2 + 16
3 + 28
4 + 30
5 + 26
6 + 18
7 + 17
8 + 9
9 + 1
10 +440
11 +599
12 +689
13 +804
14 +960
+ 12
+ 32
+ 44
+ 45
+ 49
+ 47
+ 54
+ 57
+ 67
+411
+480
+639
+830
+1176
- 4
- 4
- 8
- 16
- 22
- 26
- 30
- 35
- 35
+ 36
+ 49
+ 93
+130
+246
21
52
68
76
94
102
121
140
168
346
312
496
726
1146
18
a AND t , BEAM #3, STRAIN GAGE #4x xy
LOAD o_ = Eo er
T = G yKIPS
x ex xy
PSI
1 + 29.8 38.8
2 + 68.0 96.0
3 + 119.0 126.0
4 + 127.8 140.5
5 + 110.
5
174.0
6 -r 76.5 189.0
7 + 72.2 224.0
8 + 38.2 258.0
9 + 4.25 310.0
10 +1870.0 640.0
11 +2540.0 576.0
12 +2920.0 916.0
13 +3420.0 1345.0
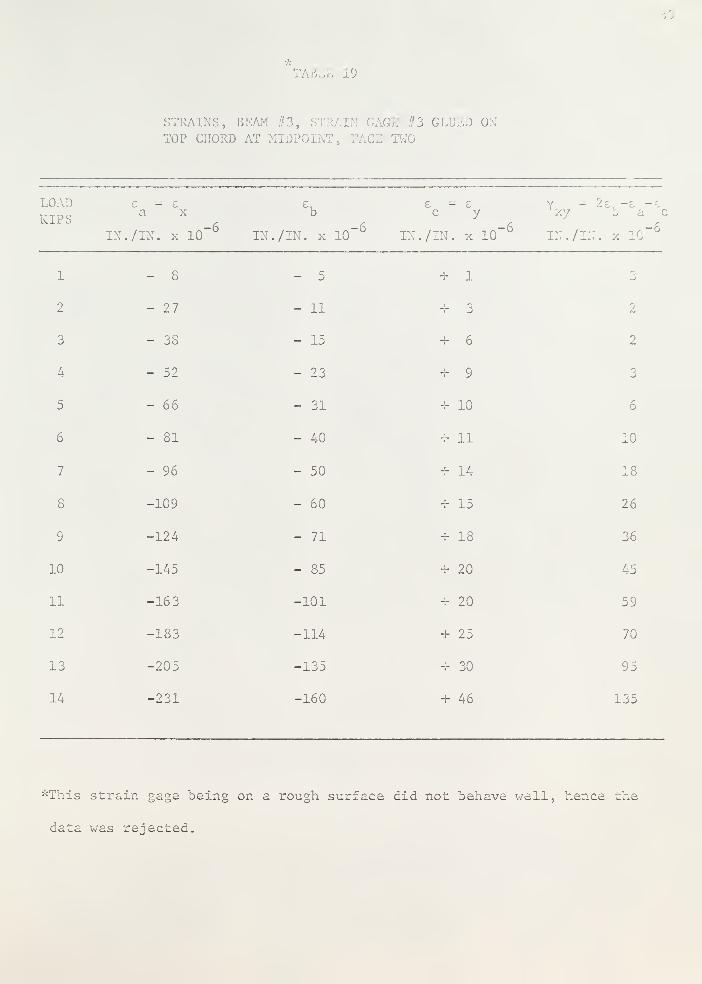
,E 19
AINS, BEAM #3, STRAIN C. , .
TOP CHORD AT '-TINT, FACE TWO
LOADKIPS
IN,
e = ea x
./IN. x lO"6
IN,
£b
./IN. x 10~ 6IN
£ =C
./IN.
y
x 10" 6i./n
b a c
;. x io"6
1 - 8 - 5 + 1 o->
2 - 27 - 11 JL. 3 2
3 - 38 - 15 + 6 2
4 - 52 - 23 J- 9 3
5 - 66 - 31 + 10 6
6 - 81 - 40 -;- 11 10
7 - 96 - 50 _i_ 14 18
8 -109 - 60 + 15 26
9 -124 - 71 + 18 36
10 -145 - 85 + 20 45
11 -163 -101 + 20 59
12 -183 -114 + 25 70
13 -205 -135 + 30 95
14 -231 -160 + 46 135
"This strain gage being on a rough surface did not behave well, hence the
data was rejected.
xyBOT
XyTOP'
TABLE 20
BEAM #4, MIDPOINTS OF CHORDS.
0.66 SHEAR REINFORCEMENT IN TOP AND 0.34 IN BOTTOM CI 3RD
LOADKIPS
xy(TOP)
IN. /IN. x 10-6
Xy(BOT.)
IN. /IN. x 10-6
xy,RATIO
I •
)
Xy(TOP)
1
2
3
4
5
6
7
8
9
10
11
24
45
78
107
132
152
203
242
233
165
55
16
33
53
55
57
56
73
93
117
145
123
0.67
0.73
0.68
0.52
0.43
0.37
0.36
0.38
0.50
0.88
2.24
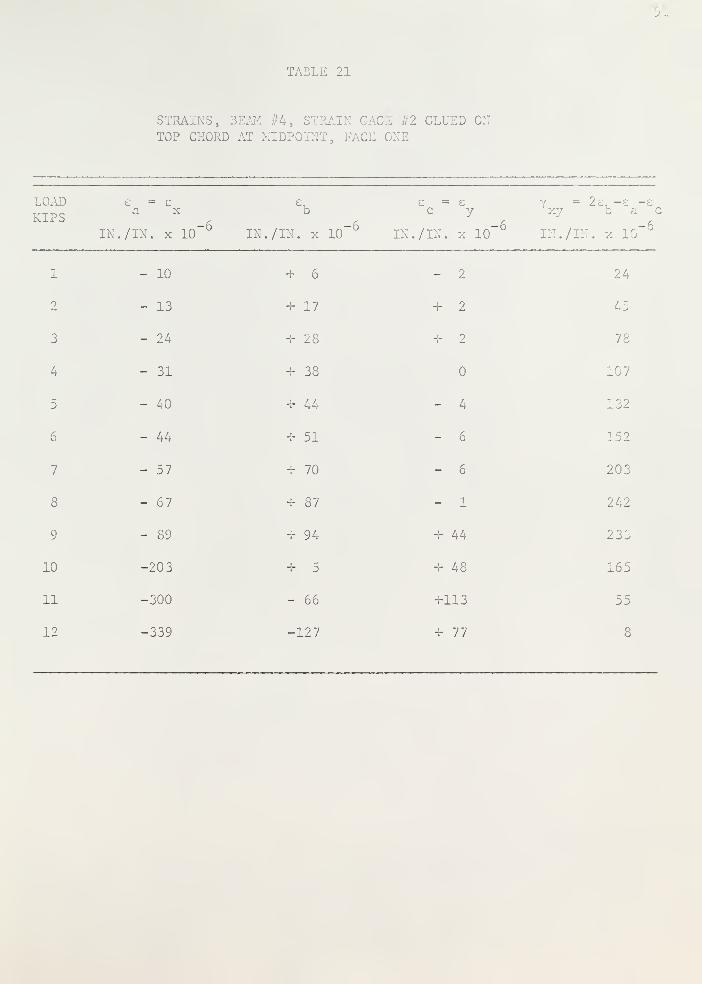
-LE 21
STRAINS, BEAM #4, ST . . . #2 GLUED ONTOP CHORD AT MIDPOINT, FACE ONE
LOAD e = e e, e = e Y = 2c, -e -£
KIPSa X b C y
' Xy D '
IN. /IN. x 10 ° IN. /IN. x 10 IN. /IN. x 10 ./IN. x 103
1 - 10 + 6 - 2 24
2 - 13 + 17 + 2 45
3 - 24 + 28 -:- 2 78
4 - 31 + 38 107
5 - 40 + 44 - 4 132
6 - 44 + 51 - 6 152
7 - 57 + 70 - 6 ir,',
8 - 67 + 87 - 1 242
9 - 89 -1- 94 + 44 233
10 -203 + 5 + 48 165
11 -300 - 66 +113 55
12 -339 -127 + 77 8

',
'
. 22
a AND x , BEAM #4, STRAIN GAGE ;/2x xy
LOAD a = E e t = G v
KIPSx c x xy xy
PSI PSI
1 - 43.5 45.4
2 - 56.5 85.0
3 - 104.2 147.5
4 - 135.0 202.0
5 - 174.0 249.5
6 - 191.5 287.0
7 - 248.0 384.0
8 - 292.0 457.0
9 - 388.0 440.0
10 - 882.0 312.0
11 -1305.0 104.0
12 -1475.0 15.1

TABLE 23
STRAINS, BEAM #4, STRAIN CAGE #4 GLUED ONBOTTOM CHORD AT MIDPOINT, FACE ONE
LOADKIPS
£ = £a x
IN. /IN. x 10~ 6IN. /IN. x
1 -:- 8 4- 11
2 + 19 + 23
3 + 29 + 33
4 + 33 + 33
5 + 30 4- 33
6 4- 22 + 26
7 + 23 4- 32
8 + 23 + 38
9 + 14 + 43
10 - 6 4- 56
11 - 63 + 48
12 -102 - 5
£ — £ Y — Z £, — £ —
£
c y xy b a c
IN. /IN. x 10~ 6IN. /IN. x 10" 6
-2 16
-6 33
-16 5 3
- 22 55
- 21 57
- 26 56
- 32 73
- 40 93
- 45 117
- 27 145
4- 36 123
4- 60 32
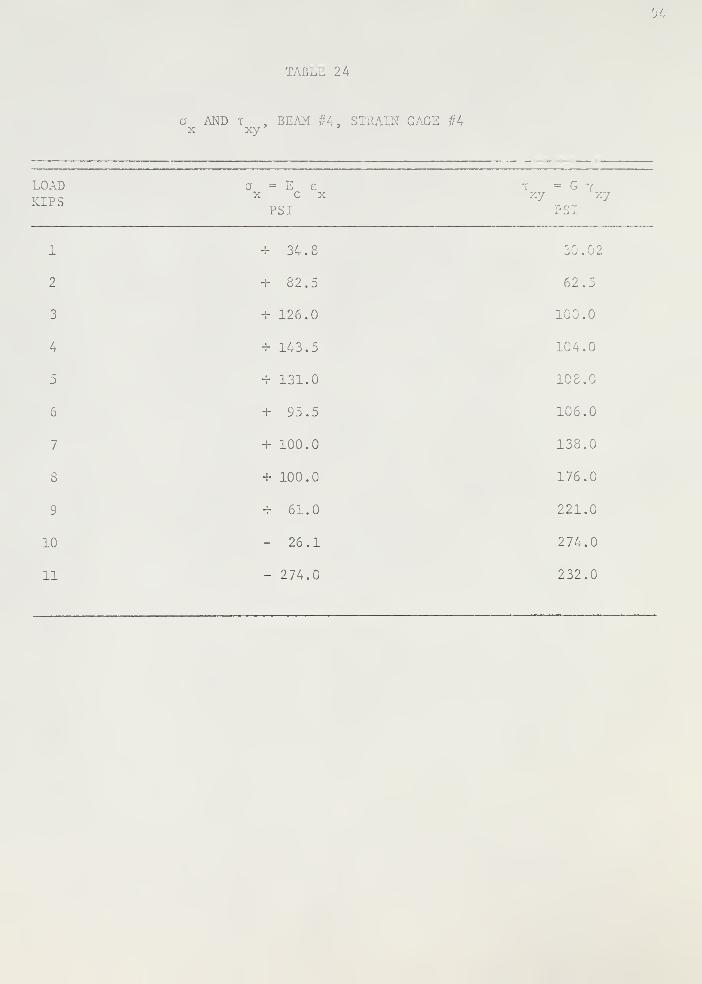
TABL
a AND t , BEAM #4, STRAIN GAGE #4x xy
LOAD av = E^ ev t_t=
'
KIPSx c x xy
PSI
1 +34.8 30.02
2 -1-82.5 62.5
3 + 126.0 100.0
4 + 143.5 104.0
5 + 131.0 108.0
6 + 95.5 106.0
7 + 100.0 138.0
S + 100.0 176.0
9 + 61.0 221.0
10 - 26.1 274.0
11 - 274.0 232.0

•;.•
,E 25
STRAINS, BEAM #4, STRAIN GAGE #3 GLUED ONTOP CHORD AT MIDPOINT, FACE
KIPSe = ea x
IN. /IN. x 10"
e =c y
Y = 2e, -£ -xy sac
IN. /IN. x 10-6
IN. /IN. x 10-6
[. x 10-6
1 - S
2 - 15
3 - 13
4 + 3
5 - 2
6 + 7
7 + 29
8 + 75
9 +109
+ 10
+ 26
+ 73
+221
+350
+544
+740
+1010
+1294
+ 4
+ 30
+10 7
+192
+345
+517
+722
+975
.
129
332
510
736
934
1223
1504
"This strain gage being on a rough surface did not behave well, hence the
data was rejected.
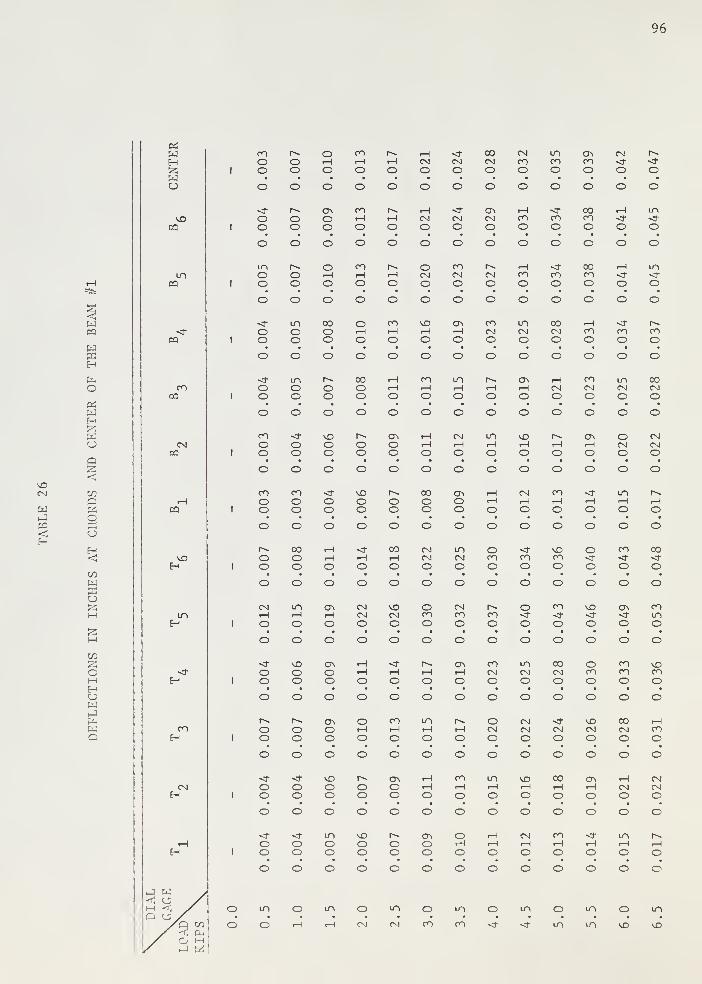
96
CM
Hl-J
CO<;
wco
wH
OC*
H2;wa
COoooH
CO
HJ2
CO
oMHCJW
wQ
wHWu
VOCO
CO
«
COCO
PQ
CO
vO
m
CO
Oo
COoo Oo
orHo
corHo
rHo
rHCMo
Csl
o00CMo
CMcoo
mcoo
ONcoo
CMo-o o
o o o o o o o o o o o o o
<*oo Oo ooCOHo
rHo
rHCsi
oCsl
oONCMo
rHcoo
coo
00coo
rH
oin<ro
o o o o o o o o o o o o o
inoo
ooorHo
enHo
rHo
oCMo
coCMo
CMo
rHcoo
COo
00COo
rH
oin
oo o o o o o o o o o o o o
oomoo
00ooorHo
COrHo
vDrHo
ONHoCOCMo
mCMo
00CMo
rHCOo
coo
coo
o o o o o o o o o o o o o
oo
inoo oo
00oo
rHrHo
corHo
mrHo
rHo
ONrHo
rHCMo
COCMo
inCMo
00CMo
o o o o o o o o o o o o o
enoo oo oo oo
a-,oorHrHo
CMrHo
mrHo
VOrHo
rHo
ONrHo
oCMo
CMCMo
o o o o o o o o o o o o o
oomoo o
ovOoo oo
00oo
ONoorHrHo
CMrHo
corHo
rHo
mrHo
1
—
rHo
o o o o o o o o o o o o o
Oo00oo
rHo
rHo
00rHo
CMCMo
mCMo
oCOo
coo
coo
o<ro
co
oCO
oo o o o o o o o o o o o o
CMHO
mHo
onrHo
CMCMo
vOCMo
oCOo
CMCOo
coo
o<ro
co
oVO
oon-cr
ocomo
O o o o o o o o o o o o o
oovOoo
ONoorHrHo
rHo
rHo
ONrHo
coCMo
mCMo
00CMo
oCOo
coCOo
vOcoo
o o o o o o o o o o o o o
oo ooONoo
orHo
COrHo
mrHo
rHo
oCMo
CMCMo
CMo
VDCMo
00CMo
rHCOo
o o o o o o o o o o o o o
oo oovOoo oo
onoorHrHo
corHo
mrHo
vOrHo
00rHo
ONrHo
rHCMo
CMCMo
o o o o o o o o o o o o o
oo ooinoo
CDo ooonoo
orHo
rHrHo
CMrHo
corHo
rHo
mrHo
rHo
o o o o o o o o o o o o o
mo
m oCM
mCM
oCO
mCO
o m oin
in
in
ovO
m
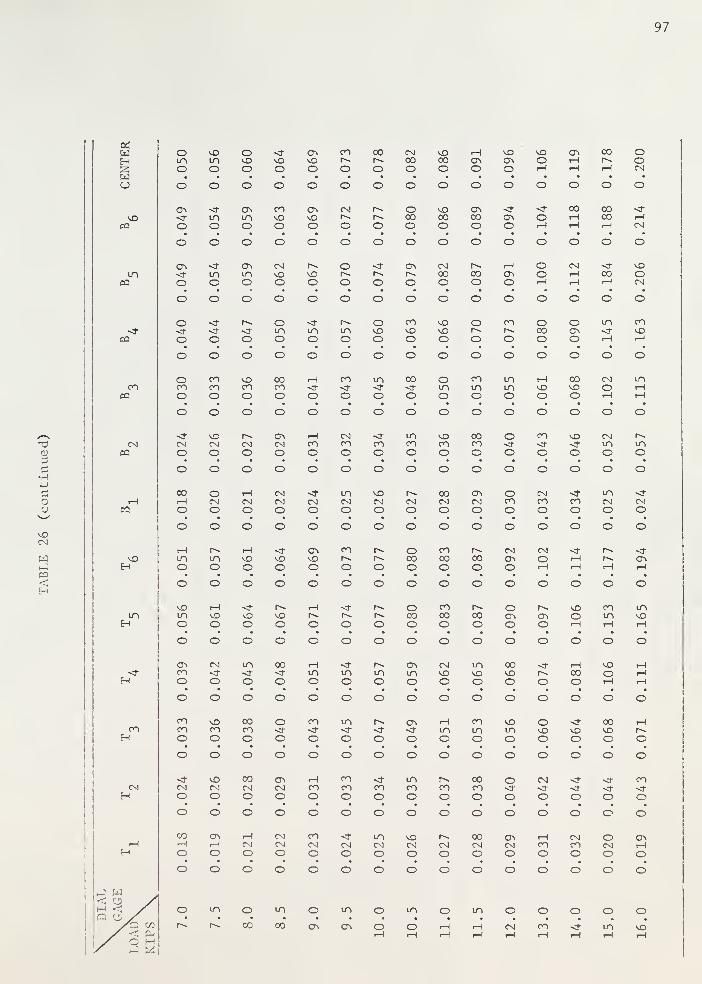
97
wHW
ooo
vOmoo
OvOOO
*3"
vOOo
CT\
oo
co
OO
00
oO
CM00Oo
vOCOoo
l-l
ONoO
vOONoO
VOOrH
o
ONt-l
iH
O
CO1
—
rH
o
ooCM
O
vOo
tno
onino
covOo
CT>
vOO
CM
O Oo00o
vO00o
ON00o
ONO o
rH
00I-l
COCOrH
rHCM
o o o o O o o o o o o O O o O
m on
o moONmo
CMvOO
vOo
oo o
ON
oCM00o
00o
rHONo
OorH
CMt-H
i—
1
COrH
vOoCM
o o o O o o o o o o o O O o O
PQ
oo o o
Omo mo
mo
ovOo
COvOo
vOvOO
oo
co
OO00o
OONo
mrH
covOrH
o o o o o o o o O o O o o o O
PQ
ocoO
mo
coo
COcoo
rH
oco
omo
00
oOino
COino
mino
rHVOO
COVOo
CMorH
mrHrH
O o o o o o o o o o o O o o O
CMPQ
CMo
VDCMO
CMo
ONCMo
f-i
coo
CMCOo
coo
mcoo
VOcoo
00coo
oo
CO
oVO
oCMmo
ino
o O o o o o O o o o o o o o o
r-H
pa
COrHO
oCMO
rHCMO
CMCMO CM
omCMo
vOCMo
CMO
00CMo
ONCMo
ocoo
CMcoo
coo
inCMO
CMO
O o o O o o o O o o o o o o o
vOH
rHmo
mo
rHVOO
vOo
ONvOo
CO
o ooCOo
co00o
00o
CMONO
CMorH
tHrH
i
—
rHONrH
o o o o o o o o o o O O o O O
VO
CrHvoo
VOo
vOo
rH
O O Oo00o
co00o
00o
oONo
ONo
vOOrH
coinrH
invOrH
o o o O O O O o o o o o O o O
oncoO
CM
oin
o00o-o
rHmo mo
mo
ONmo
CMvOO
mvOo
00VOo
r--
orHCOo
vOorH
rHrHrH
O o o o o o o o o o o O o o o
enH
COCOo
vocoo
00COo
oo
co
omo o
ON
orHmo
COmo
VOmo
ovOo
-3-
VOo
COvOO
rH
Oo o o o o o o o o o o o o O O
CM CMo
vOCMO
COCMo
ONCMo
rHCOO
COCOo
coo
incoo
COo
COcoo
oo
CM
o o oCO
oo o o o O o o o o o o o o o o
COr-l
oonrHO
rHCMO
CMCMo
COCMO
CMo
mCMo
vOCMo
CMo
COCMo
ONCMo
Hcoo
CMCOo
oCMo
ONrHo
o O O o O o o o o o o o o o o
\
DIAL
\GAGE
load\ KIPS
\ o m oCO
mCO
oON
mON
oo-H
morH
orHrH
in
rHrH
oCM
oCO!-H
o
rH
oinrH
ovOrH
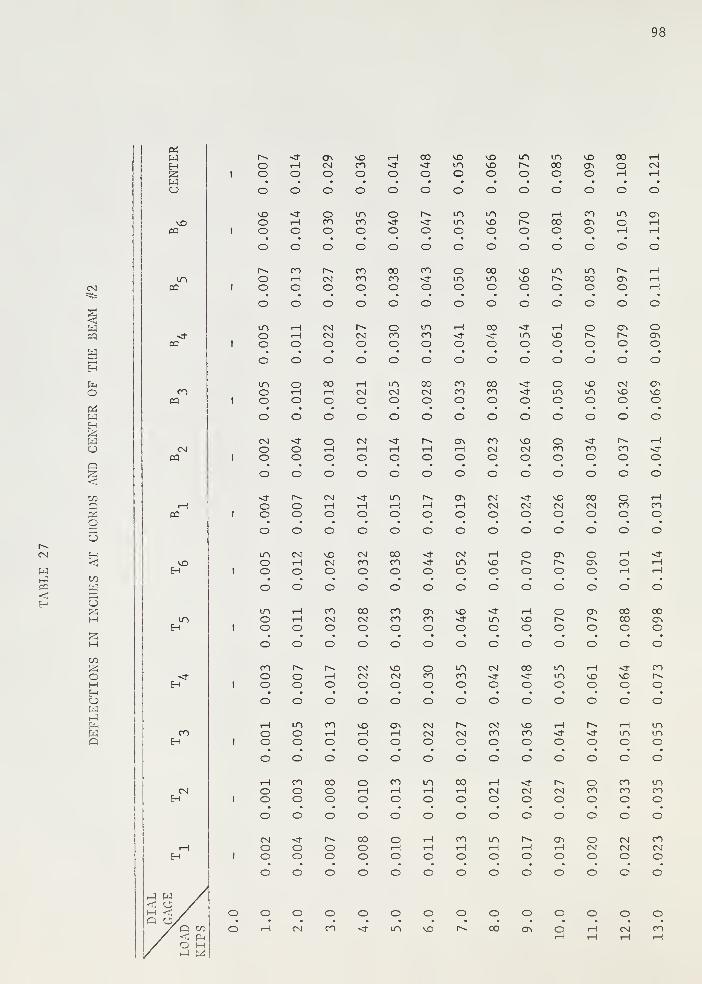
98
CM
wJPQ<
CM
WPQ
WH&-.
OPiwHZwoo
COQPiOu
COwUIS
c/o
PSoI—
I
HolahJPnWQ
PiWH
u
vDPQ
UOpq
COPQ
CMPQ
CQ
vD
LO
OO
Oo rHOCMo
VOeno
rH
o00
oVOino
VOvOO o
m00o
vOONo
00o
rHCMrH
o O o o o o o O o o o o o
VOOOi-H
Ooeno
menO
oo o
mmo
mvDO
oI--.
O1-i
00o
enONo
mo
ONrHrH
O o o O o o o O o o o o O
oOenHo
CMO
enenO
00eno
en
oomo
00moVDVDO
in
om00o
onO
rH
r-1
O o O O o o o o o o o o o
moo
rHrHo
CMCMO
CMO
oeno
menO
rH
o00
oino
vDo
oo
on
ooONo
o o O o o O o o o o o o o
mooorHO
00Ho
HCMO
mCMO
00CMO
enenO
00enO O
oino
vOino
CMvDO
ONVOo
o O o O o o o O o O o O o
CMOo oo
orHO
CMrHO
-d-
o oONrHO
enCMo
vDCMO
oeno
eno
eno
rH
oo o O O o o o o O o o o o
oooo
CM
orHo
mO o
ONrHO
CMCMO
CMO
vDCMo
00CMo
oenO
rHenO
o o o o O o o O o o o o o
ooCMrHO
vOCMo
CMenO
00enO o
CMmo
i-H
vDO
oo
ON
ooOnO
rHorH
rHrH
o O o O O o o O o o O o o
moorH
oenCMo
00CMO
eneno
ONenO
VO
omo
rHVDO
oo
ON
O0000o
CO
oo o o o o O o o O o o o o
enoo oo
rHo
CMCMO
vOCMO
oenO
menO
CM
O00
omno
HvOO
vOo
en
oo o o O o O O o o o O o o
rHoo
moo
enHo
VO
OOnrHo
CMCMO CM
oCMeno
vDenO
rH
o omo
mmO
o o o O o O o o O o o o o
rHoo
enoo
00oo
oHoCO
omrHO
00rHO
rHCMO CM
OCMo
oeno
enenO
inenO
o o o o o O O o o o o O o
CMoo
oo oo00oo
orHo
i-H
rHo
enrHo
inrHo
r~~
OON
oOCMO
CMCMo
enCMO
o o o o o o o o O o o o o
oCM
oen
o om
oVD
o o00*
oo>
o oO r-l
oCM
Oen
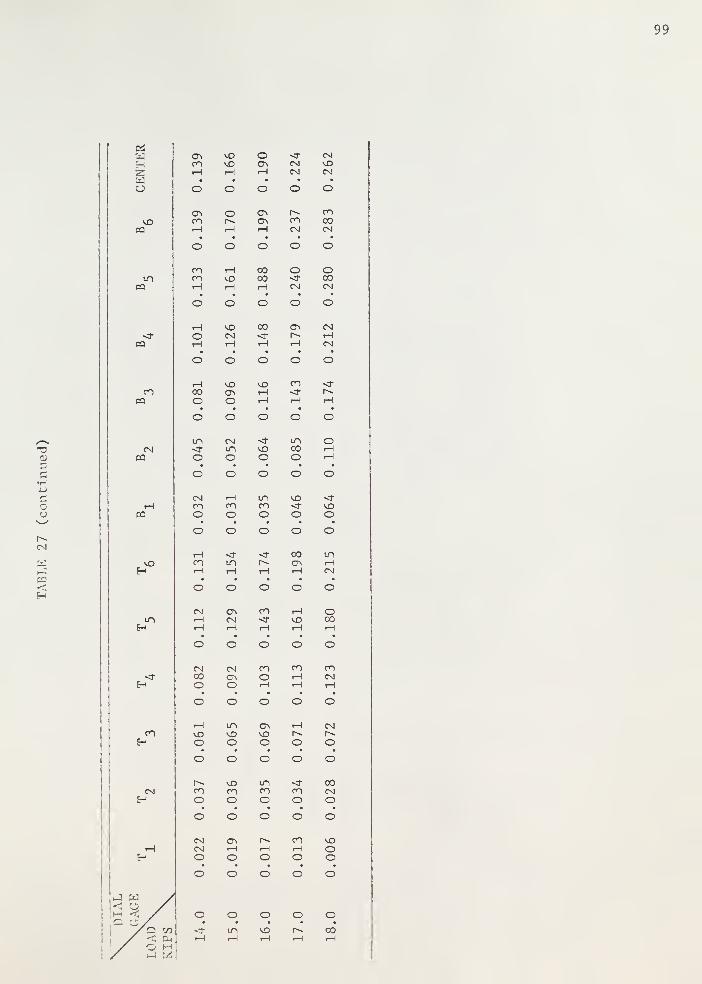
99
E-i
Wo
vOCQ
inpq
ca
COcq
pq
P3
vO
LO
CO
CT>coH
vOVOH
oonrH
o-CMCM
CMVOCM
o o o O O
ONCOH
oH
CTi
rHCOCM
coCOCM
o o o O o
COCOH
rHvOH
COco
oCM
oCOCM
O O o o O
HOi—
1
vOCMrH
CO
HON
rH
CMrHCM
o O O O o
rH00o
VOONo
vorHrH
CO
rH rH
o o O O o
oCMinO
VOo
incoo
orHrH
o O O o O
CMCOo
rHCOO
inCOo
vO
oVOo
o O o o o
rHCOrH
inH rH
COONrH
inrHCM
o o o o O
CMHrH
CMrH
co
HHrH
oCOrH
O o O o O
CMooo
CM
oCOorH
COrHrH
coCMrH
o o o o o
rHvoo
mVOo
ON
orH
OCM
Oo o o O O
COo
voCOo
inCOO
COo
COCMo
o o o o o
CMCMo
CT\rHo
rHO
COrHo
vOoo
o o o o o
o om
ovo
o Ooo
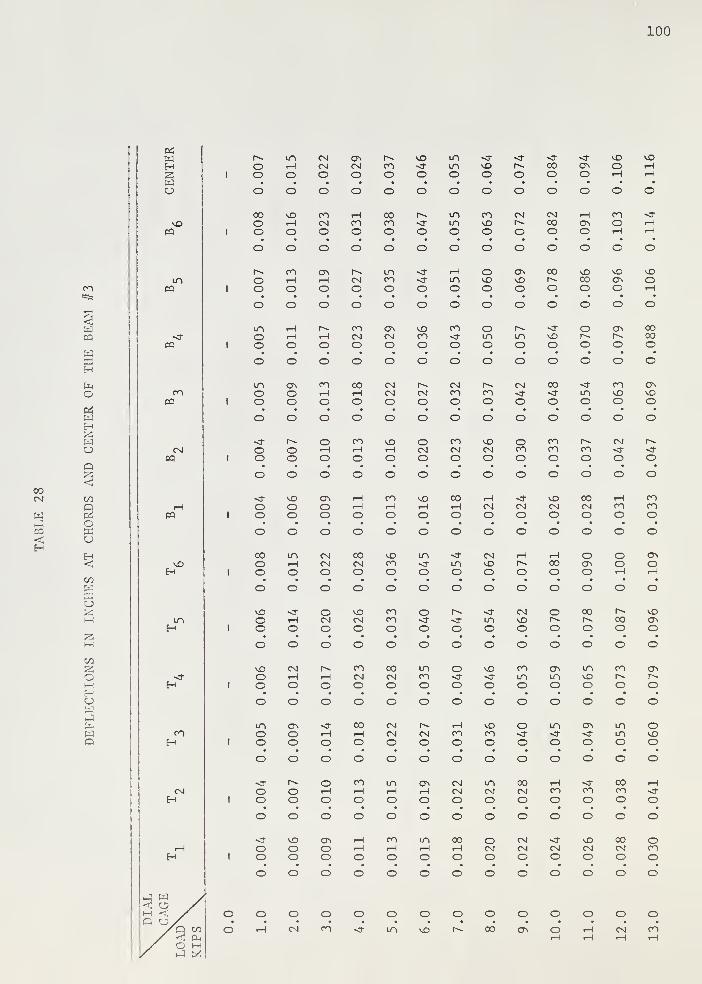
100
ooCNl
wca<
CO
CO
WH
O(XwHS3Wu
CO
oHIU
%COWu
M00
oMHOtahJ
wQ
c*wHwc_>
vOCO
CO
PQ
PQ
CQ
pq
vO
Oo
OomrHO
CMCMo
CT>CMO
COo
vO
omino
voo
r-«-
o00o
C7\
ONOorH
NOHrH
o o o O o o o o O o o O o
00oo
nOiHO
COCMo
rHCOo
COCOo o
mmoCONOo
CM
OCMCOo
HOn.O
COorH
rHrH
o o o o o o o o o o O O o
oorHo
CT>HoCMo
mCOo o
Hmo
oNOo
ONnOo
00
oNOCOO
NOONo
NOorH
o o o o o o o o o o O o o
moo
t-H
rHO
rHo
coCMo
ONCMo
NOcoo
CO
oomo
ino
NOo
OO
ON
o0000o
o o o o o o o o o o O o o
mooCT.Oo
COiHo
00rHO
CMCMO
CMo
CMCOo
coo
CM
oCO
omo
coNOo
CT>
NOo
o o o O o o o o o o o o o
oo OOorHo
corHO
NOrHO
oCMo
COCMo
nOCMo
oCOo
cocoo
COo
CM
o oo o o o O o o o o o O o o
ooNOoo
CT>
oorHrHo
COrHo
NOrHo
COrHO
rHCMo
CMO
NOCMo
COCMo
rHCOo
COCOo
o o o o O o O o O o o o o
00oo
mHo
CMCMo
00CMo
nOCOo
in
omo
CMNOo
rH
orHCOo
oON.
ooorH
CT>
oI—
1
o o o o o o o o o o o O o
NOoo H
ooCMo
NOCMO
cocoo
o<ro o
ino
CMNOo
oo
CO
o00o
NOo>o
o o o O o o o o o o o o o
nOoo
CMrHo
rHO
COCMO
COCMo
mCOo
oo
NO
ocoino
ONmo
mNOo
co
OON
oo o o O o o o o o o o O o
mooOnoo
rHo
COrHo
CMCMo
CMo
rHCOO
NOCOo
oo
in<ro
CT<
omino
oNOo
o o o O o o o o o o o o o
oo ooorHo
COrHO
rHo
rHO
CMCMo
mCMo
COCMo
rHCOo
COo
00COo
Ho
o o O O o O o o o o o o o
oonOoo
ONoo
rHrHo
COrHo
inrHo
00rHo
oCMo
CMCMO
CMONOCMo
ooCMO
oCOo
o o o o o o o o o O o O o
oCM
OCO
O Om
oNO
o oCO
oOn O
rH
oCM
OCO
101
vOpa
PQ
PQ
00CO
CMpa
pq
vo
en
CM
CMi-H
oH
i-H
vO00
HoenCM
© O O q o Q
inCMH
o rHvO
CO vO00
CMCMCM
O o O O o O
vOH oenH
eninH
oiH
in00i-H
CMCMCM
o o O o o O
vO
o00orH
VOCMi—
i
oi-H
in>—
i
O00i-H
o o o O o o
VO
o00o
vO
omoH
mrH
enenrH
o o o o o O
unO
vOLOo
envOO
00vOO
vO
o00o
O o o O o o
coo
mo
enO
Ho o o
o o O o o o
oCM en
rHm o
i-H
00oo rH
CM
o o o O o O
oHvOHrH
CMen
m HvOrH
vO00rH
o O o O o O
VO00o
en
oinoH HH
CMOrH
o o O O O o
vOo
o>VOo
mooo
OONo o O
o o o o o O
o ovO
o00
oi-H
mo
mo
o o o o o o
CMeno
enenO
eneno
enenO
ineno
eno
o om
ovO
o ooo
o
102
onCM
WrJPQ<5H
Wpq
WH
O
WH
COQC4owu
S3
w|—
;
CJ
H53MCO53OHHC_>
w
PdwH53Wu
vOPO
m
PQ
coPQ
PQ
PQ
vO
ro
oo
vooo o
COCMo
COCOo
oo
omorH
OCMr—O
CO00o
mo
ONorH
CMCMrH
COrH
o o o o o o o O o o o O o
oo<trHO CM
O<*COo
rH
orHmo
rHVOo
CM
O00o
mONo
orHrH
00COrH
o o o o o o o O o o o o O
moorHiHo
oCMo
oCOo
vDCOo o
mo
COvOo
co
om00o
ONONo
CMrHrH
inCMr-l
o o o o o o o o o o o o o
mooONoo
voHO
CMO
ocoo
00coo
VO
omo
COvOo
CM
oco00o
COONo
COorH
o o O o o o o o o O o o O
oo ooCMHO
00rHo
CMCMo
00CMO
mCOo
oo o
COino
CMvOO
ONvOo O
o o O o o o o o o o O o o
cooo
moo
Onoo
rHO
VOrHo
oCMo
StCMo
00CMo
COcoo
inCOo
rH
omo
ON
oo o o O o o o o o o o o o
CMoo
COco
VOoo
orHO
CMrHO
rHoVOrHo
ONrHO
rHCMo
coCMo
CMo
00CMO
rHCOO
o o o o o o O o O o o o o
moo
rHi—l
ooCMo
ocoo
00coo
00
oONmo
ONvOo
O00o
rHONO o
rHrHrH
rHCOrH
o o o o o o o o o O o O O
vDoo
orHo
oorHo
CMo
COCOO
CM
oCMmo
oVOo
CM
OCM00o
ONo orH
VOrHrH
o o o o O o o o O o o O O
moo
ONoovOrHO
COCMO
00CMo
mCOo
CM
O00
ovOino
COvDO
CM
oCM00o
rHONo
o o O o o o o o o O o o o
cooo
vOoo
rHrHO
rHO
rHCMO
vOCMo
rHCOO
vOCOo
rH
oVD
oCMmo
00mo
COvOo
o o O o O o o o o o o o o
CMoo oo
00oo
CMrHo
rHO
00rHO
rHCMO
<tCMO
CMo
oCOo
COCOo
mcoo
COo
o o o O o O O o o o o o o
CMOo
CMoo
vOOO
ONoorHrHo
rHo
vOrHO
00rHO
oCMo
coCMo
inCMO
vOCMO
CMO
o o O o o O o O o o O O o
oCM
OCO
o Om
oVO
o ooo
oON
oo
oCM CO
rH
103
PdWH55WO
u-l
rH
O
vOrH
o
COoCM
O
asCMCM
o
inrHCO
o
pain
mrH
CJ\
rHCMCM
00CMco
o o o o o
mDO
CO o^mrH
rH
rH
00r-\
CM
COrHCO
o o O O o
PQ
COrHrH
COcoH
inrH
O00rH
inCM
O O o O o
paooo O
mrHrH
rHCOrH
00oo
o o O O o
CMpa
mmo
oO
CM
orH00O
rHCMrH
O O o O O
Hpa
coo
COo
CM
o o oo o o o o
ON
H rH
CMCMCM
mrHco
o o o O o
inrHCOH
in
rH
mrH rH
<*r*«.
CM
O o o O O
CMO rH
Ho>CMrH rH
inCTv
rH
O O O o o
coc^
O om00o
COOAo
rHrHrH
o O o o o
CMH
cr.
COo
oo o o
oStO
O o o o O
HCMo
CMo
CMo
ocoo
rHo
o o o o o
\
DIAL \GAGE
L0AD\ KIPS
\ o oin
o
rH
o
rH
o00rH

TABLE 30
YIELD STRENGTH OF DIFFERENT REINFORCING BARS
BAR SIZEAREA OF
CROSS SECTIONSQ. IN.
YIELD LOADLBS.
YIELD STR]
#1
#2
#4
#6
0.05
0.2
0.44
2,710
10,950
19,650
78,000
54,000
54,000
44,500
TABLE 31
COMPRESSIVE STRESS OF CONCRETE AT 28 DAYS
CYLINDER NO. Ic
PSI
AVERAGE
PQT
3,890
4,014
3,590
3,800
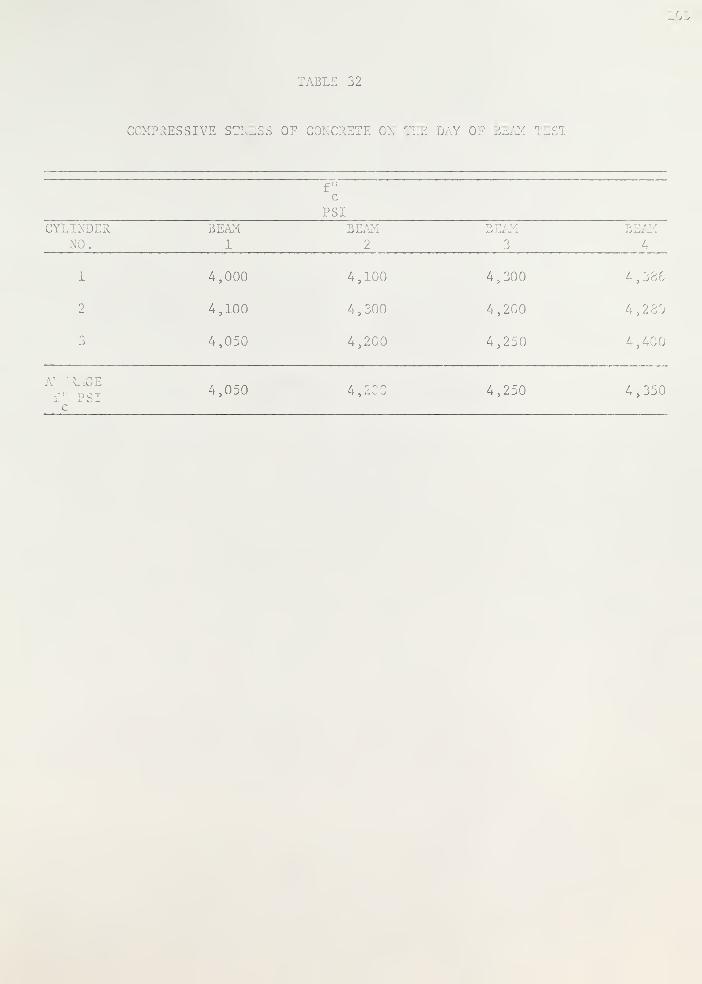
TABLE 32
..-'RESSIVE STRESS OF CONCRETE ON THE DAY OF BEAM TEST
f"c
PSICYLIN.
NO.
BEAMjL 2 3 L
1
2
3
.
i
c
4,000
4,100
4,050
4,050
4,100
4,300
4,200
-'. ,2
4,300
4,200
4,250
4,250
4,2W
4,400
4,350
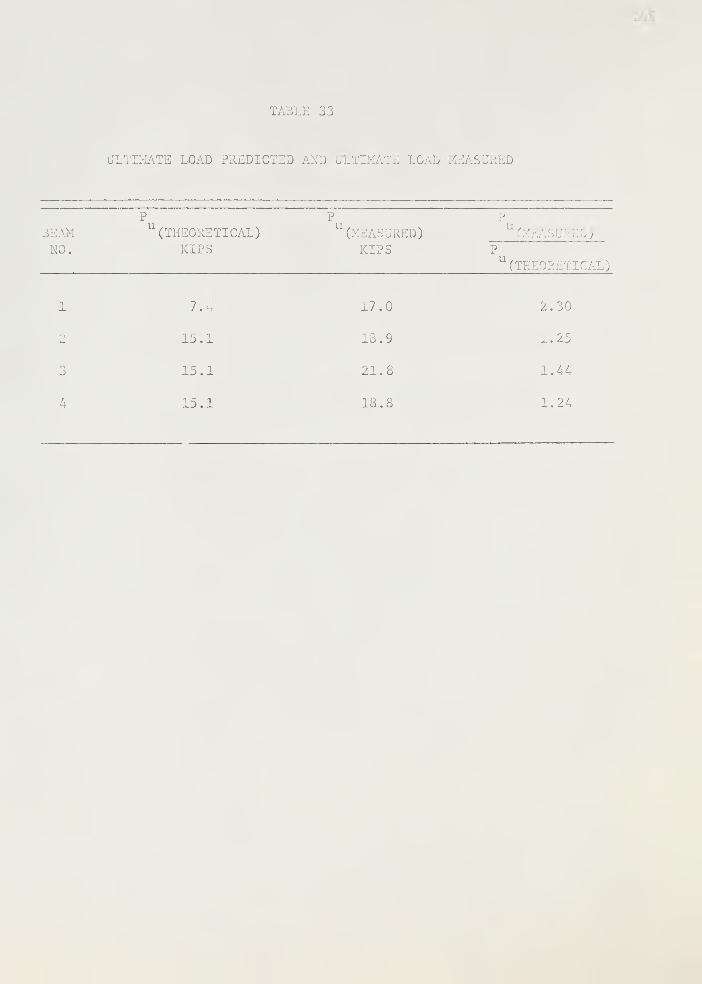
TABLE 33
ULTIMATE LOAD PREDICTED AND ULTIMATE LOAD . ..tED
P
"(THEORETICAL)KIPS
PU(MEASURED)KIPS P
1 7 . , 17.0 2.30
2 15.1 18.9 1.25
3 15.1 21.8 1
.
1 !
4 15.1 18.8 1.24

APPENDIX III
DATA REDUCTION
BEAM #1
where f"c
f" = 4.05 ksic
compressive stress of concrete based on cylinder
test on the day of the beam test.
a = E e = 1000 f" eX C X ex
where a = longitudinal stress
E = modulus of elasticity of concretec
e = longitudinal unit strainx
E = 4.05 x 10⁶
c
a [experimental] = 4.05 x 10 ex x
Ma
r[theoretical] = —
where M = moment at the point
Z = section modulus
M = y x 18.5 [for strain gage #1 glued at 18.5"
from support on top surface of
solid beam]
E = 29 x 10 psis
E = 4.05 x 10⁶osi
c
29
4.05= 7.15

108
A 1 = 0.88 in.
A = 9 x 4.5 + (n-l)(A'+A )s s
= 40.5 + 6.16 x 2.2
A y [uncrackcd] = 9 x 4.5 x 4.5
+ (n-l)A x 8 + (n-l)A' x 1s s
y = 4.68 in. from top 7h
1 , J ? \ A = 1.32 in .
I = ~ (9) 4.5 + 9 x 4.5(4.68-4.5) V s
+ (n-l)A (8-4. 68)2+ (n-l)A' (4.68-1)
2
s s
I = 437.62 in.4
„ /or 18.5 x 4.68 ,ax
= P/2[437.62 ]
= -0.099 P psi
where P is the load applied in lbs.
For strain gage //2 at midpoint of top chord the direct force in the
chord is given by Eq. (1) as:
P 1F = £ x 16.5 x =
2 6
= 1.375 P
Fa = — [since midpoint of chords is point ofX JTi.
contraflexure and thus has only direct force
F and no moment]
A = 4.5 x 3 + (n-l)(2.64)
= 29.71 in.2
1.375a = x P
29.71
= -0.0463 P

G =2(l+p)
where G = modulus of ridigity
\i = Poisson's ratio = 0.15 (assumed)
r 4.05 x 10⁶
6G = —X : r-r— = 1.76 X 10 DS1
2 x 1.15
x =y G = 1.76 x 10 yxy xy xy
where t = shear stressxy
Y = unit shear strainxy
BEAM #2
f"c
= 4200 psi
E =
n =
4.2 x 10 psi
,629 x 10
4.2 x 10(
= 6.9
A =
o =
29.1 in.
1.375x 29.1
P =-0.0472 P
BEAM #3
., 4.2 x 10 . Q0 _ n 6G = r—
r
= 1.83 x 10
f" = 4250 psic r
E = 4.25 x 10⁶
psic r
n = 6.82
A = 28.9 in.2
G = 1.85 x 10 psi

110
BEAM #4
f" = 4350 psic '
E « A. 35 x 106
psic '
n = 6.66
A = 28.5 in.2
aX
= 1.37528.5
P -P =-0.0482 P
G = 1.89 x 10⁶
psi
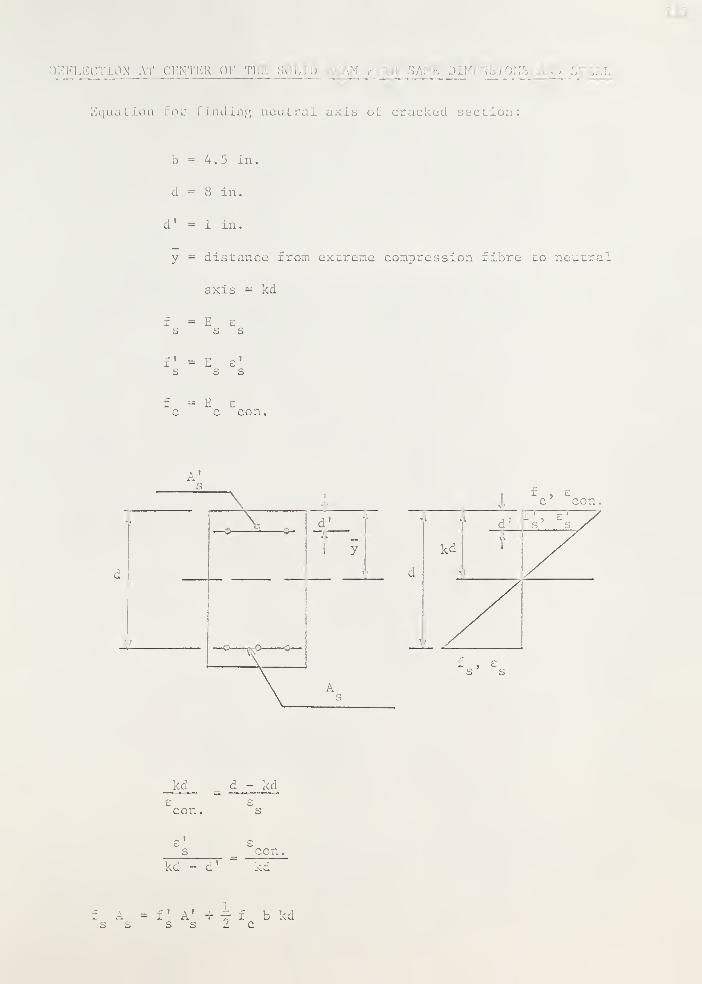
. , C m ER OF Tl I OL i
. ,I S
' E D]
i Lion for finding neutral axis of cracked section
111
b =
d =
d' =
y =
f =
fs
t =
4.5 in.
in.
1 in.
distance from extreme compression fibre to neutral
axis = kd
E es s
E e's s
E cc con.
kd d - kd
con.
on.kd - d'
: A = f ' A' + -=•• f bkdS S S S AC
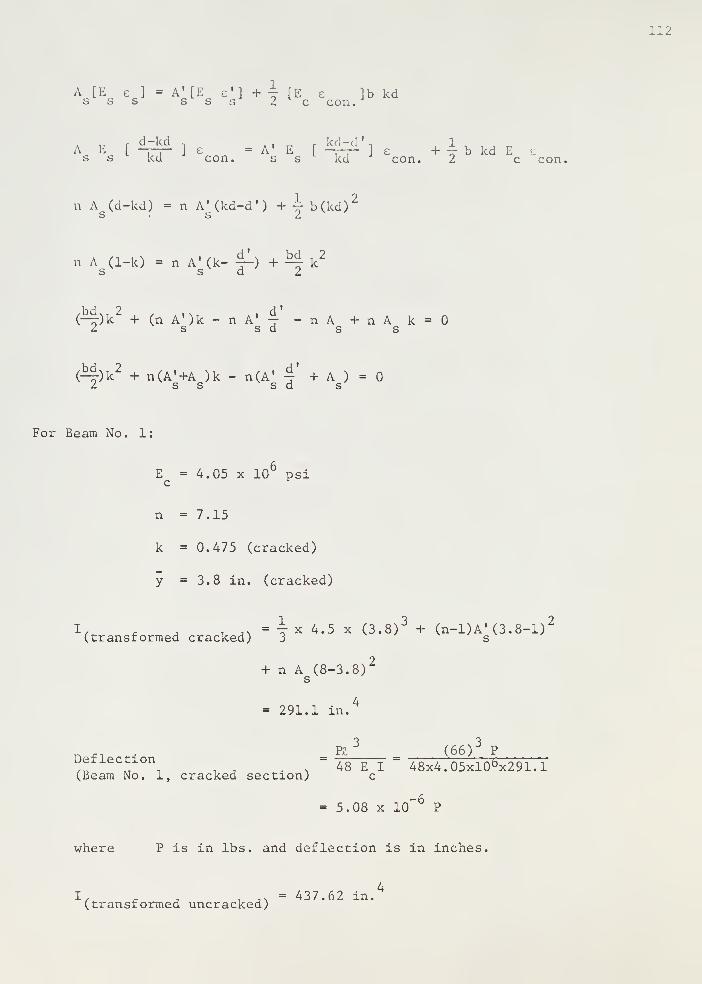
112
A [E el = A'[E e'] +i [E e ]b kdsss sss 2c con.
A E [^ j e = a- E [Mzl'] e 4bkdEe
s s kd con. s s kd con. I c con,
n A (d-kd) = n A' (kd-d') + \ b(kd)2
n A (1-k) = n A' (k- ^-) + ^ k2
s s d 2
(-r-)k + (nA')k-nA' 7 - n A + n A k =2 s s d s s
(-^-)k2+ n(A'+A )k - n(A' 4' + A ) =
I s s s d s
For Beam No. 1:
E = 4.05 x 10⁶
psic r
n =7.15
k = 0.475 (cracked)
y =3.8 in. (cracked)
I,«. * A , ^ = ^ x 4.5 x (3.8)3+ (n-l)A'(3.8-l)
2
(transformed cracked) 3 s
+ n A (8-3. 8)2
s
= 291.1 in.4
Deflection(Beam No. 1, cracked section)
where P is in lbs. and deflection is in inches.
4I, _ , , , N 437.62 in.(transformed uncracked)
H 3
48 E Ic
(66)3
P
48x4.05xlO b>:291.,1
_ 5.08 X io-6
P

n ri . (66)J
PI Lection = —am No.l, uncracked section) 48x4.05x10 x437.62
= 3.38 x 10~ 6P
For Beam No. 2
E = 4.2 x 10⁶
psi
n - 6.9
k = 0.429 (cracked)
y =3.43 in. (cracked)
I, , , . ,. - 281.9 in.4
(transformed cracked)
1. . , . , N= 430.24 in.
4
(transrormed uncracked)
Deflection = 5.06 x 10~ 6P
(cracked)
-6Deflection = 3.3 x 10 P
(uncracked)
For Beam No. 3
E = 4.25 x 10⁶
psic
n =6.82
k =0.417 (cracked)
y =3.34 in, (cracked)
4I. c , t j\ ~ 280 in.(transformed cracked)
4I, c ,
i j\ = 427.37 in.(transformed uncracked)
Deflection =5.04 x 10⁶
?
(cracked)
Def lee(uncracked)
Deflection = 3.3 x 10 ° ?

, i No. k
]: - 4.35 x 10 ii
c
n =6.66
k = 0.428 (cracked)
y = 3.42 in. (cracked)
\ f _p , . ,v = 274.2 in.(transformed cracked)
41/ c , , jx = 421.37 in.(transformed uncracked)
Deflection = 5.02 x 10 ° ?
(cracked)
Def lectio:(uncracked)Deflection = 3.27 x 10
6?
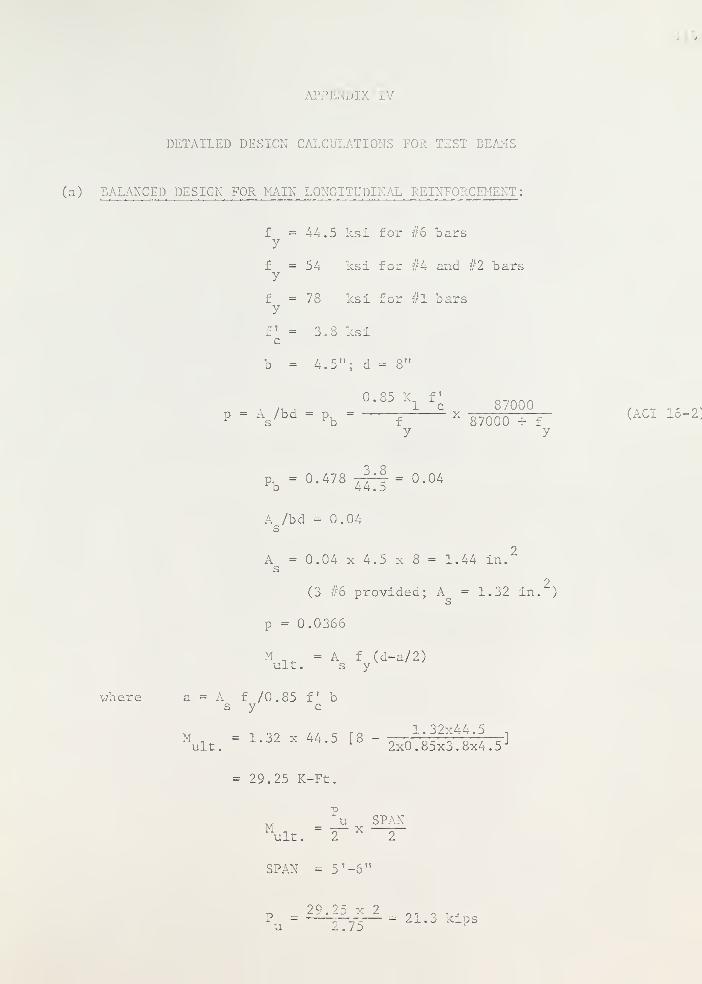
>
APPENDIX IV
AILED DESIGN CALCULATIONS FOR TEST E.
(a) BALANCED DESIGN FOR MAIN LONGITUDINAL REINFORCED
.
f =44.5 ksi for #6 barsy
f = 54 ksi for #4 and #2 barsy
f = 78 ksi for #1 barsy
c
b = 4.5": d = 8'
^ h.;Q ' 85 K
lfc 87000 ,.._ ., .,
p = Wba = pb= -
fx
87000 + f(AC, 16-2.
p, = 0.478 t^-| - 0.04b 44.5
A /bd = 0.04s
A = 0.04 x 4.5 x 8 = 1.44 in.2
s
(3 #6 provided; A = 1.32 in.2
)
p = 0.0366
M = A f (d-a/2)ult. s y
where a = A f /0.85 f bs y c
M . = 1.32 x 44.5 [8 - . ^'J^t' 5, e lult. 2x0.85xJ.8x4.5
= 29.25 K-Ft.
ju SPANult. ~
2X
2
SPAN = 5' -6"
29.25 x 2p = _—__— - 21.3 kipsu z.7o
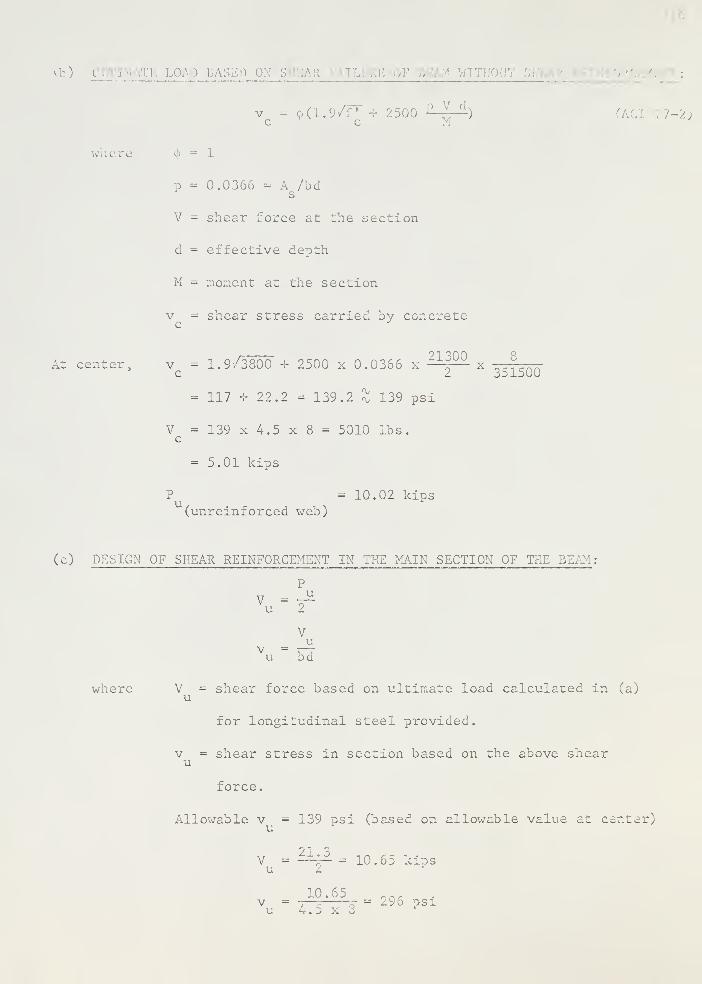
I!
I ON Si,. OF B SHKAP
vc
= tKl.9/F"+ 2500 P^
d) L7-2)
where \ = 1
p = 0.0366 = A /bds
V = shear force at the section
d = effective depth
M = moment at the section
v = shear stress carried by concretec J
At center, v = 1.9/380C + 2500 x 0.0366 x21^°° x
c 2
= 117 + 22.2 = 139.2 X 139 psi
V =139x4.5x8= 5010 lbs.c
=5.01 kips
P =10.02 kips(unreinforced web)
(c) DESIGN OF SHEAR REINFORCEMENT IN THE MAIN SECTION OF THE BEAM:
351500
p
V =u
u 2
Vu
v = - —
u bd
where V = shear force based on ultimate load calculated in (a)u
for longitudinal steel provided.
v = shear stress in section based on the above shearu
force.
Allowable v = 139 psi (based on allowable value at center)u
V = QA = 10.65 kipsu 2
10 .65 on ,v = 7—^ 5- = z9o psiu 4.D x o
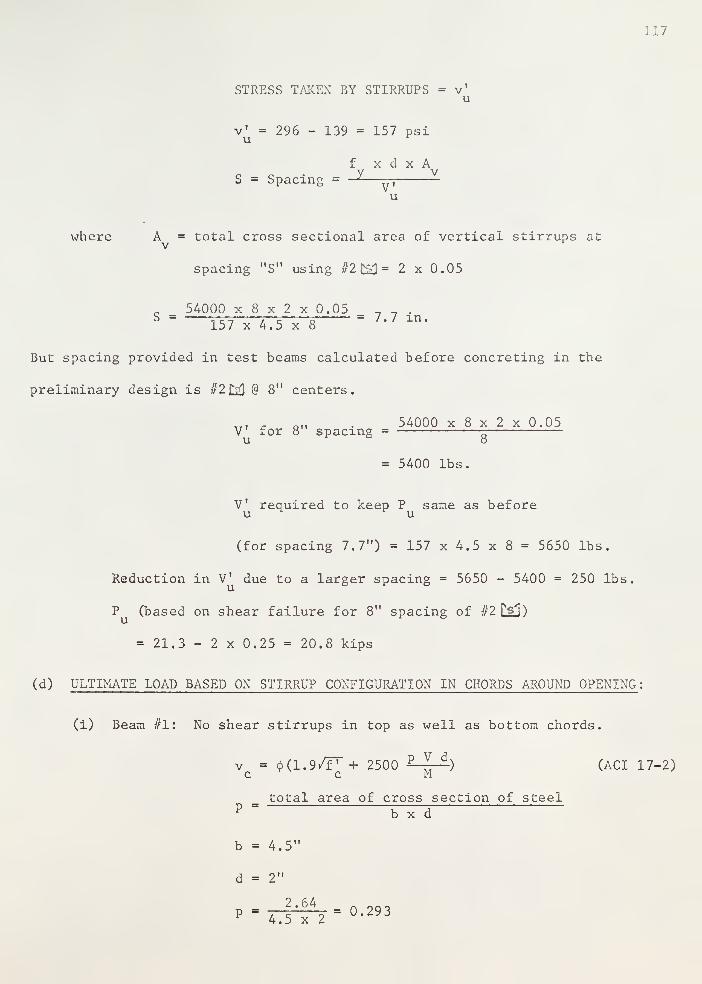
117
STRESS TAKEN BY STIRRUPS = v'u
v' = 296 - 139 = 157 psi
f x d x AS = Spacing = -2—
—
u
where A = total cross sectional area of vertical stirrups atv
spacing "S" using #2tS3= 2 x 0.05
54000 x 8 x 2 x 0.05 n n .
b = r-r-= r = /. / in.157 x 4.5 x 8
But spacing provided in test beams calculated before concreting in the
preliminary design is #2££3 @ 8" centers.
„, £ OII . 54000 x 8 x 2 x 0.05V for 8 spacing = 5U o
= 5400 lbs.
V' required to keep P same as beforeu u
(for spacing 7.7") = 157 x 4.5 x 8 = 5650 lbs.
Reduction in V' due to a larger spacing = 5650 - 5400 = 250 lbs.
P (based on shear failure for 8" spacing of //2 £§3)
= 21.3 - 2 x 0.25 = 20.8 kips
(d) ULTIMATE LOAD BASED ON STIRRUP CONFIGURATION IN CHORDS AROUND OPENING :
(i) Beam //l: No shear stirrups in top as well as bottom chords.
v = *(1.9/fT + 2500 p3
d) (ACI 17-2)
c c M
total area of cross section of steelp =
blTd
b = 4.5"
d = 2"
2.64 _ on „p = -7—e o = 0.293
4.5 x 2
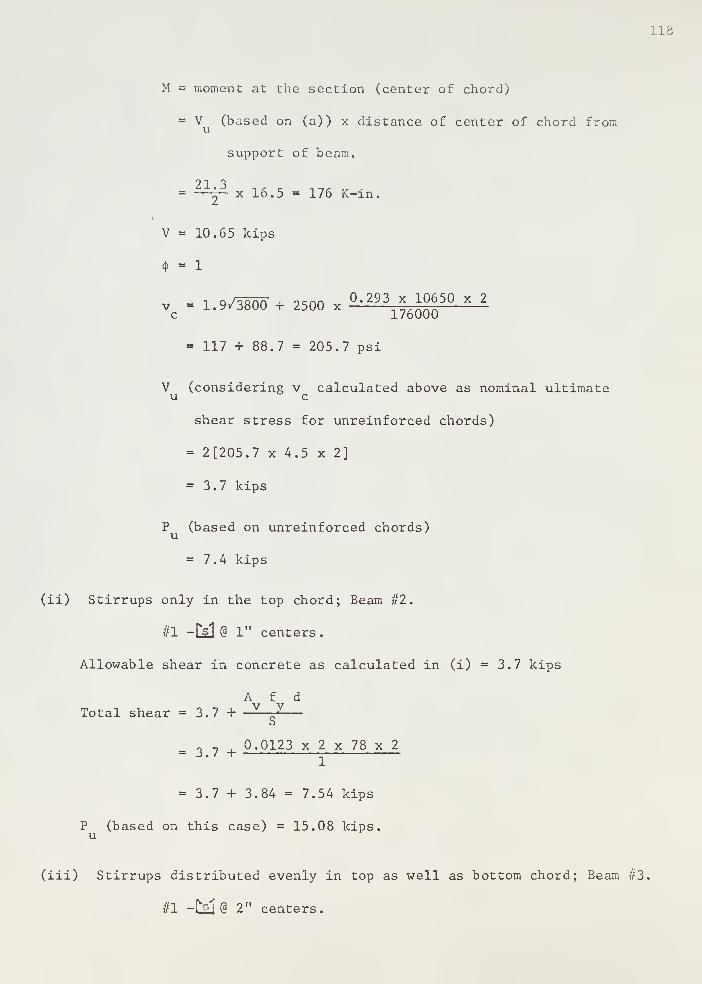
118
M = moment at the section (center of chord)
= V (based on (a)) x distance of center of chord from
support of beam.
21 3= ±±l± x 16.5 = 176 K-in.
V = 10.65 kips
<j> = 1
v = 1.9/3800 + 2500 x°' 293 * ™* 50 x 2
c 176000
= 117 + 88.7 = 205.7 psi
V (considering v calculated above as nominal ultimateu c
shear stress for unreinforced chords)
= 2[205.7 x 4.5 x 2]
= 3.7 kips
P (based on unreinforced chords)
= 7.4 kips
(ii) Stirrups only in the top chord; Beam #2.
#1 -D£l @ 1" centers.
Allowable shear in concrete as calculated in (i) = 3.7 kips
A f d
Total shear = 3.7 + V J—
.37+ 0-0123 x 2 x 78 x 2
= 3.7 + 3.84 = 7.54 kips
P (based on this case) = 15.08 kips,u
(iii) Stirrups distributed evenly in top as well as bottom chord; Beam #3,
#1 -t£l@ 2" centers.

119
(iv) Beam //3
//l -C2Q @ 1.5" centers in the top chord.
//I — L^J @ 3" centers in the bottom chord.
(e) DESIGN OF LONGITUDINAL REINFORCEMENT IN THE CHORD :
Moment of midspan of the top chord
P
= M . , = -r— x distance from end supportmidspan 2
P
Reaction at end support = V = -r—u 2
[P as calculated in (a)]u
™ 21.3 16.5n
. , c v _.M, . , s = —=— x = 14.65 K-Ft.(midspan) 2 12
Ma • n c u j t.
(midspan)Axial force in chords = F = c
t
where t = lever arm between C and T as shown in Fig. 1.
F =14 - 65
.x 12
= 29.3 K6
VMoment at throat section = M , = V x 7—
throat u 2
where V = shear force as calculated in (a)u
V = length of the chord
M,„, „v = Or- x 7.5 = 80 K-in.(throat) 2
Design top chord for
M = 80 K-in.
F = -29.3 kips
Pb
= 0.85 f b 1 (ACI 19-1)
where P = axial load capacity at balanced conditions.
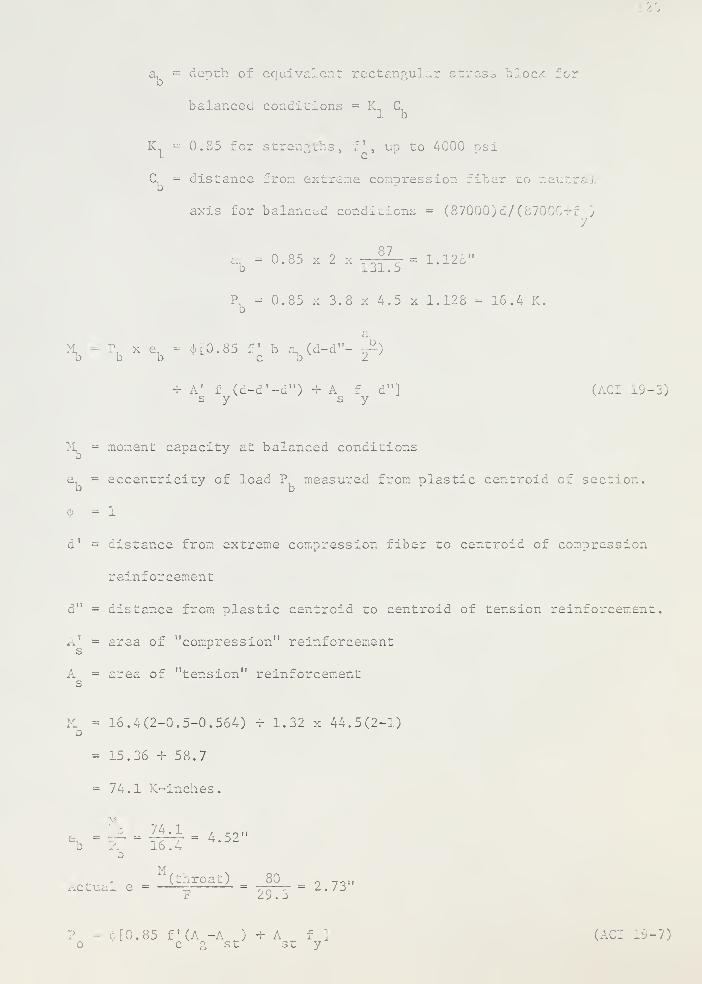
a, = depth of equia t rectangular stress bloi
balanced conditions = K_ C,1 D
K =0.85 for strengths, f, up to 4000 psi
(1 = distance from extreme compression fiber to no
axis for balanced conditions = (87000) d/ (87000-rJ)
y
a^ = 0.85 x 2 x _ _?7C = 1.128"
b L 31 .
5
Pu = 0.85 x 3.8 x 4.5 x 1.128 = 16.4 K.b
a,
M, = P. x e. =(J)[0.85 f ' b a (d-d"- ~)
d b b co 2
+ A' f (d-d'-d") + A f d"] (ACI 19-3)s y s y
= moment capacity at balanced conditionso
e, = eccentricity of load P, measured from plastic centroid of section,b b
<j> = 1
d' = distance from extreme compression fiber to centroid of compression
reinforcement
d" = distance from plastic centroid to centroid of tension reinforcement.
A' = area of "compression" reinforcement
A = area of "tension" reinforcements
M. = 16.4(2-0.5-0.564) + 1.32 x 44.5(2-1)D
= 15.36 4- 58.7
= 74.1 K-inches.
e = A = .Z4 - 1 = a 59"e
b 16.4*- D ~
b
Actual e =M(throat) = 80^_ = ljyxF 29 . j
P = 4>[0.85 f'(A -A J + A f ] I 19-7)o c g st st y
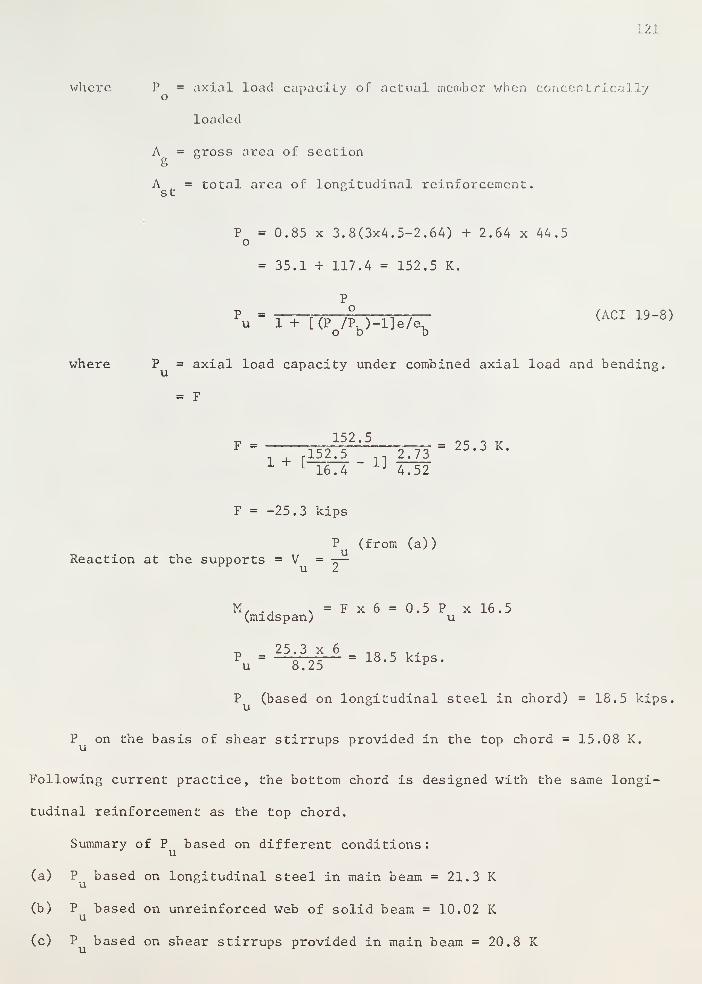
121
where P = axial load capacity of actual member v/hen concentrically
loaded
A = gross area of sectiong
A = total area of longitudinal reinforcement.st &
P = 0.85 x 3.8(3x4.5-2.64) + 2.64 x 44.5o
= 35.1 + 117.4 = 152.5 K.
P
Pu - l+ [(W -l]e/e.
<ACI 19 "8 >
O D D
where P = axial load capacity under combined axial load and bending.
= F
152 5
f152.5 , 2.73 * '
1 L 16.4 " 1J 4.52
F = -25.3 kips
P (from (a))Reaction at the supports = V = -r—
u 2
M, . , . = F x 6 = 0.5 P x 16.5(midspan) u
-. 25.3 x 6 t o c i•
Pu
=8.25
= 18 ' 5 kipS '
P (based on longitudinal steel in chord) = 18.5 kips
P on the basis of shear stirrups provided in the top chord = 15.08 K.
Following current practice, the bottom chord is designed with the same longi-
tudinal reinforcement as the top chord.
Summary of P based on different conditions
:
(a) P based on longitudinal steel in main beam = 21.3 Ku
(b) P based on unreinforced web of solid beam = 10.02 K
(c) P based on shear stirrups provided in main beam = 20.8 K
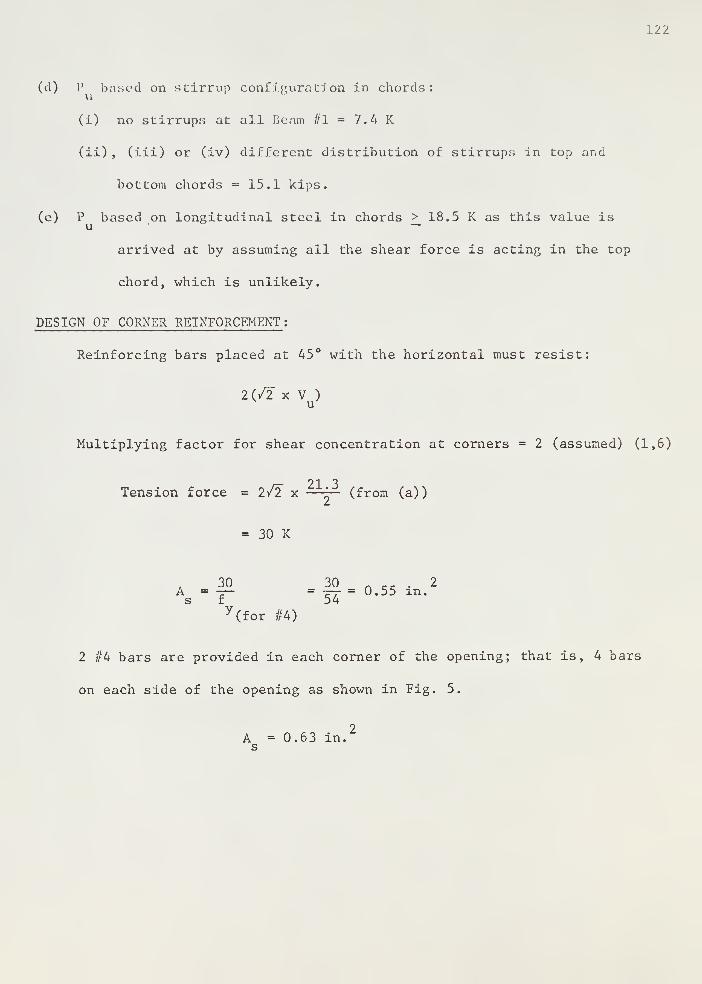
122
(d) P based on stirrup configuration in chords:u
(i) no stirrups at all Beam //l = 7.4 K
(ii) , (iii) or (iv) different distribution of stirrups in top and
bottom chords = 15.1 kips.
(e) P based on longitudinal steel in chords > 18.5 K as this value isu —
arrived at by assuming all the shear force is acting in the top
chord, which is unlikely.
DESIGN OF CORNER REINFORCEMENT :
Reinforcing bars placed at 45° with the horizontal must resist:
2(/2 x V )
Multiplying factor for shear concentration at corners = 2 (assumed) (1,6)
91 3Tension force = 2/2 x —^— (from (a))
= 30 K
30 30 n ,, . 2A=-r— =-r-r = 0'55in.s f 54
y (for #4)
2 #4 bars are provided in each corner of the opening; that is, 4 bars
on each side of the opening as shown in Fig. 5.
A - 0.63 in.s

ACKNO . :'S
i .. or expresses his appreciation to Dr. S. E. Swartz, .'.
Pro. D< . rtn ,u of Civil Engineerir. ... ate Unive.
and advice in carrying out this investigation.
are a 1 to Professor V. H. , "augh, under
ose guidance this project was proposed and accepted and to Dr. Jack B.
Blackburn, Head, Department of Civil Engineering, for his continuous encourage-
. t
.
Ap] ' on is also due : Mr. W. M. Johnston for his valuable help
while working in the Applied Mechanics Laboratory, and to the Department of
Lied M v.unics for providing the laboratory facilities.

BI3LI0GRA.
1. I\ irim W. ; Acavalos, A.; R. "Behaviour
e openings in reinj ed concrete beams." A.C.I. Jc>. i7,
p. 25.
2. Lorentsen, Mogens. "Holes in reinforced concrete." BYGGMASTA . .... 41,
No. 7, July 1962, p. 141-152.
3. Ragan, H. S.; V/arwark, J. "Tee members with large openings."Concrete Institute, Journal, August 1967, Vol. 12, No. 14, p.
4. Se; ... E. P. "Reinforcement requirements for girder web openings.". SCE (structural division) June 1964, p. 147.
5. Bower, J. E. "Experimental stresses in wide-flenge beams with holes."ASCE (structural division) October 1966, p. 167.
6. ... W. ; Bysne, J. G. "Stress concentration in concrete." Nature,Vol. 203, Sept. 26, 1964, p. 1374-1375.
7. Kani, G. N. J. "Basic facts concerning shear failure." A.C.I. , Journal,June 1966, p. 675.
8. Saad, S. ; Hendry, A. W. "Stresses in deep beams with a central concen-trated load." Experimental Stress Analysis, Proceedings, Vol. XVIII, No. 1,
p. 192.
9. Arora, J. S. "Experimental stress analysis of an I-beam with rectangularweb cut out." Master's Thesis, Kansas State University, Department of Civil
.^ineering, Manhattan, Kansas, 1967.
10. Guralnick, Sidney A. "Shear strength of reinforced concrete beams."ASCE (structural division), January 1959, p. 1.
11. Building code requirements for reinforced concrete (ACI 318-63) June 1963.

ANALYSIS OF OPENINGS IN REINFORCED CONCRETE BEAMS
by
SURENDAR MOHAN MALHOTRA
B. E. (Honors) Civil Engineering, 1964
Govt. Engineering College, Jabalpur University
Jabalpur, India
AN ABSTRACT OF A MASTER'S THESIS
submitted in partial fulfillment of the
requirements for the degree
MASTER OF SCIENCE
Department of Civil Engineering
KANSAS STATE UNIVERSITY
Manhattan, Kansas
1969

t :sis presents the results of 'perimental stuc
Lforced < ..earns having rectangular openin i
shear reinfor the openings. The beams were loa - 1
a c< • trated load at the center of the clear span.
Longitudinal and shearing strains were me. 1 with electrical resistance
. , which were 45° wire rosettes, bonded to the concrete surf
a
points of the top and bottom chords of the opening. Deflections '.. _a-
sured by using dial gages placed 3" apart at the top and bottom chords and at
the center of the beam.
The experimental results were compared with those calculated on the basis
of Vierendeel panel behavior of the chords at the opening.
The results indicate that the theory assumed for the design of such beams
is valid in general. It was found that the shear stress is greater in the top
chord as compared to the bottom chord although the difference between them is
small. The shear stress ratio of bottom to top ranges between 0.85 to 0.9.
It was also found that the bottom chord deflects more than the top chord
even when they are equally reinforced. The deflected shape of the chords is
an "S" curve with the point of contraf lexure at about the midspan of the
chords as assumed in the Vierendeel Truss theory.
The assumed stress concentration factor of two at the corners appears to
.sonable.