Analysis of Non-Isothermal Reaction Kinetics Part 1. Simple Reactions
19
The r mo ch im i ca A cta, 203 (1992) 93-110 Elsevier Science Publishers B.V., Amsterdam 93 Analysis of non-isothermal reaction kinetics. Part 1. Simple reactions Ravindra K. Agrawal ’ A dvan ce d E ne rg y and M ateri als R e se arch, 13 406 B rz dge pa th Lane , H ouston, TX 7704 1 USA) (Received 12 September 1991) Abstract Owing to the compensation effect , multiple sets of Arrhenius parameters can be obtained from non-isotherma l data. This leads to non-unique results and, hence, to criticisms o f the non-isotherma l methods. In this paper, procedures used to analyze non-isotherm al data in order to obtain reliable Arrhenius parameter s for simple reactions are discussed. The integral method has been found to yield reliable Arrhenius paramete rs from non-isothermal data. Concu rrent use of the integral and the multiple heating-rate methods has been found to be a powerful tool for obtaining reliable results for both the order of reaction and the Arrhenius paramete rs. INTRODUCTION I am honored to participate in an issue dedicat ed to Joe Flynn. It was Flynn’s publications [l] and the late Prof essor H.H.G. Jellinek’s course on poly mer degradation at Clarkson University that triggered my interest in non-isothermal reac tion kinetics. Flynn has worked extensive ly on the kinetics of non-isot hermal reactions (both simple and complex reactions) and was one of the first researchers to identif y the problems of uniquenes s with kinetic parameters obtained from non-iso thermal analysis. Unfortu- nately, the problem of uniquen ess has generally been ignored, resulting in an accumulation of unreliable results. In this paper the reliability of non-isothermal kinetics (in the light of the uniqueness problem) and its application in understanding the behavior of simple reactions are dis- cussed. The non-isothermal kinetics of complex reactions is discussed in the companion paper . Correspondence to: R.K. Agrawal, Process Engineering Department, KT-24, The M.W. Kellogg Co., 601 Jefferso n Avenue, P.O. Box 4557, Houston, TX 77210-4457, USA. Dedicated to Professor Josep h H. Flynn in honour of his 70th birthday. ’ Permanent address: Proc ess Engine ering Department, KT-24, The M.W. Kellogg Co., 601 Jefferson Avenue, P.O. Box 4557, Houston, TX 77210-4557, USA.
-
Upload
clarence-yue -
Category
Documents
-
view
41 -
download
1
description
non isotherm rxns
Transcript of Analysis of Non-Isothermal Reaction Kinetics Part 1. Simple Reactions
7/14/2019 Analysis of Non-Isothermal Reaction Kinetics Part 1. Simple Reactions
http://slidepdf.com/reader/full/analysis-of-non-isothermal-reaction-kinetics-part-1-simple-reactions 1/18
Thermochimica Acta, 203 (1992) 93-110
Elsevier Science Publishers B.V., Amsterdam
93
Analysis of non-isothermal reaction kinetics.
Part 1. Simple reactions
Ravindra K. Agrawal ’
Advanced Energy and M at eri al s Research, 13406 Brzdgepat h Lane, Houston, TX 77041 (USA)
(Received 12 September 1991)
Abstract
Owing to the compensation effect, multiple sets of Arrhenius parameters can be
obtained from non-isothermal data. This leads to non-unique results and, hence, to
criticisms of the non-isothermal methods. In this paper, procedures used to analyze
non-isothermal data in order to obtain reliable Arrhenius parameters for simple reactions
are discussed. The integral method has been found to yield reliable Arrhenius parameters
from non-isothermal data. Concurrent use of the integral and the multiple heating-rate
methods has been found to be a powerful tool for obtaining reliable results for both the
order of reaction and the Arrhenius parameters.
INTRODUCTION
I am honored to participate in an issue dedicated to Joe Flynn. It was
Flynn’s publications [l] and the late Professor H.H.G. Jellinek’s course on
polymer degradation at Clarkson University that triggered my interest in
non-isothermal reaction kinetics. Flynn has worked extensively on the
kinetics of non-isothermal reactions (both simple and complex reactions)
and was one of the first researchers to identify the problems of uniquenesswith kinetic parameters obtained from non-isothermal analysis. Unfortu-
nately, the problem of uniqueness has generally been ignored, resulting in
an accumulation of unreliable results. In this paper the reliability of
non-isothermal kinetics (in the light of the uniqueness problem) and its
application in understanding the behavior of simple reactions are dis-
cussed. The non-isothermal kinetics of complex reactions is discussed inthe companion paper.
Correspondence to: R.K. Agrawal, Process Engineering Department, KT-24, The M.W.
Kellogg Co., 601 Jefferson Avenue, P.O. Box 4557, Houston, TX 77210-4457, USA.
Dedicated to Professor Joseph H. Flynn in honour of his 70th birthday.
’ Permanent address: Process Engineering Department, KT-24, The M.W. Kellogg Co., 601
Jefferson Avenue, P.O. Box 4557, Houston, TX 77210-4557, USA.
0040-6031/92/$05.001992 - Elsevier Science Publishers B.V. All rights reserved
7/14/2019 Analysis of Non-Isothermal Reaction Kinetics Part 1. Simple Reactions
http://slidepdf.com/reader/full/analysis-of-non-isothermal-reaction-kinetics-part-1-simple-reactions 2/18
94 R.K. Agrawal/ Thermochim. Acta 203 (1992) 93 110
Non-isothermal methods generally involve heating the reactant at a
constant rate from ambient temperature to a temperature sufficiently high
so that the reactant undergoes transformation. In theory, all experiments
conducted to measure the Arrhenius parameters are non-isothermal be-
cause they generally involve a change in temperature as a function of time,at least during the initial heating and cooling periods. Non-isothermal
techniques are becoming extremely popular in the study of reaction kinet-
ics. The popularity of non-isothermal methods is due to the fact that both
analytical and kinetic data can be obtained simultaneously from a single
experiment, and in a relatively short period of time. Unfortunately, the
ease with which such data can be obtained has resulted in an increased
volume of data and confusion, rather than an increase in the quality of
research in thermal analysis [l]. Non-isothermal kinetic equations are
mathematically more involved and, consequently, are not without prob-
lems. Several reviews have been published on the techniques used to obtain
Arrhenius parameters from non-isothermal experiments [l-lo].
The studies of Flynn and Wall [l] have indicated a problem of unique-
ness with kinetic parameters from non-isothermal analysis. Unfortunately,
the problem of uniqueness has generally been ignored resulting in unreli-
able results and in criticisms of non-isothermal methods [ll-151. For
example, the reported values of the activation energy for the decomposi-
tion of the simple substance CaCO, range from about 20 to over 300 kcalmol-‘, and the calculated value of the rate constant varies by over three
orders of magnitude [16]. Hence it is not surprising that the usefulness of
Arrhenius parameters obtained from non-isothermal techniques is ques-
tioned. Recently, Boldyreva [12] criticized most of the non-isothermal
kinetic information available in the literature and suggested that such
kinetic information may be meaningless. Although this criticism may be
strong (but not necessarily wrong), it does imply the need to establish a
standard procedure to assure the reliability of kinetic data obtained from
non-isothermal methods.In this paper, the limitations of thermoanalytical devices will be dis-
cussed briefly, followed by a review of the reliability of non-isothermal
kinetics (in the light of the uniqueness problem) and its application in
understanding the behavior of simple reactions. The applications of non-
isothermal techniques to complex reactions such as competitive, multiple
and successive reactions will be dealt with elsewhere [17].
EXPERIMENTAL LIMITATIONS
Experimental techniques such as thermogravimetry (TG) and differential
scanning calorimetry (DSC) are being used increasingly as analytical tools
for the identification and characterization of solid materials, and also for
determining kinetic parameters. To determine reliable kinetic parameters

7/14/2019 Analysis of Non-Isothermal Reaction Kinetics Part 1. Simple Reactions
http://slidepdf.com/reader/full/analysis-of-non-isothermal-reaction-kinetics-part-1-simple-reactions 3/18
R.K. Agr awd / Thermochim. Acta 203 (1992) 93 110 95
from non-isothermal data, variables such as weight (or enthalpy), time and
temperature need to be measured precisely. Although the weight (or
enthalpy) and time can be measured with reasonable accuracy using
modern thermal analysis devices, temperature measurement remains a
serious problem in the case of TG balances [3,18-221. This is because themeasurement of the actual sample temperature in TG is difficult because it
hinders the weighing mechanism. Therefore the thermocouple is not gener-
ally in contact with the sample and careful attention must be given to
temperature measurement. The difference between the measured and the
correct sample temperature may be as high as 45 K (if not more) depending
on the experimental conditions. Although errors due to temperature meas-
urement may be minimized by increasing the reaction temperature range
and/or by placing the thermocouple close to the sample, calibration of the
system under identical experimental conditions is a prerequisite for reliable
results. Agrawal [19] has suggested that a temperature range of at least 70
K is desirable for reducing errors in estimating the Arrhenius parameters.
For a reaction occurring over a temperature range of less than 70 K, errors
due to uncertainties in temperature measurement can be significant. In
such a case, detailed analysis of errors is desirable to reduce the uncer-
tainty in estimated values of the Arrhenius parameters. In most modern
devices, instrumental limitations are “believed” to have been minimized to
yield acceptable data.
KINETIC ANALYSIS OF SIMPLE REACTIONS
For a well-defined set of experimental conditions, the shape of the
non-isothermal curve obtained from thermoanalytical devices reveals the
kinetic nature of the reaction being studied. A simple reaction is repre-
sented as
a --) products
Because the reaction rate is proportional to the amount of reactant a at
any time f, the reaction rate is assumed to be represented by the relation
da/dt = kf( CX) (I)
where (Y represents the conversion of the reactant at time t, f(a) is the
conversion factor of (Y,and k the rate constant. For a true reacting system,
f(a) is a function of time and k is a function of temperature. In condensed
phase studies, cr is generally defined by the relation
a = (I% - lW(I& - 6) (2)
where W is the weight of the sample and the subscripts 0 and f refer to the
values at the beginning and at the end of the weight-loss reaction. cr varies
7/14/2019 Analysis of Non-Isothermal Reaction Kinetics Part 1. Simple Reactions
http://slidepdf.com/reader/full/analysis-of-non-isothermal-reaction-kinetics-part-1-simple-reactions 4/18
96 R.K. Agraw al / Thermochim. Acta 203 (1992) 93-110
from 0 to 1 as the reaction proceeds to completion. The temperature
dependence of the rate constant k is assumed to have the Arrhenius form
k =A exp( -E/RT) (3)
where A is the pre-exponential factor, E the activation energy and R thegas constant. The application of the Arrhenius equation to solid-state
reactions has often been criticized in the literature. The misconceptions in
the use of the Arrhenius equation have been referred to in detail by Flynn
[23] and Agrawal [19,24,25]. For a simple reaction, the Arrhenius equation
is appropriate provided E > 2RT or k <A e-‘. Despite criticism of the
use of the Arrhenius equation, it is perhaps the most widely used equation
and is satisfactory in explaining the temperature dependence of the rate
constant in solid-state decomposition kinetics.
Identifying the orm of f(a) and t he order of react i on
Identifying the correct form of f(a) to be used for kinetic analysis is not
trivial; and identifying the true form of f(a) is critical for obtaining unique
results. The simplest and the most frequently used model for f(a) in the
analysis of non-isothermal data is
f(a) = (1 -a)” (4)where n, in analogy to homogeneous chemical kinetics, is referred to as the
order of reaction. Numerous forms of f(a) have been reported in the
literature for the decomposition of solids [5,26-281. These rate equations
include processes such as chemical decomposition, nuclei growth and
diffusion. The applicability of f(a) expressions used in nuclei growth and
diffusion processes to non-isothermal reactions will be discussed in a
subsequent publication [26]. Rate equations involving multiple use of CYn
the f(a) expression result in non-unique estimates of the kinetic parame-ters and should be avoided.
Although the data can be fitted by more than one form of f(a), the aim
should be to select a model which uses the minimum number of parameters
to fit the data with reasonable accuracy. Some forms of J?(Y) recommended
for determining Arrhenius parameters involve using of reaction of (in order
of preferred sequence) 0, 1, 2 or fractional orders, l/2 or 2/3. Although
other orders of reaction are possible, by using these orders of reactions the
data can be linearized in most cases. For uniqueness of the results, no
more than two parameters should be estimated from a single curve.
Extraction of more parameters may lead to non-unique results which are
meaningless. However if the decomposition products are measured, then
additional parameters may be considered, depending on the accuracy of
the data.
7/14/2019 Analysis of Non-Isothermal Reaction Kinetics Part 1. Simple Reactions
http://slidepdf.com/reader/full/analysis-of-non-isothermal-reaction-kinetics-part-1-simple-reactions 5/18
R.K Agrawd / ~~~r rnoc~~. Acta 203 (1992) 93 110 97
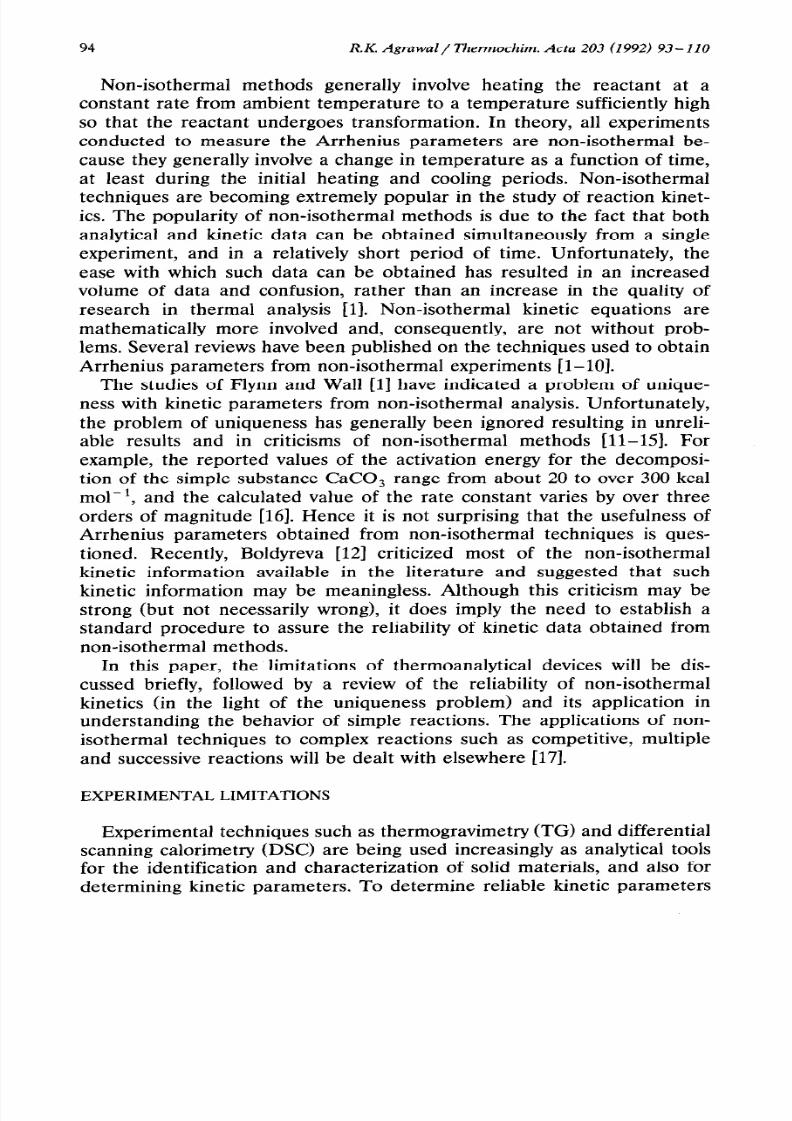
Fig. 1. Normalized weight fraction Cl- (r) as a function of temperature for various orders of
reaction (A ==‘3.6~ U13min-‘, E=4Q.Okcalmol-‘and~=20Kmin-‘).
Figure 1 ~~mrnari~s. ‘&IF nornt;P’iized, residual weight as a function of
temperature fur va4dus orders of reaction. This is the form of data
obtained ,$~CXBIie-l anafysis deviq .and it is difficult to pin down the
reaCtian or&~ based 153a his limited .inform$tion. However, the shape of
the CU~XQ ay be used to obtain preliminary information on the order of
re&tiQn, As the order of reaction increases from 0 to 2, the tail of the
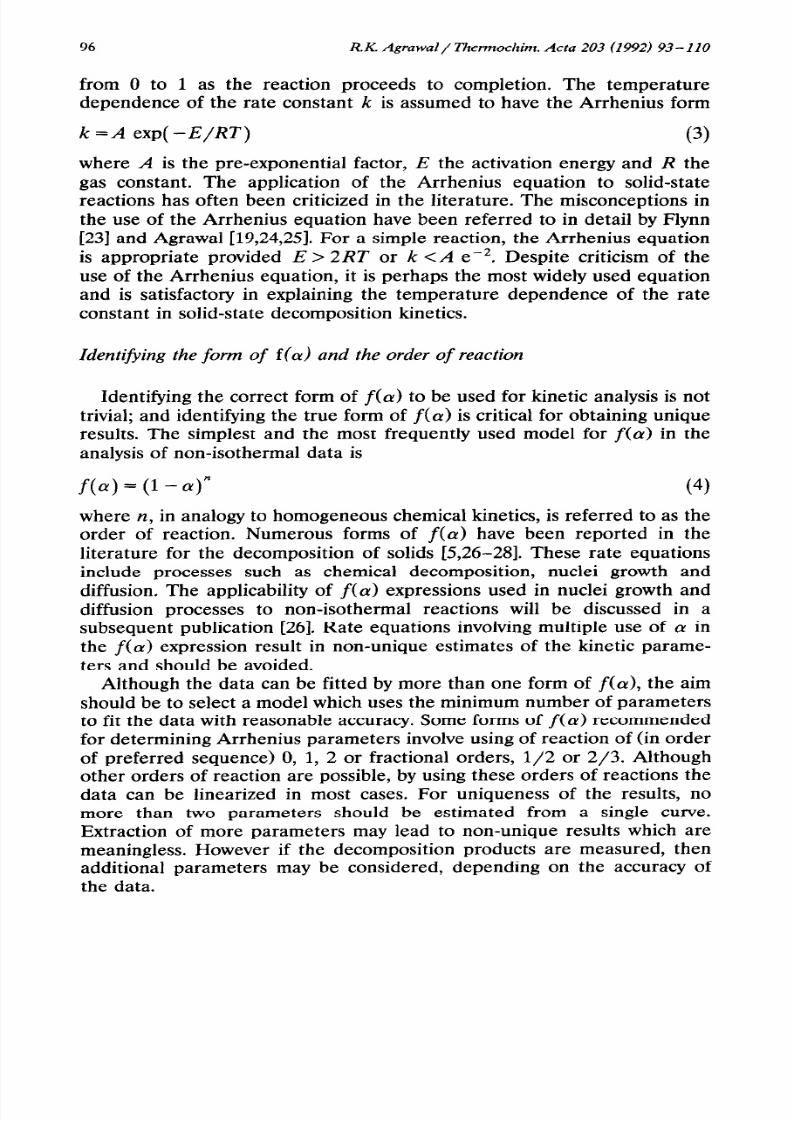
curve increases, Flynn iI1 has shown that the peak width of a plot of
da/dT wainst temperature increases with an increase in the order of
reaction (see Fig. 2). Also the amplitude of the peak decreases with an
increase ia the reaction order. However, because the maxima (in Fig. 2) of
these reactions (with the same Arrhenius parameters) occur in a narrow
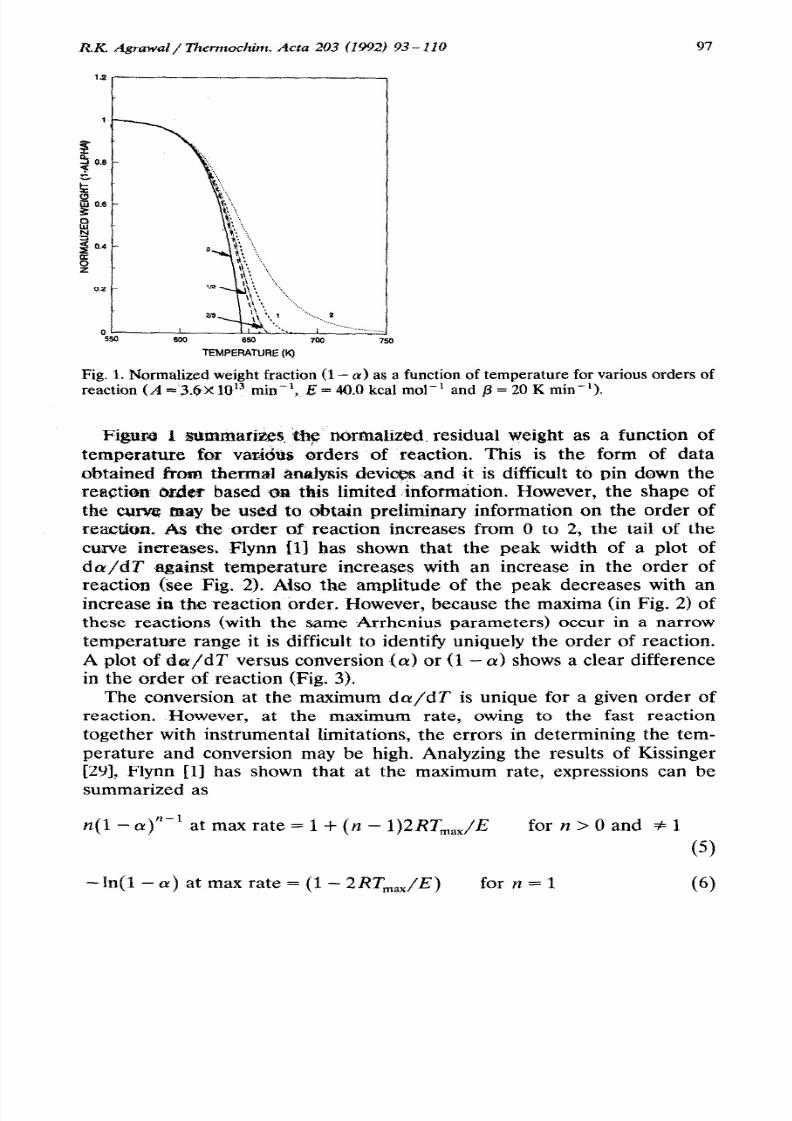
tem~erat~e range it is difficult to identify uniquely the order of reaction+A plot of dtu/dT versus conversion .[cx)or (1 - cr) shows a clear difference
in the order of reaction (Fig. 3).
The conversion at the maximum dar/dT is unique for a given order of
reaction. However, at the maximum rate, owing to the fast reaction
together with instrumental limitations, the errors in determining the tem-
perature and conversion may be high. Analyzing the results of Kissinger
[29], Flynn [ll has shown that at the maximum rate, expressions can besummarized as
41 - a)n-* at max rate = 1 + (II - 1)2RT,,,/E for IZ> 0 and f 1
(5)
-In(l - ty) at max rare = (1 - 2RT,,/E) for n = 1 (6)
7/14/2019 Analysis of Non-Isothermal Reaction Kinetics Part 1. Simple Reactions
http://slidepdf.com/reader/full/analysis-of-non-isothermal-reaction-kinetics-part-1-simple-reactions 6/18
98 R.K. Agrawal/ Thermochim. Acta 203 (1992) 93-110
TEMPERATURE (K)
Fig. 2. Temperature derivative (da/U) as a function of temperature; data are shown in
Fig. 1.
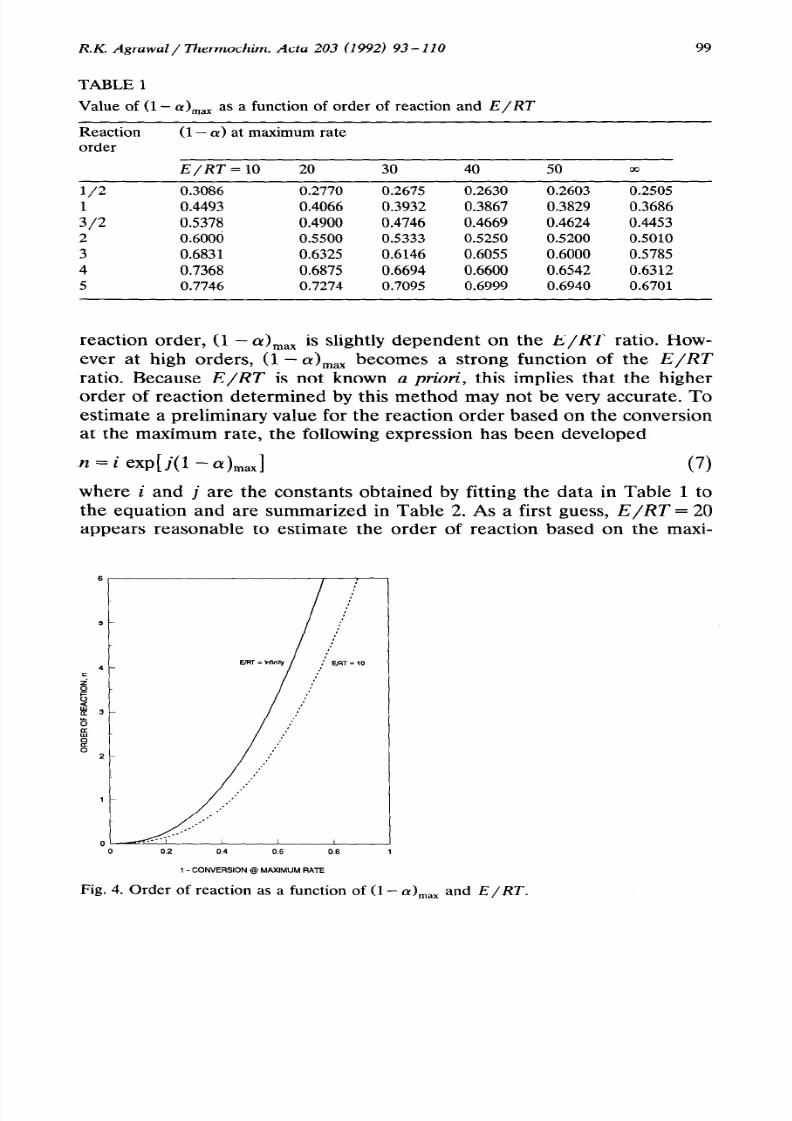
Based on these approximations, Table 1 summarizes the value of (1 - cy),,,
as a function of various orders of reactions and E/RT ratio.
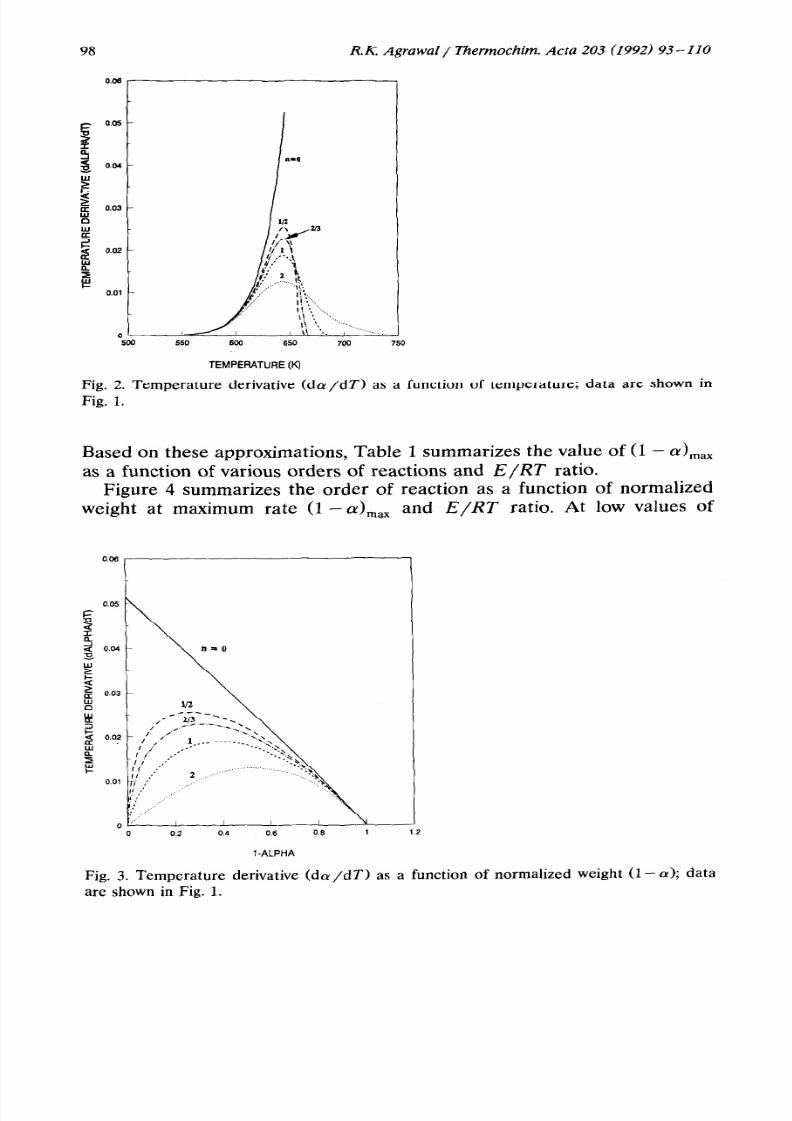
Figure 4 summarizes the order of reaction as a function of normalized
weight at maximum rate (1 - aImax and E/RT ratio. At low values of
i-ALPHA
Fig. 3. Temperature derivative (da/dT) as a function of normalized weight (I- a); data
are shown in Fig. 1.
7/14/2019 Analysis of Non-Isothermal Reaction Kinetics Part 1. Simple Reactions
http://slidepdf.com/reader/full/analysis-of-non-isothermal-reaction-kinetics-part-1-simple-reactions 7/18
R. K. Agrawal / Therrnochim. Acta 203 (1992) 93 110
TABLE 1
Value of Cl- (Y),, as a function of order of reaction and E/RT
Reaction (1 - a) at maximum rate
order
99
E/RT=lO 20 30 40 50 m
l/2 0.3086 0.2770 0.2675 0.2630 0.2603 0.2505
1 0.4493 0.4066 0.3932 0.3867 0.3829 0.3686
3/2 0.5378 0.4900 0.4746 0.4669 0.4624 0.4453
2 0.600d 0.5500 0.5333 0.5250 0.5200 0.5010
3 0.6831 0.6325 0.6146 0.6055 0.6000 0.5785
4 0.7368 0.6875 0.6694 0.6600 0.6542 0.6312
5 0.7746 0.7274 0.7095 0.6999 0.6940 0.6701
reaction order, (1 - (Y),,.,~~s slightly dependent on the E/RT ratio. How-
ever at high orders, (1 - (Y),, becomes a strong function of the E/RT
ratio. Because E/RT is not known a pr ior i , this implies that the higher
order of reaction determined by this method may not be very accurate. To
estimate a preliminary value for the reaction order based on the conversion
at the maximum rate, the following expression has been developed
n = i exp[ j(1 - C-X),,] (7)
where i and j are the constants obtained by fitting the data in Table 1 to
the equation and are summarized in Table 2. As a first guess, E/RT = 20
appears reasonable to estimate the order of reaction based on the maxi-
Fig. 4. Order of reaction as a function of Cl- (Y),.,,,~ nd E/RT.
7/14/2019 Analysis of Non-Isothermal Reaction Kinetics Part 1. Simple Reactions
http://slidepdf.com/reader/full/analysis-of-non-isothermal-reaction-kinetics-part-1-simple-reactions 8/18
100
TABLE 2
Parameters for eqn. (7)
R.K. Agrawal/ Thermochim. Acta 203 (1992) 93- 110
E/RT i j
10 0.1099 4.8789
20 0.1253 5.0486
30 0.1288 5.1457
40 0.1301 5.2053
m 0.1319 5.4213
mum rate. The final
accurate equations.
result can be updated by iterations and using more
Arrhenius parameters from non-isothermal data
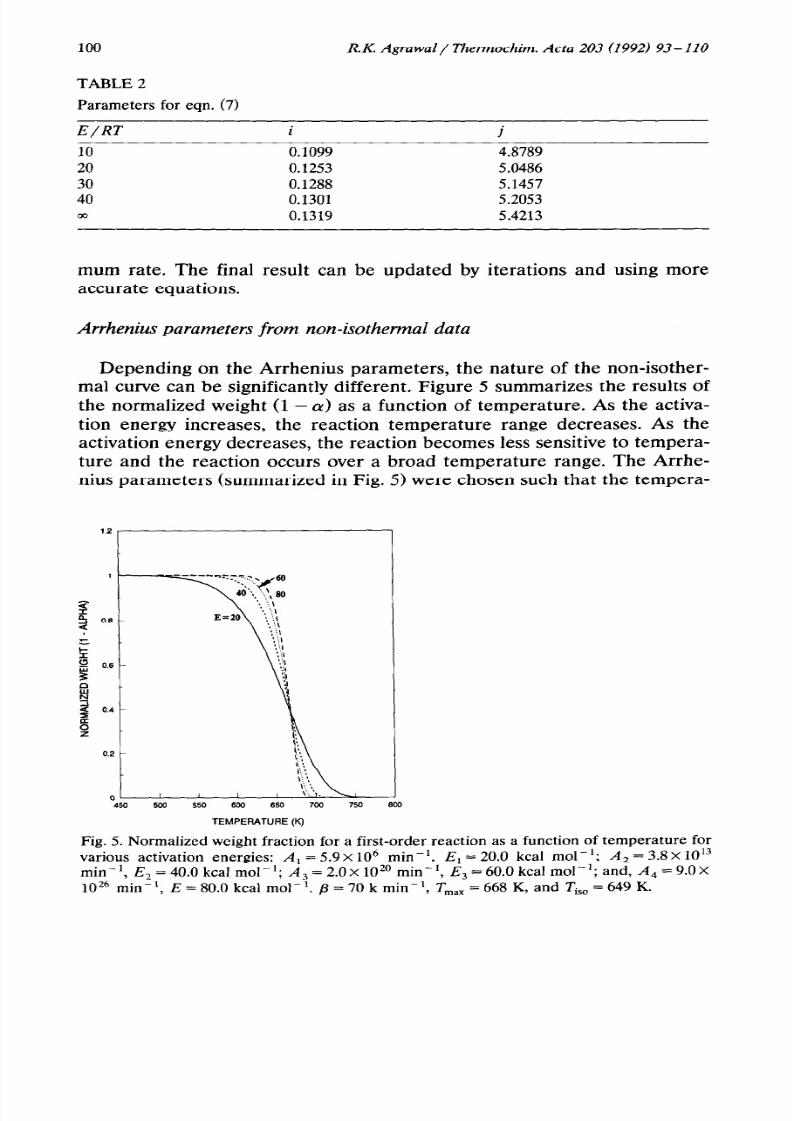
Depending on the Arrhenius parameters, the nature of the non-isother-
mal curve can be significantly different, Figure 5 summarizes the results of
the normalized weight (1 - a> as a function of temperature. As the activa-
tion energy increases, the reaction temperature range decreases. As the
activation energy decreases, the reaction becomes less sensitive to tempera-
ture and the reaction occurs over a broad temperature range. The Arrhe-
nius parameters (summarized in Fig. 5) were chosen such that the tempera-
Fig. 5. Normalized weight fraction for a first-order reaction as a function of temperature for
various activation energies: A, = 5.9~ lo6 min-‘, E, = 20.0 kcal mol-‘; A, = 3.8x 10¹³
min-‘, E, = 40.0 kcal mol-‘; A, = 2.0~ 10” min-‘, E, = 60.0 kcal mol-‘; and, A, = 9.0x
10z6 min-‘, E = 80.0 kcal mol-‘. fi = 70 k min-‘, T,,, = 668 K, and TisO 649 K.
7/14/2019 Analysis of Non-Isothermal Reaction Kinetics Part 1. Simple Reactions
http://slidepdf.com/reader/full/analysis-of-non-isothermal-reaction-kinetics-part-1-simple-reactions 9/18
RX Agrawal/ Thermochim. Acta 203 (1992) 93-110 101
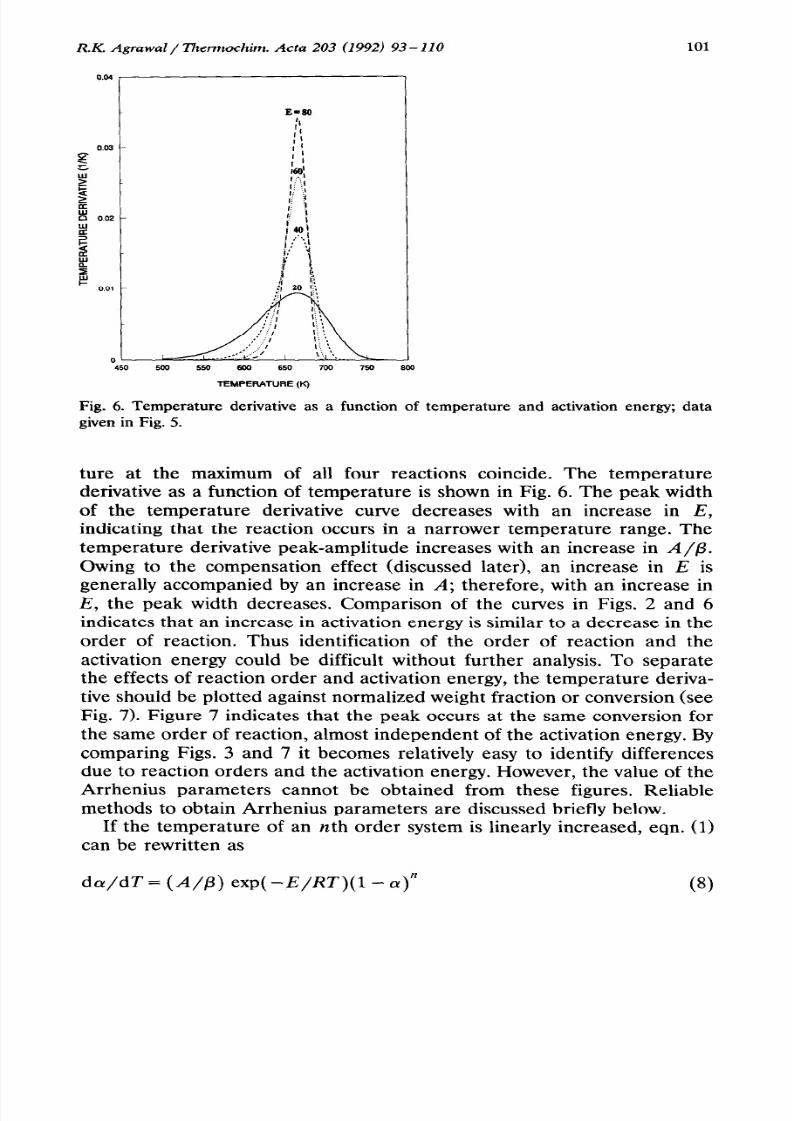
Fig. 6. Temperature derivative as a function of temperature and activation energy; data
given in Fig. 5.
ture at the maximum of all four reactions coincide. The temperature
derivative as a function of temperature is shown in Fig. 6. The peak width
of the temperature derivative curve decreases with an increase in E,
indicating that the reaction occurs in a narrower temperature range. The
temperature derivative peak-amplitude increases with an increase in A/ P.
Owing to the compensation effect (discussed later), an increase in E is
generally accompanied by an increase in A; therefore, with an increase in
E, the peak width decreases. Comparison of the curves in Figs. 2 and 6
indicates that an increase in activation energy is similar to a decrease in the
order of reaction. Thus identification of the order of reaction and theactivation energy could be difficult without further analysis. To separate
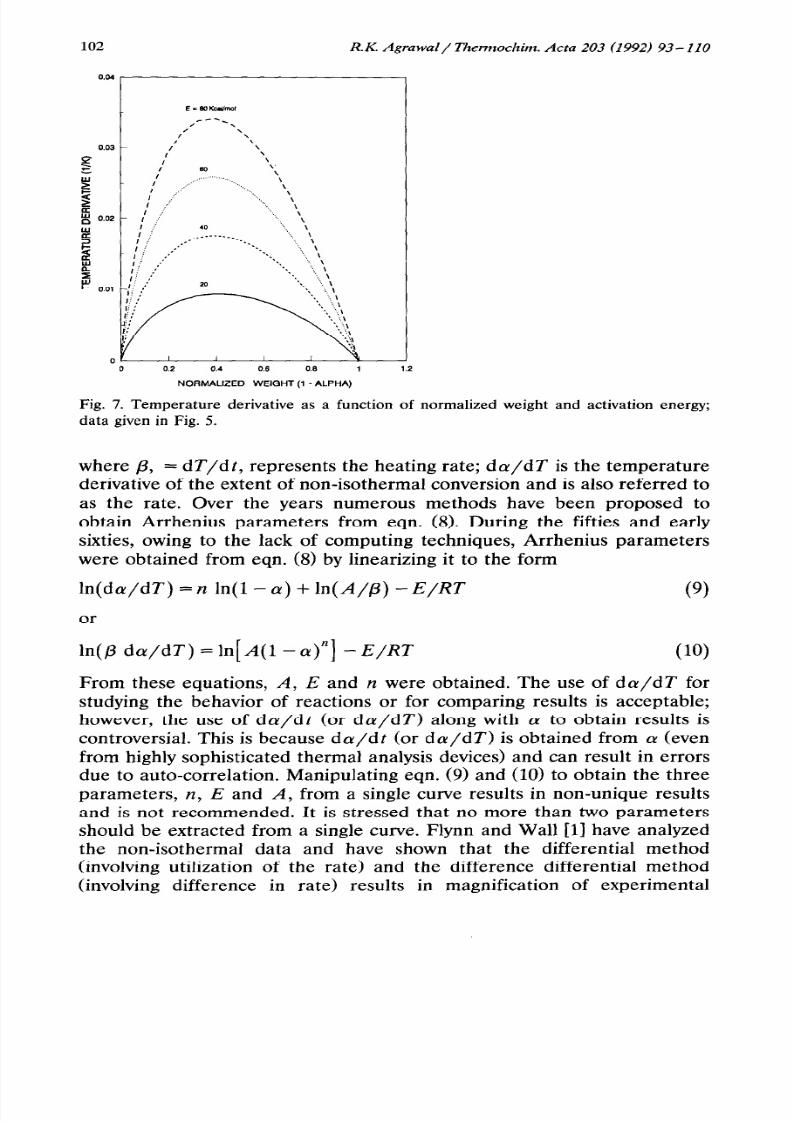
the effects of reaction order and activation energy, the temperature deriva-
tive should be plotted against normalized weight fraction or conversion (see
Fig. 7). Figure 7 indicates that the peak occurs at the same conversion for
the same order of reaction, almost independent of the activation energy. By
comparing Figs. 3 and 7 it becomes relatively easy to identify differences
due to reaction orders and the activation energy. However, the value of the
Arrhenius parameters cannot be obtained from these figures. Reliable
methods to obtain Arrhenius parameters are discussed briefly below.If the temperature of an nth order system is linearly increased, eqn. (1)
can be rewritten as
da/dT = (A / P) exp( -E/RT)(l - a)” (8)
7/14/2019 Analysis of Non-Isothermal Reaction Kinetics Part 1. Simple Reactions
http://slidepdf.com/reader/full/analysis-of-non-isothermal-reaction-kinetics-part-1-simple-reactions 10/18
102 R.K. Agrawal/ Thermochim. Acta 203 (1992) 93- I I 0
2
NORMALIZED WEIGHT (1 -ALPHA)
Fig. 7. Temperature derivative as a function of normalized weight and activation energy;
data given in Fig. 5.
where /I, = dT/dt, represents the heating rate; da/dT is the temperature
derivative of the extent of non-isothermal conversion and is also referred toas the rate. Over the years numerous methods have been proposed to
obtain Arrhenius parameters from eqn. (8). During the fifties and early
sixties, owing to the lack of computing techniques, Arrhenius parameters
were obtained from eqn. (8) by linearizing it to the form
ln(da/dT) = 12 n(1 - a) + ln(A/p) - E/RT
or
(9)
ln(P da/dT) = ln[ A(1 -a)“] - E/RT (10)
From these equations, A, E and n were obtained. The use of da/dT for
studying the behavior of reactions or for comparing results is acceptable;
however, the use of da/dt (or da/dT) along with (Y to obtain results is
controversial. This is because dcu/dt (or da/dT) is obtained from (Y even
from highly sophisticated thermal analysis devices) and can result in errors
due to auto-correlation. Manipulating eqn. (9) and (10) to obtain the three
parameters, n, E and A, from a single curve results in non-unique results
and is not recommended. It is stressed that no more than two parameters
should be extracted from a single curve. Flynn and Wall [ll have analyzed
the non-isothermal data and have shown that the differential method
(involving utilization of the rate) and the difference differential method
(involving difference in rate) results in magnification of experimental
7/14/2019 Analysis of Non-Isothermal Reaction Kinetics Part 1. Simple Reactions
http://slidepdf.com/reader/full/analysis-of-non-isothermal-reaction-kinetics-part-1-simple-reactions 11/18
R.K. Agrawal / Thermochim. Acta 203 (I 992) 93 110 103
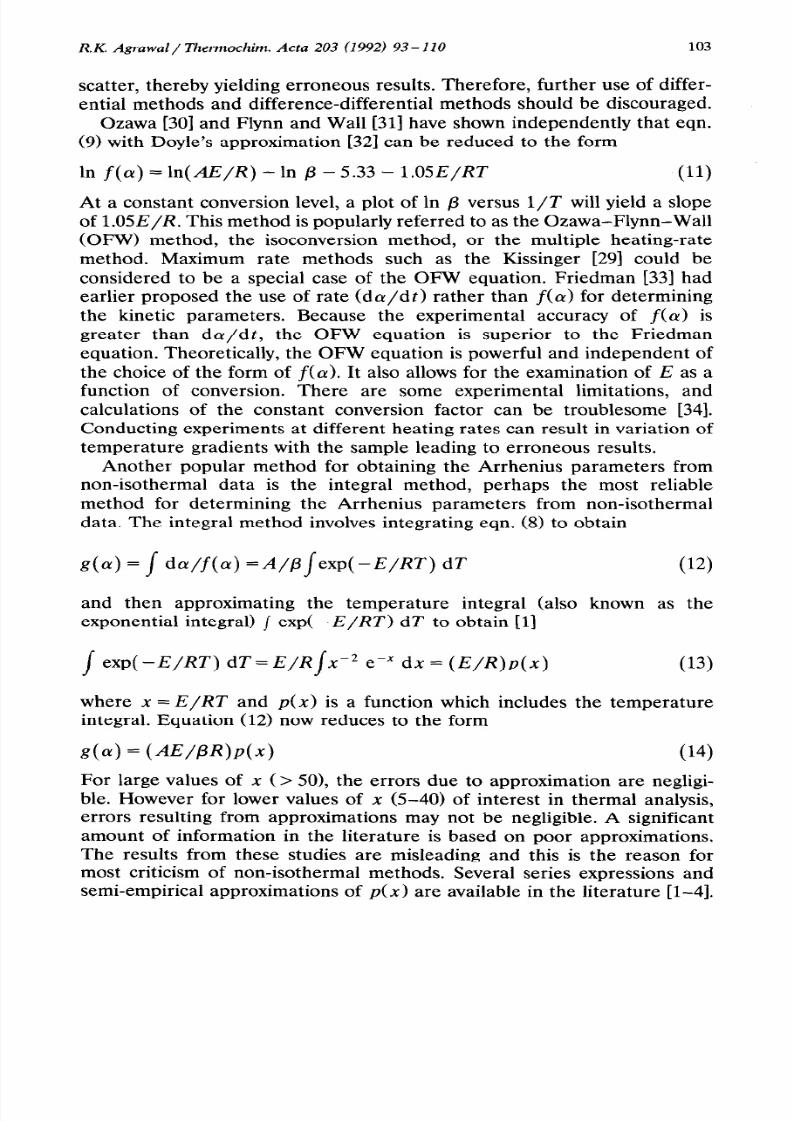
scatter, thereby yielding erroneous results. Therefore, further use of differ-
ential methods and difference-differential methods should be discouraged.
Ozawa [30] and Flynn and Wall [31] have shown independently that eqn.
(9) with Doyle’s approximation [32] can be reduced to the form
In f( CK) ln( AE/R) - In /3 - 5.33 - 1 .OSE/RT (11)
At a constant conversion level, a plot of In p versus l/T will yield a slope
of l.O5E/R. This method is popularly referred to as the Ozawa-Flynn-Wall
(OFW) method, the isoconversion method, or the multiple heating-rate
method. Maximum rate methods such as the Kissinger [29] could be
considered to be a special case of the OFW equation. Friedman [33] had
earlier proposed the use of rate (da/dt) rather than f(a) for determining
the kinetic parameters. Because the experimental accuracy of f(a) isgreater than da/dt, the OFW equation is superior to the Friedman
equation. Theoretically, the OFW equation is powerful and independent of
the choice of the form of f(a). It also allows for the examination of E as a
function of conversion. There are some experimental limitations, and
calculations of the constant conversion factor can be troublesome [34].
Conducting experiments at different heating rates can result in variation of
temperature gradients with the sample leading to erroneous results.
Another popular method for obtaining the Arrhenius parameters from
non-isothermal data is the integral method, perhaps the most reliablemethod for determining the Arrhenius parameters from non-isothermal
data. The integral method involves integrating eqn. (8) to obtain
g(a) = / da/f(a) =A/P/exp( -E/RT) dT (14
and then approximating the temperature integral (also known as the
exponential integral) / exp( -E/RT) dT to obtain [l]
/ exp( -E/RT) dT = E/Rlxd2 epX dx = (E/R)p( x) (13)
where x = E/RT and p(x) is a function which includes the temperature
integral. Equation (12) now reduces to the form
g(a) = (AE/PR)P(x) (14)
For large values of x (> 501, the errors due to approximation are negligi-
ble. However for lower values of x (5-40) of interest in thermal analysis,errors resulting from approximations may not be negligible. A significant
amount of information in the literature is based on poor approximations.
The results from these studies are misleading and this is the reason for
most criticism of non-isothermal methods. Several series expressions and
semi-empirical approximations of p(x) are available in the literature [l-4].
7/14/2019 Analysis of Non-Isothermal Reaction Kinetics Part 1. Simple Reactions
http://slidepdf.com/reader/full/analysis-of-non-isothermal-reaction-kinetics-part-1-simple-reactions 12/18
104 R.K Agraw al / Thermochim. Acta 203 (1992) 93-110
s
p o-EXACT
i i
i s
- 0. 1 -
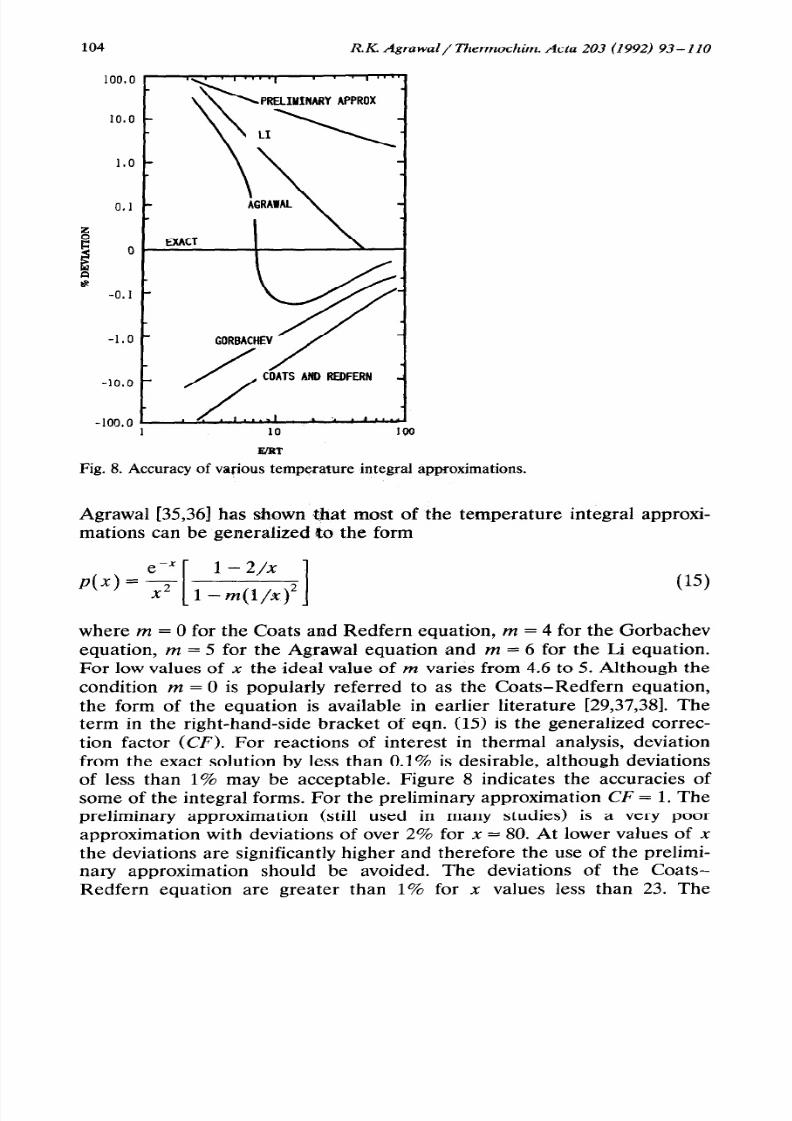
Fig. 8. Accuracy of various temperature integral approximations.
Agrawal [35,36] has shown that most of the temperature integral approxi-
mations can be generalized $0 the form
where m = 0 for the Coats and Redfern equation, m = 4 for the Gorbachev
equation, m = 5 for the Agrawal equation and m = 6 for the Li equation.
For low values of x the ideal value of m varies from 4.6 to 5. Although the
condition m = 0 is popularly referred to as the Coats-Redfern equation,
the form of the equation is available in earlier literature [29,37,38]. The
term in the right-hand-side bracket of eqn. (15) is the generalized correc-
tion factor (0’). For reactions of interest in thermal analysis, deviation
from the exact solution by less than 0.1% is desirable, although deviations
of less than 1% may be acceptable. Figure 8 indicates the accuracies of
some of the integral forms. For the preliminary approximationCF =
1. Thepreliminary approximation (still used in many studies) is a very poor
approximation with deviations of over 2% for x = 80. At lower values of x
the deviations are significantly higher and therefore the use of the prelimi-
nary approximation should be avoided. The deviations of the Coats-
Redfern equation are greater than 1% for x values less than 23. The
7/14/2019 Analysis of Non-Isothermal Reaction Kinetics Part 1. Simple Reactions
http://slidepdf.com/reader/full/analysis-of-non-isothermal-reaction-kinetics-part-1-simple-reactions 13/18
R.K Agrawal/ ~~~~h~. Acta 203 (1992) 93-110 105
deviations of the Gorbachev equation are less than 0.1% for x values
greater than 41 and less than 1% for x values greater than 11. The Li
equation deviates by less than 0.1% for x values greater than 21 and by
less than 1% for x values greater than 9. The Agrawal equation deviates by
less than 0.1% of x values greater than 7. Thus depending on the value ofX, any of the equations should be acceptable for non-isothermal kinetic
analysis.
The Arrhenius parameters can then be obtained by linearizing the
generalized integral equation to obtain
ln[ g(cu)/T2] = ln[(AR/@E)CF] - E/RT (16)
A plot of ln[‘a>/T2] versus l/T will yield a slope of -E/R and an
intercept of ln[(AR/PE)C~]. Equation (16) indicates that the use of the
CF does not in~uence the estimation of E, but influences the value of the
pre-exponential factor and thus the rate constant. So although E values
may be comparable from various approximations, the value of the rate
constant will be significantly different. Therefore, more accurate equations
should be used to obtain reliable Arrhenius parameters.
For a simple reaction, both the multiple heating-rate and integral
methods should yield identical values of the Arrhenius parameters. To
obtain the Arrhenius parameters, the integral method requires fewer
experiments when compared to the multiple heating-rate method. If dataare available, a combination of integral and multiple heating-rate methods
provides a powerful tool with which to study non-isothermal reactions.
Differences in the Arrhenius parameters from these two methods, if any,
should be helpful in identifying experimental errors and/or the nature of
the reaction. It is stressed that reporting the value of E alone is not
sufficient: reporting and comparing the value of the rate constant is more
appropriate.
The kinetic analysis discussed in this paper is limited to chemical
reactions and is, therefore, independent of sample size, heating rate,
particle size and geometry of the sample holder. Simon [39] has shown the
influence of such physical factors on the weight-loss curve. These physical
parameters complicate the study of chemical reactions and should be
avoided. Flynn (401 has recently proposed some ground rules to be applied
to avoid problems in gathering TG data.
RESOLUTION OF UNIQUENESS PROBLEMS
Although the non-isothermal curve indicates the nature of the solid state
reaction being studied, analyzing the data to obtain unique kinetic parame-
ters can be problematic due to the compensation effect. The compensation
effect [16,19,41] causes the kinetic parameters A and E to be linked (see
Fig. 9). An increase in slope (E/R) causes an increase in the intercept
7/14/2019 Analysis of Non-Isothermal Reaction Kinetics Part 1. Simple Reactions
http://slidepdf.com/reader/full/analysis-of-non-isothermal-reaction-kinetics-part-1-simple-reactions 14/18
106 R.K. Agrawal/ Thermochim. Acta 203 (1992) 93 I 10
‘fib
l/TEMPERATURE
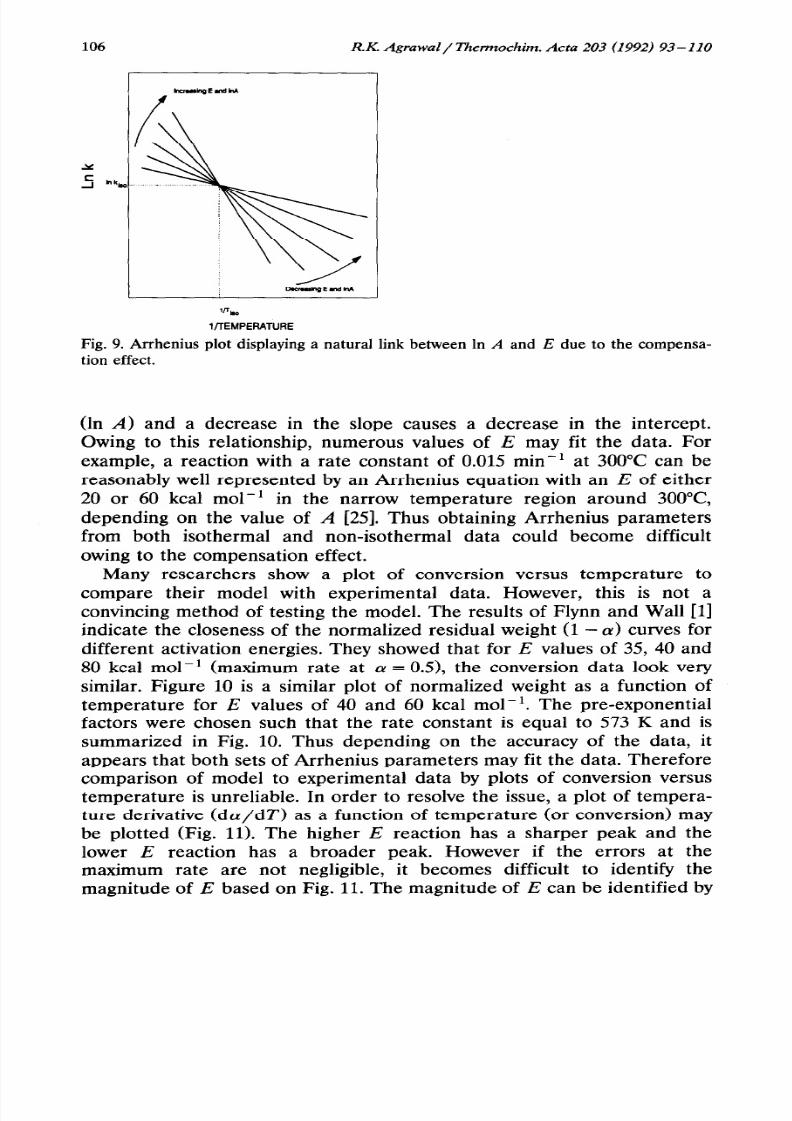
Fig. 9. Arrhenius plot displaying a natural link between In A and E due to the compensa-
tion effect.
(In A) and a decrease in the slope causes a decrease in the intercept.
Owing to this relationship, numerous values of E may fit the data. For
example, a reaction with a rate constant of 0.015 min-’ at 300°C can be
reasonably well represented by an Arrhenius equation with an E of either20 or 60 kcal mol-’ in the narrow temperature region around 300°C
depending on the value of A [25]. Thus obtaining Arrhenius parameters
from both isothermal and non-isothermal data could become difficult
owing to the compensation effect.
Many researchers show a plot of conversion versus temperature to
compare their model with experimental data. However, this is not a
convincing method of testing the model. The results of Flynn and Wall 111
indicate the closeness of the normalized residual weight (1 - a) curves for
different activation energies. They showed that for E values of 35, 40 and
80 kcal mol-’ (maximum rate at LY OS), the conversion data look very
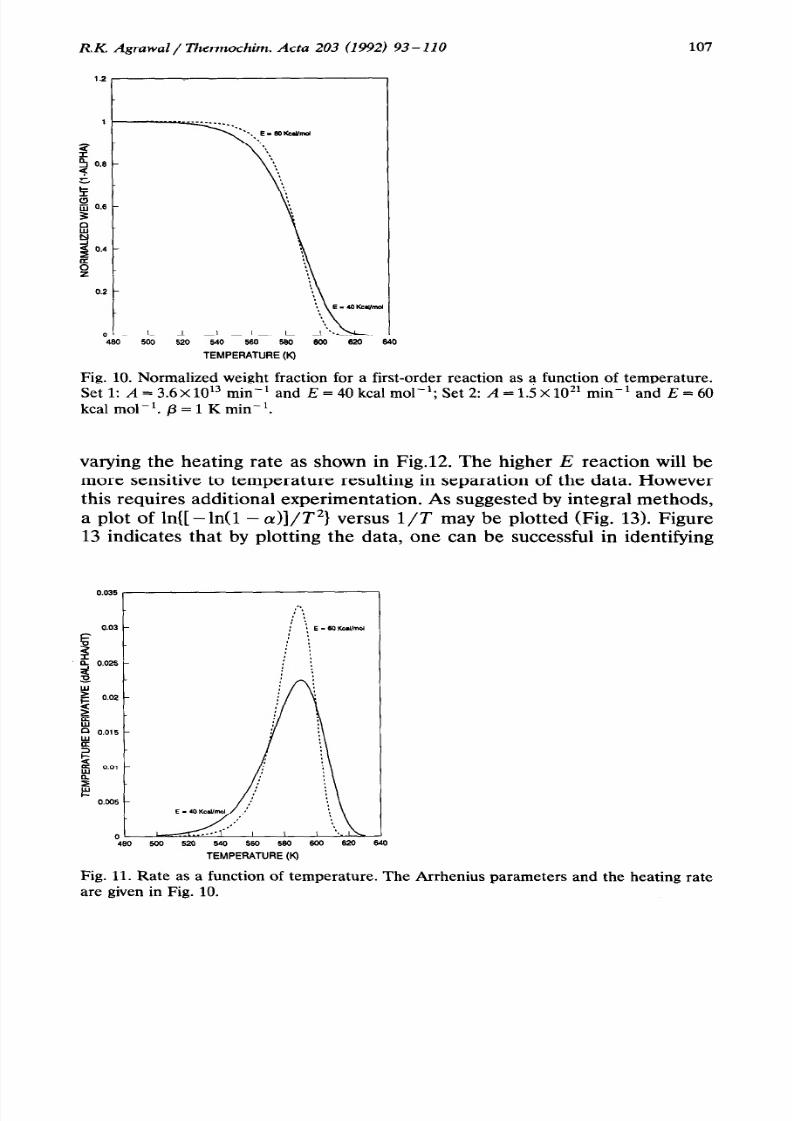
similar. Figure 10 is a similar plot of normalized weight as a function of
temperature for E values of 40 and 60 kcal mall’. The pre-exponential
factors were chosen such that the rate constant is equal to 573 K and is
summarized in Fig. 10. Thus depending on the accuracy of the data, it
appears that both sets of Arrhenius parameters may fit the data. Therefore
comparison of model to experimental data by plots of conversion versus
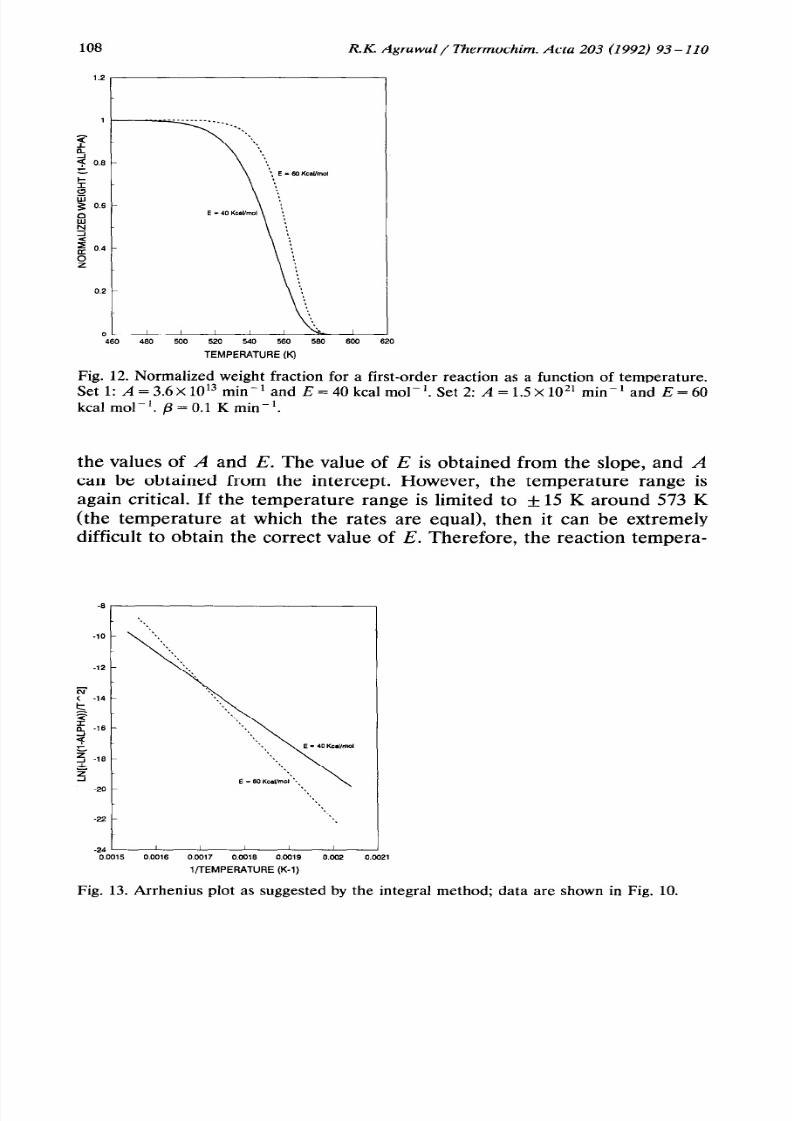
temperature is unreliable. In order to resolve the issue, a plot of tempera-ture derivative (da/dT) as a function of temperature (or conversion) may
be plotted (Fig. 11). The higher E reaction has a sharper peak and the
lower E reaction has a broader peak. However if the errors at the
maximum rate are not negligible, it becomes difficult to identify the
magnitude of E based on Fig. 11. The magnitude of E can be identified by
7/14/2019 Analysis of Non-Isothermal Reaction Kinetics Part 1. Simple Reactions
http://slidepdf.com/reader/full/analysis-of-non-isothermal-reaction-kinetics-part-1-simple-reactions 15/18
R.K. Agraw al / Thermochim. Acta 203 (1992) 93-110 107
J
400 500 520 540 560 580 600 e20 640
TEMPERATURE (K)
Fig. 10. Normalized weight fraction for a first-order reaction as a function of temperature.
Set 1: A = 3.6~ 1Ol3 min-’ andE=40kcalmol-‘;Set2: A=1.5X10²¹min-1andE=60
kcal mol-‘. /3 = 1 K min-‘.
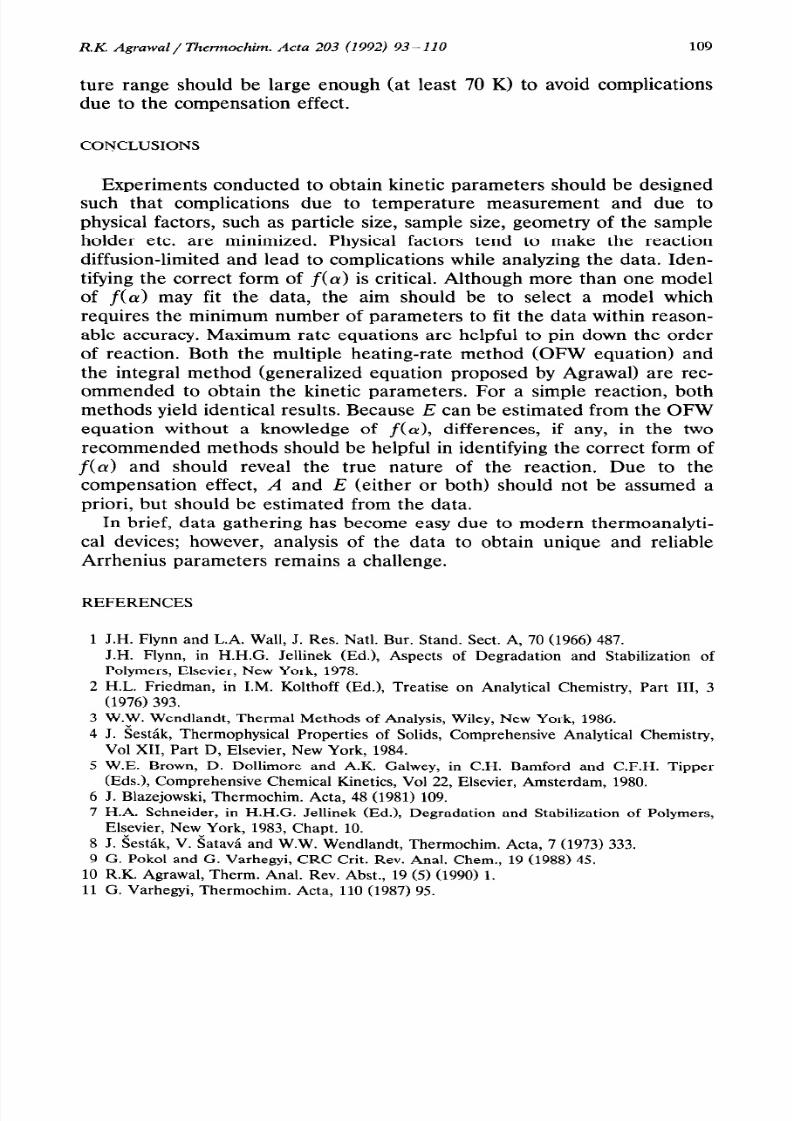
varying the heating rate as shown in Fig.12. The higher E reaction will be
more sensitive to temperature resulting in separation of the data. Howeverthis requires additional experimentation. As suggested by integral methods,
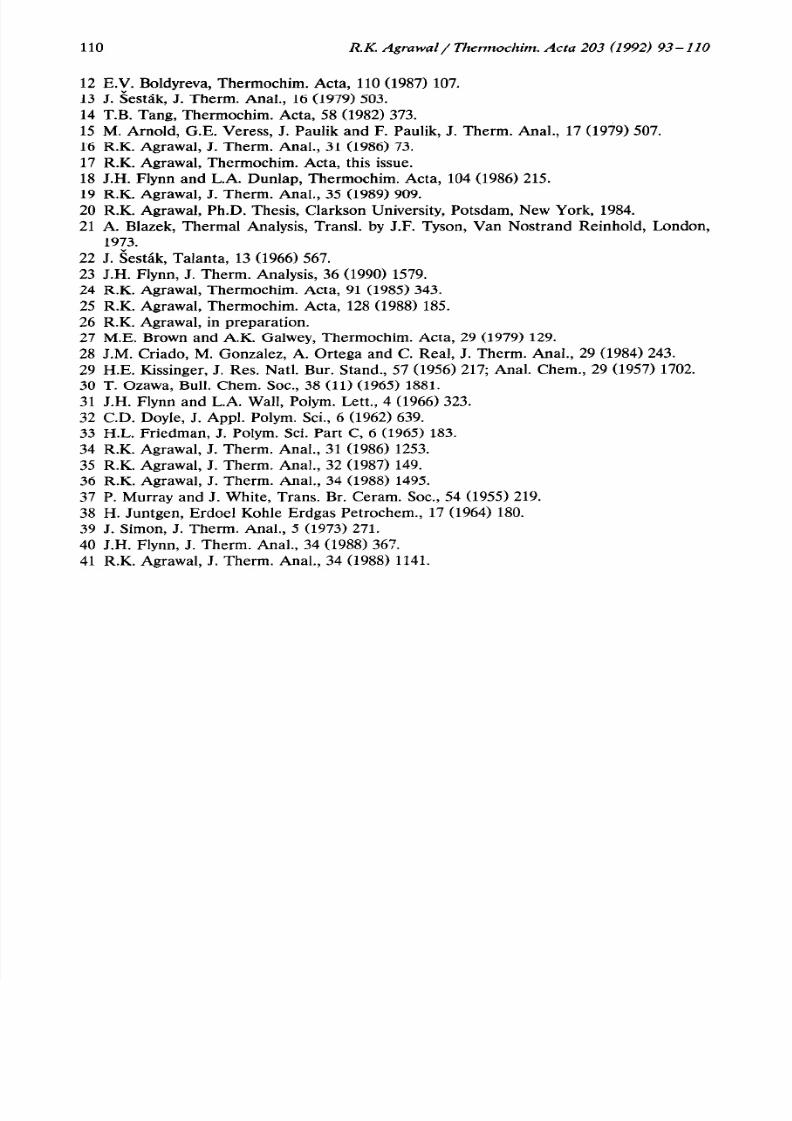
a plot of ln{[ - ln(1 - (r)]/P} versus l/T may be plotted (Fig. 13). Figure
13 indicates that by plotting the data, one can be successful in identifying
0.035
,.-.,
,.03 - :; : E-MKc4/m.
:
: :
0.025 - i :
0.02 -
0.015 -
0.0, -
o.co5 -
0
480 MO m 540 so 580 600 m
TEMPERATURE (Kj
-I
64 0
Fig. 11. Rate as a function of temperature. The Arrhenius parameters and the heating rate
are given in Fig. 10.
7/14/2019 Analysis of Non-Isothermal Reaction Kinetics Part 1. Simple Reactions
http://slidepdf.com/reader/full/analysis-of-non-isothermal-reaction-kinetics-part-1-simple-reactions 16/18
108 RX. Agrawal/Thermochim. Acta 203 (1992) 93-110
-I
460 480 580 600 620
TEMPERATURE (K)
Fig. 12. Normalized weight fraction for a first-order reaction as a function of temperature.
Set 1: A = 3.6~ 1013 min-’ and E = 40 kcal mol-‘. Set 2: A = 1.5~ 1021 min-’ and E = 60
kcal mol-‘. p = 0.1 K min-‘.
the values of A and E. The value of E is obtained from the slope, and A
can be obtained from the intercept. However, the temperature range isagain critical. If the temperature range is limited to + 15 K around 573 K
(the temperature at which the rates are equal), then it can be extremely
difficult to obtain the correct value of E. Therefore, the reaction tempera-
Fig. 13. Arrhenius plot as suggested by the integral method; data are shown in Fig. 10.
7/14/2019 Analysis of Non-Isothermal Reaction Kinetics Part 1. Simple Reactions
http://slidepdf.com/reader/full/analysis-of-non-isothermal-reaction-kinetics-part-1-simple-reactions 17/18
R.K. Agrawal/ Thermochim. Acta 203 (1992) 93- 110 109
ture range should be large enough (at least 70 K> to avoid complications
due to the compensation effect.
CONCLUSIONS
Experiments conducted to obtain kinetic parameters should be designed
such that complications due to temperature measurement and due to
physical factors, such as particle size, sample size, geometry of the sample
holder etc. are minimized. Physical factors tend to make the reaction
diffusion-limited and lead to complications while analyzing the data. Iden-
tifying the correct form of f(cr> is critical. Although more than one model
of f(a) may fit the data, the aim should be to select a model which
requires the minimum number of parameters to fit the data within reason-able accuracy. Maximum rate equations are helpful to pin down the order
of reaction. Both the multiple heating-rate method (OFW equation) and
the integral method (generalized equation proposed by Agrawal) are rec-
ommended to obtain the kinetic parameters. For a simple reaction, both
methods yield identical results. Because E can be estimated from the OFW
equation without a knowledge of f(a), differences, if any, in the two
recommended methods should be helpful in identifying the correct form of
f(a) and should reveal the true nature of the reaction. Due to the
compensation effect, A and E (either or both) should not be assumed apriori, but should be estimated from the data.
In brief, data gathering has become easy due to modern thermoanalyti-
cal devices; however, analysis of the data to obtain unique and reliable
Arrhenius parameters remains a challenge.
REFERENCES
1 J.H. Flynn and L.A. Wall, J. Res. Natl. Bur. Stand. Sect. A, 70 (1966) 487.J.H. Flynn, in H.H.G. Jellinek (Ed.), Aspects of Degradation and Stabilization of
Polymers, Elsevier, New York, 1978.
2 H.L. Friedman, in I.M. Kolthoff (Ed.), Treatise on Analytical Chemistry, Part III, 3
(1976) 393.
3 W.W. Wendlandt, Thermal Methods of Analysis, Wiley, New York, 1986.
4 J. Sestak, Thermophysical Properties of Solids, Comprehensive Analytical Chemistry,
Vol XII, Part D, Elsevier, New York, 1984.
5 W.E. Brown, D. Dollimore and A.K. Galwey, in C.H. Bamford and C.F.H. Tipper
(Eds.1, Comprehensive Chemical Kinetics, Vol 22, Elsevier, Amsterdam, 1980.
6 J. Blazejowski, Thermochim. Acta, 48 (1981) 109.7 H.A. Schneider, in H.H.G. Jellinek (Ed.), Degradation and Stabilization of Polymers,
Eltevier, New”York, 1983, Chapt. 10.
8 J. Sestak, V. Satavl and W.W. Wendlandt, Thermochim. Acta, 7 (1973) 333.
9 G. Pokol and G. Varhegyi, CRC Crit. Rev. Anal. Chem., 19 (1988) 45.
10 R.K. Agrawal, Therm. Anal. Rev. Abst., 19 (5) (1990) 1.
11 G. Varhegyi, Thermochim. Acta, 110 (1987) 95.
7/14/2019 Analysis of Non-Isothermal Reaction Kinetics Part 1. Simple Reactions
http://slidepdf.com/reader/full/analysis-of-non-isothermal-reaction-kinetics-part-1-simple-reactions 18/18
110 RX Agrawal/ Thermochim. Acta 203 (1992) 93-110
12 E.V. Boldyreva, Thermochim. Acta, 110 (1987) 107.
13 J. Sestak, J. Therm. Anal., 16 (1979) 503.
14 T.B. Tang, Thermochim. Acta, 58 (1982) 373.
15 M. Arnold, G.E. Veress, J. Paulik and F. Paulik, J. Therm. Anal., 17 (1979) 507.
16 R.K. Agrawal, J. Therm. Anal., 31 (1986) 73.
17 R.K. Agrawal, Thermochim. Acta, this issue.18 J.H. Flynn and L.A. Dunlap, Thermochim. Acta, 104 (1986) 215.
19 R.K. Agrawal, J. Therm. Anal., 35 (1989) 909.
20 R.K. Agrawal, Ph.D. Thesis, Clarkson University, Potsdam, New York, 1984.
21 A. Blazek, Thermal Analysis, Transl. by J.F. Tyson, Van Nostrand Reinhold, London,
1973.
22 J. Sestak, Talanta, 13 (1966) 567.
23 J.H. Flynn, J. Therm. Analysis, 36 (1990) 1579.
24 R.K. Agrawal, Thermochim. Acta, 91 (1985) 343.
25 R.K. Agrawal, Thermochim. Acta, 128 (1988) 185.
26 R.K. Agrawal, in preparation.27 M.E. Brown and A.K. Galwey, Thermochim. Acta, 29 (1979) 129.
28 J.M. Criado, M. Gonzalez, A. Ortega and C. Real, J. Therm. Anal., 29 (1984) 243.
29 H.E. Kissinger, J. Res. Natl. Bur. Stand., 57 (1956) 217; Anal. Chem., 29 (1957) 1702.
30 T. Ozawa, Bull. Chem. Sot., 38 (11) (1965) 1881.
31 J.H. Flynn and L.A. Wall, Polym. Lett., 4 (1966) 323.
32 C.D. Doyle, J. Appl. Polym. Sci., 6 (1962) 639.
33 H.L. Friedman, J. Polym. Sci. Part C, 6 (1965) 183.
34 R.K. Agrawal, J. Therm. Anal., 31 (1986) 1253.
35 R.K. Agrawal, J. Therm. Anal., 32 (1987) 149.
36 R.K. Agrawal, J. Therm. Anal., 34 (1988) 1495.37 P. Murray and J. White, Trans. Br. Ceram. Sot., 54 (1955) 219.
38 H. Juntgen, Erdoel Kohle Erdgas Petrochem., 17 (1964) 180.
39 J. Simon, J. Therm. Anal., 5 (1973) 271.
40 J.H. Flynn, J. Therm. Anal., 34 (1988) 367.
41 R.K. Agrawal, J. Therm. Anal., 34 (1988) 1141.