Analysis of Microplastic Beads and their Removal at a...
35
Analysis of Microplastic Beads and their Removal at a Municipal Wastewater Treatment Plant Rupa Lamsal, PhD. and Rominder Suri, PhD. WET Center Annual Meeting May 28, 2015
Transcript of Analysis of Microplastic Beads and their Removal at a...
Analysis of Microplastic Beads and their Removal at a Municipal Wastewater Treatment Plant
Rupa Lamsal, PhD. and Rominder Suri, PhD.
WET Center Annual Meeting
May 28, 2015

Analysis of Microplastic Beads and their Removal at a Municipal Wastewater Treatment Plant
TU-15-06 Research Team: Rupa Lamsal and Rominder Suri
Cost/Schedule Performance Status:
The project completed on schedule and within budget
Key Deliverables / Milestones:
• Deliverable 1: Analytical method development – (Completed)
• Deliverable 2: Microplastics Removal efficiency determination – (Completed)
• Deliverable 3: Research article; progress reports; presentations to IAB
Project Status:
Completed
Objectives:
To develop analytical method for detection and quantification of microplastics in wastewater samples
To determine removal efficiency of microplastics in biological wastewater treatment process
Period of Performance:
01/2014 – 12/2014 Accomplishments and Key Findings:
Analytical method was developed for detection and quantification of microplastics
Fate of microplastics was studied in municipal wastewater treatment system
Significant removal (83+%) of microplastics at wwtp

Background
Microplastics are used in personal care products
such as exfoliating scrubs, toothpastes, shower gels
and shaving creams, etc.
Persistent in environment and attract chemicals
e.g. DDT, PCBs, nonylphenol, flame retardants
Detected in surface water (Great Lakes), marine
organisms such as in fish, lobsters, mussels, oysters
Ingested higher in the food chain
3
1. 5 Gyres Institute, Microplastics in consumer products and in the marine environment, Position paper, 2013
2. Eriken et. al. Microplastic pollution in the surface waters of the Laurentian Great Lakes, Marine Pollution Bulletin, 77(1-2), 2013, 177-182.
4
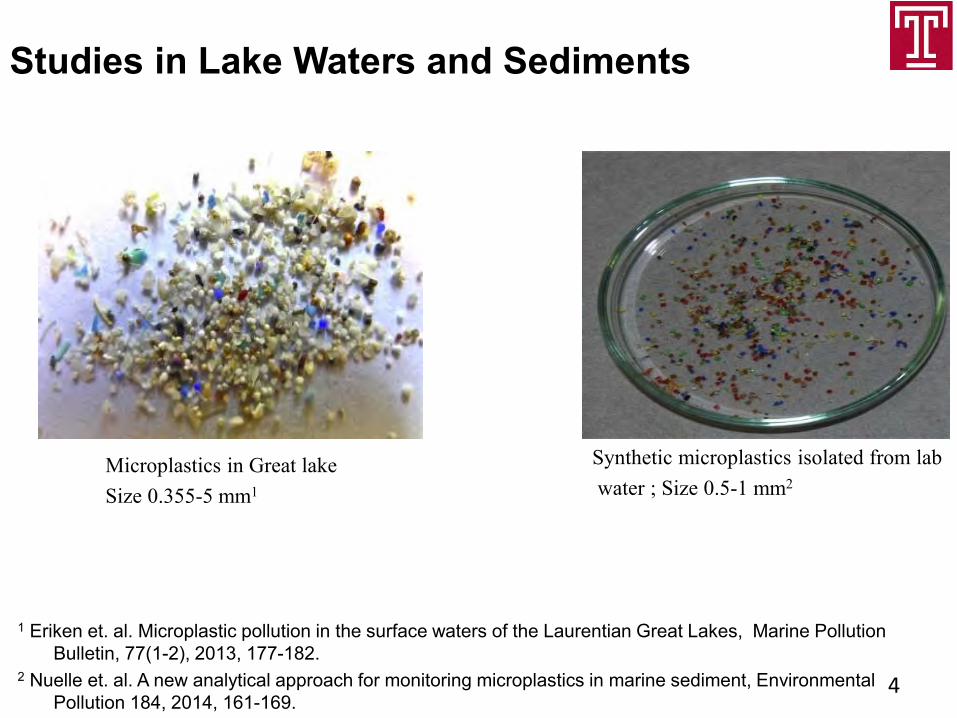
Studies in Lake Waters and Sediments
Microplastics in Great lake Size 0.355-5 mm1
Synthetic microplastics isolated from lab water ; Size 0.5-1 mm2
1 Eriken et. al. Microplastic pollution in the surface waters of the Laurentian Great Lakes, Marine Pollution Bulletin, 77(1-2), 2013, 177-182.
2 Nuelle et. al. A new analytical approach for monitoring microplastics in marine sediment, Environmental Pollution 184, 2014, 161-169.

5
Microplastic in Facial Cleansers
Microplastic in different brand of
facial cleansers
Particle size = 0.5-5mm (Fendall &
Sewell et al., 2009)1
1 L. S. Fendall and M. A .Sewell Contributing to marine pollution by washing face: Microplastics
facial cleansers, Marine Pollution Bulletin, 58, 2009, 1225-1228.

Project Objectives
• Develop analytical method for detection and quantification of polyethylene microplastic beads (PEMB) in wastewater samples
• Determine removal efficiency of PEMB at a
municipal wastewater treatment plant
6

Typical Layout of a Municipal WWTP (simple)
7
Primary Clarifier
WW IN
Primary Effluent
Biological/ aeration Tank
Secondary Effluent
Disinfection Final Effluent Discharged to surface water
Primary Clarifier
Experimental
8
• Samples of polyethylene microplastic beads (PEMB) were obtained from a Pharmaceutical and Personal Care Product Company
• PEMB size – approximately 200 to 600 micron
• Used as a standard

Analytical Methods
9
• Several methods were examined in the lab for the detection and quantification of PEMB
Weighing method: Filter water and weight the mass of PEMB on
the filter paper Scanning electron microscope (SEM) method to observe particle
morphology and size Particle counting method using a Hemocytometer Aerate wastewater samples, filter and weigh/count PEMB on filter
paper Flow Cytometry Filter wastewater sample and count particles using
microscope (40X power) FT-IR Imaging
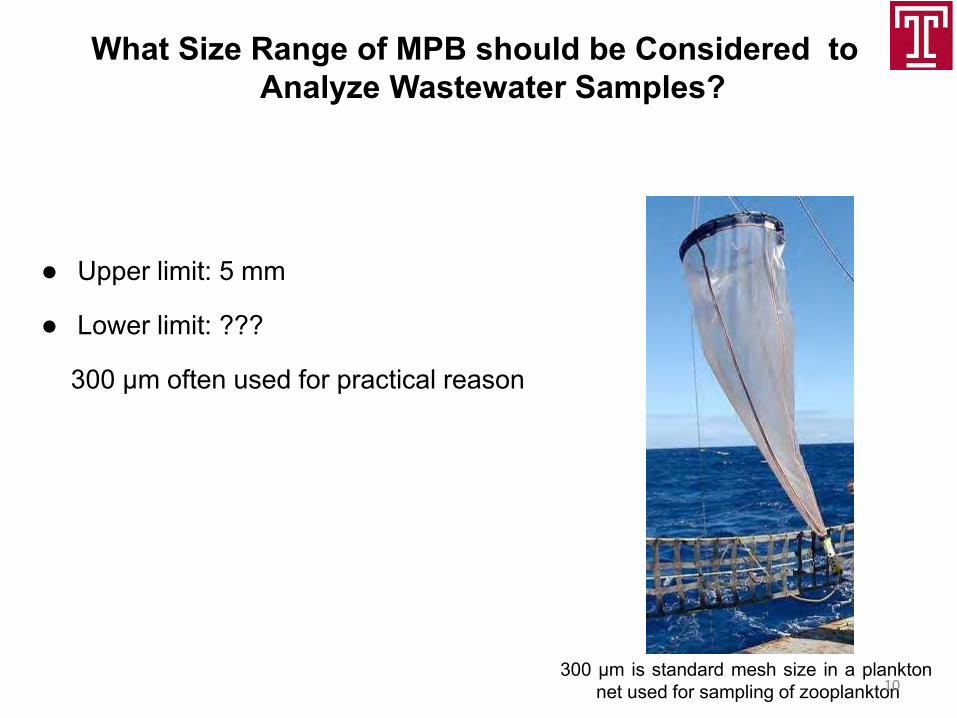
What Size Range of MPB should be Considered to Analyze Wastewater Samples?
Upper limit: 5 mm
Lower limit: ???
300 µm often used for practical reason
300 µm is standard mesh size in a plankton
net used for sampling of zooplankton 10
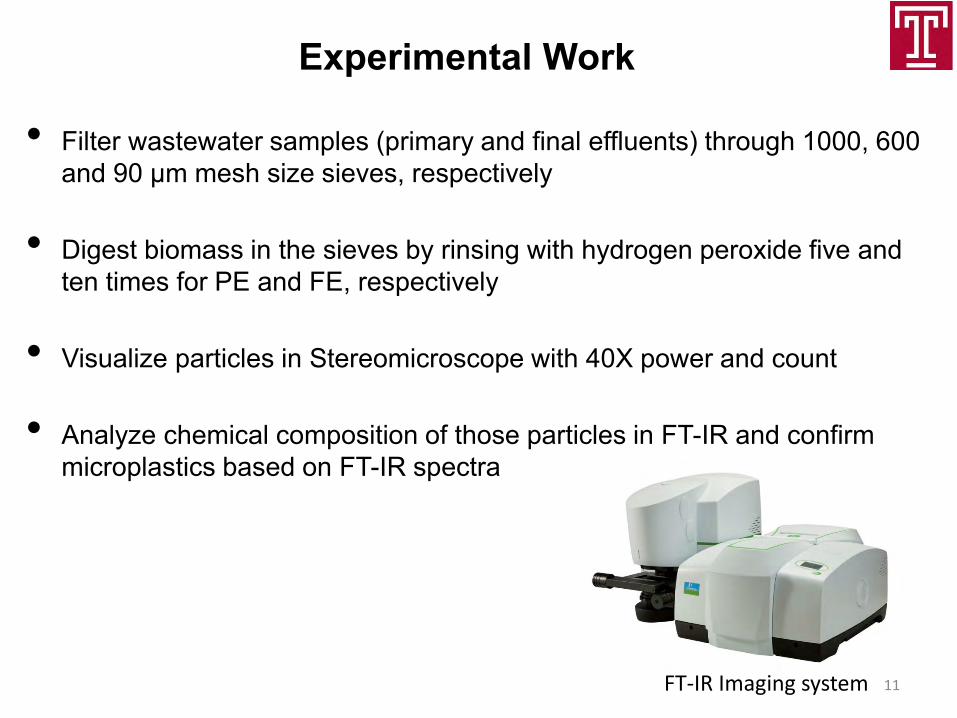
Experimental Work
11
• Filter wastewater samples (primary and final effluents) through 1000, 600 and 90 µm mesh size sieves, respectively
• Digest biomass in the sieves by rinsing with hydrogen peroxide five and
ten times for PE and FE, respectively • Visualize particles in Stereomicroscope with 40X power and count • Analyze chemical composition of those particles in FT-IR and confirm
microplastics based on FT-IR spectra
FT-IR Imaging system

Wastewater Samples
12
• Wastewater samples were collected from a local wastewater treatment facility
• The plant receives domestic waste from about 50,000 residence, and trucked wastewater from some companies
• 24 hours composite samples (10 L) of primary effluent (PE)
and final effluent (FE) were collected • (Three samples - April, May, July 2014) • 1 L of primary influent and 5 L of final effluent samples were
processed

1000 µm 600 µm 90 µm 90 µm
600 µm Cleaning with Milli-Q water
H2O2 (10%) cleaning to digest biomass (10 times)
Particles Sorting
FT-IR analysis
1 L Primary Effluent
Sieves Sieves
Viewing morphology of particles
Analytical Method Development
*Primary Effluent - Sample Processing
13

1000 µm 600 µm 90 µm 90 µm
600 µm Cleaning with Milli-Q water
H2O2 (10%) cleaning to digest biomass (5 times)
Particles Sorting
FT-IR analysis
5 L Final Effluent
Sieves Sieves
Viewing morphology of particles
Analytical Method Development
*Final effluent - Sample Processing
14
15
• FT-IR Conditions: spectral resolution of 8 cm-1, 50 µm pixel size and 32 co-added scan per pixels
• FT-IR spectra of particles were compared with available
standard microplastic (polyethylene microplastic bead)
• Additional spectra were compared with other polymer spectra from literatures and FT-IR spectra database
• Polyethylene microplastic bead (PEMB) is mostly of
focus in this study
FT-IR Analysis

Particles collected in 90 µm sieve (5L of Final Effluent sample)
Particles collected in 90 µm sieve (1L of Primary Effluent sample)
First Set of Composite Samples (April 24-25, 2014)
16

17
Standard PEMB Possible micoplastic in Final effluent
Stereomicroscope
Microplastic Pictures in Microscope (40X power)

18
1000150020002500300035004000
0
0.1
0.2
0.3
0.4
0.5
0.6
mpb2_TRANSMITTANCEravbsb1.spf (175,150)
Wavenumber (cm-1)
Absorb
ance
-0.5
-0.4
-0.3
-0.2
-0.1
0
0.1
0.2
micrometers
mic
rom
ete
rs
raw 7
0 100 200 300 400 500 600 700 800
0
100
200
300
400
500
600
700
800
*Note: Total of 55/L particles detected out of which 23/L were PEMB
Sample PEMB Standard PEMB
FT-IR Analysis-Primary Effluent
FT-IR spectra of standard and sample PEMB FT-IR image of a PEMB particle

19
1000150020002500300035004000
-0.3
-0.2
-0.1
0
0.1
0.2
0.3
mpb2_TRANSMITTANCEravbsb1.spf (175,200)
Wavenumber (cm-1)
Absorb
ance
*Note: Total of 30 particles detected out of which 3/L were PEMB
Sample PEMB Standard PEMB
Removal efficiency of PEMB in April 24 = 87 %
FT-IR Analysis-Final Effluent
FT-IR spectra of standard and sample PEMB
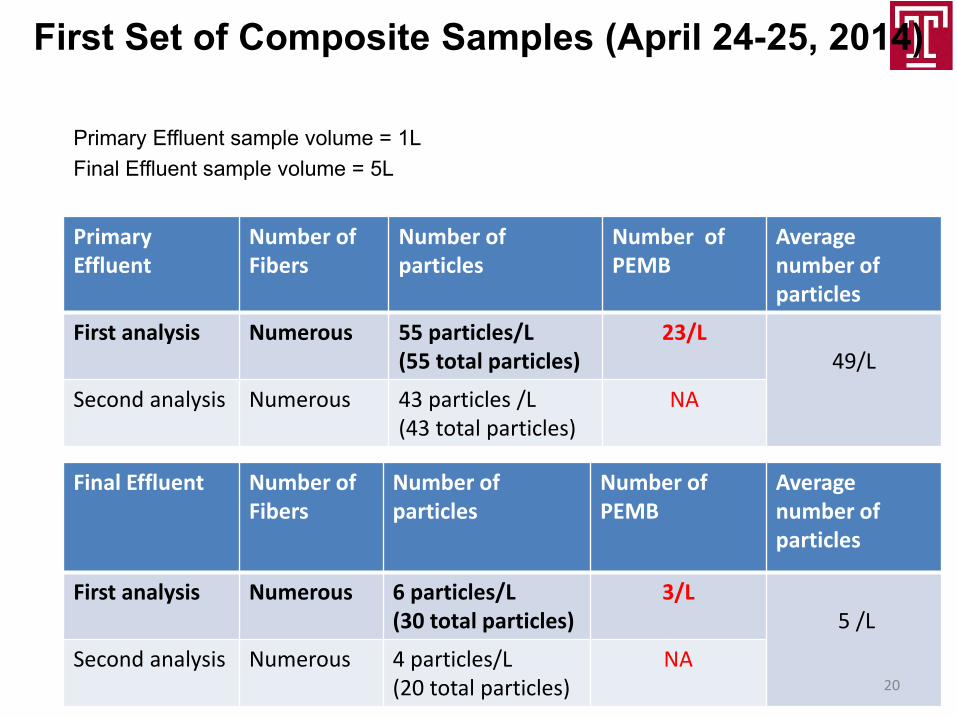
Primary Effluent
Number of Fibers
Number of particles
Number of PEMB
Average number of particles
First analysis Numerous 55 particles/L (55 total particles)
23/L 49/L
Second analysis Numerous 43 particles /L (43 total particles)
NA
Final Effluent Number of Fibers
Number of particles
Number of PEMB
Average number of particles
First analysis Numerous 6 particles/L (30 total particles)
3/L 5 /L
Second analysis Numerous 4 particles/L (20 total particles)
NA
Primary Effluent sample volume = 1L Final Effluent sample volume = 5L
First Set of Composite Samples (April 24-25, 2014)
20

Particles collected in 90 µm sieve (5L of Final Effluent sample)
Particles collected in 90 µm sieve (1L of Primary Effluent sample)
Second Set of Composite Samples (May 21-22, 2014)
21

22
1000150020002500300035004000
-0.05
0
0.05
0.1
0.15
0.2
0.25
0.3
raw 10bsb1rav.spf (750,700)
Wavenumber (cm-1)
Absorb
ance
PEMB in the final effluent = 0
Removal Efficiency of PEMB in May 21 = 100 %
Standard PEMB Sample PEMB
*Note: Total of 38/L particles detected; 6/L were confirmed as PEMB
FT-IR Analysis –Primary Effluent (May 21-22, 2014)
FT-IR spectra of standard and sample PEMB

23
Primary Effluent
Number of Fibers
Number of particles Number of PEMB
Average number of particles
First analysis Numerous 38 particles/L (38 total particles)
6/L 54 particles/L
Second analysis Numerous 69 particles/L (69 total particles)
NA
Final Effluent Number of Fibers
Number of particles
Number of PEMB
Average number of particles
First analysis Numerous 2 particles/L (10 total particles)
0/L 3 particles/L
Second analysis Numerous 4 particles/L (20 total particles)
NA
Primary Effluent sample volume = 1L Final Effluent sample volume = 5L
Second Set of Composite Samples (May 21-22, 2014)

24
Third set of Composite Samples (July 7-8, 2014)
Particles collected in 90 µm sieve (500 mL of Primary effluent sample)
Picked particles for FTIR analysis Picked particles for FTIR analysis
Particles collected in 90 µm sieve (5 L of Final effluent sample)

25
FTIR of First Analysis of Final Effluent- 3rd sample
1000150020002500300035004000
0
0.1
0.2
0.3
0.4
0.5
0.6
0.7
0.8
0.9
1standard_50umravbsb1nrm.spf (225,300)
Wavenumber (cm-1)
Absorb
ance
Standard PEMB Sample PEMB
Note: Total of 23/L particles; 1/L particle was confirmed as PEMB
FT-IR spectra of standard and sample PEMB

26
FT-IR of Second Analysis of Final Effluent – 3rd sample
1000150020002500300035004000
0
0.1
0.2
0.3
0.4
0.5
standard_50umravbsb1.spf (225,300)
Wavenumber (cm-1)
Absorb
ance
Sample PEMB
Standard PEMB
Note: Total of 13/L particles; 3/L particles are confirmed as PEMB
-0.5
-0.4
-0.3
-0.2
-0.1
0
micrometers
mic
rom
ete
rs
Image
0 200 400 600 800 1000 1200 1400 1600 1800
0
500
1000
1500
2000
FT-IR spectra of standard and sample PEMB FT-IR Image of particles; particles with red circles are confirmed as PEMB
27
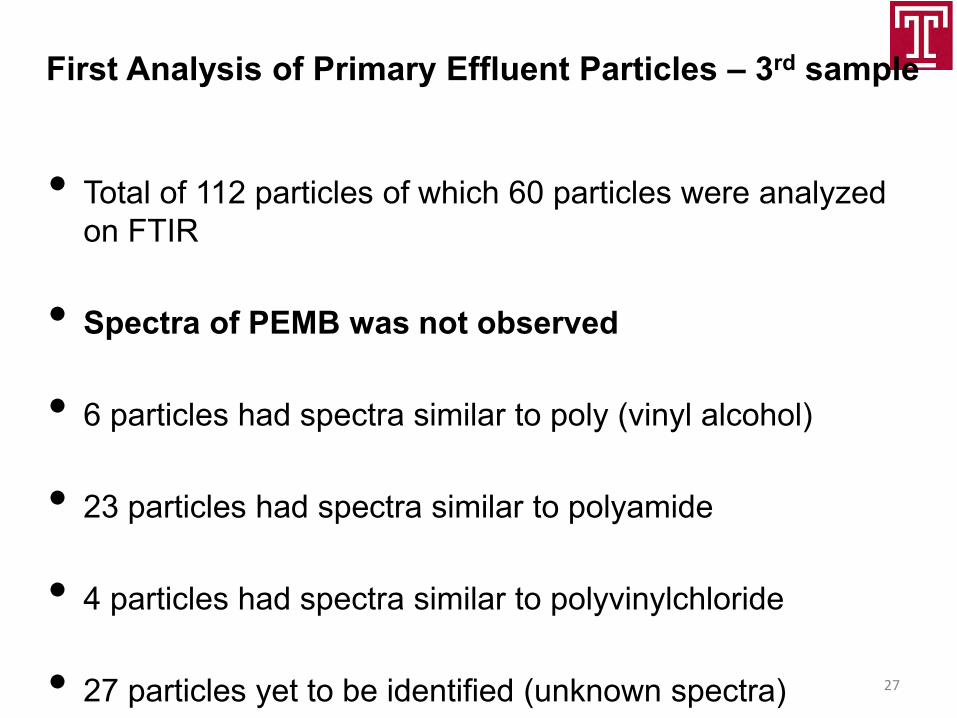
First Analysis of Primary Effluent Particles – 3rd sample
• Total of 112 particles of which 60 particles were analyzed on FTIR
• Spectra of PEMB was not observed • 6 particles had spectra similar to poly (vinyl alcohol) • 23 particles had spectra similar to polyamide • 4 particles had spectra similar to polyvinylchloride • 27 particles yet to be identified (unknown spectra)

28
Second Analysis of Primary Effluent Particles – 3rd sample
• Total of 86 particles of which 60 particles were analyzed on FTIR
• Spectra of PEMB was not observed

29
Final Effluent Number of Fibers
Number of particles Number of PEMB
Average number of particles
First analysis 0 23 particles/L 1/L 18 particles/L
Second analysis
1/L 13 particles/L 3/L
Third set of Composite Sample (July 7-8, 2014)
Primary Effluent
Number of Fibers
Number of particles
Number of PEMB Average number of particles
First analysis 4 /L 224 particles/L 0 198 particles/L
Second analysis
10 /L 172 particles/L 0
Primary Effluent sample volume = 500 mL Final Effluent sample volume = 5L
30
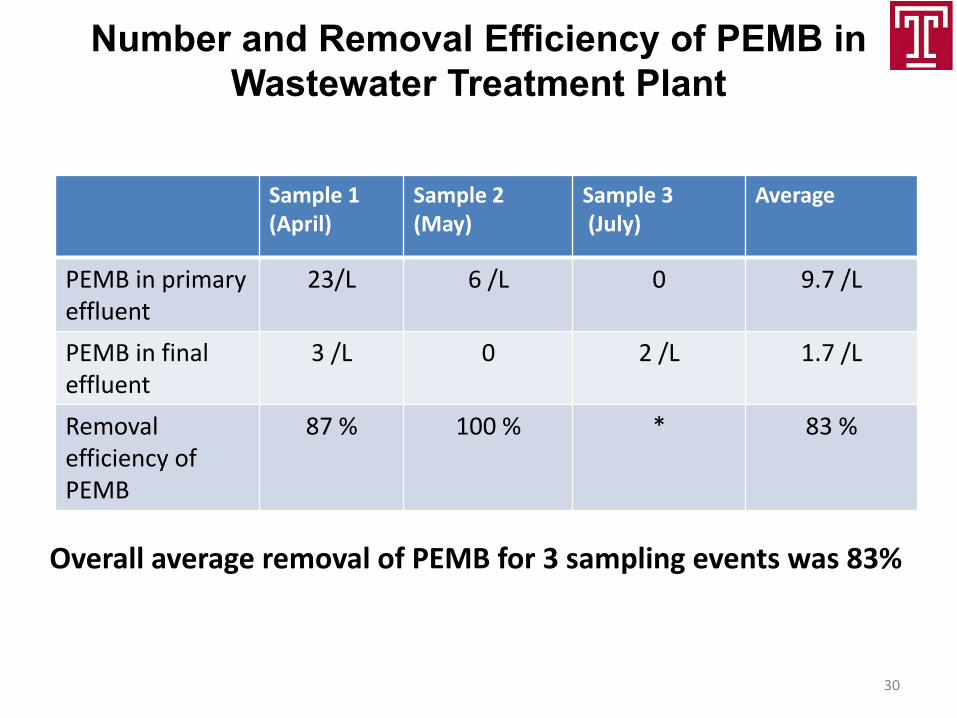
Number and Removal Efficiency of PEMB in Wastewater Treatment Plant
Sample 1 (April)
Sample 2 (May)
Sample 3 (July)
Average
PEMB in primary effluent
23/L 6 /L 0 9.7 /L
PEMB in final effluent
3 /L 0 2 /L 1.7 /L
Removal efficiency of PEMB
87 % 100 % * 83 %
Overall average removal of PEMB for 3 sampling events was 83%

31
1000150020002500300035004000
0
0.1
0.2
0.3
0.4
0.5
standard_50umravbsb1.spf (225,300)
Wavenumber (cm-1)
Absorb
ance
Sample PEMB
Standard PEMB
• Additional peak was
observed around 1700 cm-1
• This may be due to c=o
carbonyl group stretching
(oxidation of polymer due to
peroxide) or oxidation of
polymer in wastewater
treatment plant
*M. Rocha, A. Mansur and H. Mansur, 2009. Characterization and accelerated ageing of UHMWPE used in Orthopedic prosthesis by peroxide. Materials, 2009, 2, 562-576; doi:10.3390/ma2020562.
a) FT-IR spectra of reference UHMWPE and UHMWPE oxidized for b) 28 days c) 60 days and d) 120 days (Rocha et al., 2009)*
Comparing Standard and Sample PEMB

32
• Cleaning with H O2 during
sample processing (both 5X
and 10X) did not show the
oxidation of standard PEMB
• There may be some
oxidation of polymer
occurring in wastewater
treatment plant
Effect of H2O2 Cleaning during Sample Processing
1000150020002500300035004000
-0.1
0
0.1
0.2
0.3
0.4
0.5
0.6
0.7
0.8
0.9
standard_50umbsb1sptrsptr.spf (3,1)
Wavenumber (cm-1)
Abso
rba
nce
PEMB PEMB with 5x H2O2 cleaning
PEMB with 10x H2O2 cleaning
FT-IR spectra of standard PEMB and PEMB washed with H2O2
33
Conclusion
• Polyethylene microplastic beads were successfully detected, isolated and enumerated in the primary effluent and final effluent samples from wwtp
• Reliable results were observed from FT-IR spectra to
determine whether the collected particle is PEMB • Overall average removal of PEMB for 3 sampling events was
83%

Thank You!
Questions?

Background
• Some studies have suggested that wastewater treatment plant
acts as a point source for microplastics (Browne et. al., 2011; McCormick
et. al., 2014)
• There is no comprehensive study on fate of microplastics at
wastewater treatment plant