Analysis of microarray experiments of gene...
16
Analysis of microarray experiments of gene expression profiling Adi L. Tarca, PhD, a,b Roberto Romero, MD, a,c Sorin Draghici, PhD b,d Perinatology Research Branch, National Institute of Child Health and Human Development, National Institutes of Health, Department of Health and Human Services, a Bethesda, MD, and Detroit, MI; Department of Computer Science, b and Center for Molecular Medicine and Genetics, c Wayne State University; Karmanos Cancer Institute, d Detroit, MI KEY WORDS Expression profiling Data preprocessing Differential expression Prediction Clustering Reliability Functional profiling The study of gene expression profiling of cells and tissue has become a major tool for discovery in medicine. Microarray experiments allow description of genome-wide expression changes in health and disease. The results of such experiments are expected to change the methods employed in the diagnosis and prognosis of disease in obstetrics and gynecology. Moreover, an unbiased and sys- tematic study of gene expression profiling should allow the establishment of a new taxonomy of disease for obstetric and gynecologic syndromes. Thus, a new era is emerging in which reproduc- tive processes and disorders could be characterized using molecular tools and fingerprinting. The design, analysis, and interpretation of microarray experiments require specialized knowledge that is not part of the standard curriculum of our discipline. This article describes the types of studies that can be conducted with microarray experiments (class comparison, class prediction, class dis- covery). We discuss key issues pertaining to experimental design, data preprocessing, and gene selection methods. Common types of data representation are illustrated. Potential pitfalls in the interpretation of microarray experiments, as well as the strengths and limitations of this tech- nology, are highlighted. This article is intended to assist clinicians in appraising the quality of the scientific evidence now reported in the obstetric and gynecologic literature. Ó 2006 Mosby, Inc. All rights reserved. DNA microarrays can simultaneously measure the expression level of thousands of genes within a partic- ular mRNA sample. 1,2 Such high-throughput expression profiling can be used to compare the level of gene tran- scription in clinical conditions in order to: 1) identify diagnostic or prognostic biomarkers; 2) classify diseases (eg, tumors with different prognosis that are indistin- guishable by microscopic examination); 3) monitor the response to therapy; and 4) understand the mechanisms involved in the genesis of disease processes. 3-26 For these reasons, DNA microarrays are considered important tools for discovery in clinical medicine. Funded by the Intramural Research of the National Institute of Child Health and Human Development, National Institutes of Health, Department of Health and Human Services. S.D. is partially supported by the following grants: NSF DBI-0234806, NIH 1R01HG003491, NSF CCF-0438970, MLSC MEDC-538, NIH 1R21CA10074001, IR21 EB00990-01 and 1R01 NS045207-01. Reprints not available. Address correspondence to Sorin Draghici, PhD, Associate Professor, Department of Computer Science, Wayne State University, 408 State Hall, Detroit, MI 48202 or Roberto Romero, MD, Chief, Perinatology Research Branch, Division of Intramural Research, National Institute of Child Health and Human Development (NICHD/NIH/DHHS), Hutzel Women’s Hospital – Box #4, 3990 John R, Detroit, MI 48201. E-mails: [email protected] or warfi[email protected] 0002-9378/$ - see front matter Ó 2006 Mosby, Inc. All rights reserved. doi:10.1016/j.ajog.2006.07.001 American Journal of Obstetrics and Gynecology (2006) 195, 373–88 www.ajog.org
Transcript of Analysis of microarray experiments of gene...

American Journal of Obstetrics and Gynecology (2006) 195, 373–88
www.ajog.org
Analysis of microarray experiments of geneexpression profiling
Adi L. Tarca, PhD,a,b Roberto Romero, MD,a,c Sorin Draghici, PhDb,d
Perinatology Research Branch, National Institute of Child Health and Human Development, National Institutes ofHealth, Department of Health and Human Services,a Bethesda, MD, and Detroit, MI; Department of ComputerScience,b and Center for Molecular Medicine and Genetics,c Wayne State University; Karmanos Cancer Institute,d
Detroit, MI
KEY WORDSExpression profilingData preprocessingDifferential expression
PredictionClusteringReliability
Functional profiling
The study of gene expression profiling of cells and tissue has become a major tool for discovery inmedicine. Microarray experiments allow description of genome-wide expression changes in health
and disease. The results of such experiments are expected to change the methods employed in thediagnosis and prognosis of disease in obstetrics and gynecology. Moreover, an unbiased and sys-tematic study of gene expression profiling should allow the establishment of a new taxonomy of
disease for obstetric and gynecologic syndromes. Thus, a new era is emerging in which reproduc-tive processes and disorders could be characterized using molecular tools and fingerprinting. Thedesign, analysis, and interpretation of microarray experiments require specialized knowledge that
is not part of the standard curriculum of our discipline. This article describes the types of studiesthat can be conducted with microarray experiments (class comparison, class prediction, class dis-covery). We discuss key issues pertaining to experimental design, data preprocessing, and geneselection methods. Common types of data representation are illustrated. Potential pitfalls in
the interpretation of microarray experiments, as well as the strengths and limitations of this tech-nology, are highlighted. This article is intended to assist clinicians in appraising the quality of thescientific evidence now reported in the obstetric and gynecologic literature.
� 2006 Mosby, Inc. All rights reserved.
Funded by the Intramural Research of the National Institute of
Child Health and Human Development, National Institutes of Health,
Department of Health and Human Services. S.D. is partially supported
by the following grants: NSF DBI-0234806, NIH 1R01HG003491,
NSF CCF-0438970, MLSC MEDC-538, NIH 1R21CA10074001,
IR21 EB00990-01 and 1R01 NS045207-01.
Reprints not available. Address correspondence to Sorin Draghici,
PhD, Associate Professor, Department of Computer Science, Wayne
State University, 408 State Hall, Detroit, MI 48202 or Roberto
Romero, MD, Chief, Perinatology Research Branch, Division of
Intramural Research, National Institute of Child Health and Human
Development (NICHD/NIH/DHHS), Hutzel Women’s Hospital – Box
#4, 3990 John R, Detroit, MI 48201.
E-mails: [email protected] or [email protected]
0002-9378/$ - see front matter � 2006 Mosby, Inc. All rights reserved.
doi:10.1016/j.ajog.2006.07.001
DNA microarrays can simultaneously measure theexpression level of thousands of genes within a partic-ular mRNA sample.1,2 Such high-throughput expressionprofiling can be used to compare the level of gene tran-scription in clinical conditions in order to: 1) identifydiagnostic or prognostic biomarkers; 2) classify diseases(eg, tumors with different prognosis that are indistin-guishable by microscopic examination); 3) monitor theresponse to therapy; and 4) understand the mechanismsinvolved in the genesis of disease processes.3-26 For thesereasons, DNA microarrays are considered importanttools for discovery in clinical medicine.
374 Tarca, Romero, and Draghici
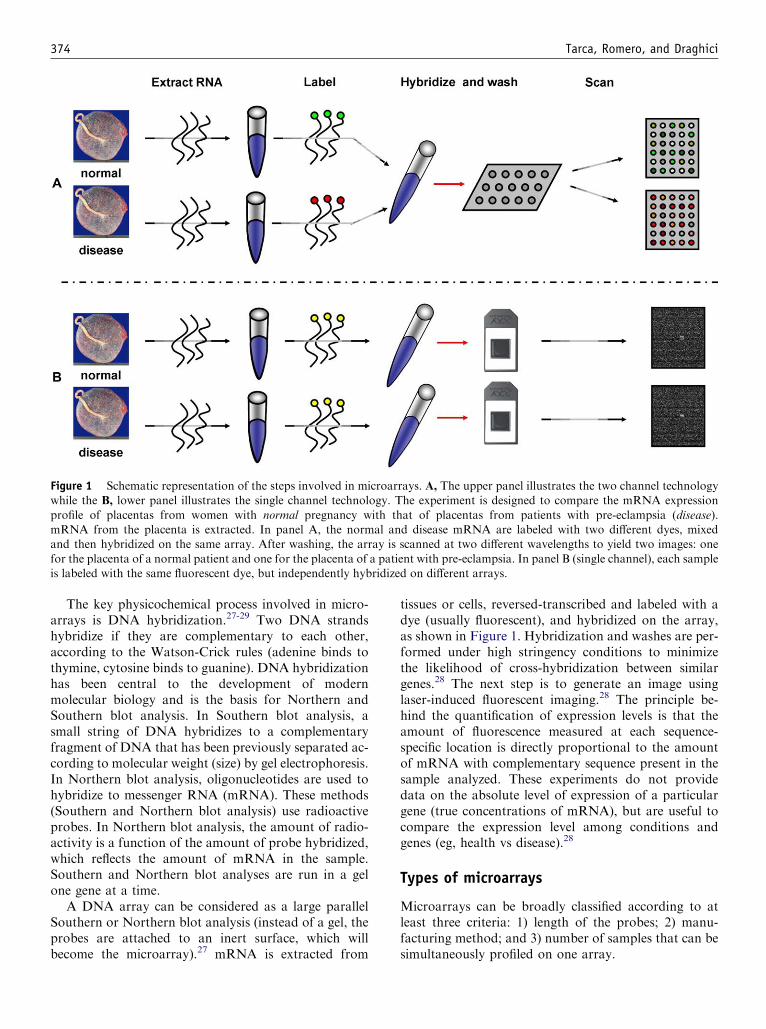
Figure 1 Schematic representation of the steps involved in microarrays. A, The upper panel illustrates the two channel technologywhile the B, lower panel illustrates the single channel technology. The experiment is designed to compare the mRNA expression
profile of placentas from women with normal pregnancy with that of placentas from patients with pre-eclampsia (disease).mRNA from the placenta is extracted. In panel A, the normal and disease mRNA are labeled with two different dyes, mixedand then hybridized on the same array. After washing, the array is scanned at two different wavelengths to yield two images: one
for the placenta of a normal patient and one for the placenta of a patient with pre-eclampsia. In panel B (single channel), each sampleis labeled with the same fluorescent dye, but independently hybridized on different arrays.
The key physicochemical process involved in micro-arrays is DNA hybridization.27-29 Two DNA strandshybridize if they are complementary to each other,according to the Watson-Crick rules (adenine binds tothymine, cytosine binds to guanine). DNA hybridizationhas been central to the development of modernmolecular biology and is the basis for Northern andSouthern blot analysis. In Southern blot analysis, asmall string of DNA hybridizes to a complementaryfragment of DNA that has been previously separated ac-cording to molecular weight (size) by gel electrophoresis.In Northern blot analysis, oligonucleotides are used tohybridize to messenger RNA (mRNA). These methods(Southern and Northern blot analysis) use radioactiveprobes. In Northern blot analysis, the amount of radio-activity is a function of the amount of probe hybridized,which reflects the amount of mRNA in the sample.Southern and Northern blot analyses are run in a gelone gene at a time.
A DNA array can be considered as a large parallelSouthern or Northern blot analysis (instead of a gel, theprobes are attached to an inert surface, which willbecome the microarray).27 mRNA is extracted from
tissues or cells, reversed-transcribed and labeled with adye (usually fluorescent), and hybridized on the array,as shown in Figure 1. Hybridization and washes are per-formed under high stringency conditions to minimizethe likelihood of cross-hybridization between similargenes.28 The next step is to generate an image usinglaser-induced fluorescent imaging.28 The principle be-hind the quantification of expression levels is that theamount of fluorescence measured at each sequence-specific location is directly proportional to the amountof mRNA with complementary sequence present in thesample analyzed. These experiments do not providedata on the absolute level of expression of a particulargene (true concentrations of mRNA), but are useful tocompare the expression level among conditions andgenes (eg, health vs disease).28
Types of microarrays
Microarrays can be broadly classified according to atleast three criteria: 1) length of the probes; 2) manu-facturing method; and 3) number of samples that can besimultaneously profiled on one array.

Tarca, Romero, and Draghici 375
According to the length of the probes, arrays can beclassified into ‘‘complementary DNA (cDNA) arrays,’’which use long probes of hundreds or thousands of basepairs (bps), and ‘‘oligonucleotide arrays,’’ which use shortprobes (usually 50 bps or less). Manufacturing methodsinclude: ‘‘deposition’’ of previously synthesized sequencesand ‘‘in-situ synthesis.’’ Usually, cDNA arrays are man-ufactured using deposition, while oligonucleotide arraysare manufactured using in-situ technologies. In-situtechnologies include: ‘‘photolithography’’ (eg, Affymetrix,Santa Clara, CA), ‘‘ink-jet printing’’ (eg, Agilent, PaloAlto, CA), and ‘‘electrochemical synthesis’’ (eg, Combi-matrix, Mukilteo, WA). The third criterion for the clas-sification of microarrays refers to the number of samplesthat can be profiled on one array. ‘‘Single-channelarrays’’ analyze a single sample at a time, whereas‘‘multiple-channel arrays’’ can analyze two or more sam-ples simultaneously. An example of an oligonucleotide,single-channel array is the Affymetrix GeneChip.
In general, the term ‘‘probe’’ is used to describe thenucleotide sequence that is attached to the microarraysurface. The word ‘‘target’’ in microarray experimentsrefers to what is hybridized to the probes.
Types of studies that can be conductedwith DNA microarrays
There are three major types of applications of DNAmicroarrays in medicine. The first involves findingdifferences in expression levels between predefinedgroups of samples. This is called a ‘‘class comparison’’experiment (eg, identification of genes differentiallyexpressed in the placentas from normal pregnant womenand women with pre-eclampsia).
A second application, ‘‘class prediction,’’ involvesidentifying the class membership of a sample based onits gene expression profile. An example would be topredict whether or not a patient has (or will develop)pre-eclampsia based on her blood expression profile.This requires the construction of a classifier (a mathe-matical model) able to analyze the gene expressionprofile of a sample and predict its class membership.The classifier is constructed based on a representative setof samples with known class membership (eg, womenwith normal pregnancy and those who subsequentlydevelop pre-eclampsia). This classifier will then be usedto assess the likelihood of developing pre-eclampsia inpatients not included in construction of the classifier.
The third type of application involves analyzinga given set of gene expression profiles with the goal ofdiscovering subgroups that share common features. Thisapplication is known as ‘‘class discovery.’’ For example,the expression profiles of a large number of women withpre-eclampsia will be measured with the goal of identi-fying subgroups of patients who have a similar gene
expression profile. This effort is conducted to generatea molecular taxonomy of disease. In other words, howmany molecular types of pre-eclampsia (subgroups) arein a sample of women affected by the disease?
In class comparison and class discovery studies, theexpression characterization of the groups (eg, health vsdisease) is often followed by ‘‘functional profiling.’’30
The purpose of this task is to gain insight into the bio-logical processes that are altered in the disease understudy (see page 382).
Data preprocessing
Once the microarrays have been hybridized, the result-ing images are used to generate a dataset. This datasetneeds to be ‘‘preprocessed’’ prior to the analysis andinterpretation of the results. Preprocessing is a step thatextracts or enhances meaningful data characteristics andprepares the dataset for the application of data analysismethods. A typical example of preprocessing is takingthe logarithm of the raw intensity values. ‘‘Normaliza-tion’’ is a particular type of preprocessing performed inorder to account for systematic differences across data-sets. An example of normalization is modifying the rawintensity values in order to compensate for the differentdye efficiency in two channel microarray experimentsusing Cy3 (green) and Cy5 (red).
Background correctionThe background correction is designed to adjust fornon-specific hybridization, ie, hybridization of sampletranscripts (targets) whose sequences do not perfectlymatch those of the probes on the array. On spottedarrays, the non-specific hybridization included in theraw intensity values can be estimated from the fluores-cence level in the immediate vicinity of the probe.31 Analternative approach involves using exogenous negativecontrol spots (eg, Arabidopsis DNA probes, a plant,for a human array). On Affymetrix arrays, on whichthe probes cover the entire surface of the array, thebackground level may be estimated from ‘‘mismatchprobes.’’32 Mismatch probes are identical to the ‘‘perfectmatch probes,’’ except for a single base pair placed inthe middle of the probe sequence. Thus, the intensitylevels measured on the mismatch probes provide infor-mation about the level of non-specific hybridization.
There are other alternatives to background correctionon high density arrays.33,34 For example, artificial back-ground values can be derived using computational tech-niques that model the distribution of the observedintensity values.
Other data transformationsAfter background correction, the data is generally log-transformed.35,36 The log transformation improves the

376 Tarca, Romero, and Draghici
characteristics of the data distribution and allows theuse of classical parametric statistics for analysis. Withtwo-channel arrays, the intensity values of the two
Figure 2 Examples of graphic display of expression profiling
data obtained from one cDNA array (two channel technol-ogy). A shows a scatter plot of log-intensity values of the sam-ple labeled with red dye (log(R)) versus the log-intensity
values of the sample labeled with green dye (log[G]). Thegreen channel may contain data derived from a normal pla-centa, while the data on the red channel may be derivedfrom a patient with pre-eclampsia. Note that some genes are
up-regulated in the red channel (pre-eclampsia). B is a differentrepresentation of the same data. The vertical axis is the log-ratioM = log(R/G) (log fold change), while the horizontal axis rep-
resents the average log-intensity AZlogRClogG2 : This representa-
tion is also known as aM vs. A plot. These two types of displaysare frequently found in papers reporting microarray experiment
results.
competing samples are expressed as ratios and thenlog-transformed. In contrast, with single-channel tech-nology (eg, Affymetrix), the ‘‘absolute’’ expression levelof the genes is log-transformed. Logarithmic-transfor-mation also converts multiplicative error into additiveerror.37
Two channel cDNA data are often displayed inscatter plots showing the log-intensity of the genesin one sample plotted against the log-intensities inthe other sample. An alternative method to display thedata38 is to plot the difference of the log-intensity of thetwo channels
�MZlogR� logGZlogRG
�; also called log-
ratio, against the average log-intensities�AZlogRClogG
2
�;
as illustrated in Figure 2. Similar plots can be obtainedwith data from two single-channel arrays.
NormalizationNormalization is a preprocessing step that aims to cor-rect for systematic differences between genes or arrays.For example, in a two-color cDNA array, the rawintensities of the sample labeled with the green dye (Cy3)may appear consistently higher than those of the samplelabeled with the red dye (Cy5). Because of this, merelyconsidering the ratios between the red and green inten-sities would not accurately reflect the ratios between theamounts of mRNA in the sample. This imbalance be-tween the two channels is known as ‘‘dye bias.’’39
On Affymetrix arrays, the intensities of the probes ona given array can be consistently higher or lower thanthose on other arrays. Such differences are collectivelyreferred to as ‘‘array bias.’’ Therefore, comparing theintensities of the same probe(s) on the different arrayscan introduce serious errors if a normalization step isnot performed first. Several methods have been pro-posed to address this issue.34,40
Another example of systematic bias is a ‘‘spatialbias,’’ which is manifested by a strong dependence ofthe intensity level of the probes on their spatial location(Figure 3).
The specific normalization techniques depend on thearray technology used. Abundant literature is availableon the subject.34,38,40-56
Freely available software tools for microarray datapreprocessing have been developed under the Biocon-ductor project.57 Bioconductor includes the best knownalgorithms for preprocessing microarray data, such asMAS 5.0,32 Robust Microarray Average (RMA)34 andGC-RMA33 for single channel arrays, and LOESS nor-malization52,58 for two-channel arrays.
Class comparison studies
Class comparison studies are undertaken in order tocompare the gene expression profiles of two or moregroups of patients. For example, it is possible tocompare the transcriptome of healthy vs diseased

Tarca, Romero, and Draghici 377
individuals,59 treated vs untreated patients,60 or those oflong- vs short-term survival patients,61 etc. Careful de-sign of the experiment, explicit hypothesis formulation,and an adequate sample size are required to obtainvalid conclusions.
Design of the experimentThe simplest experimental design when using cDNAarrays is called a ‘‘reference design.’’ The mRNAextracted and reverse-transcribed from each patient islabeled with the same color dye and hybridized againsta reference mRNA. Therefore, there will be one arrayfor each sample (patient). A criticism of this experimen-tal design is that the least interesting sample, thereference, is measured several times, while each inter-esting sample is only measured once.62,63 Advantages ofthis design include its simplicity as well as flexibility. Ifmore samples are added in the future, a new analysiscan include both new and old arrays.
An alternative experimental design when usingcDNA arrays is the ‘‘loop design.’’ This design uses aloop of experiments in which each sample is hybridizedtwice, once with each color dye, against other varieties.64
Advantages of this design include an improved statisti-cal power which sometimes can be crucial. Disadvan-tages include the complexity of analysis, the sensitivityto loss of data, and the difficulty in adding new samplesnot previously studied. Classical statistical designs, suchas ‘‘complete’’ and ‘‘incomplete block,’’ can and havebeen used very successfully in this area.65
In single channel microarray experiments (eg, Affy-metrix), each biological sample is hybridized on adifferent array and yields an independent measurementfor each transcript. Such independent measurements areconvenient because they can be easily analyzed.
Irrespective of the technology used, replication is keyfor the success of microarray experiments. There are twotypes of replications. One is the ‘‘technical replication,’’in which the same biological sample is assayed severaltimes. This effort allows a quality assessment. However,the more important type of replication is the ‘‘biologicalreplication,’’ which refers to measuring multiple inde-pendent biological samples for each category of interest.
Statistical hypothesis testingIn a class comparison experiment, the goal is to identifythe genes that are differentially expressed between twogroups. The ‘‘null hypothesis’’ is that a given gene onthe array is not differentially expressed between thetwo conditions under study (normal pregnancy vs pre-eclampsia). The ‘‘alternative hypothesis’’ (or ‘‘researchhypothesis’’) is that the expression level of that gene isdifferent between the two conditions. The hypothesistesting is performed by calculating a ‘‘statistic’’ (eg, thet-statistic) on the expression values of the gene of
interest measured in the two groups. The computedvalue of the statistic is then compared with a thresholdta, calculated from a model (eg, the t-distribution) anda desired ‘‘significance level’’ (eg, 1%).
There are two types of errors considered in hypoth-esis testing: ‘‘Type I’’ and ‘‘Type II.’’ A Type I erroroccurs when the null hypothesis is incorrectly rejected.In medicine, if the null hypothesis is associated with‘‘health’’ and the research hypothesis is associated with‘‘disease,’’ a Type I error corresponds to a ‘‘falsepositive,’’ ie, to an incorrect diagnosis of a healthypatient. A Type II error occurs when the null hypothesisis not rejected when, in fact, it is false. In the previousexample, a Type II error would correspond to a ‘‘falsenegative’’ result, ie, a subject having the disease islabeled as healthy. However, the exact meaning of afalse positive and a false negative result depends on thedefinition of the null hypothesis. In microarray experi-ments, if the null hypothesis is defined as stated in theprevious paragraph, a false positive result occurs if thegiven gene is identified as differentially expressed, whilein reality it is not so. A false negative result is failing toidentify the gene as differentially expressed when thegene is actually so.
The significance level (alpha) should be chosen at thebeginning of the experiment before the data becomesavailable, and represents the percentage of Type I error
Figure 3 Two heat maps illustrating the spatial bias problemin 4 sub-arrays of a cDNA array. Each colored element corre-sponds to one gene. Positive log-ratios (log fold change) are
shown in red, while negative log-ratios are shown in green.The top panel shows that most probes in the lower halves ofthe sub-arrays are positive (higher expression in the red chan-
nel). The bottom panel shows the same data after a spatial nor-malization algorithm50 has been applied to remove this bias(artifact).

378 Tarca, Romero, and Draghici
that the investigator is prepared to accept. A chosensignificance level of 1% means that, on average, therewill be one false positive gene for every 100 genesidentified as differentially expressed. The ‘‘statisticalpower’’ of a technique is a measure of its ability toidentify true positives.
Gene selection methodsHistorically, the first method used to identify differen-tially expressed genes was the ‘‘fold change.’’ A changeof at least two-fold (up or down) was consideredmeaningful.66-68 However, the two-fold threshold wasarbitrarily chosen. The arbitrary selection of this thresh-old may give rise to both false negative and false positiveresults. Some genes, such as transcription factors, couldhave important biological effects even though theirchange in expression is less than two-fold.
The fold change of a given gene measured in twosamples is calculated by dividing the two measuredintensities and is, therefore, referred to as a ratio. Theseraw ratios are generally log-transformed (usually log2).This is expected to give a mean log-ratio of zero and im-prove the symmetry of the data distribution. This meansthat a two-fold up- or down-regulation in gene expres-sion is equivalent to log-ratios of C1 or �1, respectively(see Figure 4 for the graphical representation of theseconcepts).
The popularity of the fold change as a method toselect differentially expressed genes is due to its simplic-ity. In addition, in biology, it is generally believed thatthe greater the magnitude of change, the higher thelikelihood of physiologic or pathologic significance.However, this is not always the case (see above). Thefold change method does not take into account thevariance of the expression values measured. Therefore,it is no longer the recommended method for gene selec-tion unless used in combination with other soundstatistical methods.
Hypothesis testing is required for a proper selectionof differentially expressed genes.42,69-72 This involves theformulation of a null and research hypothesis for everygene. A widely used statistical model is the t-distributionand its variants. A t-test compares the difference in themean expression levels between the two groups, takinginto account the variability of the data (difference inmeans between groups divided by the standard devia-tion). However, the standard deviation can be very small(approaching zero) simply by chance. When the denom-inator approaches zero, the value of the t-statistic be-comes large and, therefore, the gene appears to be highlysignificant when, in reality, it may not be so. For thisreason, a family of improved t-tests has been developed.Examples include the ‘‘moderated t-statistic’’73-75 andthe ‘‘S statistic’’ (used in the SAM software).76 Thekey difference between a standard t-statistic and these
newer statistics is that the latter estimate variability bytaking into account information not only from thegene tested, but also from other genes displaying a sim-ilar magnitude of change. This is equivalent to the‘‘shrinkage’’ of the estimated sample variances towarda pooled estimate, resulting in a more stable inferencewhen the number of measurements (arrays) is small.74
Figure 4 illustrates two methods for gene selectionusing a public dataset: fold change and a moderatedt-test.57
Other gene selection methods include the ‘‘unusualratio method,’’77 the ‘‘noise sampling method,’’78,79 andanalysis of variance (ANOVA).42,70 The latter can alsobe used when comparing more than two groups. Studiescomparing these methods are available.69,70
A major problem in the analysis of microarray data isthat many hypotheses are tested simultaneously. Moreprecisely, testing the differential expression of each genein the array involves one hypothesis. The number ofgenes represented in a commercially available array ison the order of tens of thousands. Since any hypothesistesting involves accepting the existence of false positives,when so many hypotheses are tested in parallel, acorrection becomes necessary. This is easily understoodif we recall that the statistical hypothesis testing methodintroduces a percentage of false positives equal to thechosen significance threshold. A significance thresholdof 1% used to test the differential expression of 20,000genes on an array on which there are no truly differen-tially expressed genes will nevertheless yield 200 falsepositives.42 Although methods to correct for multiplecomparisons have been available for a long time80-86
(eg, Bonferroni87 correction), many of these methodsare ill-suited for the analysis of microarray data. Thisis because: 1) most techniques assume variable indepen-dence; and 2) many are considered too stringent.
The requirement of variable independence is clearlynot met in microarray experiments because genes areinvolved in complicated regulatory mechanisms andpathways.88 In fact, the complex interaction betweenthe expression of genes on specific pathways is requiredfor homeostasis and is also part of disease processes.For example, the injection of endotoxin in peripheralblood to human volunteers results in differential expres-sion of families of genes involved in the immuneresponse.89 The expression levels of these genes are,therefore, dependent on each other.
The second drawback of the classical multiple com-parison correction methods is that they are too strin-gent, or ‘‘conservative.’’ For example, the Bonferonicorrection required to adjust for simultaneously testing20,000 genes demands that every individual gene havea P value lower than .0000005 (.01/20,000) in order to besignificant. Such P values would require very small var-iances, which are almost never achieved with the level ofnoise intrinsic to the current microarray technologies.

Tarca, Romero, and Draghici 379
Because of this, it is generally thought that more recenttechniques, such as Holm’s82 or the False DiscoveryRate (FDR),86 are better suited for microarray analysis.
Any correction for multiple comparisons allows theinvestigator to specify the number of false positiveresults at the level of the entire experiment or the‘‘family-wide error rate’’ (FWER). Most investigatorsaccept a FWER of 5%.90
Sample size calculationSample size is a statistical term that refers to the numberof measurements in a given experiment. The sample sizeaffects the validity of a class comparison study. Thecomputation of the sample size requires informationabout the: 1) minimum fold change that the investigatorwishes to reliably detect; 2) gene expression variancewithin each experimental group; and 3) desired statisti-cal power. It is intuitive that larger changes are easier todetect. For instance, if everything else remains the same,more measurements (samples) are needed to reliablydetect a 1.5-fold change rather than a 100-fold change.In other words, a smaller minimum detectable changewill require a larger sample size. Similarly, if a geneshows a high degree of expression variability in thenormal population (has a large variance), more mea-surements will be needed to prove that a real changeexists between the control and the study groups (eg,normal pregnancy vs pre-eclampsia). This means thatlarger variances will require larger sample sizes. Finally,it may be possible to detect 2 to 3 differentially expressedgenes with only a few clinical samples. However, if thegoal is to detect most of the differentially expressedgenes, a large number of samples will be required. Inother words, the greater the desired power, the largerthe sample size. For instance, a few patients with pre-eclampsia will allow the physician to observe 2-3 typicalcomplications associated with it. However, in order toobserve the entire range of complications that areassociated with this disease, a larger number of patientsis needed.
In practice, the cost of the experiment and thenumber of clinical samples available are major determi-nants of the experimental design. Researchers often useas a guideline a commonly accepted90 minimum numberof replicates, such as 5 samples per group. However, thismay not always provide enough power to detect changesand may be completely inadequate for those genes thatexhibit large within-group gene expression variability.
The above discussion focused on the sample sizecalculation for class comparison studies. The readershould note that for other types of applications, such asclass prediction (to be discussed in the next section),other requirements apply. The interested reader isreferred to more detailed resources about sample sizecalculations for microarray experiments.91,92
Class prediction studies
Class prediction experiments are approached using clas-sical statistical methods (eg, discriminant analysis) or‘‘machine learning techniques’’ (eg, neural networks).93-96
Figure 4 A comparison of two gene selection methods illus-
trated in a, A, M vs. A plot and, B, in a volcano plot. Each cir-cle corresponds to one gene. M represents the average log-ratio(log fold-change) in a two group comparison. The 2-fold
change method selects as differentially expressed all genesabove the line M=1 and below the line M=�1 (red lines inboth figures). In contrast, a moderated t-test will only select
the genes represented by solid red circles. Note that not allgenes with a fold change of two or more have significantP values (the P values are shown on the vertical axis of thevolcano plot, in B). Conversely, not all the genes with signifi-
cant P values have a fold change of two or more (note the soliddots between the two red lines).

380 Tarca, Romero, and Draghici
In class prediction applications, the classes are prede-fined (eg, women with and without pre-eclampsia) andthe goal is to build a ‘‘classifier’’ able to distinguish be-tween these classes based on the gene expression profilesof the samples.
In order to achieve this goal, the existing complexrelationship between the class membership (pre-eclamp-sia or normal pregnancy) and the expression values ofthe genes needs to be ‘‘learned’’ first.
A classifier is a mathematical model such aspeZa � g1Cb � g2; where g1 and g2 are the expressionvalues of two potential pre-eclampsia marker genes, aand b are two yet unknown parameters, and pe is a var-iable that indicates whether or not the patient has pre-eclampsia. The high-throughput nature of microarrayexperiments generates a situation in which the numberof variables (number of genes tested) exceeds the num-ber of samples in the experiment. This creates a numberof difficulties that have been collectively described as the‘‘curse of dimensionality.’’97 Hence, the first step in classprediction is a ‘‘dimensionality reduction,’’ which usu-ally involves a ‘‘variable selection.’’ In our example,
Figure 5 k-Nearest Neighbor (k-NN) classification rule. This
method is used in class prediction studies. The figure illustratesthe 10-Nearest Neighbor (10-NN) rule in a two-class predic-tion problem using the expression levels of two genes (gene
1 on the horizontal axis, gene 2 on the vertical axis). The mem-bers of the two classes are designated by circles and squares,and their membership is known in advance. The triangle repre-sents the expression values for these two genes for a new sam-
ple that needs to be classified. The large dotted circle containsthe 10 nearest neighbors of the new sample. A neighbor cor-responds to a sample that has similar expression values.
Among the closest 10 neighbors of the red triangle, 6 aresquares and 4 are circles. Therefore, the 10-NN rule predictsthat the new sample belongs in the square class. Note that
if we used only one neighbor (1-Nearest Neighbor rule), thesame sample would be classified as belonging to the other class(circles), because the closest neighbor of the new sample (red
triangle) is a circle and not a square.
this step would involve identifying the two markergenes, g1 and g2. This step involves a class comparisonand, hence, some of the statistical methods describedin the previous section of this article can be useful.
The model is then ‘‘trained’’ to correctly classify theexisting expression profiles. The training is the process inwhich the internal parameters of a classifier are esti-mated. In our example, this step involves finding thespecific values of a and b. Then, the classifier is tested ina separate group of patients. The purpose of this testingis to ‘‘validate’’ the resulting classifier (model) and calcu-late its diagnostic indices (specificity and sensitivity) andpredicted values (positive and negative). This step is cru-cial in order to obtain an unbiased estimate of the per-formance of the classifier.
The simplest way to assess the performance of aclassifier is the ‘‘hold-out validation’’ procedure in whichthe data is split into two sub-sets: a ‘‘training’’ set anda ‘‘testing’’ set. The training, or learning, set is used tobuild the classifier, while the testing set is used to assessits performance. By keeping one subset of the data asidefor testing purposes, the hold-out validation proceduredeprives the learning process of potentially useful ex-amples that could have been used to improve thetraining or learning step. Alternatives to the hold-outvalidation procedure are ‘‘cross-validation’’ and ‘‘boot-strapping.’’98 These methods use data more efficientlywhile still providing reliable estimates of the perfor-mance of the classifier.
Classifiers vary in complexity from simple lineardiscriminant models and k-Nearest-Neighbor classifiers,to more complex methods, such as neural networks.Special types of neural networks include multilayerperceptrons, radial basis functions, support vectormachines, etc.99-103 Figure 5 illustrates the k-NearestNeighbor approach in a class prediction experiment.
Class discovery studies
Class discovery involves analyzing a given set of geneexpression profiles with the goal of discovering sub-groups that share common features. The example de-scribed earlier in this article involved measuring theexpression profiles of a large number of patients withpre-eclampsia with the goal of classifying them into sub-groups of patients having similar expression profiles.The medical and biological interest of this effort is aimedat understanding the mechanisms of disease underlyingthe syndrome of pre-eclampsia. We have proposed thatpre-eclampsia, just as premature labor, preterm PROM,SGA, and LGA are obstetrical syndromes, is caused bymultiple etiologies or mechanisms of disease.104,105 Oneapproach to discover the mechanisms of disease in-volved is to ask, ‘‘how many sub-groups exist amongpatients with pre-eclampsia?’’ The definition of the sub-groups will be based on the expression profiles of the

Tarca, Romero, and Draghici 381
genes monitored. Class discovery can also be useful toidentify different stages of severity of disease. Althoughthis has been traditionally done using clinical and stan-dard laboratory parameters, it is possible that geneexpression profiling will contain information not mea-surable by standard clinical and routine laboratorymethods. Another application of class discovery ex-periments is to identify gene groups that may behavesimilarly in a disease state. For example, interleukin(IL)-1 is upregulated in the chorioamniotic membranesof patients with histologic chorioamnionitis.14 With agenome-wide survey, it may be possible to determineother genes that have an expression profile similar toIL-1 in patients with chorioamnionitis.
An analysis method often used for class discoveryis ‘‘cluster analysis’’ or clustering. Clustering aims atdividing the data points (genes or samples) into groups(clusters) using measures of similarity, such as correla-tion or Euclidean distance.106-123
Some of the most frequently used clustering tech-niques include ‘‘hierarchical’’ clustering and ‘‘k-means’’clustering. Hierarchical clustering creates a hierarchical,tree-like structure of the data. This is sometimes referredto as a ‘‘dendrogram’’ (Figure 6). The results of cluster-ing may also be displayed using a ‘‘heat map.’’ This termrefers to any display in which intensities are mapped ona color scale (for details on the interpretation of heatmaps, see the legend of Figure 6). The reader shouldbe aware that a heat map does not necessarily meanthat clustering has been performed (for example, Figures3 and 6 are both heat maps, but clustering had beenperformed only in Figure 6).
A hierarchical clustering can be constructed usingeither a ‘‘bottom-up’’ or a ‘‘top-down’’ approach. In a‘‘bottom-up’’ approach, each gene/sample is initiallyconsidered a cluster per se. Subsequently, the clustersare iteratively grouped based on their similarity. Incontrast, the ‘‘top-down’’ approach starts with a uniquecluster containing all data points. This initial cluster isiteratively split into smaller clusters until each clustercontains a single gene.
The k-means clustering algorithm starts with a pre-defined number of cluster centers (k) specified by theuser. Data points (eg, expression profiles) are assignedto these centers based on their distance from (similarityto) each center. Subsequently, an iterative processinvolves re-calculating the position of the cluster centersbased on the current membership of each cluster and re-assigning the samples to the k-clusters. The algorithmcontinues until the clusters are stable, ie, there is nofurther change in the assignment of the data points.42
Besides the type of clustering (eg, hierarchical ork-means), investigators need to make other choiceswhen employing this technique, including the: 1) ‘‘dis-tance metric;’’ and 2) ‘‘type of linkage’’ (if appropriate).The distance used by the clustering defines the desired
notion of similarity between the expression profiles oftwo individual samples. Measures of similarity that areoften used include ‘‘Euclidean’’ distance and ‘‘correla-tion’’ distance, although other options are available. Thelinkage defines the desired notion of similarity betweentwo groups of measurements. For instance, the ‘‘averagelinkage’’ uses the mean of the distances between allpossible pairs of measurements between the two groups.An extensive discussion of these issues, including theproperties of each distance/linkage/clustering algorithm,common pitfalls and recommendations, can be found inthe literature.42
Unfortunately, the popularity of clustering tech-niques has reached such proportions that they are
Figure 6 Hierarchical clustering using one-channel micro-array data. This figure combines a ‘‘heat map,’’ which is the
part of the figure containing colors (red, green, and black),with two dendrograms. Dendrograms are the tree-like struc-tures displayed above and to the left of the heat map. The
rows represent genes identified by the numbers on the rightof the figure. The individual patient samples are shown as col-umns (1 column per sample). The color represents the expres-sion level of the gene. Red represents high expression, while
green represents low expression. The expression levels are con-tinuously mapped on the color scale provided at the top of thefigure. The dendrograms provide some qualitative means of
assessing the similarity between genes and between patientsamples. Note that the columns contain samples from twotypes of patients, A and B. Type A may represent samples
from normal women and type B from women with pre-eclamp-sia. All women with the same diagnosis are grouped (clustered)together. This analysis was performed with the TM4 software
suite (http://www.tm4.org).
382 Tarca, Romero, and Draghici
sometimes mistakenly taken as the ultimate analysismethod of microarray data. Most authors feel the needto include a clustering diagram in their reports. How-ever, clustering is not always appropriate or informative.In some cases, clustering is unnecessary, whereas inothers, it can be misleading.
Let us consider, for instance, a class comparisonproblem in which the goal is to identify differentiallyexpressed genes. Whichever method is used to inferdifferential expression, the result will be a set of geneswith expression values that are different between thegroups. In such circumstances, performing cluster anal-ysis on the subset of differentially regulated genesis unnecessary. If performed, the cluster diagram willbe aesthetically appealing, showing the usual color dif-ferences between the groups of interest. Yet, suchclustering will be devoid of meaningful information.This is because the genes involved in the clustering havebeen chosen precisely because they were different be-tween groups. Clustering brings no additional informa-tion. One could argue that the dendrogram itself (ie, themembership in various subclusters and the relationshipsbetween such clusters) will provide information regard-ing the similarity of various samples. However, thesethings will be drastically influenced by previous geneselection and can seldom be considered as representativeof the samples themselves. A ‘‘pretty’’ clustering figuredoes not offer biological insight per se, nor does it provethe appropriateness of the statistical analysis alreadyperformed.42
Similarly, clustering is not useful in class predictionproblems. Developing a classifier and then clustering thegenes used as discriminatory variables in this modelwould do little to increase the degree of confidence in thequality or validity of the classifier.
Clustering is, however, a useful tool to address a‘‘class discovery problem,’’ in which the patient sampleshave been profiled and the goal is to conduct anexploratory analysis to determine if there are groups(of genes or clinical samples) that share similarities.
Functional profiling
In addition to generating a large amount of dataper experiment, microarray studies create a new chal-lenge: to transform information into knowledge. Theultimate goal of biological sciences in general, andmicroarray experiments in particular, is to improve theunderstanding of the mechanisms of disease. This is notaccomplished by obtaining a list of differentially ex-pressed genes, which is often the output of a classcomparison study. There is growing consensus about theneed to go much further at the level of biologicalprocesses that happen on various pathways.
A computerized analysis approach using Gene On-tology (GO) was proposed to address this task.124,125
This approach takes a list of differentially expressedgenes and uses a statistical analysis to identify the GOcategories (eg, biological processes, etc) that are over-or under-represented in the condition under study.Given a set of differentially expressed genes, this ap-proach compares the number of differentially expressedgenes found in each GO category of interest with thenumber of genes expected to be found in the same cate-gory just by chance. If the observed number is substan-tially different from the one expected just by chance, thecategory is reported as significant. A statistical model(eg, hypergeometric distribution) can be used to calcu-late a P value (Figure 7).126,127 Currently, over 20 soft-ware packages are available to perform this task.30
Despite widespread utilization, this approach has limita-tions related to the type, quality, and structure of the an-notations available.30 An alternative approach foranalysis considers the distribution of the differentiallyexpressed genes in the entire set of genes representedon the array and performs a functional class scoring,which also allows adjustments for gene correla-tions.128,129 Arguably, the state-of-the-art in this cate-gory, the Gene Set Enrichment Analysis (GSEA),130-132
ranks all genes based on the correlation between theirexpression and the given phenotypes. GSEA has alsobeen shown to have some deficiencies.133
Novel ideas have started to appear in this areaaddressing some of the issues above.30 A latent semanticindexing approach (LSI) has been proposed as a toolable to analyze the semantic content of annotation data-bases and find incomplete or incorrect annotations.134
GoToolBox offers a different tool (GO-Proxy) to iden-tify clusters of related terms. MAPPFinder,135 Pathway-Express,136 Cytoscape,137 Pathway Tools,138 PathwayProcessor139 and MetaCore140 are examples of toolsavailable to expand the secondary analysis by includingmetabolic or regulatory pathway information. Other re-lated tools can be found on the GO tools page (http://www.geneontology.org/GO.tools.shtml).
Epistemological foundation for theinterpretation of microarray results
Epistemology is a discipline concerned with the natureand scope of knowledge.141 In other words, epistemol-ogy is aimed at the fundamental questions: What is thevalidity of acquired knowledge in science? What are thelimits of what is knowable? Much of the literature onmicroarray analysis has focused on the development,utilization and interpretation of statistical techniques.However, questions have been raised about the validityof many assumptions made by the statistical techniques.Mehta, Tanik and Allison have proposed an epistemo-logical foundation of statistical methods for high-dimen-sional biology.142 The following section of this articlewill review key concepts used in the literature, such as

Tarca, Romero, and Draghici 383
Figure 7 An example of functional profiling. The figure shows the significant biological processes represented in a set of genesdifferentially expressed between two clinical groups. This type of analysis adds another dimension to the interpretation of micro-
array data. The biological processes are represented as bars on the right side of the graph. The length of the bar represents the num-ber of genes involved in that specific biological process. This analytical tool provides a raw and a corrected p-value for eachbiological process. Note that the biological process ‘‘protein folding’’ is represented by 15 genes, while ‘‘signal transduction’’ is rep-
resented by 18 genes (the number of genes is shown under the ‘‘Total’’ column). However, the P value of ‘‘protein folding’’ is zero,indicating it is highly significant, while the P value of ‘‘signal transduction’’ is higher than the usual .05 significance threshold, show-ing it is not significant. This illustrates the fact that the number of genes in a given category cannot be used to assess its significance.
This analysis was performed with Onto-Express (http://vortex.cs.wayne.edu).124
the sensitivity, accuracy and reproducibility of the dataderived from microarray experiments. Together, theseelements delineate the current epistemological limita-tions of this technology.
SensitivityThe detection limit (sensitivity) ranges between 1 and 10copies of mRNA per cell, depending on the specifictechnology, cell type, etc.143 This sensitivity may be in-sufficient to detect biologically important changes forgenes with low levels of expression, such as transcriptionfactors.144
AccuracyWhen microarray experiments are conducted withintheir optimal dynamic range, measurements reflect themagnitude and direction of expression changes of ap-proximately 70-90% of genes. It is noteworthy that themagnitude of expression changes observed in micro-array experiments is often different from those measuredwith other technologies, such as real-time quantitativereverse transcriptome polymerase chain reaction (qRT-PCR). In general, microarray data exhibit a compres-sion of the fold changes when compared to the foldchange derived from qRT-PCR.145

384 Tarca, Romero, and Draghici
Microarrays (both single and dual channel) tend tomeasure ratios more accurately than absolute expressionlevels. For example, in the most comprehensive study,which measured the expression of 1400 genes by qRT-PCR, Czechowski et al146 found poor correlationbetween normalized data produced by qRT-PCR andnormalized data produced by Affymetrix arrays in thesame RNA sample. However, when the ratios of theexpression levels between two different groups (RNAfrom shoots and roots of Arabidopsis) were compared,the correlation between RT-PCR and microarray resultswas as high as 0.73 for the most highly expressed setof 50 genes. Other studies have made similar obser-vations.143 Collectively, these observations suggest thattwo different methodologies used to assess expressionchange tend to agree when the magnitude of change ingene expression is large.
ReproducibilityMost microarray platforms produce highly repro-ducible within-platform measurements when operatingwithin their range of sensitivity. From this perspective,oligonucleotide arrays (Affymetrix, Agilent and Code-link)147,148 seem to perform better than cDNA microar-rays, providing correlation coefficients of above 0.9 intechnical replicates using the same array type. However,if the same sample is hybridized on different array types(eg, Affymetrix HG95Av2 vs. Affymetrix HG133), thecorrelation coefficients may be lower because the samegenes may be represented by different sets of probes(probe sets) in the two arrays. For other platforms,such as cDNA microarrays or the Mergen platform,the technical reproducibility may also be substantiallylower. For example, the reported Pearson correlationcoefficient between technical replicates can range be-tween the disappointing level of 0.5 and the more reas-suring level of 0.95.148-150
Cross-platform reproducibility studies undertaken sofar148,149,151 have identified two main problems. First,microarrays are not able to accurately measure genes ex-pressed at low levels. Therefore, excluding these genesfrom the comparison will improve the correlation be-tween different platforms.143 A second and very impor-tant problem is that not all probes expected torepresent specific genes perfectly match the targetedgenes as required by the basic principles of the technol-ogy.152,153 This is the equivalent of using the wrongantibody to measure a specific hormone in a radio-immunoassay or an ELISA. This issue can, in principle,be addressed by re-mapping the probe sequences and cal-culating expression values using only those probes thathave the appropriate sequence for the genes they are sup-posed to represent.
Due to the reasons stated above, data from differentplatforms can not easily be compared or merged.154-157
It is important to note that the degree of agreement
among different platforms improves substantially whenthe results are examined from the perspective of the bi-ological process or molecular functions involved (func-tional profiling), rather than from the expression levelsof individual genes. The reader is encouraged to examinethe issues described in this paragraph when assessingstudies comparing different microarray platforms.
Conclusion
Microarrays are able to simultaneously monitor theexpression levels of thousands of genes. Such geneexpression information can be used in medicine forcomparing clinically relevant groups (eg, healthy vsdiseased), uncovering new subclasses of diseases, andpredicting clinically important outcomes, such as theresponse to therapy and survival. However, the im-proved understanding that can be gained with thistechnology is critically dependent on the quality of theanalytical tools employed. This article was written toprovide the obstetrician and gynecologist with an intro-duction to the subject, as well as alert the readershipabout some of the potential pitfalls associated with theanalysis of these large datasets. The literature citedprovides additional sources to improve the understand-ing of this complex subject.
References
1. Schena M, Shalon D, Davis RW, Brown PO. Quantitative mon-
itoring of gene expression patterns with a complementary DNA
microarray. Science 1995;270:467-70.
2. SchenaM.Microarray biochip technology. Sunnyvale, CA: Eaton
Publishing; 2000.
3. Aguan K, Carvajal JA, Thompson LP, Weiner CP. Application
of a functional genomics approach to identify differentially ex-
pressed genes in human myometrium during pregnancy and
labour. Mol Hum Reprod 2000;6:1141-5.
4. Berchuck A, Iversen ES, Lancaster JM, Dressman HK, West M,
Nevins JR, et al. Prediction of optimal versus suboptimal cytore-
duction of advanced-stage serous ovarian cancer with the use of
microarrays. Am J Obstet Gynecol 2004;190:910-25.
5. Bethin KE, Nagai Y, Sladek R, Asada M, Sadovsky Y, Hudson
TJ, et al. Microarray analysis of uterine gene expression in mouse
and human pregnancy. Mol Endocrinol 2003;17:1454-69.
6. Bukowski R, Hankins GD, Saade GR, Anderson GD, Thornton
S. Labor-associated gene expression in the human uterine fundus,
lower segment, and cervix. PLoS Med 2006;3:e169.
7. Chan EC, Fraser S, Yin S, Yeo G, Kwek K, Fairclough RJ, et al.
Human myometrial genes are differentially expressed in labor:
a suppression subtractive hybridization study. J Clin Endocrinol
Metab 2002;87:2435-41.
8. Charpigny G, Leroy MJ, Breuiller-Fouche M, Tanfin Z, Mhaou-
ty-Kodja S, Robin P, et al. A functional genomic study to identify
differential gene expression in the preterm and term human myo-
metrium. Biol Reprod 2003;68:2289-96.
9. Chien EK, Tokuyama Y, Rouard M, Phillippe M, Bell GI.
Identification of gestationally regulated genes in rat myometrium
by use of messenger ribonucleic acid differential display. Am J
Obstet Gynecol 1997;177:645-52.

Tarca, Romero, and Draghici 385
10. Chin KV, Seifer DB, Feng B, Lin Y, Shih WC. DNA micro-
array analysis of the expression profiles of luteinized granulosa
cells as a function of ovarian reserve. FertilSteril 2002;77:
1214-8.
11. Critchely HOD, Robertson KA, Forster T, Henderson TA,
Williams ARW, Ghazal P. Gene expression profiling of mid
to late secretory phase endometrial biopsies from women with
menstrual complaint. Am J Obstet Gynecol 2006;195:406.e1-14.
12. Esplin MS, Fausett MB, Peltier MR, Hamblin S, Silver RM,
Branch DW, et al. The use of cDNA microarray to identify differ-
entially expressed labor-associated genes within the human myo-
metrium during labor. Am J Obstet Gynecol 2005;193:404-13.
13. Giudice LC, Telles TL, Lobo S, Kao L. The molecular basis for
implantation failure in endometriosis: on the road to discovery.
Ann NY Acad Sci 2002;955:252-64.
14. Haddad R, Tromp G, Kuivaniemi H, Chaiworapongsa T, Kim
YM,MazorM, et al. Human spontaneous laborwithout histologic
chorioamnionitis is characterized by an acute inflammation gene
expression signature. Am J Obstet Gynecol 2006;195:394.e1-24.
15. Keelan JA, Blumenstein M, Helliwell RJ, Sato TA, Marvin KW,
Mitchell MD. Cytokines, prostaglandins andparturition–a review.
Placenta 2003;24:S33-46.
16. Leppert PC, Catherino WH, Segars J. A new hypothesis about
the origin of uterine fibroids based on gene expression profiling
with microarrays. Am J Obstet Gynecol 2006;195:415-20.
17. Maynard SE, Min JY, Merchan J, Lim KH, Li J, Mondal S, et al.
Excess placental soluble fms-like tyrosine kinase 1 (sFlt1) may
contribute to endothelial dysfunction, hypertension, and protein-
uria in preeclampsia. J Clin Invest 2003;111:649-58.
18. Muhle RA, Pavlidis P, Grundy WN, Hirsch E. A high-through-
put study of gene expression in preterm labor with a subtrac-
tive microarray approach. Am J Obstet Gynecol 2001;185:
716-24.
19. Romero R, Kuivaniemi H, Tromp G. Functional genomics and
proteomics in term and preterm parturition. J Clin Endocrinol
Metab 2002;87:2431-4.
20. Romero R, Kuivaniemi H, Tromp G. Functional genomics and
proteomics in term and preterm parturition. J Clin Endocrinol
Metab 2002;87:2431-4.
21. Romero R, Tarca AL, Tromp G. Insights into the Physiology of
Childbirth Using Transcriptomics. PLoS Med 2006;3:e276.
22. Soleymanlou N, Jurisica I, Nevo O, Ietta F, Zhang X, Zamudio
S, et al. Molecular evidence of placental hypoxia in preeclampsia.
J Clin Endocrinol Metab 2005;90:4299-308.
23. Tromp G, Kuivaniemi H, Romero R, Chaiworapongsa T, Kim
YM, Kim MR, et al. Genome-wide expression profiling of fetal
membranes reveals a deficient expression of proteinase inhibitor
3 in premature rupture of membranes. Am J Obstet Gynecol
2004;191:1331-8.
24. Venkatesha S, Toporsian M, Lam C, Hanai JI, Mammoto T,
Kim YM, et al. Soluble endoglin contributes to the pathogenesis
of preeclampsia. Nat Med 2006;12:642-9.
25. Ward K. Microarray technology in obstetrics and gynecology:
a guide for clinicians. Am J Obstet Gynecol 2006;195:364-72.
26. Zhang X, Jafari N, Barnes RB, Confino E, Milad M, Kazer RR.
Studies of gene expression in human cumulus cells indicate pen-
traxin 3 as a possible marker for oocyte quality. Fertil Steril
2005;83:1169-79.
27. Knudsen S. Guide to analysis of DNA microarray data. Hobo-
ken, NJ: John Wiley & Sons, Inc.; 2004.
28. Gibson G, Muse SV. A primer of genome science. Sunderland,
MA: Sinauer Associates, Inc.; 2002.
29. Analysing gene expression: a handbook of methods, possibilities,
and pitfalls. Weinheim, Germany: Wiley-VCH; 2003.
30. Khatri P, Draghici S. Ontological analysis of gene expression
data: current tools, limitations, and open problems. Bioinfor-
matics 2005;21:3587-95.
31. Yang YH, Buckley MJ, Dudoit S, Speed TP. Comparison of
methods for image analysis on cDNA microarray data. J Comput
Graph Stat 2002;11:108-36.
32. Affymetrix. Statistical algorithms description document. 2002.
Affymetrix, Inc.
33. Wu Z, Irizarry R, Gentleman RC, Murillo FM, Spencer F. A
model based background adjustment for oligonucleotide expres-
sion arrays. Working paper 1. 2004. Johns Hopkins University,
Department of Biostatistics.
34. Irizarry RA, Hobbs B, Collin F, Beazer-Barclay YD, Antonellis
KJ, Scherf U, et al. Exploration, normalization, and summaries
of high density oligonucleotide array probe level data. Biostatis-
tics 2003;4:249-64.
35. Long AD, Mangalam HJ, Chan BY, Tolleri L, Hatfield GW,
Baldi P. Improved statistical inference from DNA microarray
data using analysis of variance and a Bayesian statistical frame-
work. Analysis of global gene expression in Escherichia coli
K12. J Biol Chem 2001;276:19937-44.
36. Speed T. Hints and prejudices - always log spot intensities and
ratios. 2000. University of California, Berkeley.
37. Cui X, Kerr MK, Churchill GA. Transformations for cDNA
microarray data. Stat Appl Genet Mol Biol 2003;2:Article4.
38. Dudoit S, Yang YH, Speed T, Callow MJ. Statistical methods for
identifying differentially expressed genes in replicated cDNA
microarray experiments. Statistica Sinica 2002;12:111-39.
39. Quackenbush J. Computational analysis of microarray data.
Nat Rev Genet 2001;2:418-27.
40. Li C, Wong WH. Model-based analysis of oligonucleotide arrays:
expression index computation and outlier detection. Proc Natl
Acad Sci USA 2001;98:31-6.
41. Chen Y, Dougherty ER, Bittner ML. Ratio-based decisions and
the quantitative analysis of cDNA microarray images. J Biomed
Optics 1997;2:364-74.
42. Draghici S. Data analysis tools for DNA microarrays. Boca
Raton (FL): Chapman and Hall/CRC Press; 2003.
43. Finkelstein DB, Ewing R, Gollub J, Sterky F, Somerville S,
Cherry JM. Iterative linear regression by sector. In: Lin SM,
Johnson KF, editors. Methods of microarray data analysis. Cam-
bridge, MA: Kluwer Academic; 2002. p. 57-68.
44. Hegde P, Qi R, Abernathy K, Gay C, Dharap S, Gaspard R,
et al. A concise guide to cDNA microarray analysis. Biotechni-
ques 2000;29:548-4, 556.
45. Houts TM. Improved 2-color exponential normalization for mi-
croarray analyses employing cyanine dyes. Lin, S. 2000. Durham,
NC, Duke University Medical Center. Proceedings of CAMDA
2000, ‘‘Critical assessment of techniques for microarray data
mining’’.
46. Kepler TB, Crosby L, Morgan KT. Normalization and analysis
of DNA microarray data by self-consistency and local regression.
Genome Biol 2002;3:RESEARCH0037.
47. Newton MA, Kendziorski CM, Richmond CS, Blattner FR, Tsui
KW. On differential variability of expression ratios: improving
statistical inference about gene expression changes from microar-
ray data. J Comput Biol 2001;8:37-52.
48. Schuchhardt J, Beule D, Malik A, Wolski E, Eickhoff H, Lehrach
H, et al. Normalization strategies for cDNA microarrays. Nucleic
Acids Res 2000;28:E47.
49. Stanford University. Arabidopsis. Normalization method com-
parison. 2001.
50. Tarca AL, Cooke JE, Mackay J. A robust neural networks
approach for spatial and intensity-dependent normalization of
cDNA microarray data. Bioinformatics 2005;21:2674-83.
51. Wang Y, Lu J, Lee R, Gu Z, Clarke R. Iterative normalization of
cDNA microarray data. IEEE Trans Inf Technol Biomed 2002;6:
29-37.
52. Yang S, Dudoit S, Luu P, Speed TP. Normalization for cDNA
microarray data. Proc of SPIE BiOS 2001;4266:31.

386 Tarca, Romero, and Draghici
53. Yang Y, Buckley MJ, Dudoit S, Speed TP. Comparison of
methods for image analysis on cDNA. 2000. University of Cali-
fornia, Berkeley.
54. Yang YH, Dudoit S, Luu P, Lin DM, Peng V, Ngai J, et al.
Normalization for cDNA microarray data: a robust composite
method addressing single and multiple slide systematic variation.
Nucleic Acids Res 2002;30:e15.
55. Yue H, Eastman PS, Wang BB, Minor J, Doctolero MH, Nuttall
RL, et al. An evaluation of the performance of cDNA microar-
rays for detecting changes in global mRNA expression. Nucleic
Acids Res 2001;29:E41.
56. Bolstad BM, Irizarry RA, Astrand M, Speed TP. A comparison
of normalization methods for high density oligonucleotide
array data based on variance and bias. Bioinformatics 2003;19:
185-93.
57. Gentleman RC, Carey VJ, Bates DM, Bolstad B, Dettling M,
Dudoit S, et al. Bioconductor: open software development for
computational biology and bioinformatics. Genome Biol 2004;
5:R80.
58. Dudoit S, Yang YH, Callow M, Speed T. Statistical models for
identifyingdifferentially expressedgenes in replicated cDNAmicro-
array experiments. 578. 2000. University of California, Berkeley.
59. Beer DG, Kardia SL, Huang CC, Giordano TJ, Levin AM,
Misek DE, et al. Gene-expression profiles predict survival of pa-
tients with lung adenocarcinoma. Nat Med 2002;8:816-24.
60. Swagell CD, Henly DC, Morris CP. Expression analysis of a hu-
man hepatic cell line in response to palmitate. Biochem Biophys
Res Commun 2005;328:432-41.
61. Pass HI, Liu Z, Wali A, Bueno R, Land S, Lott D, et al. Gene
expression profiles predict survival and progression of pleural
mesothelioma. Clin.Cancer Res 2004;10:849-59.
62. Kerr MK, Martin M, Churchill GA. Analysis of variance for
gene expression microarray data. J Comput Biol 2000;7:819-37.
63. Kerr MK, Churchill GA. Statistical design and the analysis of
gene expression microarray data. Genet Res 2001;77:123-8.
64. Kerr MK, Afshari CA, Bennett L, Bushel P, Martinez J, Walker
NJ, et al. Statistical analysis of a gene expression microarray
experiment with replication. Statistica Sinica 2001;12:203-18.
65. Simon R, Radmacher MD, Dobbin K. Design of studies using
DNA microarrays. Genet Epidemiol 2002;23:21-36.
66. DeRisi J, Penland L, Brown PO, Bittner ML, Meltzer PS, Ray M,
et al. Use of a cDNA microarray to analyse gene expression pat-
terns in human cancer. Nat Genet 1996;14:457-60.
67. ter Linde JJ, Liang H, Davis RW, Steensma HY, van Dijken JP,
Pronk JT. Genome-wide transcriptional analysis of aerobic and
anaerobic chemostat cultures of Saccharomyces cerevisiae. J Bac-
teriol 1999;181:7409-13.
68. Wellmann A, Thieblemont C, Pittaluga S, Sakai A, Jaffe ES,
Siebert P, et al. Detection of differentially expressed genes in
lymphomas using cDNA arrays: identification of clusterin as
a new diagnostic marker for anaplastic large-cell lymphomas.
Blood 2000;96:398-404.
69. Draghici S. Statistical intelligence: effective analysis of high-
density microarray data. Drug Discov Today 2002;7:S55-63.
70. Nadon R, Shoemaker J. Statistical issues with microarrays: pro-
cessing and analysis. Trends Genet 2002;18:265-71.
71. Sebastiani P, Gussoni E. KI, M.F. R. Statistical challenges in
functional genomics. Stat Sci 2003;18:33-70.
72. Budhraja V, Spitznagel E, Schaiff WT, Sadovsky Y. Incorpora-
tion of gene-specific variability improves expression analysis using
high-density DNA microarrays. BMC Biol 2003;1:1.
73. Lonnstedt I, Speed T. Replicated microarray data. Statistica
Sinica 2002;12:31-46.
74. Smyth GK, Yang YH, Speed T. Statistical issues in cDNA micro-
array data analysis. Methods Mol Biol 2003;224:111-36.
75. Smyth GK. Limma: linear models for microarray data. New
York, NY: Springer; 2005.
76. Tusher VG, Tibshirani R, Chu G. Significance analysis of micro-
arrays applied to the ionizing radiation response. Proc Natl Acad
Sci USA 2001;98:5116-21.
77. Tao H, Bausch C, Richmond C, Blattner FR, Conway T. Func-
tional genomics: expression analysis of Escherichia coli growing
on minimal and rich media. J Bacteriol 1999;181:6425-40.
78. Draghici S, Kuklin A, Hoff B, Shams S. Experimental design,
analysis of variance and slide quality assessment in gene ex-
pression arrays. Curr Opin Drug Discov Devel 2001;4:332-7.
79. Draghici S, Kulaeva O, Hoff B, Petrov A, Shams S, Tainsky MA.
Noise sampling method: an ANOVA approach allowing robust
selection of differentially regulated genes measured by DNA
microarrays. Bioinformatics 2003;19:1348-59.
80. Dudoit S, Shaffer J, Boldrick J. Multiple hypothesis testing in
microarray experiments. Stat Sci 2003;18:71-103.
81. Hochberg Y, Tamhane AC. Multiple comparison procedures.
New York, NY: John Wiley and Sons, Inc.; 1987.
82. Holm S. A simple sequentially rejective multiple test procedure.
Scand J Stat 1979;6:65-70.
83. Shaffer JP. Modified sequentially rejective multiple test proce-
dures. J Am Stat Assoc 1986;81:826-31.
84. Shaffer JP. Multiple hypothesis testing. Ann Rev Psych 1995;46:
561-84.
85. Westfall PH, Young SS. Resampling-based multiple testing:
examples and methods for p-value adjustment. New York, NY:
Wiley; 1993.
86. Benjamini Y, Hochberg Y. Controlling the false discovery rate:
a practical and powerful approach to multiple testing. J Royal
Stat Soc B 1995;57:289-300.
87. Bonferroni CE. Il calcolo delle assicurazioni su gruppi di teste.
In: Studi in Onore del Professore Salvatore Ortu Carboni.
Rome: 1935. p. 13-60.
88. Quackenbush J. Microarray analysis and tumor classification.
N Engl J Med 2006;354:2463-72.
89. Calvano SE, Xiao W, Richards DR, Felciano RM, Baker HV,
Cho RJ, et al. A network-based analysis of systemic inflammation
in humans. Nature 2005;437:1032-7.
90. Allison DB, Cui X, Page GP, Sabripour M. Microarray data
analysis: from disarray to consolidation and consensus. Nat
Rev Genet 2006;7:55-65.
91. Dobbin K, Simon R. Comparison of microarray designs for
class comparison and class discovery. Bioinformatics 2002;18:
1438-45.
92. Pan W, Lin J, Le CT. How many replicates of arrays are required
to detect gene expression changes in microarray experiments?
A mixture model approach. Genome Biol 2002;3:research0022.
93. Dubitzky W, Granzow M, Berrar D. Data mining and machine
learning methods for microarray analysis. In: Lin SM,
Johnson KF, editors. Methods of microarray data analysis. Cam-
bridge (MA): Kluwer Academic; 2002. p. 5-22.
94. Dubitzky W, Granzow M, Berrar D. Comparing symbolic and
subsymbolic machine learning approaches to classification of can-
cer and gene identification. In: Lin SM, Johnson KF, editors.
Methods of microarray data analysis. Cambridge (MA): Kluwer
Academic; 2002. p. 151-66.
95. Horwood E. Machine learning, neural and statistical classifica-
tion. Available at: http://www.amsta.leeds.ac.uk/charles/statlog/,
1994.
96. Hwang KB, Cho DY, Park SW, Kim SD, Zhang BT. Applying
machine learning techniques to analysis of gene expression data:
cancer diagnosis. In: Lin SM, Johnson KF, editors. Methods of
microarray data analysis. Cambridge, MA: Kluwer Academic;
2002. p. 167-82.
97. Bellman R. Adaptive control processes. Princeton, NJ: Princeton
University Press; 1961.
98. Efron B, Tibshirani RJ. An introduction to bootstrap. London,
UK: Chapman and Hall; 1993.

Tarca, Romero, and Draghici 387
99. Cortes C, Vapnik V. Support-vector networks. Machine Learning
1995;20:273-97.
100. Dudoit S, Fridlyand J, Speed T. Comparison of discrimination
methods for the classification of tumors using gene expression
data. J Am Stat Assoc 2002;97:77-87.
101. Hagan MT, Demuth HB, Beale MH. Neural network design.
Boston, MA: Brooks Cole; 1995.
102. Haykin S. Neural networks - a comprehensive foundation. Upper
Saddle River, NJ: Prentice Hall; 1999.
103. Rogers S, Williams R, Campbell C. Class prediction with micro-
array datasets. Bioinformatics using computational intelligence
paradigms. Cambridge (MA): Springer; 2005. p. 119-42.
104. Romero R. The child is the father of the man. Prenat Neonat
Med 1996;1:8-11.
105. Romero R, Espinoza J, Mazor M, Chaiworapongsa T. The pre-
term parturition syndrome. In: Critchley H, Bennett P,
Thornton S, editors. Preterm birth. London, United Kingdom:
RCOG Press; 2004. p. 28-60.
106. Aach J, Rindone W, Church GM. Systematic management and
analysis of yeast gene expression data. Genome Res 2000;10:
431-45.
107. Ben Dor A, Shamir R, Yakhini Z. Clustering gene expression
patterns. J Comput Biol 1999;6:281-97.
108. Brazma A, Jonassen I, Vilo J, Ukkonen E. Predicting gene regu-
latory elements in silico on a genomic scale. Genome Res 1998;8:
1202-15.
109. Claverie JM. Computational methods for the identification of dif-
ferential and coordinated gene expression. Hum Mol Genet 1999;
8:1821-32.
110. Eisen MB, Spellman PT, Brown PO, Botstein D. Cluster analysis
and display of genome-wide expression patterns. Proc Natl Acad
Sci USA 1998;95:14863-8.
111. Ewing RM, Ben Kahla A, Poirot O, Lopez F, Audic S, Claverie
JM. Large-scale statistical analyses of rice ESTs reveal correlated
patterns of gene expression. Genome Res 1999;9:950-9.
112. Getz G, Levine E, Domany E. Coupled two-way clustering anal-
ysis of gene microarray data. Proc Natl Acad Sci USA 2000;97:
12079-84.
113. Herwig R, Poustka AJ, Muller C, Bull C, Lehrach H, O’Brien J.
Large-scale clustering of cDNA-fingerprinting data. Genome Res
1999;9:1093-105.
114. Heyer LJ, Kruglyak S, Yooseph S. Exploring expression data:
identification and analysis of coexpressed genes. Genome Res
1999;9:1106-15.
115. Pietu G, Mariage-Samson R, Fayein NA, Matingou C, Eveno E,
Houlgatte R, et al. The Genexpress IMAGE knowledge base of
the human brain transcriptome: a prototype integrated resource
for functional and computational genomics. Genome Res 1999;
9:195-209.
116. Tamayo P, Slonim D, Mesirov J, Zhu Q, Kitareewan S,
Dmitrovsky E, et al. Interpreting patterns of gene expression
with self-organizing maps: methods and application to hema-
topoietic differentiation. Proc Natl Acad Sci USA 1999;96:
2907-12.
117. Tsoka S, Ouzounis CA. Recent developments and future direc-
tions in computational genomics. FEBS Lett 2000;480:42-8.
118. van Helden J, Rios AF, Collado-Vides J. Discovering regulatory
elements in non-coding sequences by analysis of spaced dyads.
Nucleic Acids Res 2000;28:1808-18.
119. Wang ML, Belmonte S, Kim U, Dolan M, Morris JW, Goodman
HM. A cluster of ABA-regulated genes on Arabidopsis thaliana
BAC T07M07. Genome Res 1999;9:325-33.
120. White KP, Rifkin SA, Hurban P, Hogness DS. Microarray anal-
ysis of Drosophila development during metamorphosis. Science
1999;286:2179-84.
121. Zhang MQ. Large-scale gene expression data analysis: a new
challenge to computational biologists. Genome Res 1999;9:681-8.
122. Zhu J, Zhang MQ. Cluster, function and promoter: analysis of
yeast expression array. Pac Symp Biocomput 2000;479-90.
123. Bethin KE, Nagai Y, Sladek R, Asada M, Sadovsky Y, Hudson
TJ, et al. Microarray analysis of uterine gene expression in mouse
and human pregnancy. Mol Endocrinol 2003;17:1454-69.
124. Draghici S, Khatri P, Martins RP, Ostermeier GC, Krawetz SA.
Global functional profiling of gene expression. Genomics 2003;
81:98-104.
125. Khatri P, Draghici S, Ostermeier GC, Krawetz SA. Profiling gene
expression using onto-express. Genomics 2002;79:266-70.
126. Draghici S, Khatri P, Bhavsar P, Shah A, Krawetz S, Tainsky
MA. Onto-Tools, The toolkit of the modern biologist: Onto-
Express, Onto-Compare, Onto-Design and Onto-Translate.
Nucleic Acid Research 2003;31:3775-81.
127. Khatri P, Bhavsar P, Bawa G, Draghici S. Onto-Tools: an ensem-
ble of web-accessible, ontology-based tools for the functional
design and interpretation of high-throughput gene expression
experiments. Nucleic Acids Research 2004;32:W449-56.
128. Pavlidis P, Qin J, Arango V, Mann JJ, Sibille E. Using the gene
ontology for microarray data mining: a comparison of methods
and application to age effects in human prefrontal cortex. Neuro-
chem Res 2004;29:1213-22.
129. Goeman JJ, van de Geer SA, de Kort F, van Houwelingen HC.
A global test for groups of genes: testing association with a clin-
ical outcome. Bioinformatics 2004;20:93-9.
130. Mootha VK, Lindgren CM, Eriksson KF, Subramanian A, Sihag
S, Lehar J, et al. PGC-1alpha-responsive genes involved in oxida-
tive phosphorylation are coordinately downregulated in human
diabetes. Nat Genet 2003;34:267-73.
131. Subramanian A, Tamayo P, Mootha VK, Mukherjee S, Ebert BL,
Gillette MA, et al. Gene set enrichment analysis: a knowledge-
based approach for interpreting genome-wide expression profiles.
Proc Natl Acad Sci USA 2005;102:15545-50.
132. Tian L, Greenberg SA, Kong SW, Altschuler J, Kohane IS,
Park PJ. Discovering statistically significant pathways in expres-
sion profiling studies. Proc Natl Acad Sci USA 2005;102:13544-9.
133. Damian D, Gorfine M. Statistical concerns about the GSEA
procedure. Nat Genet 2004;36:663.
134. Khatri P, Done B, Rao A, Done A, Draghici S. A semantic anal-
ysis of the annotations of the human genome. Bioinformatics
2005;21:3416-21.
135. Doniger SW, Salomonis N, Dahlquist KD, Vranizan K, Lawlor
SC, Conklin BR. MAPPFinder: using Gene Ontology and Gen-
MAPP to create a global gene-expression profile from microarray
data. Genome Biol 2003;4:R7.
136. Khatri P, Sellamuthu S, Malhotra P, Amin K, Done A, Draghici
S. Recent additions and improvements to the Onto-Tools. Nu-
cleic Acids Res 2005;33:W762-5.
137. Shannon P, Markiel A, Ozier O, Baliga NS, Wang JT, Ramage
D, et al. Cytoscape: a software environment for integrated models
of biomolecular interaction networks. Genome Res 2003;13:
2498-504.
138. Karp PD, Paley S, Romero P. The Pathway Tools software.
Bioinformatics 2002;18 Suppl 1:S225-32.
139. Grosu P, Townsend JP, Hartl DL, Cavalieri D. Pathway Proces-
sor: a tool for integrating whole-genome expression results into
metabolic networks. Genome Res 2002;12:1121-6.
140. MetaCore, GeneGo, St Joseph, MI. Available at: http://www.
genego.com. 2003.
141. Audi R. Epistemology: a contemporary introduction to the the-
ory of knowledge. New York, NY: Routledge; 2003.
142. Mehta T, Tanik M, Allison DB. Towards sound epistemological
foundations of statistical methods for high-dimensional biology.
Nat Genet 2004;36:943-7.
143. Draghici S, Khatri P, Eklund AC, Szallasi Z. Reliability and
reproducibility issues in DNA microarray measurements. Trends
Genet 2006;22:101-9.

388 Tarca, Romero, and Draghici
144. Holland MJ. Transcript abundance in yeast varies over six orders
of magnitude. J Biol Chem 2002;277:14363-6.
145. Yuen T, Wurmbach E, Pfeffer RL, Ebersole BJ, Sealfon SC.
Accuracy and calibration of commercial oligonucleotide and cus-
tom cDNA microarrays. Nucleic Acids Res 2002;30:e48.
146. Czechowski T, Bari RP, Stitt M, Scheible WR, Udvardi MK.
Real-time RT-PCR profiling of over 1400 Arabidopsis transcrip-
tion factors: unprecedented sensitivity reveals novel root- and
shoot-specific genes. Plant J 2004;38:366-79.
147. Bakay M, Chen YW, Borup R, Zhao P, Nagaraju K, Hoffman
EP. Sources of variability and effect of experimental approach
on expression profiling data interpretation. BMC Bioinformatics
2002;3:4.
148. Bammler T, Beyer RP, Bhattacharya S, Boorman GA, Boyles A,
Bradford BU, et al. Standardizing global gene expression analysis
between laboratories and across platforms. Nat Methods 2005;2:
351-6.
149. Jarvinen AK, Hautaniemi S, Edgren H, Auvinen P, Saarela J,
Kallioniemi OP, et al. Are data from different gene expression
microarray platforms comparable? Genomics 2004;83:1164-8.
150. Jenssen TK, Langaas M, Kuo WP, Smith-Sorensen B, Myklebost
O, Hovig E. Analysis of repeatability in spotted cDNA microar-
rays. Nucleic Acids Res 2002;30:3235-44.
151. Carter SL, Eklund AC, Mecham BH, Kohane IS, Szallasi Z.
Redefinition of Affymetrix probe sets by sequence overlap with
cDNA microarray probes reduces cross-platform inconsistencies
in cancer-associated gene expression measurements. BMC Bioin-
formatics 2005;6:107.
152. Halgren RG, Fielden MR, Fong CJ, Zacharewski TR. Assess-
ment of clone identity and sequence fidelity for 1189 IMAGE
cDNA clones. Nucleic Acids Res 2001;29:582-8.
153. Taylor E, Cogdell D, Coombes K, Hu L, Ramdas L, Tabor A,
et al. Sequence verification as quality-control step for production
of cDNA microarrays. Biotechniques 2001;31:62-5.
154. Kuo WP, Jenssen TK, Butte AJ, Ohno-Machado L, Kohane IS.
Analysis of matched mRNA measurements from two different
microarray technologies. Bioinformatics 2002;18:405-12.
155. Lee EW, Michalkiewicz M, Kitlinska J, Kalezic I, Switalska H,
Yoo P, et al. Neuropeptide Y induces ischemic angiogenesis
and restores function of ischemic skeletal muscles. J Clin Invest
2003;111:1853-62.
156. Mecham BH, Klus GT, Strovel J, Augustus M, Byrne D, Bozso
P, et al. Sequence-matched probes produce increased cross-plat-
form consistency and more reproducible biological results in
microarray-based gene expression measurements. Nucleic Acids
Res 2004;32:e74.
157. Tan PK, Downey TJ, Spitznagel EL Jr, Xu P, Fu D, Dimitrov DS,
et al. Evaluation of gene expression measurements from com-
mercial microarray platforms. Nucleic Acids Res 2003;31:
5676-84.