Analysis of Kenya’s expenditure in education, future ...
84
November 2016 Analysis of Kenya’s expenditure in education, future sector cost scenarios and benefits of curriculum reform Final report Mamy Rakotomalala, Nicola Ruddle, Polycarp Otieno, Amos Kaburu
Transcript of Analysis of Kenya’s expenditure in education, future ...
November 2016
Analysis of Kenya’s expenditure in
education, future sector cost scenarios
and benefits of curriculum reform
Final report
Mamy Rakotomalala, Nicola Ruddle, Polycarp Otieno, Amos Kaburu
Analysis of Kenya’s expenditure in education, future sector cost scenarios and benefits of curriculum reform
This assessment is being carried out by Oxford Policy Management. The project manager is Nicola Ruddle. The lead consultant is Mamy Rakotomalala, and remaining team members are Polycarp Otieno and Amos Kaburu. For further information contact [email protected].
The contact point for the client is Shweta Sandilya ([email protected]).
Oxford Policy Management Limited Level 3, Clarendon House Tel +44 (0) 1865 207 300
52 Cornmarket St Fax +44 (0) 1865 207 301
Oxford OX1 3HJ Email [email protected]
Registered in England: 3122495 United Kingdom Website www.opml.co.uk
© Oxford Policy Management i
Acknowledgements
We are very grateful to all of the people who have contributed to the development of this report. All
were interested in our work and, more importantly, in improving education through the curriculum
reform in Kenya. Staff from MOEST, KICD, KNBS, UNICEF and other partners were all willing to
describe their work, share information, and guide the development of this assignment. A group of
stakeholders kindly joined us for a two day workshop in July 2016 which was critical to improving
the analysis and developing the scenarios. In particular, Darius Mogaka Ogutu, Director for Policy,
Partnerships & East African Community Affairs in the State Department of Basic Education, who
has championed this work from the beginning. The UNICEF team – Daniel Baheta, Shweta
Sandilya and Ousmane Niang – have been critical in initiating and guiding this work. Finally, we
are grateful to Georgina Rawle for providing valuable comments on an earlier version of this report.

Analysis of Kenya’s expenditure in education, future sector cost scenarios and benefits of curriculum reform
© Oxford Policy Management ii
Table of contents
List of Tables iv
List of Figures v
List of boxes v
List of abbreviations vi
1 Introduction 1
2 Macroeconomic context 3
2.1 Total and school age population 3
2.2 Gross domestic product 3
2.3 Government resources and spending 4
3 Education sector overview 6
3.1 Institutional structure 6
3.2 Strategy and policy framework 7
3.3 Sector performance 8
3.4 Review of enrolment trends 10
3.4.1 Education coverage 13
4 Education sector budget and expenditure 15
4.1 Review of public education expenditure 16
4.1.1 International comparison 17 4.1.2 Counties’ spending on ECDE 18 4.1.3 Budget execution 19
4.2 Government effort to education 19
4.3 Education budget by sub-sectors of education 20
4.3.1 Spending on the NESP priorities 23
4.4 Review of salary and non-salary expenditure 24
4.5 Recurrent Costs per Pupil/Student 24
4.6 Off-budget spending on education 27
4.6.1 Development partners 27 4.6.2 Parents 28
5 Kenya’s Curriculum Reform 29
5.1 Evolution and rationale for curriculum reforms in Kenya 29
5.2 Curriculum reform process 31
5.2.1 Major proposals of the curriculum reform 31
6 Education projection model 33
6.2 Population growth projections 34
6.3.1 Developing the scenarios 36 6.3.2 Enrolment projections in basic education 37 6.3.3 Projected recurrent costs of basic education 38 6.3.4 Post-secondary education: enrolment and recurrent costs 39 6.3.5 Projected recurrent resource envelope and fiscal gap 40 6.3.6 Required resource envelope 41
6.4 Development costs 43
6.4.1 Short term, transition cost of curriculum development 43 6.4.2 Long term development expenditure 43
7 Benefits of the curriculum reform 45
Analysis of Kenya’s expenditure in education, future sector cost scenarios and benefits of curriculum reform
© Oxford Policy Management iii
7.1 Benefits included in the projection model 45
7.2 International experience 47
7.2.1 Issues in reviewing international literature on curriculum reform 47 7.2.2 Overall theory of change for curriculum and pedagogy 48 7.2.3 Competence based curricula and child-centred pedagogy 49 7.2.4 Details of the design: teacher training, content and materials 50 7.2.5 Introducing local content 51 7.2.6 Assessment 51 7.2.7 Years of schooling 52 7.2.8 Use of ICT 52 7.2.9 Equity 53 7.2.10 Conclusions from international experience 54
7.3 Perspectives from Kenya 55
8 Conclusions 56
8.1.1 Recent trends in education finance 56 8.1.2 Kenya’s curriculum reform 57 8.1.3 Education projection model 57 8.1.4 Benefits of curriculum reform 58 8.1.5 Implications and recommendations 58
References / Bibliography 62
Annex A List of people and institutions met 65
A.1 List of people met or held discussions with in inception phase 65
Annex B County level data 66
B.1 ECDE gross and net enrolment rates, 2014 66 B.2 Primary gross and net enrolment rates, 2014 66 B.3 Secondary gross and net enrolment rates, 2014 67 B.4 County Spending on ECDE, 2014/15 (Ksh millions) 68
Annex C Curriculum development 70
C.1 Curriculum development activities, timeline and budget 70
Annex D Projection Scenarios Assumptions and Indicators 73
D.1 Summary of Main Indicators by Scenario 73
Annex E Stakeholder mapping 75
E.1 Table of stakeholders with interests or information relevant to the curriculum reform 75

Analysis of Kenya’s expenditure in education, future sector cost scenarios and benefits of curriculum reform
© Oxford Policy Management iv
List of Tables
Table 1 Total Population and School Age Population ...................................................................... 3 Table 2 Gross domestic product ..................................................................................................... 4 Table 3 Government resources and spending as a % of GDP ........................................................ 5 Table 4 Numbers of out of school children by education level attained, 2014 .................................. 9 Table 5 Basic education enrolment trends, 2010-2015 ................................................................. 11 Table 6 Post-secondary enrolment trends, 2010-2015 .................................................................. 12 Table 7 Education coverage ......................................................................................................... 14 Table 8 Government expenditure on education, 2010/11-2015/16 (current prices) ....................... 16 Table 9 Government recurrent expenditure on education, 2010/11-2015/16 ................................. 17 Table 10 International comparison: education spending and completion rates .............................. 18 Table 11 Budget execution rates in education ............................................................................... 19 Table 12 Education expenditure by levels (current Ksh millions) ................................................... 20 Table 13 Recurrent expenditure by level of education ................................................................... 21 Table 14 Development expenditure by level of education ............................................................. 22 Table 15 Expected cost of education sector priority areas ............................................................ 23 Table 16 Education sector expenditure by programme ................................................................. 23 Table 17 Salary and non-salary expenditure, 2010/11-2014/15 (current Ksh millions) .................. 24 Table 18 Spending on teacher salaries, 2010/11-2014/15 (current Ksh millions) .......................... 24 Table 19 Student unit costs in public institutions, 2010-2014 ........................................................ 25 Table 20 International comparison: unit cost per pupil in primary as % of GDP per capita ............ 26 Table 21 Unit costs in public institutions relative to primary school unit costs, 2010-2014 ............. 27 Table 22 Development partners’ education commitments, 2014-2016 (current USD millions) ....... 27 Table 23 Direct household spending in public schools (2014) (current Ksh millions) ..................... 28 Table 24 Estimated cost of education in private institutions (current Ksh millions) ........................ 28 Table 25 Key documents in the evolution of the curriculum reform ............................................... 30 Table 26 Major aspects of the new curriculum .............................................................................. 32 Table 27 Projected national resources, 2014-2030 (Ksh millions, constant prices) ....................... 34 Table 28 Projected total and school-age population ...................................................................... 35 Table 29 Projected population by basic education level ................................................................ 35 Table 30 Enrolment in teacher training colleges, TVET and higher education (thousands) ........... 40 Table 31 Recurrent expenditure on everything except basic education (Ksh millions) ................... 40 Table 32 Required resource envelope under scenarios 0, 1 and 2 ................................................ 42 Table 33 Estimated costs of developing and rolling out the new curriculum .................................. 43 Table 34 Enrolment projections under two scenarios (thousands) ................................................ 46 Table 35 Summary of international evidence relating to Kenya’s curriculum reform ...................... 54 Table 36 Recorded employment in Kenya (thousands), 2000, 2005, 2010, 2014 .......................... 60

Analysis of Kenya’s expenditure in education, future sector cost scenarios and benefits of curriculum reform
© Oxford Policy Management v
List of Figures
Figure 1 GDP per capita, 2010/11 to 2014/15 ................................................................................. 4 Figure 2 Structure and organisation of education and training......................................................... 7 Figure 3 Basic (ECDE, primary, secondary) enrolment, 2010-2015 .............................................. 12 Figure 4 Enrolment in universities and middle level colleges (teacher training and TVET) ............ 13 Figure 5 Government expenditure on education, 2010/11-2015/16 ............................................... 17 Figure 6 Counties’ spending on ECDE as a proportion of their overall spending, 2014/15 ............ 19 Figure 7 Government effort to education ....................................................................................... 20 Figure 8 Distribution of education spending by levels .................................................................... 21 Figure 9 Cost per pupil/student in primary and secondary, 2010-2014 (current and constant prices) ..................................................................................................................................................... 26 Figure 10 KICD Curriculum development cycle ............................................................................. 31 Figure 11 Enrolment projections in basic education, Scenarios 0, 1 and 2 .................................... 38 Figure 12 Recurrent education costs of the basic education sector (ECDE-senior secondary) ..... 39 Figure 13 Recurrent spending on basic education at baseline (2014) and endline (2030) ............. 39 Figure 14 Recurrent expenditure and resource envelope under Scenarios 0, 1 and 2 .................. 41 Figure 15 Funding gap under Scenarios 0, 1 and 2 ....................................................................... 41 Figure 16 Required spending as % of GDP under Scenarios 0, 1 and 2 ....................................... 42 Figure 17 Required spending as % of domestic revenues under Scenarios 0, 1 and 2 ................. 42 Figure 18 Projected development costs under Scenarios 0, 1 and 2 ............................................. 44 Figure 19 Recurrent spending on primary and secondary education ............................................. 47 Figure 20 Westbrook et al’s Theory of Change ............................................................................. 49 Figure 21 Schooling profile 2015 ................................................................................................... 59
List of boxes
Box 1 Chapter 2: Key findings ......................................................................................................... 3 Box 2 Chapter 3: Key findings ......................................................................................................... 6 Box 3 Chapter 4: Key findings ....................................................................................................... 15 Box 4 Chapter 5: Key findings ....................................................................................................... 29 Box 5 Chapter 6: Key findings ....................................................................................................... 33 Box 6 Assumptions in the evolution of three expenditure scenarios .............................................. 36 Box 7 Chapter 7: Key findings ....................................................................................................... 45
Analysis of Kenya’s expenditure in education, future sector cost scenarios and benefits of curriculum reform
© Oxford Policy Management vi
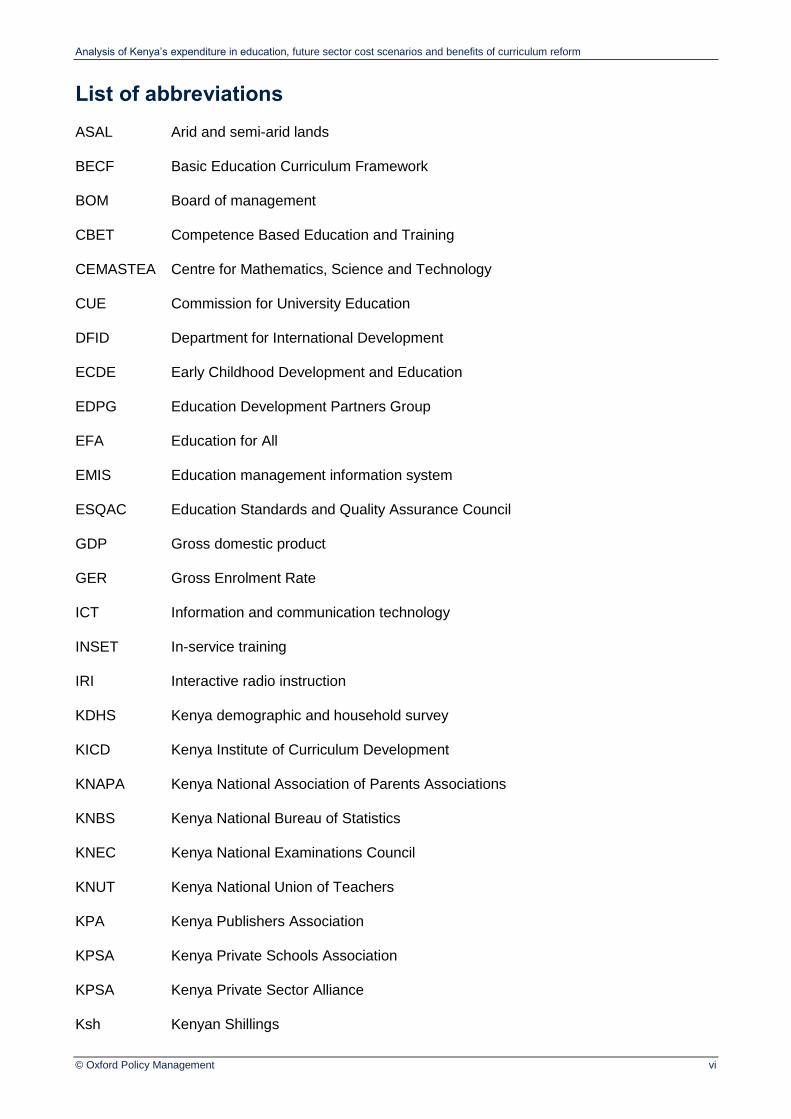
List of abbreviations
ASAL Arid and semi-arid lands
BECF Basic Education Curriculum Framework
BOM Board of management
CBET Competence Based Education and Training
CEMASTEA Centre for Mathematics, Science and Technology
CUE Commission for University Education
DFID Department for International Development
ECDE Early Childhood Development and Education
EDPG Education Development Partners Group
EFA Education for All
EMIS Education management information system
ESQAC Education Standards and Quality Assurance Council
GDP Gross domestic product
GER Gross Enrolment Rate
ICT Information and communication technology
INSET In-service training
IRI Interactive radio instruction
KDHS Kenya demographic and household survey
KICD Kenya Institute of Curriculum Development
KNAPA Kenya National Association of Parents Associations
KNBS Kenya National Bureau of Statistics
KNEC Kenya National Examinations Council
KNUT Kenya National Union of Teachers
KPA Kenya Publishers Association
KPSA Kenya Private Schools Association
KPSA Kenya Private Sector Alliance
Ksh Kenyan Shillings
Analysis of Kenya’s expenditure in education, future sector cost scenarios and benefits of curriculum reform
© Oxford Policy Management vii
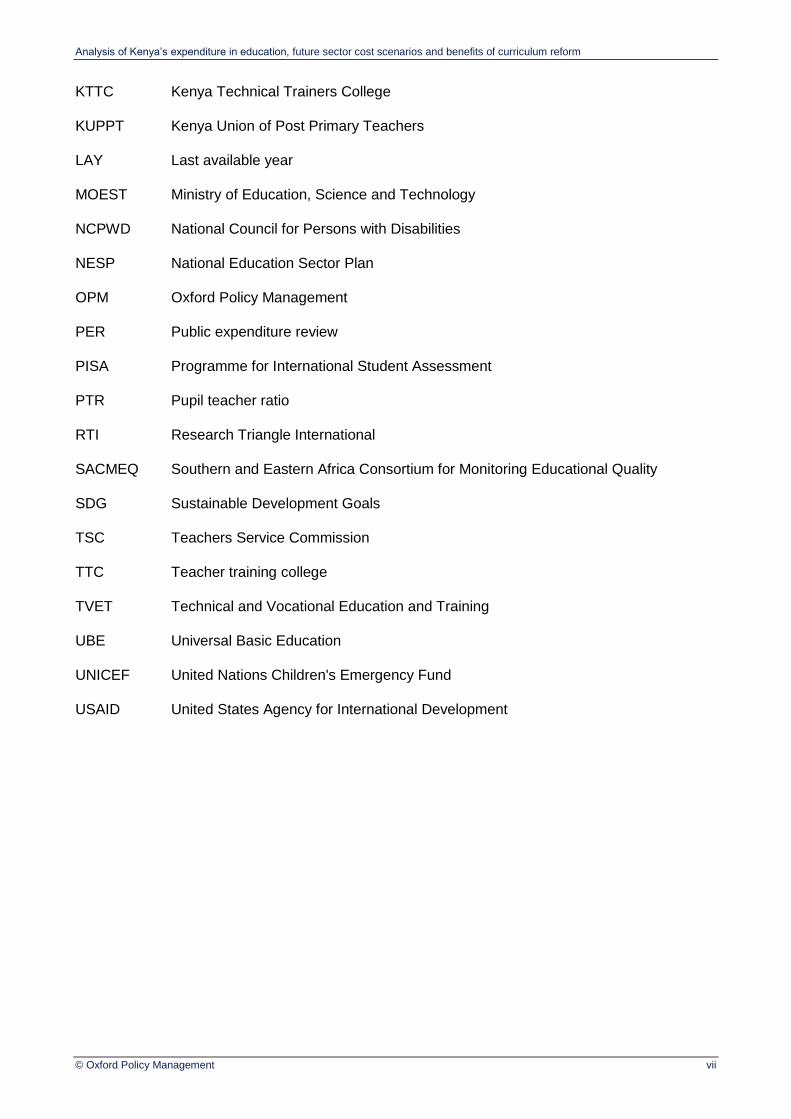
KTTC Kenya Technical Trainers College
KUPPT Kenya Union of Post Primary Teachers
LAY Last available year
MOEST Ministry of Education, Science and Technology
NCPWD National Council for Persons with Disabilities
NESP National Education Sector Plan
OPM Oxford Policy Management
PER Public expenditure review
PISA Programme for International Student Assessment
PTR Pupil teacher ratio
RTI Research Triangle International
SACMEQ Southern and Eastern Africa Consortium for Monitoring Educational Quality
SDG Sustainable Development Goals
TSC Teachers Service Commission
TTC Teacher training college
TVET Technical and Vocational Education and Training
UBE Universal Basic Education
UNICEF United Nations Children's Emergency Fund
USAID United States Agency for International Development

Analysis of Kenya’s expenditure in education, future sector cost scenarios and benefits of curriculum reform
© Oxford Policy Management 1
1 Introduction
Kenya has made good progress in terms of access to education. The gross enrolment rate (GER)
in pre-primary increased from 57.6% in 2004 to 76.5% in 2015; in primary the GER has increased
from 88.7% in 2000 to 103.6% in 2015, and in secondary from 28.8% in 2005 to 63.3% in 2015
(MOEST, 2016). However, there are still issues in the system, such as late-entry into school, and
inefficiencies like repetition and drop-out. In terms of equity, across the country more girls are
enrolled than boys with the exception of the north eastern region where the reverse is true.
Children from the arid and semi-arid lands are particularly disadvantaged, as are those from poorer
households. Meanwhile learning outcomes are far below expectations. According to the 2014
Uwezo assessment, 39% of 7 to 13 year olds could solve class two numeracy and literacy
problems. Again the north eastern region is far below the national average, and nationally girls out-
performed boys on the tests, with the reverse in the north east (Uwezo, 2016).
In recent years, following the publication of Kenya’s Vision 2030 and the 2010 Constitution,
momentum has grown behind ambitions to reform the education curriculum. This new curriculum
would aim to align with the updated government policies and vision, as well as reflecting on
criticisms of the sector and the existing curriculum. The curriculum reform process is led by the
Ministry of Education, Science and Technology (MOEST), with the Kenyan Institute for Curriculum
Development taking responsibility for technical development and advice to the Ministry.
As the Government of Kenya is reviewing various options for the design and implementation of the
curriculum reform, Oxford Policy Management has been contracted by UNICEF on behalf of
MOEST to support in providing evidence to aid decision making. This assignment was conceived
as having three major components. First, to conduct an analysis of expenditure in the education
sector and how it relates to overall public spending. This is intended to set the scene of spending
trends – how much the sector receives and how it allocates those funds against sub-sector levels
and types of spending. This analysis, in particular unit costs, provides a baseline to then project
forward future costs under various assumptions. Second, to create a simulation model in order to
produce and analyse scenarios of future costs to the sector, to better understand the implications
of the curriculum reform for costs. These scenarios are purely hypothetical and depend on
assumptions relating to policy decisions and exogenous factors, but they are intended to support
stakeholders in deciding what policies are realistically affordable. Third, to review the likely benefits
to come from the curriculum reform, in order to get a good picture of the main future costs and
benefits.1
The objective of this assignment is to support the planning and decision-making process of
MOEST, but also to support them in their discussions with other stakeholders including other parts
of Government. This report sets out the findings from the analysis. In addition the interim findings
were presented to a workshop of stakeholders in July 2016, which included demonstration of the
cost projection model. The workshop was used to consult on assumptions to be used in the
scenarios. This model will be provided to and owned by the Ministry of Education, allowing further
scenarios and updates to be carried out.
The rest of this report is structured as follows:
Chapter 2 sets out the historical trend of the macroeconomic context. It describes recent trends in
Kenya’s population, including the population of children. This is followed by national resources in
terms of GDP, government revenues and total government spending. Chapter 3 moves on to focus
1 It is possible to include some benefits in the simulation model, most particularly enrolment. However benefits such as improved learning outcomes or economic and social returns cannot be modelled due to the additional layer of uncertainty and the lack of evidence for the extent to which changes will occur. This is discussed further in Chapter 7.
Analysis of Kenya’s expenditure in education, future sector cost scenarios and benefits of curriculum reform
© Oxford Policy Management 2
on the education sector, setting out an introduction to the sector’s structure and performance. It
goes into more detail in terms of enrolment over the last five years in the various levels of
education, from early childhood education and development, through primary, secondary, technical
and vocational education and training (TVET), teacher education and higher education, as these
form starting points for the simulation scenarios. The backward looking analysis continues with a
review of public spending on education in Chapter 4. This chapter shows levels of the education
expenditure and how this breaks down by recurrent and development costs, salary and non-salary,
and by levels of education. The unit costs of education are then estimated using total spending and
enrolment by each level. Again, this analysis is critical to then setting up future cost scenarios. A
brief review of potential off-budget costs of education is included, focusing on development
partners and household expenditure.
From Chapter 5, the focus moves towards the future, starting with an introduction to the proposed
curriculum reform. Here the evolution and rationale for the reform are explained, along with the
major defining features of the proposal when compared to the current curriculum.
The implications of the curriculum reform for sector costs and resource needs are set out in
Chapter 6. Firstly, the projections of the macroeconomic framework are shown, based on assumed
growth rates, revenue generation and allocations to the education sector. Following this, forecasts
of population are given. Finally three scenarios are set out for projecting financial costs of the
sector, showing what they mean for enrolment and recurrent costs, particularly when the new
curriculum is implemented which changes the structure of years of schooling. The implications for
the financial gap are shown, with sensitivity analysis showing how the resource envelope would
need to change to make the scenarios affordable. Finally, the development expenditure required to
meet the new curriculum, such as new classrooms and laboratories, is estimated.
Chapter 7 looks at the anticipated benefits of the curriculum reform. It begins with the benefits
estimated in the scenarios, which include the increase in human capital through enrolment and
completion, and cost-savings from improving the efficiency of the sector. The chapter then draws
on international experiences of implementing curriculum reforms, or interventions similar to those
included in the reforms, to highlight useful implications for Kenya in designing and implementing its
proposals. Finally, Kenya has articulated some of its expected benefits in the policies and
development documents produced in recent years, and these are summarised.
Finally, Chapter 8 concludes by summarising the key findings in this report.

Analysis of Kenya’s expenditure in education, future sector cost scenarios and benefits of curriculum reform
© Oxford Policy Management 3
2 Macroeconomic context
This chapter sets out the recent trends in the country’s population and wealth, as well as
government revenue and spending. This is intended to put the curriculum reform into a wider
context. The level of the population, and proportion of the population who are of school-age, have
been provided to set out a baseline for the projections as presented in later chapters. Based on
available data, the share of the country’s wealth collected as domestic resources, and the amount
spent by the government, have been documented. Where available, the last six years of data is
shown, and in some cases data is shown for five years.
Box 1 Chapter 2: Key findings
Kenya’s population is growing at 2.8% per year, bringing it to 44.2 million in 2015.
However real annual economic growth has averaged 5.5%, meaning increasing per capita incomes.
Government domestic revenues have been stable at around 19% of GDP in recent years, but public expenditure has been between 23% and 26%, indicating a fiscal deficit.
2.1 Total and school age population
Kenya’s population has been growing steadily in recent years, reaching over 44 million in
2015/16. Table 1 shows the development of Kenya’s population between 2010 and 2015. The
population censuses carried out in 1989, 1999 and 2009 have shown steady increases in
population. According to the last population and housing census conducted in 2009 there were
38.5 million people in Kenya, this is projected to have grown at 2.8% per year to 44.2 million 2015.
Table 1 Total Population and School Age Population
2010/11 2011/12 2012/13 2013/14 2014/15 2015/16
Population (millions) 38.473 39.545 40.652 41.788 42.961 44.163
Population Aged 3-17 (millions) 16.099 16.477 16.869 17.271 17.682 18.176
Source: Economic Survey (2014-2016)
The school-age population increased by about 2 million between 2010 and 2015
representing an annual average growth of 2.5%. The Ministry of Education defines the official
age for basic education as children and youth between three and 17 years old. On average, this
group constitutes about 40% of the total population in the country. In essence, more than half of
Kenya’s population falls outside this age category making them potentially active in generating the
resources needed for the supply of basic education services. The dependency of the school age
population slightly eased from 41.8% in 2010 to 41.2% in 2015. Continuing growth in population
will increase pressure on the education sector through higher enrolment.
2.2 Gross domestic product
Kenya has seen relatively strong economic growth in recent years, in both nominal and real
terms. 2 Table 2 shows the progression of the country’s wealth over the last six years. Overall, the
country’s gross domestic product at market prices increased from Ksh 3.1 trillion in 2010 to Ksh 6.2
trillion in 2015, growing at an annual average rate of 14.5%.
2 ‘Real’ or ‘constant’ prices are a way of measuring the real change in output. All prices are adjusted to what they would be in the base year (in this case 2014), so removing the effect of inflation. ‘Market,’ ‘nominal’ and ‘current’ prices refer to the actual price given in the year, and hence include any inflation.

Analysis of Kenya’s expenditure in education, future sector cost scenarios and benefits of curriculum reform
© Oxford Policy Management 4
Table 2 Gross domestic product
2010/11 2011/12 2012/13 2013/14 2014/15 2015/16
GDP current (Ksh millions)
3,169,302 3,725,918 4,261,151 4,730,801 5,357,672 6,224,369
GDP constant (2014 Ksh millions)
4,338,212 4,603,254 4,812,924 5,086,648 5,357,672 5,660,879
Real GDP Growth (%) - 6.1% 4.6% 5.7% 5.3% 5.7%
GDP per capita current (Ksh)
82,376 94,219 104,821 113,210 124,710 140,942
GDP per capita constant (Ksh) (2014)
112,759 116,405 118,394 121,726 124,710 128,183
Source: Economic Survey (2014 - 2016)
In real terms, the country’s GDP increased from Ksh 4.3 trillion in 2010 to Ksh 5.7 trillion in 2015
(2014 prices), representing a real average annual growth of 5.5%. Real growth rates fell from 6.1%
to 4.6% between 2011/12 and 2012/13, before growth accelerated to 5.7% in 2013 and has since
remained more or less the same. GDP has been growing faster than population, increasing
the average citizen’s wealth. GDP per capita at market prices increased at an annual average
rate of 11.3% from Ksh 82,000 to Ksh 141,000 between 2010 and 2015 (see Figure 1). At constant
2014 prices, the GDP per capita increased at an annual average rate of 2.6%.
Figure 1 GDP per capita, 2010/11 to 2014/15
2.3 Government resources and spending
Government revenues have remained fairly consistently around 19% of GDP in the last five
years. As shown in Table 3, over the five years to 2014 government revenues fluctuated within
less than a percentage point of GDP. Meanwhile, government expenditure has been four to
five percentage points higher, indicating a fiscal deficit. The total government expenditure
fluctuated from 24% in 2010, down to a low of 23.5%, and up to 25.9% of GDP. The difference
between revenues and total expenditure implies the part of spending which is financed by grants or
loans, and therefore is less predictable.
70,000
80,000
90,000
100,000
110,000
120,000
130,000
2010/11 2011/12 2012/13 2013/14 2014/15
Ken
yan
Sh
illin
gs
GDP Per Capita Current GDP Per Capita Constant 2014
Analysis of Kenya’s expenditure in education, future sector cost scenarios and benefits of curriculum reform
© Oxford Policy Management 5
Table 3 Government resources and spending as a % of GDP
2010/11 2011/12 2012/13 2013/14 2014/15
Total revenues excluding grants 19.4 19.4 18.8 18.8 19.4
Total government expenditure 24.0 23.5 23.7 23.7 25.9
Of which
Recurrent expenditure 16.9 17.2 16.3 17.5 17.6
Development expenditure 7.1 6.4 7.4 6.6 7.1
Source: World Bank (2014)
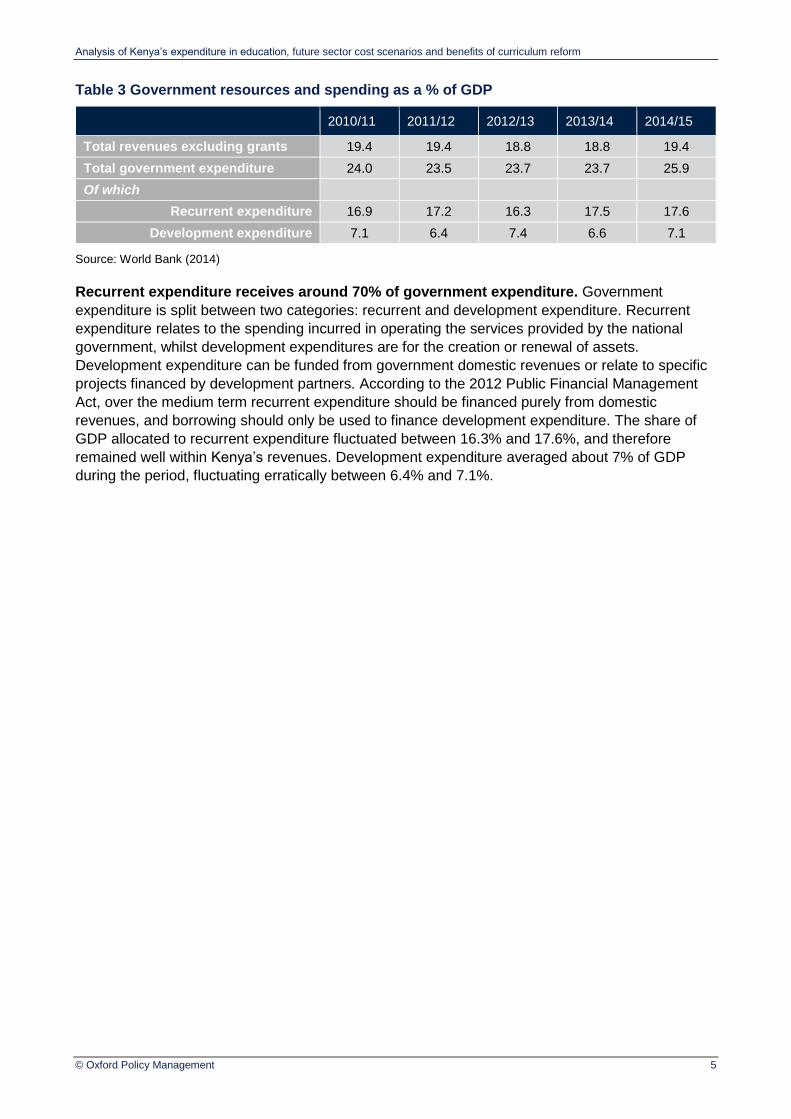
Recurrent expenditure receives around 70% of government expenditure. Government
expenditure is split between two categories: recurrent and development expenditure. Recurrent
expenditure relates to the spending incurred in operating the services provided by the national
government, whilst development expenditures are for the creation or renewal of assets.
Development expenditure can be funded from government domestic revenues or relate to specific
projects financed by development partners. According to the 2012 Public Financial Management
Act, over the medium term recurrent expenditure should be financed purely from domestic
revenues, and borrowing should only be used to finance development expenditure. The share of
GDP allocated to recurrent expenditure fluctuated between 16.3% and 17.6%, and therefore
remained well within Kenya’s revenues. Development expenditure averaged about 7% of GDP
during the period, fluctuating erratically between 6.4% and 7.1%.

Analysis of Kenya’s expenditure in education, future sector cost scenarios and benefits of curriculum reform
© Oxford Policy Management 6
3 Education sector overview
This chapter provides an introduction to the education sector, as an opening towards further
analysis of the education sector budget and spending, and future scenarios. It begins by setting out
the institutional structure of the education sector, defining the mandate of the key governing bodies
in education. It moves on to set out the strategic framework in which the sector operates, from the
national long term visions through to the sector specific plans and policies. This is followed by a
brief overview of sector performance.
Finally, more detailed data on past enrolment trends is presented in section 3.4, as this forms a
building block of the spending analysis in Chapter 4, where unit costs are calculated by comparing
spending against enrolment. Enrolment is also the starting point for creating future sector
scenarios, where assumptions about enrolment growth have implications for both costs and
benefits in the sector.
Box 2 Chapter 3: Key findings
At the national level, education comes under the purview of the Ministry Of Education, Science and Technology. However since the introduction of the 2010 Constitution, the 47 counties have responsibility for pre-school and vocational education.
The education sector is directed by the National Education Sector Plan (NESP 2013-18), which has six priorities: governance, access, quality, equity, relevance, and social values.
Access to education has increased substantially over the last decade or so, although 850,000 children remain out of school. There are still equity issues: girls are underrepresented at secondary school, and the arid and semi-arid lands (ASAL) have lower access levels.
Learning outcomes are found to have been stagnant or declining over the last decade. Again there are wide disparities in learning outcomes, particularly with the ASAL areas falling behind.
Secondary education has seen the highest enrolment growth since 2010, of 9.1% per year. ECDE enrolment growth was also high at nearly 6% each year. Primary growth was lower at 1.5%, but gross enrolment is already over 100%.
The share of enrolment in private schools falls as the level of education rises.
Over six years, enrolment in TVET almost doubled, and was close to tripling in universities – both seeing enrolment growth outstrip population growth.
3.1 Institutional structure
At the national level, education comes under the purview of the Ministry Of Education, Science and
Technology (MOEST). MOEST’s mission is to provide, promote and coordinate quality education,
training and research; and enhance integration of science, technology and innovation into national
production systems for sustainable development (MOEST 2016). MOEST’s mandate is derived
from the 2010 Constitution.
After the introduction of the 2010 Constitution, Kenya embarked on a reform to increase devolution
of political power and government functions, aiming to ensure a more equitable distribution of
resources and strengthen democracy. The constitution introduced 47 county governments, which
are not subordinate to the national government according to the constitution. In Kenya, the
responsibility for delivering pre-school and vocational education is held at the county level.
The national MOEST remains responsible for all policy and regulation, including standards,
curriculum and examinations, and delivery of primary, secondary and tertiary education, and
special education. Within MOEST, there are three State Departments: Education, University
(Higher) Education and Vocational and Technical Education. In addition to some devolution to
county level, public schools have a degree of autonomy because the free primary education grant

Analysis of Kenya’s expenditure in education, future sector cost scenarios and benefits of curriculum reform
© Oxford Policy Management 7
is a devolved fund, which schools receive as a direct transfer. School committees and parent
teacher associations have authority for decisions about spending school budgets.
The Basic Education Act was (2013) operationalised the legal, institutional and regulatory shifts
created by the 2010 Constitution. The Act re-defined basic education to cover primary and
secondary education, introduced the National Education Board and County Education Boards in
the 47 counties, established the National Council for Nomadic and Marginalized Education and
mandated the Government to provide free and compulsory basic education.
The structure of the sub-sector levels of education is as follows: pre-primary education consists of
two years, largely provided in centres attached to primary schools. Primary education is eight
years, followed by four years of secondary education. University education for an undergraduate
degree is also four years, and hence the system has been known as the ‘8-4-4’ structure. Basic
education consists of pre-primary, primary and secondary education, i.e. 14 years in total. There
are options for technical and vocational training after primary and after secondary levels. Figure 2
below shows the structure of the system.
Figure 2 Structure and organisation of education and training
Source: MOEST (2014b) Education for All 2015 National Review
3.2 Strategy and policy framework
Vision 2030 is Kenya’s long term strategic plan, written in 2008, and aims to turn Kenya into a
newly industrialising, middle income country by 2030. The vision has three pillars: economic, social
and political; in turn built on a number of foundations, including human resource development.
Here, the vision aims to see lifelong training and education to meet the needed resource base for a
rapidly industrialising country (Government of Kenya, 2007). This is elaborated further under the
social pillar, where the overall goals for education are to reduce illiteracy by increasing access to
education, improve transition from primary to secondary, raise the quality and relevance of
education, and to integrate special needs education into learning and training institutions. Public
and private universities are encouraged to emphasise science and technology courses.

Analysis of Kenya’s expenditure in education, future sector cost scenarios and benefits of curriculum reform
© Oxford Policy Management 8
The government, led by MOEST, developed the National Education Sector Plan (NESP, 2013-
2018) as the five year programme for delivering the government’s reforms as required by the Basic
Education Act 2013, the Jubilee Manifesto 2012, Vision 2030, the national Medium Term Plan II
(2013-18) and the 2010 Constitution.
The NESP emphasises a holistic and balanced development of the entire education sector, and
sets out aspirations under six priority investment areas:
Sector governance and accountability, including the education management information
system (EMIS), communication and publicity, and school-based auditing;
Access to free and compulsory basic education, including materials and operational expenses,
infrastructure and laboratory investment, bursaries, grants and scholarships, special needs
education, alternative provision of basic education, adult education, school health and meals,
child-friendly schools, co-curricular activities, and education in emergencies;
Education quality, including standards and quality assurance, early reading and mathematics,
teacher management and education, capacity building for education managers and ICT;
Equity and inclusion, including gender, most vulnerable children, and opportunities in arid and
semi-arid lands;
Relevance, including curriculum, examinations and assessments;
Social competencies and values, including nurturing national values, education for sustainable
development, life skills, guidance and counselling, peace, HIV and community empowerment.
Over the last fifteen years, the education sector has been dominated by a number of flagship
policies, including Free Primary Education, which was introduced in 2003, Free Day Secondary
Education, which was introduced in 2008, and compulsory early childhood education, introduced in
the 2010 Constitution. In higher education, the Taskforce on Aligning Higher Education to the
Constitution and Vision 2030 (Some, 2012) formed the basis for the New Universities Act, Science
Technology and Innovation Act and the TVET Act noting the critical role TVET should play in
national development.
3.3 Sector performance
As with many developing countries, Kenya has seen great success in terms of increasing access
to education, reflecting its commitment and programmes such as free primary and day secondary
education. Over the last decade or so, the gross enrolment rate in pre-primary increased from
57.6% in 2004 to 76.5% in 2015; in primary the GER has increased from 88.7% in 2000 to 103.6%
in 2015, and in secondary from 28.8% in 2005 to 63.3% in 2015 (MOEST, 2016). The growth in
enrolment has been facilitated by expansion in capacity, with the numbers of schools growing over
the period 2009 to 2014 from 38,000 to 40,000 in early childhood development and education
(ECDE), 23,000 to 29,000 in primary, and 6,000 to 9,000 in secondary.
That said, still more than 850,000 children aged six to 17 years old are out of school (Table 4). Of
the 380,000 14 to 17 year olds out of school, still 21% have not ever attended any schooling.

Analysis of Kenya’s expenditure in education, future sector cost scenarios and benefits of curriculum reform
© Oxford Policy Management 9
Table 4 Numbers of out of school children by education level attained, 2014
No school Incomplete Primary
Complete Primary
Incomplete secondary
Complete Secondary +
Total
In Thousands
6-9 278.3 20.7 0.0 0.0 0.0 299.0
10-13 136.0 25.7 8.3 1.3 0.0 171.3
14-17 78.9 82.0 175.8 44.8 0.4 381.9
Total 493.2 128.3 184.2 46.2 0.4 852.3
In %
6-9 93.1% 6.9% 0.0% 0.0% 0.0% 100.0%
10-13 79.4% 15.0% 4.9% 0.8% 0.0% 100.0%
14-17 20.7% 21.5% 46.0% 11.7% 0.1% 100.0%
Total 61.5% 14.3% 19.3% 4.8% 0.0% 100.0%
Source: UNICEF, Out of school Children situation in Kenya (draft June 2016), based on KDHS 2014 (Kenya Demographic and Health Survey)
Whilst basic education is predominantly provided by the public sector, private schooling has been
increasing, particularly in urban areas. The number of private primary schools has grown rapidly
from 1441 in 2002 to 8719 schools in 2011 (Economic Survey 2006 and 2014, referenced in World
Bank PAD June 2014). Low cost private schools have become the main education providers for
children from the most disadvantaged background in informal urban settlements. By 2014, in pre-
primary 31% of all enrolment was in the private sector, 16% of primary enrolment, and in
secondary 7% of enrolment was in private schools (MOEST 2014a). Behind these averages,
private primary enrolment ranged from as high as 61% in Nairobi to only 2% in West Pokot.
Despite the overall progress on access, there are still issues of inequity and marginalised groups.
Although gender parity is almost reached on GER in pre-primary and primary, girls are still
underrepresented in secondary school with a gender parity index (ratio of female GER to male
GER) of 0.86 in 2010 (MOEST, 2015a). Geography is a particular issue for access, with the
northern and eastern counties, particularly in arid and semi-arid lands, repeatedly showing lower
rates of enrolment and other indicators of performance. Wajir, Mandera, Garissa and Turkana are
amongst the counties frequently highlighted, with girls in these counties particularly disadvantaged.
Internal efficiency indicators are relatively stable through primary level, except for notable drops in
the final two years. For example, promotion rates are around 90% for classes 1 to 6, but drop to
79% and 75% for classes 7 and 8 – and high drop-out rates in these final two classes (MOEST,
2014a; 2014 data). Currently, 80% of class 8 students transition into form 1 of secondary school.
At the secondary level, promotion is very high for forms 1 and 2 at 100.7% and 99.8% respectively,
but this drops to 90.1% in form 3 as completing secondary becomes more of a challenge. Despite
the lower levels of enrolment of girls in secondary school, the indicators of efficiency are generally
more positive for girls than for boys across primary and secondary (MOEST, 2014a).
Pupil teacher ratios are relatively low on average, at 31.1 in ECDE, 34.5 in primary and 20
students per teacher in secondary (all public schools). However, this includes Board of
Management teachers who are employed by the BoM from community funds, rather than by the
government through the Teachers Service Commission (TSC). Looking at just the TSC teachers,
primary PTRs range from over 100 in Turkana down to just above 20 in Baringo, suggesting huge
disparities in the provision of services across counties. In private schools, PTRs are around half –
or less – that in public schools. Likewise, average class sizes are almost double that of private
schools in public schools.

Analysis of Kenya’s expenditure in education, future sector cost scenarios and benefits of curriculum reform
© Oxford Policy Management 10
It has been reported that the rapid expansion of the education system has had a negative effect on
the quality of education, as seen by various assessments of learning outcomes (World Bank,
2014b). In the Southern and Eastern Africa Consortium for Monitoring Educational Quality
(SACMEQ) assessment of standard 6 pupils, Kenya scores above the average for the 15
participating countries in both reading and mathematics in 2007 (SACMEQ, 2011). However
between 2000 and 2007, there was a slight decline in the mean scores for both reading and
mathematics suggesting some kind of stagnation. Furthermore, Kenya’s reading proficiency
dropped from second to fifth of the 15 African countries. The Uwezo 2014 assessment found that
only 39% of children aged seven to 13 years could solve class 2 numeracy and literacy problems –
and this has remained stagnant (or even declined) since 2011 (Uwezo, 2015).
As with access, there are wide disparities in learning outcomes across different groups. The
Uwezo results explain this well: a child in the Central region is over seven times more likely to have
attained a standard 2 level of literacy and numeracy than a child in the North Eastern region.
National examinations indicate a low level of educational attainment at secondary school, with
three quarters of candidates not achieving the minimum grades required for admission to
University (C+) or other middle level colleges (C-) (MOEST, 2015a). Poor education quality has
been partly blamed on the curriculum, and hence the impetus for the curriculum reform, which is
discussed further in Chapter 5.
With low results at secondary level, it thus follows that only a small proportion of secondary school
leavers are admitted to public and private universities (7.7% in 2010/11 – less than one quarter of
those who qualified) (MOEST, 2015a). University enrolment almost doubled in five years, from
123,000 in 2008 to 240,000 in 2012. Enrolment in technical institutions also doubled over the
decade from 2003, reaching 128,000 in 2012 (MOEST, 2015a).
Kenya still faces challenges with the educational achievement of its adult population. According to
the 2009 census, one quarter of the population have not even completed primary education
(MOEST, 2015a). Meanwhile, again, there are large regional and gender disparities, with the arid
and semi-arid lands and women having particularly low education outcomes. For example, female
literacy rates were below 10% in Mandera, Turkana and Wajir counties, but 90% in Nairobi and
Uasin Gishu counties.
3.4 Review of enrolment trends
Enrolment has grown across the levels of basic education in the last few years, with ECDE
and secondary seeing particularly rapid growth. Table 4 presents a summary of enrolments in
Kenya’s public and private basic education system in between 2010 and 2015. The relationship
between enrolment and spending trends is analysed in section 4.5, which looks at the average
spending per student.
Analysis of Kenya’s expenditure in education, future sector cost scenarios and benefits of curriculum reform
© Oxford Policy Management 11
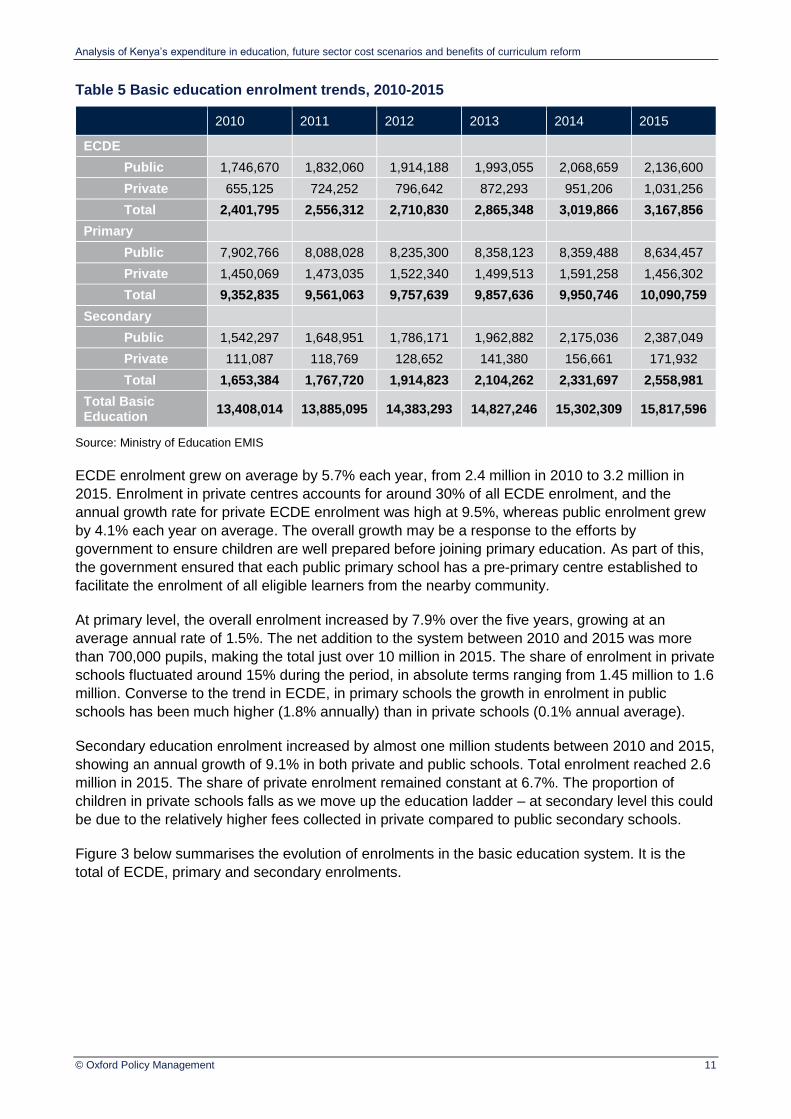
Table 5 Basic education enrolment trends, 2010-2015
2010 2011 2012 2013 2014 2015
ECDE
Public 1,746,670 1,832,060 1,914,188 1,993,055 2,068,659 2,136,600
Private 655,125 724,252 796,642 872,293 951,206 1,031,256
Total 2,401,795 2,556,312 2,710,830 2,865,348 3,019,866 3,167,856
Primary
Public 7,902,766 8,088,028 8,235,300 8,358,123 8,359,488 8,634,457
Private 1,450,069 1,473,035 1,522,340 1,499,513 1,591,258 1,456,302
Total 9,352,835 9,561,063 9,757,639 9,857,636 9,950,746 10,090,759
Secondary
Public 1,542,297 1,648,951 1,786,171 1,962,882 2,175,036 2,387,049
Private 111,087 118,769 128,652 141,380 156,661 171,932
Total 1,653,384 1,767,720 1,914,823 2,104,262 2,331,697 2,558,981
Total Basic Education
13,408,014 13,885,095 14,383,293 14,827,246 15,302,309 15,817,596
Source: Ministry of Education EMIS
ECDE enrolment grew on average by 5.7% each year, from 2.4 million in 2010 to 3.2 million in
2015. Enrolment in private centres accounts for around 30% of all ECDE enrolment, and the
annual growth rate for private ECDE enrolment was high at 9.5%, whereas public enrolment grew
by 4.1% each year on average. The overall growth may be a response to the efforts by
government to ensure children are well prepared before joining primary education. As part of this,
the government ensured that each public primary school has a pre-primary centre established to
facilitate the enrolment of all eligible learners from the nearby community.
At primary level, the overall enrolment increased by 7.9% over the five years, growing at an
average annual rate of 1.5%. The net addition to the system between 2010 and 2015 was more
than 700,000 pupils, making the total just over 10 million in 2015. The share of enrolment in private
schools fluctuated around 15% during the period, in absolute terms ranging from 1.45 million to 1.6
million. Converse to the trend in ECDE, in primary schools the growth in enrolment in public
schools has been much higher (1.8% annually) than in private schools (0.1% annual average).
Secondary education enrolment increased by almost one million students between 2010 and 2015,
showing an annual growth of 9.1% in both private and public schools. Total enrolment reached 2.6
million in 2015. The share of private enrolment remained constant at 6.7%. The proportion of
children in private schools falls as we move up the education ladder – at secondary level this could
be due to the relatively higher fees collected in private compared to public secondary schools.
Figure 3 below summarises the evolution of enrolments in the basic education system. It is the
total of ECDE, primary and secondary enrolments.

Analysis of Kenya’s expenditure in education, future sector cost scenarios and benefits of curriculum reform
© Oxford Policy Management 12
Figure 3 Basic (ECDE, primary, secondary) enrolment, 2010-2015
Source: Ministry of Education EMIS
At post-basic level, Table 6 below shows enrolment in teacher training, TVET and universities. The
TVET enrolment relates only to the formal public sector TVET institutions under MOEST.
Table 6 Post-secondary enrolment trends, 2010-2015
2010 2011 2012 2013 2014 2015
Teacher Trainees
Primary - Public 17,750 18,158 17,667 21,008 21,214 22,818
Primary - Private 8,640 9,762 11,285 14,389 16,257 16,613
Diploma Trainees 1,463 1,693 1,744 1,716 2,382 1,971
Total 27,853 29,613 30,696 37,113 39,853 41,402
TVET
Public 82,653 101,759 127,691 148,009 148,142 155,176
Private - - - - - -
Total 82,653 101,759 127,691 148,009 148,142 155,176
University
Public 139,770 157916 196,737 289,733 363,334 427,034
Private 37,848 60,712 54,459 71,646 80,448 85,889
Total 177,618 218,628 251,196 361,379 443,782 512,923
Source: Ministry of Education
Teacher trainees can be in private or public training for primary schools, or diploma students who
are training for secondary schools. Enrolment in primary teacher training colleges increased from
26,000 trainees in 2010 to 39,500 in 2015, growing at an annual average of 8%. The proportion of
these trainees in private institutions has increased gradually from around 32% to 42% over the five
year period. Diploma teacher trainees who are directly deployed to secondary schools after training
increased at an annual rate of 6% from approximately 1,500 trainees in 2010 to 2,000 in 2015.
TVET enrolment registered a double digit annual growth of 13% from 83,000 students to 155,000
in 2015. This growth was accelerated by the introduction of the Competence Based Education and
Training (CBET) curriculum. Under the CBET, trainees take independent modules of a course or
programme as opposed to having a multiple years programme. After acquisition of a set of skills,
trainees are certified to go out and practice the field in which they have been trained.
0
2,000,000
4,000,000
6,000,000
8,000,000
10,000,000
12,000,000
14,000,000
16,000,000
18,000,000
2010 2011 2012 2013 2014 2015
Enro
lment
ECDE Primary Secondary

Analysis of Kenya’s expenditure in education, future sector cost scenarios and benefits of curriculum reform
© Oxford Policy Management 13
Enrolment growth was highest in the university sector. University enrolment grew three-fold from
177,600 students in 2010 to more than half a million in 2015. This expansion relates to the end of
the intake-pegged-to-bed capacity policy which has allowed more students to enrol based on
tuition-capacity, and universities offer multiple shifts. Figure 3 below shows the trend in growth of
enrolment in middle level colleges (teacher training and TVET) as well as universities.
Figure 4 Enrolment in universities and middle level colleges (teacher training and TVET)
Source: Ministry of Education
3.4.1 Education coverage
Gross enrolment rates (GER) – the level of enrolment divided by the relevant population –
measure the extent to which the targeted population is covered by the education system. The
ECDE GER improved significantly between 2010 and 2015, from 64.5% to 76.4%, representing an
18% increase. At the primary level, the GER has consistently registered more than 100% over the
period under review. A GER greater than 100% indicates existence of overage and underage
children enrolled in the system. At the secondary level there has been consistent growth in the
GER from 45.7% in 2010 to 63.3% in 2015, a 17.6 percentage point increase.
Gross and net enrolment rates by county are presented in Annex B, showing the substantial
variation. Across the levels, Mandera and Wajir are among the counties with the lowest gross
enrolment rates. However interestingly Turkana has one of the lowest GERs for primary and
secondary, but relatively higher GER in ECDE. The type of rapid expansion in enrolment seen
recently in pre-primary and secondary, seen earlier in primary schools in Kenya, can have
pressure on the system if resources are not growing at appropriate rates too. For example, the
growth in primary enrolment after the introduction of free primary education in 2003 is argued by
some to have contributed to a stagnation or even decline in quality (see Kimenyi, 2013). The extent
to which this happens will also depend on what spare capacity the system already had for an
increase in enrolment.
0
100,000
200,000
300,000
400,000
500,000
600,000
2010 2011 2012 2013 2014 2015
En
rolm
en
t
University
Middle Level Colleges
Analysis of Kenya’s expenditure in education, future sector cost scenarios and benefits of curriculum reform
© Oxford Policy Management 14
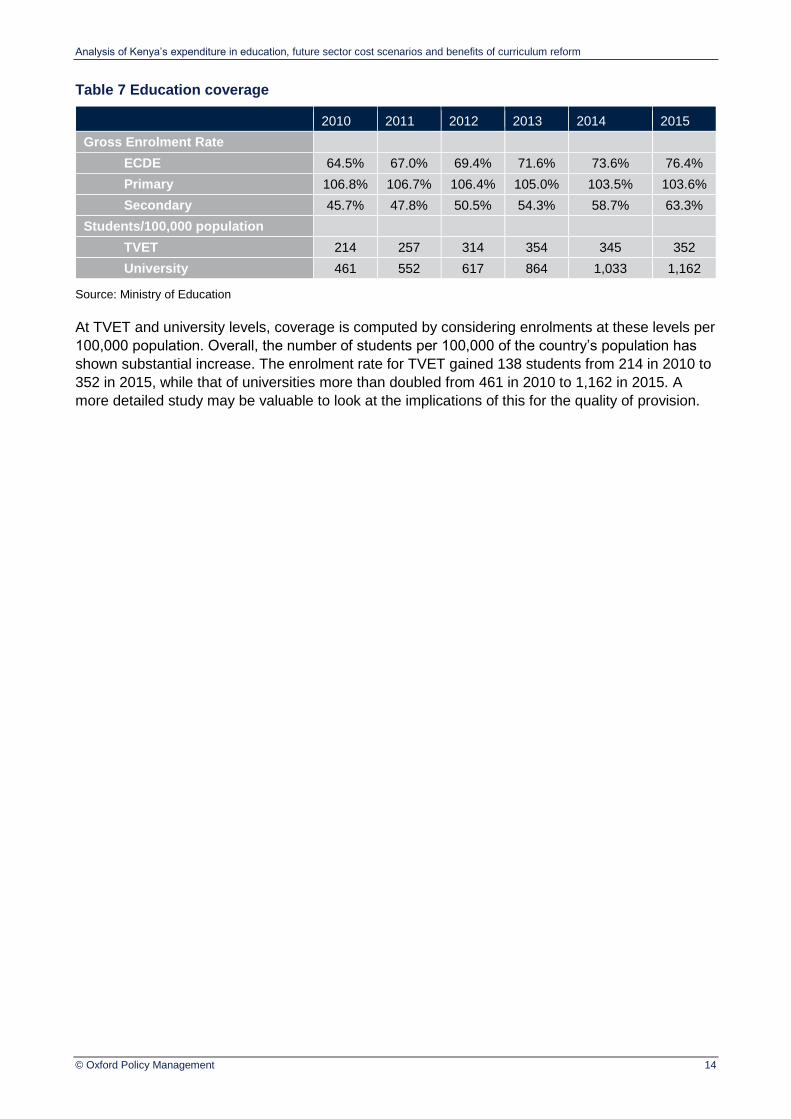
Table 7 Education coverage
2010 2011 2012 2013 2014 2015
Gross Enrolment Rate
ECDE 64.5% 67.0% 69.4% 71.6% 73.6% 76.4%
Primary 106.8% 106.7% 106.4% 105.0% 103.5% 103.6%
Secondary 45.7% 47.8% 50.5% 54.3% 58.7% 63.3%
Students/100,000 population
TVET 214 257 314 354 345 352
University 461 552 617 864 1,033 1,162
Source: Ministry of Education
At TVET and university levels, coverage is computed by considering enrolments at these levels per
100,000 population. Overall, the number of students per 100,000 of the country’s population has
shown substantial increase. The enrolment rate for TVET gained 138 students from 214 in 2010 to
352 in 2015, while that of universities more than doubled from 461 in 2010 to 1,162 in 2015. A
more detailed study may be valuable to look at the implications of this for the quality of provision.

Analysis of Kenya’s expenditure in education, future sector cost scenarios and benefits of curriculum reform
© Oxford Policy Management 15
4 Education sector budget and expenditure
This chapter looks in more depth at the public finances of the education sector in particular. It is
intended to give a good understanding of how much the sector receives and how it chooses to
allocate this resource. This can be used to assess the allocation of spending against priorities, as
well as to compare the spending and efficiency between sub-sector levels and with other countries.
In addition, the analysis presented here forms building blocks required for developing future sector
scenarios, as presented in Chapter 6.
Chapter 4 begins by looking at the total government spending on education, and compares this
with overall spending to see how far the sector is prioritised. As part of this, the average spending
per member of the target population is shown to demonstrate the government’s effort to education.
The chapter moves on to break down education expenditure by education levels from early
childhood development and education (ECDE) to tertiary, indicating the sub-sectoral prioritisation
by volume of expenditure. Special focus is put on basic education levels to detail recurrent and
capital expenditures against the priority programs set out in the National Education Sector Plan.
Recurrent expenditures are further disaggregated to economic classification i.e. salary and non-
salary expenditure. An analysis of budget allocation versus expenditure is also provided to give a
sense of implementation realities for the new curriculum should the status quo remain.
The review of enrolments in the previous section is used to compute average spending at the sub-
sector levels. This gives some indication of which levels are receiving more resources, although
does not necessarily tell us if the quality or efficiency is changing without a full situation analysis.
Finally, the off-budget spending is estimated, based on information from the development partners
in the education sector and provisions from households.
This review sets out the trends to form the baseline for the future cost scenarios. However, this
exercise is limited as it does not present a full analysis of why trends have occurred – this would
require a full public expenditure review and situation analysis.
Box 3 Chapter 4: Key findings
Government spending on education almost doubled in market prices between 2010/11 and 2015/16, and around 90% of this goes on recurrent expenditure. Spending has increased faster than school-aged population, increasing the real amount spent per child of school-going age.
The education sector receives a substantial portion of all government spending, fluctuating around 14% - 20%, and 5.1-5.5% of GDP. Furthermore, education spending is equivalent to about one quarter of domestic revenues – the more predictable part of the budget.
Primary education receives the largest share of spending at about 42%. Secondary receives the second largest share at about 31%, followed by university at around 15%. ECDE received only 0.2% in 2010/11, and the share has increased to 2% in 2014/15. Trends in recurrent expenditure are similar to those for overall expenditure.
Development expenditure grew substantially in nominal terms over the last five years, and ECDE and TVET benefited from much of that increase. This reflects the operationalisation of county governments, and government focus on strengthening TVET institutions.
Salaries account for between 60% and 66.5% of education recurrent expenditure, and in this teachers receive 90% of the salary bill. The average annual increase in the teachers’ salary bill was 14%.
Unit costs have generally been stagnant or falling in real terms, with the exception of pre-primary which has seen substantial increases in average spending. Where unit costs have fallen, this may reflect the increase in enrolment and resources not keeping up; a full situation analysis would explore what this means for quality of service provision and efficiency. Kenya’s average spending on primary

Analysis of Kenya’s expenditure in education, future sector cost scenarios and benefits of curriculum reform
© Oxford Policy Management 16
pupils is slightly above average for a group of African countries with a similar primary cycle. Within Kenya, unit costs increase substantially at each progressive level of education.
Development partners play a substantial role in financing education – and much of this is not recorded in the government’s budget. Data from the DPs suggests this could be as much as USD 90 million per year, almost the same amount as the government spends on development.
Households also make a significant off-budget contribution to education. Even those whose children are in public schools may be contributing around two thirds of the total amount that government spends on primary and secondary education.
4.1 Review of public education expenditure
Government spending on education almost doubled over the past six years, reflecting
increases in enrolments and costs. Over 90% of this spending goes on recurrent activities,
suggesting relatively less development spending happens in education than in other
sectors, given the national average.
Table 6 shows a summary of key indicators in the evolution of public expenditure on education for
the period 2010 to 2015. Government spending on education almost doubled in market prices
between 2010/11 and 2015/16, increasing from Ksh 169 billion in 2010/11 to Ksh 319 billion in
2015/16. Recurrent expenditure on education increased by 87% from Ksh 159 billion in 2010 to
Ksh 298 billion in 2015. More than 90% of education expenditure goes to recurrent items.
Development expenditure averaged 5.9% of the total education expenditure, recording a high of
7.5% in 2014/15 and a low of 4.7% in 2012/13.
Table 8 Government expenditure on education, 2010/11-2015/16 (current prices)
2010/11 2011/12 2012/13 2013/14 2014/15 2015/16*
Government expenditure on education (Ksh millions)
169,093 205,262 230,599 250,551 284,792 319,425
Of which
Recurrent Expenditure 159,540 193,811 219,868 235,677 263,537 297,851
Development Expenditure 9,553 11,452 10,731 14,874 21,255 21,574
Proportion of education expenditure which is recurrent
94.4% 94.4% 95.3% 94.1% 92.5% 93.2%
Education expenditure as a share of total government expenditure
17.7% 20.2% 18.6% 16.3% 14.6% 14.4%
Education expenditure as share of GDP
5.3% 5.5% 5.4% 5.3% 5.3% 5.1%
Source: The National Treasury, Ministry of Education, Kenya National Bureau of Statistics, authors’ calculations. *Provisional – this is the approved budget for 2015/16.
Whilst the volume of government expenditure on education increased in market terms over
the period, it is worth noting that expenditure on education as a share of GDP fluctuated. In
2010/11 education spending was worth 5.3% of GDP, and this share increased to 5.5% in 2010/11
but had fallen down to 5.1% in 2015/16 (provisional estimate). Figure 5 shows this visually. This
may not be considered unusual where minor fluctuations are expected, as actual outturn across
sectors varies depending on actual revenues and immediate priorities. If the recent trend towards a
reduction in GDP going to education continues, this may suggest a shift in government priority
away from education towards other sectors – though the government continues to put an
increasing absolute amount into education each year.

Analysis of Kenya’s expenditure in education, future sector cost scenarios and benefits of curriculum reform
© Oxford Policy Management 17
Figure 5 Government expenditure on education, 2010/11-2015/16
The education sector continues to receive one of the largest allocations of government
expenditure, having consistently spent more than 14% of the total government budget
between 2010 and 2015. Over the last six years, the share of total spending going to education
peaked at 20.2% in 2011 before falling about 6 percentage points to reach 14.4% in 2015.
Furthermore, around a quarter of total government recurrent spending goes to education –
and this is equivalent to more than a quarter of government revenues (Table 9). It is
instructive to see how much of domestic revenue goes to education, since these revenues are
more predictable, can be forecast, and do not depend on more volatile international factors and aid
developments. This again reinforces the extent to which education has been prioritised in Kenya.
At the same time, the high amounts could indicate that there may be little room for this proportion
to increase further.
Table 9 Government recurrent expenditure on education, 2010/11-2015/16
2010/11 2011/12 2012/13 2013/14 2014/15 2015/16*
Education Recurrent expenditure
as a share of total recurrent expenditure
22.4% 25.7% 23.4% 23.1% 24.6% 24.3%
as a share of domestic revenue excluding grants
25.9% 26.8% 27.4% 26.5% 25.4% -
as share of GDP 5.0% 5.2% 5.2% 5.0% 4.9% 4.8%
The National Treasury, Ministry of Education, Kenya National Bureau of Statistics, authors’ calculations. *Provisional – this is the approved budget for 2015/16.
4.1.1 International comparison
Kenya commits slightly more of its GDP to education than comparable neighbouring east
African countries.3 On average, these countries with 7 or 8 year primary cycles spend 5% of GDP
on education, nearly one percentage point more than the average for the entire continent. Within
the six selected countries, Kenya spends more than the average, and significantly more than
3 These countries were selected for comparison as they all have 7 or 8 years of primary school, so comparable to Kenya.
4.9%
5.0%
5.1%
5.2%
5.3%
5.4%
5.5%
5.6%
50,000
100,000
150,000
200,000
250,000
300,000
350,000
2010/11 2011/12 2012/13 2013/14 2014/15 2015/16
Sp
en
din
g a
s %
of
GD
P
Sp
en
din
g K
sh
millio
ns
Govt Exp on Education % of Education Exp on GDP

Analysis of Kenya’s expenditure in education, future sector cost scenarios and benefits of curriculum reform
© Oxford Policy Management 18
Ethiopia, Tanzania and Uganda. However Kenya’s commitment to education is considerably lower
than Malawi and Mozambique.
Table 10 International comparison: education spending and completion rates
Country
Education as % of GDP (LAY*)
Completion rates (%) (LAY)
Efficiency index
% (a) Relative to average (b)
G6 (c) G9 (d) c/a d/a
Kenya 5.3 1.1 99.6 63.1 20.3 12.8
Ethiopia 4.5 0.9 50.7 33.0 10.3 6.7
Malawi 6.9 1.4 75.0 17.1 15.2 3.5
Mozambique 6.7 1.3 56.4 24.0 11.5 4.9
Uganda 3.3 0.7 79.7 33.3 16.2 6.8
Tanzania 3.5 0.7 83.7 45.9 17.0 9.3
Average selected countries 5.0 1.0 74.2 36.1 15.1 7.3
Average Africa 4.3 0.9 67.0 37.0 13.6 7.5
Source: UIS, IIEP-Pôle de Dakar, World Bank. *LAY: Last available year, circa 2013.
Kenya has the highest Grade 6 and Grade 9 completion rates among the selected countries,
making it the most efficient at delivering on this measure of outcomes. Grade 6 completion
for Kenya is 34% higher than the average for the selected countries and for grade 9 it is 75%
higher. For comparison, this means from 1% of GDP spent on education, Kenya gets about 20.3
points of Grade 6 and 12.8 points of Grade 9 completion,4 far above the other selected countries
and far better than the African average. Malawi, which spends 1.6 percentage points more of their
GDP on education relative to Kenya, only manages 15.2 points of completion to grade 6 and 3.5
points to grade 9 for each 1% of GDP spent. Mozambique only delivers 11.5 points of completion
to grade 6 and 4.9 points to grade 9 per every percentage of GDP.
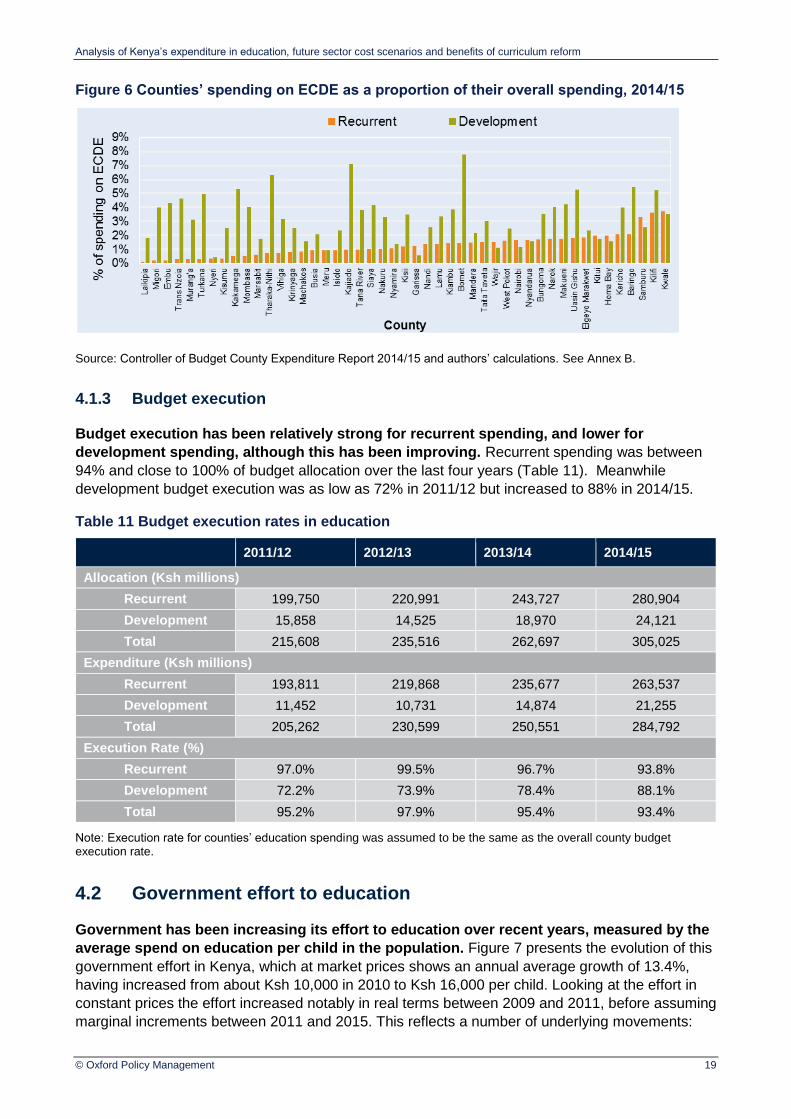
4.1.2 Counties’ spending on ECDE
Counties are responsible for early childhood development and education, and as such pre-primary
expenditure falls under their budgets rather than national government. Estimates of counties’
spending in 2014/15 suggests there is wide variation in the proportions committed to ECDE (see
Figure 6). In terms of recurrent spending, counties spent as low as 0.1% (Laikipia) and as high as
3.7% (Kwale) of all recurrent expenditure on ECDE, and the average was 1.3%. Meanwhile
development spending also varied widely, from 0.4% (Nyeri) up to 7.8% (Bomet) with an average
of 3.2% of all development spending on ECDE. However, there is no correlation between a
county’s share of recurrent spending and its share of development spending on ECDE. Annex D
shows more detail on the counties’ spending.
4 This is calculated as the proportion of children completing grade 6 (or grade 9) divided by the spending on education as a proportion of GDP.
Analysis of Kenya’s expenditure in education, future sector cost scenarios and benefits of curriculum reform
© Oxford Policy Management 19
Figure 6 Counties’ spending on ECDE as a proportion of their overall spending, 2014/15
Source: Controller of Budget County Expenditure Report 2014/15 and authors’ calculations. See Annex B.
4.1.3 Budget execution
Budget execution has been relatively strong for recurrent spending, and lower for
development spending, although this has been improving. Recurrent spending was between
94% and close to 100% of budget allocation over the last four years (Table 11). Meanwhile
development budget execution was as low as 72% in 2011/12 but increased to 88% in 2014/15.
Table 11 Budget execution rates in education
2011/12 2012/13 2013/14 2014/15
Allocation (Ksh millions)
Recurrent 199,750 220,991 243,727 280,904
Development 15,858 14,525 18,970 24,121
Total 215,608 235,516 262,697 305,025
Expenditure (Ksh millions)
Recurrent 193,811 219,868 235,677 263,537
Development 11,452 10,731 14,874 21,255
Total 205,262 230,599 250,551 284,792
Execution Rate (%)
Recurrent 97.0% 99.5% 96.7% 93.8%
Development 72.2% 73.9% 78.4% 88.1%
Total 95.2% 97.9% 95.4% 93.4%
Note: Execution rate for counties’ education spending was assumed to be the same as the overall county budget execution rate.
4.2 Government effort to education
Government has been increasing its effort to education over recent years, measured by the
average spend on education per child in the population. Figure 7 presents the evolution of this
government effort in Kenya, which at market prices shows an annual average growth of 13.4%,
having increased from about Ksh 10,000 in 2010 to Ksh 16,000 per child. Looking at the effort in
constant prices the effort increased notably in real terms between 2009 and 2011, before assuming
marginal increments between 2011 and 2015. This reflects a number of underlying movements:

Analysis of Kenya’s expenditure in education, future sector cost scenarios and benefits of curriculum reform
© Oxford Policy Management 20
spending has been increasing in nominal terms but at the same time inflation has worn away some
of that increase; at the same time population has been increasing (see Table 1) which means the
growth in spending is spread amongst more children.
Figure 7 Government effort to education
4.3 Education budget by sub-sectors of education
Public education expenditure is shared between pre-primary (early childhood development and
education), primary education, secondary education, post-secondary non-tertiary education;
technical vocational education and training (TVET), and higher education; as well as administrative
expenditure. Table 12 shows the spending by these levels each year from 2010/11 to 2014/15 and
Figure 8 shows the distributions as percentages.
All levels of expenditure increased in absolute terms each year in the review period.
Administrative expenditure is shared across the various levels, and ranged between 6% and 9% of
all spending for the review period. Pre-primary education expenditure was only 0.2% of the total
education expenditure in 2010, but has since grown to about 2% in 2014/15, reflecting the
operationalisation of county budgets. Primary expenditure including teachers’ salaries constitutes
the biggest single share of the total education expenditure, ranging between 39% and 43%.
Secondary is the second largest constituent with about one third of total expenditure dedicated to
secondary programmes and salaries. The expenditure on universities ranged from 13% to 17%
while TVET accounts for about 5% of total education expenditure.
Table 12 Education expenditure by levels (current Ksh millions)
2010/11 2011/12 2012/13 2013/14 2014/15
Administrative Services 15,943 17,118 13,825 15,573 17,137
ECDE 405 1,687 1,687 1,675 5,073
Primary 71,546 80,184 96,409 104,062 118,590
Secondary 52,780 63,595 73,119 79,230 87,108
TVET 6,836 8,090 9,686 13,133 14,603
University 21,583 34,589 35,873 36,877 42,281
Grand Total 169,093 205,262 230,599 250,551 284,792
Source: The National Treasury, Ministry of Education, Kenya National Bureau of Statistics
6,000
8,000
10,000
12,000
14,000
16,000
18,000
2010 2011 2012 2013 2014 2015
Sp
en
din
g p
er
ch
ild
, K
sh
Current Constant 2014
Analysis of Kenya’s expenditure in education, future sector cost scenarios and benefits of curriculum reform
© Oxford Policy Management 21
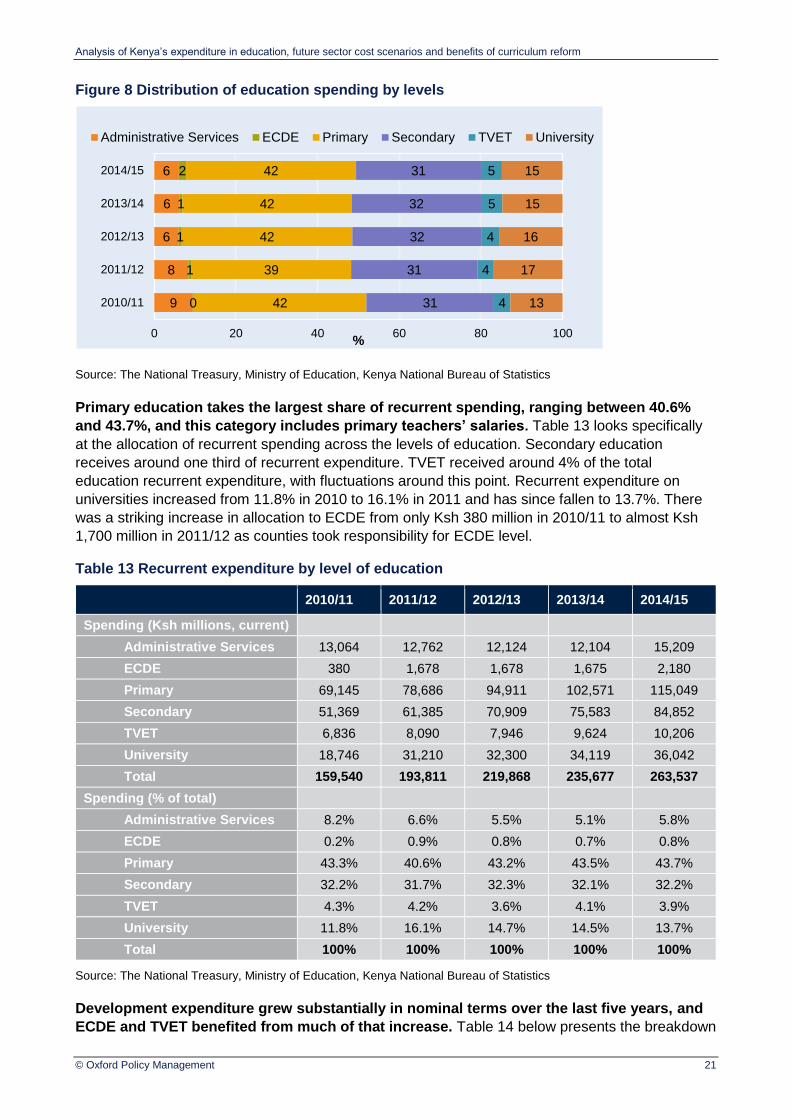
Figure 8 Distribution of education spending by levels
Source: The National Treasury, Ministry of Education, Kenya National Bureau of Statistics
Primary education takes the largest share of recurrent spending, ranging between 40.6%
and 43.7%, and this category includes primary teachers’ salaries. Table 13 looks specifically
at the allocation of recurrent spending across the levels of education. Secondary education
receives around one third of recurrent expenditure. TVET received around 4% of the total
education recurrent expenditure, with fluctuations around this point. Recurrent expenditure on
universities increased from 11.8% in 2010 to 16.1% in 2011 and has since fallen to 13.7%. There
was a striking increase in allocation to ECDE from only Ksh 380 million in 2010/11 to almost Ksh
1,700 million in 2011/12 as counties took responsibility for ECDE level.
Table 13 Recurrent expenditure by level of education
2010/11 2011/12 2012/13 2013/14 2014/15
Spending (Ksh millions, current)
Administrative Services 13,064 12,762 12,124 12,104 15,209
ECDE 380 1,678 1,678 1,675 2,180
Primary 69,145 78,686 94,911 102,571 115,049
Secondary 51,369 61,385 70,909 75,583 84,852
TVET 6,836 8,090 7,946 9,624 10,206
University 18,746 31,210 32,300 34,119 36,042
Total 159,540 193,811 219,868 235,677 263,537
Spending (% of total)
Administrative Services 8.2% 6.6% 5.5% 5.1% 5.8%
ECDE 0.2% 0.9% 0.8% 0.7% 0.8%
Primary 43.3% 40.6% 43.2% 43.5% 43.7%
Secondary 32.2% 31.7% 32.3% 32.1% 32.2%
TVET 4.3% 4.2% 3.6% 4.1% 3.9%
University 11.8% 16.1% 14.7% 14.5% 13.7%
Total 100% 100% 100% 100% 100%
Source: The National Treasury, Ministry of Education, Kenya National Bureau of Statistics
Development expenditure grew substantially in nominal terms over the last five years, and
ECDE and TVET benefited from much of that increase. Table 14 below presents the breakdown
9
8
6
6
6
0
1
1
1
2
42
39
42
42
42
31
31
32
32
31
4
4
4
5
5
13
17
16
15
15
0 20 40 60 80 100
2010/11
2011/12
2012/13
2013/14
2014/15
%
Administrative Services ECDE Primary Secondary TVET University
Analysis of Kenya’s expenditure in education, future sector cost scenarios and benefits of curriculum reform
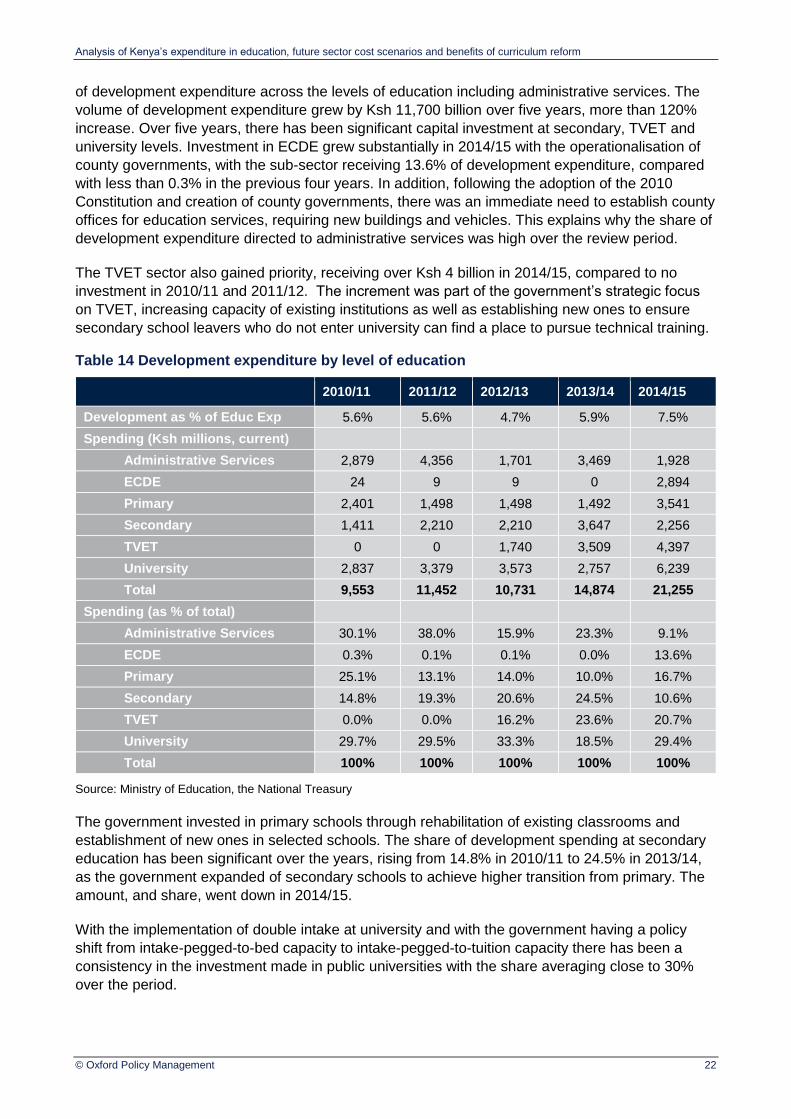
© Oxford Policy Management 22
of development expenditure across the levels of education including administrative services. The
volume of development expenditure grew by Ksh 11,700 billion over five years, more than 120%
increase. Over five years, there has been significant capital investment at secondary, TVET and
university levels. Investment in ECDE grew substantially in 2014/15 with the operationalisation of
county governments, with the sub-sector receiving 13.6% of development expenditure, compared
with less than 0.3% in the previous four years. In addition, following the adoption of the 2010
Constitution and creation of county governments, there was an immediate need to establish county
offices for education services, requiring new buildings and vehicles. This explains why the share of
development expenditure directed to administrative services was high over the review period.
The TVET sector also gained priority, receiving over Ksh 4 billion in 2014/15, compared to no
investment in 2010/11 and 2011/12. The increment was part of the government’s strategic focus
on TVET, increasing capacity of existing institutions as well as establishing new ones to ensure
secondary school leavers who do not enter university can find a place to pursue technical training.
Table 14 Development expenditure by level of education
2010/11 2011/12 2012/13 2013/14 2014/15
Development as % of Educ Exp 5.6% 5.6% 4.7% 5.9% 7.5%
Spending (Ksh millions, current)
Administrative Services 2,879 4,356 1,701 3,469 1,928
ECDE 24 9 9 0 2,894
Primary 2,401 1,498 1,498 1,492 3,541
Secondary 1,411 2,210 2,210 3,647 2,256
TVET 0 0 1,740 3,509 4,397
University 2,837 3,379 3,573 2,757 6,239
Total 9,553 11,452 10,731 14,874 21,255
Spending (as % of total)
Administrative Services 30.1% 38.0% 15.9% 23.3% 9.1%
ECDE 0.3% 0.1% 0.1% 0.0% 13.6%
Primary 25.1% 13.1% 14.0% 10.0% 16.7%
Secondary 14.8% 19.3% 20.6% 24.5% 10.6%
TVET 0.0% 0.0% 16.2% 23.6% 20.7%
University 29.7% 29.5% 33.3% 18.5% 29.4%
Total 100% 100% 100% 100% 100%
Source: Ministry of Education, the National Treasury
The government invested in primary schools through rehabilitation of existing classrooms and
establishment of new ones in selected schools. The share of development spending at secondary
education has been significant over the years, rising from 14.8% in 2010/11 to 24.5% in 2013/14,
as the government expanded of secondary schools to achieve higher transition from primary. The
amount, and share, went down in 2014/15.
With the implementation of double intake at university and with the government having a policy
shift from intake-pegged-to-bed capacity to intake-pegged-to-tuition capacity there has been a
consistency in the investment made in public universities with the share averaging close to 30%
over the period.

Analysis of Kenya’s expenditure in education, future sector cost scenarios and benefits of curriculum reform
© Oxford Policy Management 23
4.3.1 Spending on the NESP priorities
The National Education Sector Plan (NESP) under operation between 2013 and 2018 was
conceptualised to address six key priority areas, as summarized in Table 15 below. The priority
areas transcend the entire education system. At the time of planning, it was estimated that the cost
of ongoing activities as well as anticipated reforms in the sector would cost Ksh 275 billion in the
2014/15 financial year. In addition, tertiary education which includes TVET was projected to cost
Ksh 67 billion. Out of the total, 52% was estimated to be the cost associated with quality education.
This cost was inclusive of payment of teacher salaries, additional teacher recruitment, and
conducting research to facilitate pedagogical development of teachers. Reforming the basic
education curriculum to make it relevant was estimated to cost Ksh 881 million.
Table 15 Expected cost of education sector priority areas
Priority
Expected cost 2014/15
(Ksh millions) %
Access to Free & Compulsory Basic Education
91,079 27%
Education Quality 179,222 52%
Education Relevance 881 0%
Equity and Inclusion 2,319 1%
Governance & Accountability 595 0%
Social Competencies & Values 958 0%
Tertiary Education 67,126 20%
Grand Total 342,180 100%
Source: NESP Volume Two - Operational Plan
Actual spending on the sub-sectors of education in 2014/15 shows some similarities to the
NESP projections. Although actual expenditure cannot be mapped exactly against the priorities in
the NESP, spending by programme or sub-sector is shown in Table 16 below. Overall, the total
spending was not as high as the projected requirement of Ksh 342 billion. Whilst teacher resource
management did not receive as high a spend as required (Ksh 170 billion actual compared with
Ksh 179 billion), it received a much higher share of all spending than expected, particularly since
the 52% projection for education quality included other costs relevant to quality. With teachers
taking a large share, the proportion going to ECDE, primary and secondary – aligning more closely
to access – is much lower than the projected Ksh 91 billion, at only Ksh 56 billion (20%).
Table 16 Education sector expenditure by programme
Program Actual spend 2014/15
Ksh millions %
Administrative services 10,424 4%
ECDE – County spending 5,066 2%
Primary Education 20,197 7%
Secondary Education 30,445 11%
Teacher Resource Management 169,856 60%
TVET & Youth Training 6,522 2%
Higher Education 42,281 15%
Grand Total 284,792 100%

Analysis of Kenya’s expenditure in education, future sector cost scenarios and benefits of curriculum reform
© Oxford Policy Management 24
The expected cost of the development of the curriculum reform has now been revised to Ksh 1,693
million in total by 2024, actually much lower than the lifetime costs estimated in the NESP, which
were Ksh 881 million in just one year.
4.4 Review of salary and non-salary expenditure
In projecting forward the costs of the sector, it is critical to understand how spending has been
distributed in terms of economic classification – salaries, goods and services and investments.
The sector’s salaries account for between 60% and 66.5% of the total recurrent expenditure,
leaving the remaining for other running costs to support quality education. Table 17 below
shows the decomposition of education recurrent expenditure into four classifications, separating
salary and non-salary items. Salaries in the sector are included in ‘compensation’, and spending
here grew from Ksh 106 billion to Ksh 173 billion representing a growth of 63% in four years. The
level of salary spending is important for budgeting as the Government, and the education ministry
in particular, generally has little room to reduce the wage bill. Grants and transfers include the Free
Primary Education and Free Day Secondary Education funds as well as tertiary student grants,
and these ranged between one fifth and one quarter of the recurrent expenditure.
Table 17 Salary and non-salary expenditure, 2010/11-2014/15 (current Ksh millions)
Economic Classification 2010/11 2011/12 2012/13 2013/14 2014/15
Compensation to Employees 106,120 116,384 142,148 156,392 173,465
Grants and Other Transfers 31,138 50,889 50,912 52,614 57,274
Use of goods and services 5,473 3,872 4,114 4,806 4,793
Other Recurrent 16,809 22,666 22,694 21,864 28,006
Grand Total 159,540 193,811 219,868 235,677 263,537
Source: The National Treasury, Ministry of Education, Kenya National Bureau of Statistics
The total teachers’ wage bill accounts for more than 90% of the salaries in the sector, and
grew by close to 70% between 2010 and 2014 at an annual average rate of 14%. Primary
teachers’ salaries constitute about 60% of the total teachers’ salaries, secondary accounts for
35%, while teachers in teacher training colleges and TVET institutions about 5% (Table 18). These
are all employed by the Teachers Service Commission and are fully compensated by Government.
Table 18 Spending on teacher salaries, 2010/11-2014/15 (current Ksh millions)
2010/11 2011/12 2012/13 2013/14 2014/15
Primary Teachers 58,330 65,995 82,219 90,330 98,379
Secondary Teachers 33,522 37,927 47,251 51,912 56,538
Post-Secondary Teachers 4,786 5,415 6,746 7,412 8,072
Grand Total 96,638 109,337 136,217 149,654 162,989
Source: The National Treasury, Ministry of Education, Kenya National Bureau of Statistics
4.5 Recurrent Costs per Pupil/Student
Unit costs across the sub-sectors have generally been stagnant or falling in real terms, with
the exception of pre-primary which has seen substantial increases in average spending
(Table 19). In constant prices, ECDE cost per pupil increased significantly from Ksh 300 in 2010 to
around Ksh 1,000 in the following years, though with fluctuations. At primary level there was an

Analysis of Kenya’s expenditure in education, future sector cost scenarios and benefits of curriculum reform
© Oxford Policy Management 25
increase in the unit cost by 15% from 11,976 in 2010 to 13,763 in 2015. At secondary level, cost
per student decreased by about 14% over the same period. Real unit costs for both TVET and
university levels fell notably over the period, such that 2014 spending per student was around 65%
and 54% of the 2010 levels for TVET and university respectively. These sectors experienced
substantial increases in enrolment, and the reduction in unit cost could reflect more efficient use of
resources, or a prioritisation away from TVET and university within the education sector. Further
research into the TVET and university sectors may be worthwhile to understand this better.
Table 19 Student unit costs in public institutions, 2010-2014
2010 2011 2012 2013 2014
In constant Ksh 2014
ECDE 298 1,132 990 904 1,054
Primary 11,976 12,019 13,017 13,195 13,763
Secondary 45,591 45,992 44,840 41,403 39,012
TVET 91,861 82,189 61,014 60,611 59,429
University 183,587 244,174 185,437 126,620 99,199
In current Ksh
ECDE 218 916 877 840 1,054
Primary 8,749 9,729 11,525 12,272 13,763
Secondary 33,307 37,226 39,699 38,506 39,012
TVET 67,109 66,525 54,019 56,371 59,429
University 134,120 197,637 164,178 117,762 99,199
In % of GDP per capita
ECDE 0.3% 1.0% 0.8% 0.7% 0.8%
Primary 10.6% 10.3% 11.0% 10.8% 11.0%
Secondary 40.4% 39.5% 37.9% 34.0% 31.3%
TVET 81.5% 70.6% 51.5% 49.8% 47.7%
University 162.8% 209.8% 156.6% 104.0% 79.5%
Source: Authors’ Calculations
Meanwhile in current prices, government spending per pupil increased for ECDE, primary and
secondary education, but as with the constant price unit costs, decreased dramatically for TVET
and university between 2010 and 2014. Figure 9 below shows how per pupil spending increased in
current terms but less so in constant terms in both primary and secondary.

Analysis of Kenya’s expenditure in education, future sector cost scenarios and benefits of curriculum reform
© Oxford Policy Management 26
Figure 9 Cost per pupil/student in primary and secondary, 2010-2014 (current and constant prices)
Expressing the unit cost per pupil/student in relation to per capita GDP is interesting because it
shows its evolution relative to the real development of the economy. This is also shown in Table 19
above. At primary level, the cost per pupil remained relatively stable relative to GDP per capita
over the period, at around 10.8%. At secondary, TVET and university, the cost per student as a
percentage of GDP per capita dropped by 9, 34 and 83 percentage points respectively.
Compared to its neighbours with 7 or 8 year primary cycles, Kenya’s unit cost of primary is above
the average. Ethiopia and Kenya spend similar amounts per pupil in primary education as a share
of their GDP, while Malawi and Mozambique spend about 20% more per pupil than the case in
Kenya. Uganda and Tanzania spend much less than Kenya in primary education. Reflecting on the
comparisons in section 4.1.1, rather than seeing Kenya as spending too much or too little, Kenya is
more efficient in delivering outcomes (primary completion) than any of these other countries.
Table 20 International comparison: unit cost per pupil in primary as % of GDP per capita
Country Unit cost as % of GDP per capita
Kenya 11.0
Ethiopia 11.1
Malawi 13.1
Mozambique 12.5
Uganda 6.9
Tanzania 9.3
Average selected countries 10.7
Average Africa 10.5
Source: UIS, IIEP-Pôle de Dakar, World Bank
Another measure often used to review unit costs in education is the ratio of unit cost in each level
compared to that of primary (Table 21). In 2014, secondary, TVET and University student received
2.8, 4.3 and 7.2 times more resources respectively from the government relative to pupils enrolled
in primary education. These were all substantial reductions from 2010, when spending per student
in these levels was 3.8, 7.7 and 15.3 times the primary spending per pupil.
0
10,000
20,000
30,000
40,000
50,000
2010 2011 2012 2013 2014
Un
it c
ost
per
stu
den
t, K
sh
Primary current
Primary constant 2014
Secondary current
Secondary constant 2014

Analysis of Kenya’s expenditure in education, future sector cost scenarios and benefits of curriculum reform
© Oxford Policy Management 27
Table 21 Unit costs in public institutions relative to primary school unit costs, 2010-2014
2010 2011 2012 2013 2014
ECDE 0.02 0.09 0.08 0.07 0.08
Primary 1.00 1.00 1.00 1.00 1.00
Secondary 3.81 3.83 3.44 3.14 2.83
TVET 7.67 6.84 4.69 4.59 4.32
University 15.33 20.31 14.25 9.60 7.21
Source: Authors’ Calculations
In summary, in real terms the country increasingly spent more on each pupil at ECDE and primary
education and much less on each student enrolled at secondary, TVET and university over the last
five years. This notwithstanding, even after the sharp decrease at secondary, TVET and university
levels, each student therein received far more resources compared to each pupil in primary.
4.6 Off-budget spending on education
The analysis above has presented public spending on education, but education financing is not
limited to the resources provided by the Government. There are several other stakeholders such
as parents and other education partners who contribute to the financing of education in Kenya.
4.6.1 Development partners
Development partners (DPs) play a substantial role in supporting Kenya’s education sector.
Although exact figures are not known, there are indications that DPs’ funding could amount to as
much as USD 193 million – or Ksh 19 billion, in 2014 alone (Table 22).5 This would be equivalent
to 7 to 8% of the amount that the government spends on education directly, and could even be
higher than the government’s own development spending. Of the DPs’ spending, more than half
goes to the NESP priority areas, and the rest to other areas including higher education. These
figures should be used with caution as there may be double-counting of activities across the
priority areas.
Table 22 Development partners’ education commitments, 2014-2016 (current USD millions)
Spending ($millions) 2014 2015 2016
In NESP
Priority 1 4.1 4.1 2.1
Priority 2 53.6 52.2 52.8
Priority 3 21.8 29.8 22.4
Priority 4 9.0 7.8 3.2
Priority 5 0.3 0.2 0.2
Priority 6 4.4 1.5 1.5
Total 93.2 95.7 82.2
Outside NESP 100.7 21.3 21.3
Total 193.9 117.0 103.5
Source: Development partners and authors’ own calculation. The years for spending are not always clearly defined so this is based on estimates of the split over multiple years. It is assumed all numbers are given in USD.
5 These figures were provided by the Education Sector Development Partners Coordination Group, and include multilateral organisations, bilateral donors, and international non-governmental organisations.

Analysis of Kenya’s expenditure in education, future sector cost scenarios and benefits of curriculum reform
© Oxford Policy Management 28
4.6.2 Parents
Contributions from parents may be grouped into two main categories as follows:
direct contributions to school through
fees (except officially for primary education)
instructional materials
salaries for teachers employed by the Board of Management (BOM), and
other various fees and levies paid to schools.
indirect contributions such as transport, uniforms and so on.
This analysis has not been able to exhaustively cover all these aspects of education financing but
has attempted to reflect some of the main categories of costs.
Table 23 shows the estimated direct spending on education for public schools by category and
education level. The total cost borne by households was estimated at Ksh 132 billion in 2014,
which is almost two thirds of the amount put in by Government on primary and secondary (Ksh 206
billion). Boarding fees account for 75% of this cost. These are underestimates given that some
fees and indirect costs are not included.
Table 23 Direct household spending in public schools (2014) (current Ksh millions)
Primary Secondary Total
BOM Teachers 11,350 22,135 33,485
Boarding Fees 99,277 99,277
Total 11,350 121,412 132,762
Source: Authors’ Calculations based on EMIS data. EMIS provides the number of BOM teachers, and an estimated salary based on an EMIS verification sample. Boarding fees were estimated from the number of boarding students reported in EMIS, and the Government’s Secondary School Report.
It is also important to note that parents pay substantial fees in private schools. Due to a lack of
accurate and representative data, the detailed costs of private schools cannot be included in this
report. One of the methodologies of estimating this type of contribution to education financing is to
make use of per pupil spending in public schools. This together with enrolments in private
institutions should give an indicative total cost of what is paid by parents to private schools,
assuming the average costs are the same. Of course it is possible that private schools have higher
unit costs than public schools, and also some may be lower where they are in the low-cost private
school market. However, using the average rate from public schools gives an indication of the
potential resources the Government would need to provide if there were no private schools or
universities. Table 24 shows the estimated cost of the private sector under these assumptions.
Table 24 Estimated cost of education in private institutions (current Ksh millions)
2010 2011 2012 2013 2014
Primary 12,687 14,331 17,545 18,402 21,900
Secondary 3,700 4,421 5,107 5,444 6,112
University 5,076 11,999 8,941 8,437 7,980
Source: Authors’ calculations. This is estimated by applying the unit costs in public institutions to the total enrolments in private institutions.
Analysis of Kenya’s expenditure in education, future sector cost scenarios and benefits of curriculum reform
© Oxford Policy Management 29
5 Kenya’s Curriculum Reform
Kenya’s current process of curriculum reform has been developing at full speed since 2014, when
the Kenya Institute for Curriculum Development (KICD) established a Curriculum Review Steering
Committee and MOEST set up a technical committee. However, the reform’s origins date back
further to policies, laws and taskforces. This chapter setting out the evolution and rationale for the
curriculum reform. It then moves on to briefly describe the key elements of the reform.
Box 4 Chapter 5: Key findings
Over the last two decades Kenya has come to demand comprehensive reforms in education, to respond to societal needs, economic ambitions, and to reduce inefficiency, wastage and inequities in the system. The current curriculum reform process responds to internal commitments as well as international ones.
The curriculum reform process is led by MOEST with much activity undertaken by KICD.
Major components of the proposed new curriculum include: a shift from 8-4 to 6-3-3 in primary and secondary education; a set of competencies for learners at each level; provisions for local context and content in the curriculum; introduction of three pathways in secondary education; more emphasis on formative assessment; and inclusive education for children with special education needs.
5.1 Evolution and rationale for curriculum reforms in Kenya
The last time Kenya conducted major curriculum reforms was in 1985 when there was a shift from
the then 7-4-2-3 system (seven years of primary, four years of lower secondary, two years of upper
secondary, and three years of university) to the 8-4-4 system (primary, secondary, university). This
change sought to reduce the pressure on the need for higher education and thus develop practical
and meaningful skills for the development needs of the country. At the turn of the century, there
were some efforts to review the curriculum based on the recommendations of the Commission of
Inquiry into the Education System (1999), but no substantial changes. In 2002, a review of the
curriculum found it to be overloaded, after which some subjects were removed while others were
merged. The practical subjects were affected most substantially.
The desire of Kenyans for comprehensive reforms in education that respond to societal needs and
address the emerging developmental needs is seen as the primary driver of the reform agenda.
According to the KICD Curriculum Reforms Needs Assessment Report (2016), there is a need to
focus on a balanced, equitable, relevant and sustainable education system. Realisation has also
been growing that there is inequality and wastage within the system. Inequalities are evidenced
through incomplete access, particularly for marginalised groups such as populations in arid areas
and children with special needs. The inefficiency can be seen in low transition rates from low to
higher education levels, and declining enrolments in tertiary colleges whilst demand for university
education keeps rising amidst national industrial and development priorities.
Education is recognised as a critical sector in the social pillar of the Vision 2030 (Republic of
Kenya, 2008). This first well-coordinated and structured development strategy in Kenya was
developed riding on the successes of the 2003 Economic Recovery Strategy for Wealth and
Employment Creation. The strategy introduced paradigm shifts in development thinking. Vision
2030 introduced major reforms across the entire development spectrum and the government
shifted spending and development priorities towards those that were aligned to the Vision.
The curriculum reform process is a culmination of many developments and increasing awareness
of the need for changes. Both internal commitments (to achieving Vision 2030 and implementing
the 2010 Constitution), as well as international obligations, give a strong backing and rationale for
the country to make comprehensive curriculum reforms that address the underlying structure,

Analysis of Kenya’s expenditure in education, future sector cost scenarios and benefits of curriculum reform
© Oxford Policy Management 30
implementation and evaluation mechanisms of the curriculum. The evolution of and rationale for
the reform process to where we are today can be tracked through a number of key documents,
which are summarised in Table 25 below.
Table 25 Key documents in the evolution of the curriculum reform
Document Curriculum Reform Provision
Vision 2030 (Republic of Kenya, 2008)
Visualises Kenya providing a globally competitive quality education.
Education priorities and spending are aligned to the medium term plans for the Vision. Developments across the country are hinged on this broad
development plan.
The East Africa Treaty Protocol (2008)
The Education Protocol foresees a four-phased development process of harmonisation of the East African Education Systems and Training Curricula
(already complete in Tanzania and Uganda) that seeks to fundamentally ensure the free movement of human resources.
Curriculum Summative Evaluation Report (KICD, 2009)
The summative evaluation identified that learners exiting secondary schools were lacking in competencies and skills appropriate for the job market, pointing
to the need for a system with less wastage and inefficiencies.
Constitution of Kenya (Republic of Kenya, 2010)
Article 53 guarantees the right to free and compulsory basic education to all children. It defines a child as anyone below 18 years, directly implying that the curriculum ensures continued education of all children. Articles 10(1) national
values, and Articles 12, 20, 35, 42, 43, 53, 54, 55, 57 and 59 all touch on education.
Taskforce on Aligning Education to the Constitution and Vision 2030 (Odhiambo, 2012)
Recommended and even proposed a complete structure of education with a competency-based curriculum; with provision for alternative pathways while integrating ICT as a key driver of a knowledge-based economy that would
guarantee higher completion rates.
Taskforce on Aligning Higher Education to the Constitution and Vision 2030 (Some, 2012)
Reviewed the architecture and design of TVET and higher (University) education making far-reaching recommendations that led to reforms in legal
and policy design of TVET and higher education. This formed the basis for the New Universities Act, Science Technology and Innovation Act and the TVET
Act noting the critical role TVET should play in national development.
Jubilee Party Presidential Campaign Manifesto (Jubilee Coalition, 2012)
The manifesto identified ICT as a key driver to curriculum implementation, and put curriculum reforms on the Government’s agenda. The Government has since May 2016 began to roll out the digital literacy programme in primary
schools.
The National Government allocated funds in both the 2015/16 and 2016/17 fiscal years towards the curriculum reforms clearly demonstrating the
commitment towards the curriculum reforms.
Basic Education Act (Republic of Kenya, 2013)
The Act was a major reform replacing the 1968 Education Act. Enacted as a recommendation of the Sessional Paper and the Odhiambo Taskforce, the Act seeks to operationalize the right to free and compulsory basic education. The
Act indirectly implies the mainstreaming of pre-primary as part of basic education.
Sessional Paper No. 2 of 2015 (Republic of Kenya, 2015)
Sessional Paper No. 2 of 2015 on ‘Reforming Education and Training in Kenya’ recommends reforming the education and training sector to provide for
a holistic development education, competency-based curriculum, establishment of a national learning assessment system, and alternative
pathways.
This is the broad framework for the curriculum review.
National Technical Committee on Curriculum Reform (MOEST, 2015b)
Proposed a road map for rolling out curriculum reform. Major recommendations of the committee included restructuring from 8-4-4 to 2-6-6-
3, creating alternative pathways at secondary and for learners with special needs, providing continuous school-based assessments, and for KICD to carry
out a needs assessment and preparation for the reforms.
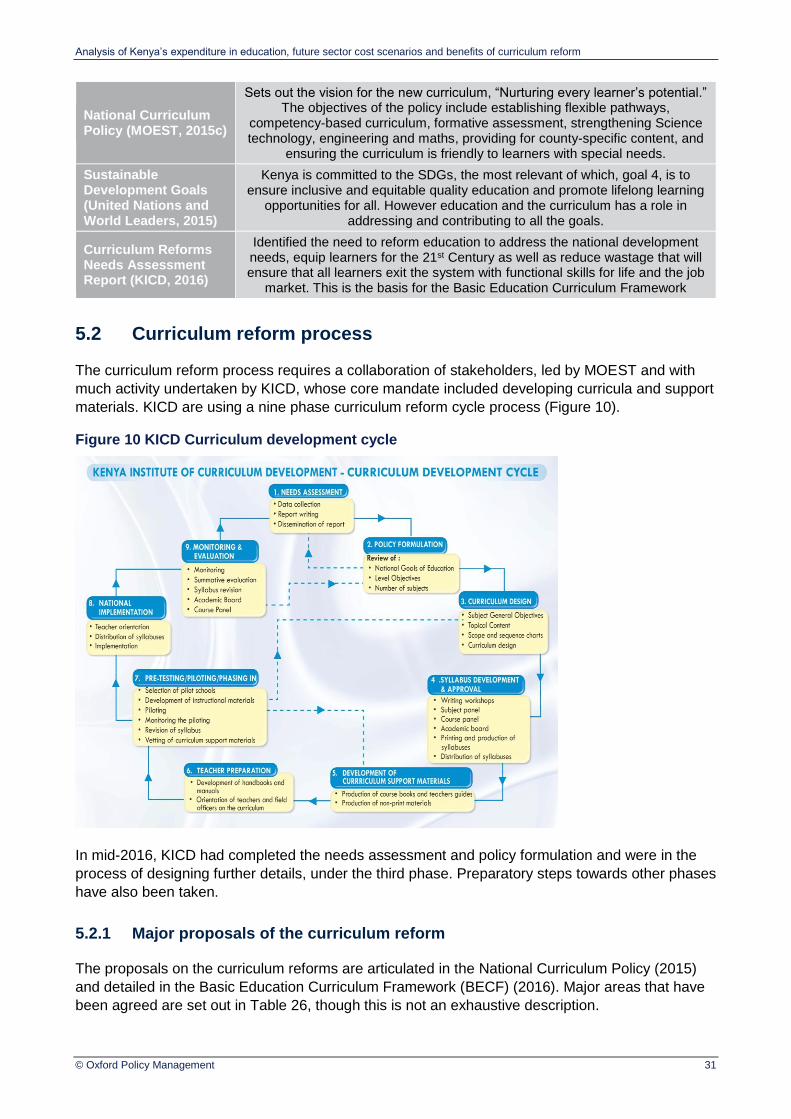
Analysis of Kenya’s expenditure in education, future sector cost scenarios and benefits of curriculum reform
© Oxford Policy Management 31
National Curriculum Policy (MOEST, 2015c)
Sets out the vision for the new curriculum, “Nurturing every learner’s potential.” The objectives of the policy include establishing flexible pathways,
competency-based curriculum, formative assessment, strengthening Science technology, engineering and maths, providing for county-specific content, and
ensuring the curriculum is friendly to learners with special needs.
Sustainable Development Goals (United Nations and World Leaders, 2015)
Kenya is committed to the SDGs, the most relevant of which, goal 4, is to ensure inclusive and equitable quality education and promote lifelong learning
opportunities for all. However education and the curriculum has a role in addressing and contributing to all the goals.
Curriculum Reforms Needs Assessment Report (KICD, 2016)
Identified the need to reform education to address the national development needs, equip learners for the 21st Century as well as reduce wastage that will ensure that all learners exit the system with functional skills for life and the job
market. This is the basis for the Basic Education Curriculum Framework
5.2 Curriculum reform process
The curriculum reform process requires a collaboration of stakeholders, led by MOEST and with
much activity undertaken by KICD, whose core mandate included developing curricula and support
materials. KICD are using a nine phase curriculum reform cycle process (Figure 10).
Figure 10 KICD Curriculum development cycle
In mid-2016, KICD had completed the needs assessment and policy formulation and were in the
process of designing further details, under the third phase. Preparatory steps towards other phases
have also been taken.
5.2.1 Major proposals of the curriculum reform
The proposals on the curriculum reforms are articulated in the National Curriculum Policy (2015)
and detailed in the Basic Education Curriculum Framework (BECF) (2016). Major areas that have
been agreed are set out in Table 26, though this is not an exhaustive description.

Analysis of Kenya’s expenditure in education, future sector cost scenarios and benefits of curriculum reform
© Oxford Policy Management 32
Table 26 Major aspects of the new curriculum
Curriculum Reform Aspect
New Curriculum
Curriculum Vision Curriculum Vision: Nurturing Every Learner’s Potential
Curriculum pillars and theoretical framework
Introduces and emphasises values. The values to be included in the BECF will be drawn from the National Values of Kenya Act, 2011: responsibility, respect,
excellence, care and compassion, understanding and tolerance, honesty and trustworthiness, trust, and being ethical. Other values will be unity, integrity,
peace, humility, cooperation, and simplicity
Competencies Seven expected competencies of basic education, including communication and
collaboration, critical thinking and problem solving, imagination and creativity, citizenship, digital literacy, learning to learn and efficacy.
Organisation of learning
Shifts basic education structure from 8-primary-4-secondary the following levels:
early years – 5 years (2 years pre-primary, 3 years lower primary with expected entry to primary at age 6); middle school – 6 years (3 years upper primary, 3 years
junior secondary); high school – 3 years senior secondary.
This is followed by four years of tertiary education.
Junior secondary schools are expected to be housed in primary schools.
Learning areas
Defines the number of learning areas as follows: pre-primary (5), lower primary (9), upper primary (10 compulsory and an optional foreign/indigenous language), junior secondary (12 compulsory and a minimum of 1 and maximum 2 optional
from 7 areas), senior secondary (2 core areas regardless of the pathway).
Provides for local contexts and county-specific content.
Identifies ICT as a learning tool across the continuum, with digital-based instruction a methodology used in all learning areas and all classes.
Teachers
Focus shall be on in-service training for teachers on paradigm shift to competency based curriculum, new training on new learning areas, increased capacities on
formative assessment and inclusivity. Plans include reviewing the existing teacher training approaches and content.
Materials Learning areas will have activity books that are more practical than information-
heavy books. There would be one activity book per child per grade, and these will be re-used by the next year’s cohort. Teachers will have information books.
Definition and operationalisation of pathways in education
Identifies and describes three pathways at the Senior Secondary Level:
Social Sciences (previously called ‘General’),
Arts and Sports (previously called ‘Talent’),
Science, Technology, Engineering and Maths (previously called ‘Technical’).
Assessment
More emphasis on formative, continuous assessment with individual learning profiles being established and following a child through the system. Assessment
will be more holistic – looking not only at cognitive skills but also non-cognitive and motor skills.
Inclusive education Learners with physical disabilities, visual impairment and hearing impaired will
follow the regular curriculum with modifications.
Pertinent and contemporary education issues
Identifies and describes six pertinent and contemporary education issues that include: citizenship, health education, life skills/values education, education for
sustainable development, non-formal programmes and service learning and parental involvement.
Transition and roll-out
The curriculum shall be implemented as a pilot model in some pre-primary and primary schools, before final roll-out following through the cohorts.
Analysis of Kenya’s expenditure in education, future sector cost scenarios and benefits of curriculum reform
© Oxford Policy Management 33
6 Education projection model
This chapter sets out projections of what the education sector might look like – and in particular
what this means for costs – up to 2030. Any future projections are conjecture and depend on
numerous assumptions about factors outside of the sector’s control, those the sector can try to
influence, and those the sector can control through policy decisions. Although there is no known
scenario of what will happen were there to be no curriculum reform, we set out a number of
scenarios which show how costs change when assumptions – particularly those related to
introducing the new curriculum – change. The assumptions are also drawn from Education for All,
the Sustainable Development Goals as well as Kenya’s long term Vision 2030.
The model, which is built in a spreadsheet, builds from the bottom up the various cost drivers of
education (for example from population to enrolments to teachers and classrooms to salary costs).
Although the details of the model are not set out here, the model was presented to stakeholders
from the Ministry, KICD and UNICEF to demonstrate how the concepts behind it and test some of
the assumptions. The model will be provided to these partners for them to own and further use and
develop for decision making.
This chapter begins by presenting the assumptions around the macroeconomic framework and
what this means for government resources to the education sector. It moves on to review
projections in the underlying population, which drive changes in enrolment and therefore costs.
Section 6.3 then presents the development of three projection scenarios. These scenarios are
based on different assumptions about enrolment and student flow, and the efficiency and unit costs
in the system relating to the curriculum reform. The implications for enrolment by level and
recurrent costs are explored, followed by analysis of the extent to which these scenarios are
affordable in the projected fiscal envelope. The section then looks at what levels of GDP and
domestic revenue would need to be allocated to education to afford the new curriculum scenario.
Finally section 6.4 estimates the development costs, including both the short term costs of
preparing the new curriculum, and the ongoing costs of implementing government investment
priorities, including those associated with the new curriculum.
Box 5 Chapter 6: Key findings
Based on expectations of GDP growth (4.4%) and revenue collection (19.4%), real allocations to education could almost double over the next 15 years if education continues to receive 25.4% of domestic resources.
Meanwhile the school aged population is projected to grow to from 18 million in 2015 to 24 million in 2030, which is a key driver of increased enrolments.
Three scenarios are developed to look at the affordability of various assumptions for the sector.
Under a status quo scenario, enrolment will increase due to population growth, and recurrent costs to the sector will increase. This be affordable given the conservative resource envelope estimates presented above.
If the government pushes to achieve universal basic education, with 100% enrolment and completion up to secondary and follow through impacts on higher education, enrolment expands substantially. As a result, the recurrent costs become over 50% more expensive than the status quo by 2030, and this introduces a Ksh 223 billion annual financing gap.
Introducing the new curriculum organisation, which reduces the years of senior secondary and instead introduces junior secondary (assumed to run with primary level cost structures), the total costs fall and reduces the financing gap by Ksh 33 million. However this is still not affordable.
Government would have to allocate over 35% of its domestic revenue to education in 2030 to afford the new curriculum scenario presented here.

Analysis of Kenya’s expenditure in education, future sector cost scenarios and benefits of curriculum reform
© Oxford Policy Management 34
These scenarios provide an opportunity for the government to review the assumptions and policy targets to find a future scenario which looks financially plausible.
In addition, development costs could reach up to Ksh 90 billion per year, largely driven by laptops for students, as well as new textbooks under the new curriculum. Again, this is well above the usual development budget from government, which was around Ksh 20 billion in 2014/15.
6.1 Macro-economic Framework and Projected Resources
Chapter 4 provided a review of expenditure in the education sector and some of the findings will be
used conservatively in projecting the resources likely to be available for the sector in the simulated
period. All costs in the projection model are expressed in constant (2014) prices, meaning
regardless of inflation.
With fairly conservative assumptions, Kenya’s domestic revenues available for government
spending could almost double between now and 2030. Kenya’s gross domestic product is
projected to almost double between 2015 and 2030. With an estimated annual GDP growth rate of
4%, the GDP is expected to increase from Ksh 5.5 trillion in 2015 to Ksh 10 trillion in 2030 (see
Table 27). Should the domestic revenues net of lending remain conservative at 19.4% of the
country’s wealth, the resources at the disposal of government would increase from Ksh 1 trillion in
2015 to Ksh 1.95 trillion in 2030. However, with recent increases in the effort to collect domestic
revenue, this projection may even be conservative and resources could increase further.
Table 27 Projected national resources, 2014-2030 (Ksh millions, constant prices)
2014 2015 2020 2025 2030
GDP 5,357,672 5,571,979 6,779,164 8,247,889 10,034,819
Domestic Revenue 1,039,388 1,080,964 1,315,158 1,600,091 1,946,755
Education Recurrent Expenditure 263,537 274,078 333,458 405,703 493,600
Source: 2014 and 2015 taken from earlier chapters, projections are authors’ calculations based on model assumptions
As a direct consequence, if the recurrent spending dedicated to education by the national and
county governments remains at 25.4% of domestic resources, education recurrent expenditure will
almost double between 2015 and 2030. This would mean an increase from Ksh 274 billion to Ksh
494 billion in 2015 and 2030 respectively, as shown in Table 27 above. This significantly increases
the fiscal space for the government to implement education programmes.
6.2 Population growth projections
The cost projections are influenced by the enrolment rates in the education sector, the population
growth for each of the school/college age groups and the increase in unit costs in constant prices.
The total population is projected to increase by 46% from its 2014 levels, reaching 62.7 million in
2030. The school age population will have a net addition of 6 million, increasing from 18 million in
2014 to 24 million in 2030 (
Table 28). This of course has implications for the education sector as there are more children of
school-going age and thus expected to enrol. However, the share of this age group relative to the
total population will fall by 3 percentage points, reducing their relative pressure on resources.

Analysis of Kenya’s expenditure in education, future sector cost scenarios and benefits of curriculum reform
© Oxford Policy Management 35
Table 28 Projected total and school-age population
2014 2015 2020 2025 2030
Total Population 42,961,181 44,139,331 50,133,872 56,193,830 62,653,179
School Age Population 17,865,338 18,150,123 19,769,940 21,805,002 24,151,387
School Age as % of Population 41.6% 41.1% 39.4% 38.8% 38.5%
Source: 2014 and 2015 taken from earlier chapters, projections from the model
The increase in numbers of children at each of the age ranges for basic education are major
drivers for expenditure. The population of children eligible for early childhood development and
education (age 3 to 5 years) is expected to grow from 4.1 million in 2014 to 5.2 million in 2030 (see
Table 29). At primary level, the population grows from 7.5 million to 10.3 million. Junior secondary
– which is equivalent to grades 7-8 and form 1 in the current structure – has an eligible population
of 3 million in 2030, up from 2.3 million in 2014. Senior secondary (form 2-4 in the current
secondary system) has a growth in eligible population from 4 million to 5.6 million.
Table 29 Projected population by basic education level
2014 2015 2020 2025 2030
ECDE Age 3-5 4,102,148 4,161,763 4,480,099 4,835,026 5,230,752
Primary* Age 6-11 7,451,273 7,537,990 8,267,931 9,218,310 10,277,933
Junior Sec* Age 12-13 2,289,181 2,339,134 2,461,539 2,735,544 3,049,989
Senior Sec* Age 14-17 4,022,736 4,111,237 4,560,372 5,016,122 5,592,713
Source: Authors’ projections based on 2.2% population growth and 0.7% mortality. *Note that as the existing primary and secondary have been redistributed into primary, junior secondary and senior secondary, the total amounts in 2014 shown here should be added across these three levels to match the primary and secondary amounts in chapters 3 and 4.
6.3 Cost projections
This section provides indicative future cost scenarios for the sector based on different
assumptions. Whereas the main focus is to model the expected impact of curriculum reform on
future costs, the model provides a sector-wide view of what will happen under the considered
assumptions. All levels of education – from basic through to university education, and including
administration – are included in the model, although it is basic education which is the focus of this
discussion. The assumptions can be further adjusted by stakeholders to align the outcomes to
Government targets and also ensure that the corresponding resource requirements for achieving
the results are within the expected macroeconomic envelope. The simulation model can yield any
number of other scenarios based on varied assumptions. The Government is encouraged to make
use of the tool and fine tune the assumptions to get optimal results.
Three expenditure scenarios have been selected to demonstrate the implications for
enrolment, expenditure and financing gaps between 2014 and 2030. The year 2014 acts as
the baseline, and is based on the actual data presented in chapters 2, 3 and 4, and 2030
represents the endline, in line with Kenya’s Vision 2030 and the Sustainable Development Goals.
These scenarios have been chosen to demonstrate the incremental changes as key assumptions
change. Box 6 sets out the rationale and hence the assumptions behind each of the scenarios.
The rest of this section works through implications of the three scenarios on key outcomes of
interest. First, the projected enrolment in basic education is assessed. Following this, the recurrent
spending of each scenario at basic education is analysed, which is driven by the enrolment as well
as other assumptions which are discussed. In section 6.3.4, the enrolment and recurrent costs at

Analysis of Kenya’s expenditure in education, future sector cost scenarios and benefits of curriculum reform
© Oxford Policy Management 36
post-basic education are looked at, in other words all forms of adult and alternative education. The
total implication for recurrent spending is assessed in 6.3.5, analysing what this means for the
financial gap with the projected resource envelope. Finding a large fiscal gap, 6.3.6 looks at how
high the government’s allocation to education would need to be to fund these scenarios.
Section 6.4 goes on to look at the development costs for the sector. These are considered
separately to recurrent expenditure as recurrent is seen as the ongoing running costs needed for
education service provision to be sustainable. There are two types of development costs covered:
the short term costs of developing and rolling out the new curriculum, and the longer term
development costs of the sector implementing the new curriculum.
6.3.1 Developing the scenarios
As mentioned, three scenarios have been developed to shape thinking and discussions about the
affordability of the sector in future years. The differences between the three scenarios are given in
Box 6. With hundreds of variables about the future unknown, many assumptions remain fixed
through all the three scenarios. The share of enrolment in private remains at 14.3% in Stds7-
8/Junior secondary and 6.7% in secondary (as today). Since GDP is expected to grow within the
period, the model has slightly reduced the average teacher salary from current rates to 3.6 times
the GDP per capita for primary, 3.9 times for junior secondary and 5.5 times for senior secondary
for all considered scenarios. These are down from 3.8, 4.1 and 6.3 respectively in 2014. It is
important to note that this does not reduce the average teacher salaries, just how high they are
relative to average GDP. The unit cost of ECDE remains constant as a share of the GDP per
capita. More details on the fixed and varying assumptions are given in Annex D.
Box 6 Assumptions in the evolution of three expenditure scenarios
Scenario 0: Status quo
This scenario is based on retaining the status quo in 2014, in other words there is no change in the structure of education (8-4-4), and enrolment and pupil flow rates remain the same as in 2015. This scenario is the closest to imagining ‘nothing changes.’ Meanwhile, the conservative assumptions around the continuing resource available to education, set out in section 6.1 above, hold in this scenario.
Detailed assumptions are based on continuation of the current rates, including: primary gross intake rate of 100% with 5% repeating class 1; primary retention (Class 1-8) of 77%; transition from primary to secondary at 80%; secondary retention of 78%. Pupil teacher ratios (PTR) remain as they are at the baseline (36.2 in primary, 35 in Stds7-8 and secondary).
Scenario 1: Universal basic education
This scenario builds on Scenario 0 by now assuming that student flow is optimised to universalise basic education (twelve years in primary and secondary) by 2018. This means 100% intake, enrolment, retention and completion – no drop-outs and no repetition, the only reduction in student flow is due to natural mortality. This implies much greater internal efficiency of the system, but also much larger numbers of students in the system. In addition, efficiency increases in this scenario in terms of use of teachers. Dependence on Board of Management teachers (those paid by the BOM and hence parents) decreases, requiring more teachers to be hired through the Teachers Service Commission to meet the PTR, and hence there are more teachers on the government payroll.
Detailed assumptions include: Primary gross intake rate at 100% with zero repeaters in class one; maximum (100%) retention in primary (i.e. no drop-out or repetition) taking into account natural mortality; primary to secondary transition of 100%; secondary retention of 100% and again taking into account the mortality rates for this cohort. Use of teacher resource has been maximised, increasing the weekly hours worked by each teacher in junior secondary to 27 compared to the 25.4 in Scenario 0 and improving the pupil teacher ratio to 35 compared to 36.2 in Scenario 0. PTRs in secondary increase to 40 from 35 in Scenario 0. In addition, this scenario increasingly reduces the use of BOM teachers to 1% by 2023 in primary and 2025 in junior/senior secondary.

Analysis of Kenya’s expenditure in education, future sector cost scenarios and benefits of curriculum reform
© Oxford Policy Management 37
Scenario 2: UBE, new curriculum
This scenario maintains the optimal student flow assumptions from Scenario 1 (i.e. equivalent to universal basic education), but introduces the new curriculum structure. The new structure of education (2-6-3-3-4) starts in 2018. Focusing on the primary and secondary levels, there are three tiers i.e. six years in primary education; three years in junior secondary; and three years in senior secondary. Under the new structure, the former primary and secondary cycles reduce by two and one years respectively.
Enrolment, student flow, PTRs, use of BOM teachers remain as in Scenario 1. The main additional assumption is that the three years of junior secondary have the same cost structures as upper primary – in particular the same teachers’ salaries. This salary level is much lower than the salary level at secondary, so the switch is from a year of students with senior secondary teachers and their high salaries, to junior secondary with lower salaries.
In many respects, each of these scenarios presents an extreme case – and may not be considered
a likely outcome. They are chosen to demonstrate the wide range of implications for enrolment and
costs, given that reality will lie somewhere in between these. The background, and limitations to
these scenarios are discussed briefly.
The assumptions for Scenario 1 – UBE – came out of discussions at an interim findings workshop
with Government stakeholders in July 2016. This was setting out the most optimistic assumptions
for how the sector should perform; with universal, compulsory education achieved, low
contributions from parents (through the reduction in BOM teachers), and high internal efficiency (no
repetition) within the system. This would be very difficult for any country to achieve, especially with
such a rapid transition, and if a more likely scenario – of less-than-full enrolment and some dropout
– were achieved, the costs for the sector would be lower.
The assumptions for Scenario 2 – UBE, new curriculum – are relatively simple given the range of
details about the curriculum reform roll-out which were unknown at the time of the July workshop.
For example, whether teacher specialisation would change, or instructional hours, leading to
different PTRs, were still being discussed. Given the enormity of the aspects which could change,
this scenario was chosen to show the cost saving that could be achieved simply by shifting
students away from a class where teachers have a higher salary. The structure of junior secondary
is assumed to be the same as primary (rather than senior secondary) based on conversations in
July, where it was felt primary teachers and infrastructure would be used to create this new level of
basic education. As the details become clearer, the recurrent costs (particularly the implications for
unit costs) of the curriculum reform may change from those set out in this scenario.
6.3.2 Enrolment projections in basic education
Shifting from an assumption of Status Quo to Universal Basic Education sees a substantial
increase in total enrolment across basic education over the next 15 years. Scenario 0 – the
Status Quo – will see enrolment increase across all of ECDE, primary and secondary between now
and 2030 – as seen in the left panel of Figure 11. This is due to the increase in population, such
that even with enrolment and student flow rates remaining the same, the enrolment would
increase. However with UBE assumptions, as in Scenarios 1 and 2, in the right panel of Figure 11,
enrolment increases even further. Thus under the scenarios of 100% intake, retention and
transition, total enrolment in the 14 years of basic education reaches almost 24 million in 2030,
compared with less than 21 million where student flow rates do not improve. In universalizing
primary and secondary education, Kenya will have 3 million more children in the schooling system.

Analysis of Kenya’s expenditure in education, future sector cost scenarios and benefits of curriculum reform
© Oxford Policy Management 38
Figure 11 Enrolment projections in basic education, Scenarios 0, 1 and 2
Source: Authors’ calculations based on model assumptions
In this scenario, introducing the new curriculum does not change projected enrolment
because there is assumed to be zero drop-out throughout the system. Because we have
assumed that there is 100% transition and retention in Scenario 1, when we then introduce the
new curriculum structure (from 8-4-4 to 6-3-3-4) the enrolment in each grade, and the total years of
basic education both remain the same. Thus whilst primary reduces from eight to six years, and
senior secondary from four to three, junior secondary ‘absorbs’ these three original year groups.
6.3.3 Projected recurrent costs of basic education
Whilst higher enrolment causes the costs of providing basic education to increase, more
efficient use of resources associated with the new curriculum lessen the increase in costs.
The jump between Scenario 0 – Status Quo – and Scenario 1 – UBE – necessarily means more
enrolment. If unit costs remain the same, meeting UBE would cost the basic education sector Ksh
468 billion per year in 2030, compared with Ksh 280 billion if student flow rates remain the same as
today (see Figure 12). However when the new curriculum is introduced in Scenario 2, one year of
secondary education is ‘converted’ into a year of junior secondary, which is assumed to have the
same delivery structure (teacher workload and teacher salaries) as the current upper primary level.
Thus this year group becomes relatively ‘cheaper.’ It is literally only this one year group of
enrolment that is assumed to be different between Scenario 1 and Scenario 2. By introducing the
new structure alone, the recurrent costs of the basic education system will therefore reduce to Ksh
434 billion in 2030 (Scenario 2), saving 7% of the total annual cost compared to Scenario 1.
0
5
10
15
20
252
01
52
01
62
01
72
01
82
01
92
02
02
02
12
02
22
02
32
02
42
02
52
02
62
02
72
02
82
02
92
03
0
Enro
lmen
t (m
illio
ns)
Status Quo: Sc0 F4/Sec3
F3/Sec2
F2/Sec1
F1/Std9
Std8
Std7
Std6
Std5
Std4
Std3
Std2
Std1
ECD 0
5
10
15
20
25
20
15
20
16
20
17
20
18
20
19
20
20
20
21
20
22
20
23
20
24
20
25
20
26
20
27
20
28
20
29
20
30
Enro
lmen
t (m
illio
ns)
UBE: Sc1, Sc2
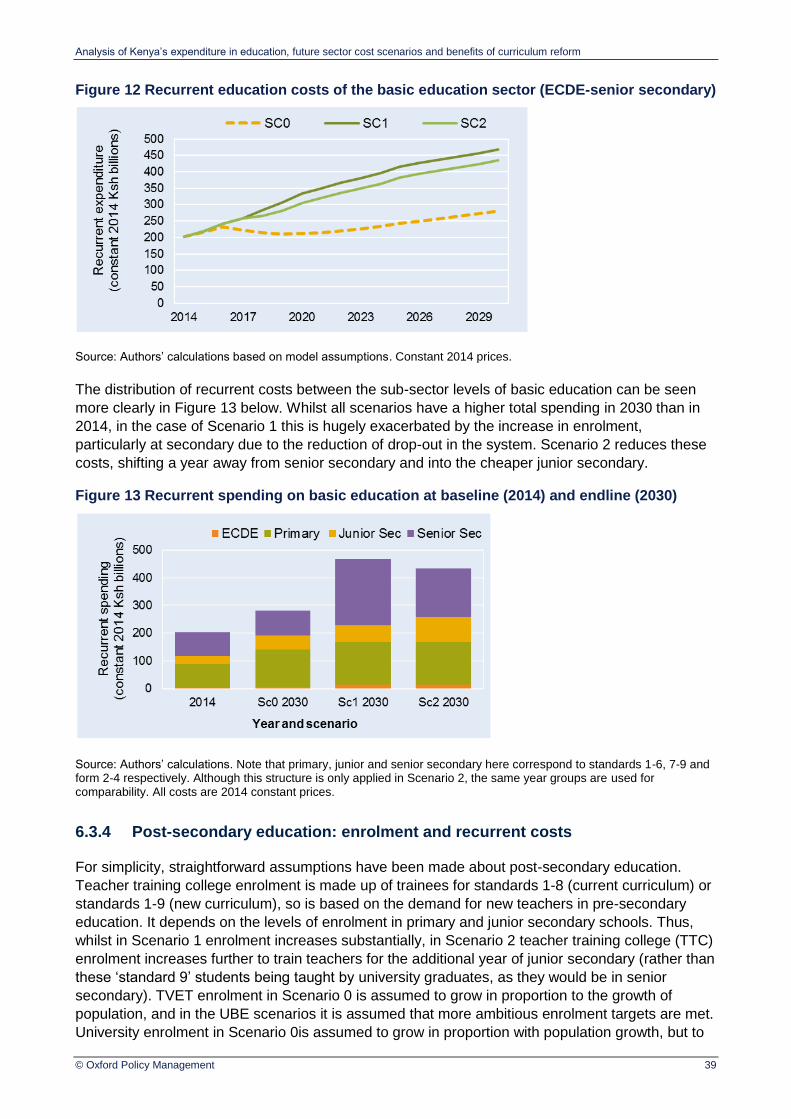
Analysis of Kenya’s expenditure in education, future sector cost scenarios and benefits of curriculum reform
© Oxford Policy Management 39
Figure 12 Recurrent education costs of the basic education sector (ECDE-senior secondary)
Source: Authors’ calculations based on model assumptions. Constant 2014 prices.
The distribution of recurrent costs between the sub-sector levels of basic education can be seen
more clearly in Figure 13 below. Whilst all scenarios have a higher total spending in 2030 than in
2014, in the case of Scenario 1 this is hugely exacerbated by the increase in enrolment,
particularly at secondary due to the reduction of drop-out in the system. Scenario 2 reduces these
costs, shifting a year away from senior secondary and into the cheaper junior secondary.
Figure 13 Recurrent spending on basic education at baseline (2014) and endline (2030)
Source: Authors’ calculations. Note that primary, junior and senior secondary here correspond to standards 1-6, 7-9 and form 2-4 respectively. Although this structure is only applied in Scenario 2, the same year groups are used for comparability. All costs are 2014 constant prices.
6.3.4 Post-secondary education: enrolment and recurrent costs
For simplicity, straightforward assumptions have been made about post-secondary education.
Teacher training college enrolment is made up of trainees for standards 1-8 (current curriculum) or
standards 1-9 (new curriculum), so is based on the demand for new teachers in pre-secondary
education. It depends on the levels of enrolment in primary and junior secondary schools. Thus,
whilst in Scenario 1 enrolment increases substantially, in Scenario 2 teacher training college (TTC)
enrolment increases further to train teachers for the additional year of junior secondary (rather than
these ‘standard 9’ students being taught by university graduates, as they would be in senior
secondary). TVET enrolment in Scenario 0 is assumed to grow in proportion to the growth of
population, and in the UBE scenarios it is assumed that more ambitious enrolment targets are met.
University enrolment in Scenario 0is assumed to grow in proportion with population growth, but to
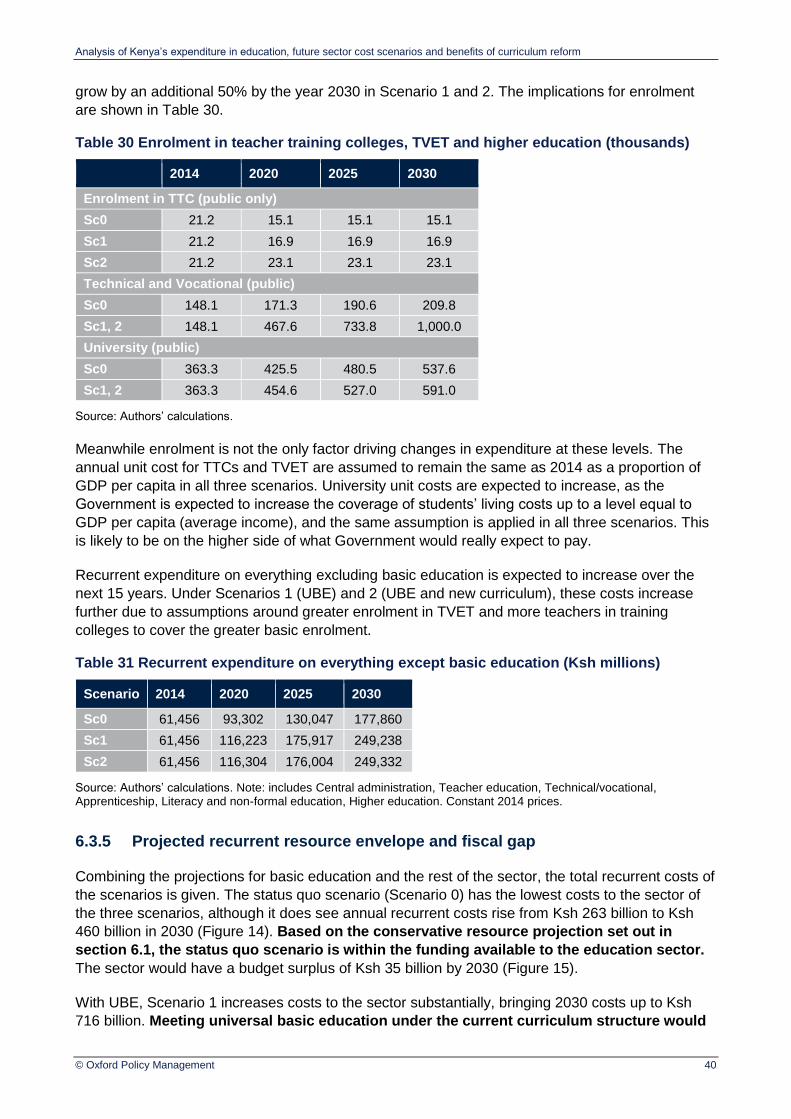
Analysis of Kenya’s expenditure in education, future sector cost scenarios and benefits of curriculum reform
© Oxford Policy Management 40
grow by an additional 50% by the year 2030 in Scenario 1 and 2. The implications for enrolment
are shown in Table 30.
Table 30 Enrolment in teacher training colleges, TVET and higher education (thousands)
2014 2020 2025 2030
Enrolment in TTC (public only)
Sc0 21.2 15.1 15.1 15.1
Sc1 21.2 16.9 16.9 16.9
Sc2 21.2 23.1 23.1 23.1
Technical and Vocational (public)
Sc0 148.1 171.3 190.6 209.8
Sc1, 2 148.1 467.6 733.8 1,000.0
University (public)
Sc0 363.3 425.5 480.5 537.6
Sc1, 2 363.3 454.6 527.0 591.0
Source: Authors’ calculations.
Meanwhile enrolment is not the only factor driving changes in expenditure at these levels. The
annual unit cost for TTCs and TVET are assumed to remain the same as 2014 as a proportion of
GDP per capita in all three scenarios. University unit costs are expected to increase, as the
Government is expected to increase the coverage of students’ living costs up to a level equal to
GDP per capita (average income), and the same assumption is applied in all three scenarios. This
is likely to be on the higher side of what Government would really expect to pay.
Recurrent expenditure on everything excluding basic education is expected to increase over the
next 15 years. Under Scenarios 1 (UBE) and 2 (UBE and new curriculum), these costs increase
further due to assumptions around greater enrolment in TVET and more teachers in training
colleges to cover the greater basic enrolment.
Table 31 Recurrent expenditure on everything except basic education (Ksh millions)
Scenario 2014 2020 2025 2030
Sc0 61,456 93,302 130,047 177,860
Sc1 61,456 116,223 175,917 249,238
Sc2 61,456 116,304 176,004 249,332
Source: Authors’ calculations. Note: includes Central administration, Teacher education, Technical/vocational, Apprenticeship, Literacy and non-formal education, Higher education. Constant 2014 prices.
6.3.5 Projected recurrent resource envelope and fiscal gap
Combining the projections for basic education and the rest of the sector, the total recurrent costs of
the scenarios is given. The status quo scenario (Scenario 0) has the lowest costs to the sector of
the three scenarios, although it does see annual recurrent costs rise from Ksh 263 billion to Ksh
460 billion in 2030 (Figure 14). Based on the conservative resource projection set out in
section 6.1, the status quo scenario is within the funding available to the education sector.
The sector would have a budget surplus of Ksh 35 billion by 2030 (Figure 15).
With UBE, Scenario 1 increases costs to the sector substantially, bringing 2030 costs up to Ksh
716 billion. Meeting universal basic education under the current curriculum structure would
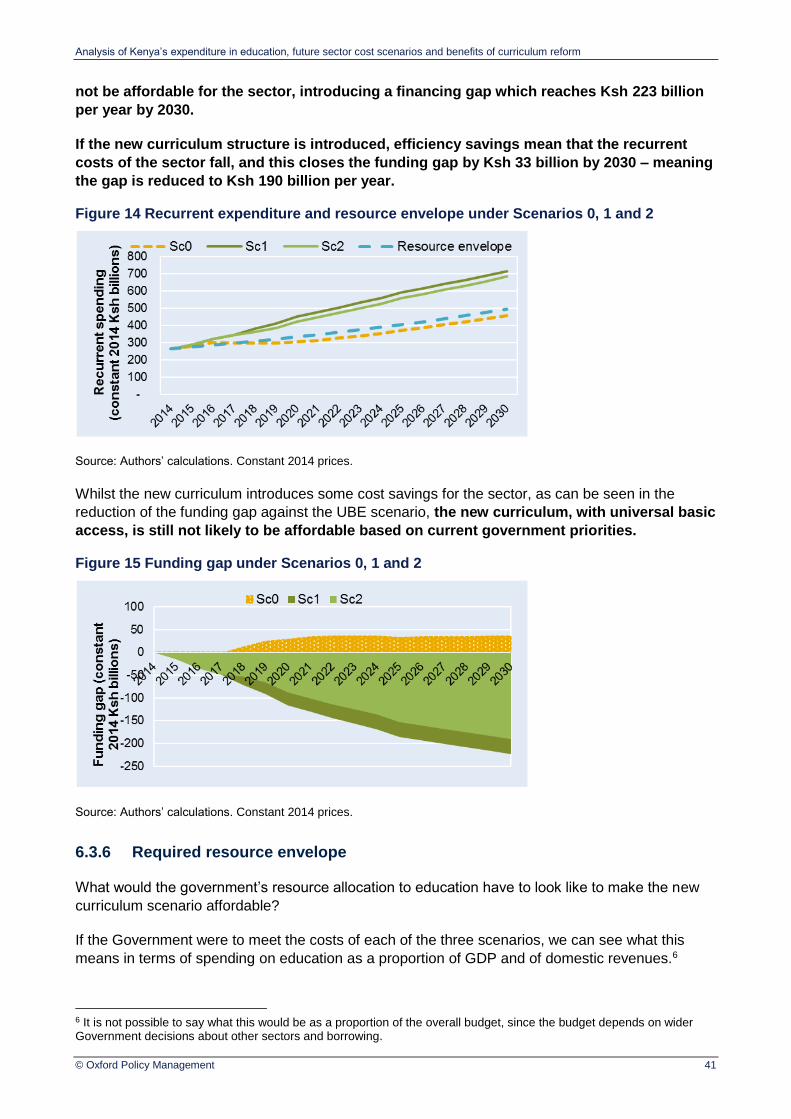
Analysis of Kenya’s expenditure in education, future sector cost scenarios and benefits of curriculum reform
© Oxford Policy Management 41
not be affordable for the sector, introducing a financing gap which reaches Ksh 223 billion
per year by 2030.
If the new curriculum structure is introduced, efficiency savings mean that the recurrent
costs of the sector fall, and this closes the funding gap by Ksh 33 billion by 2030 – meaning
the gap is reduced to Ksh 190 billion per year.
Figure 14 Recurrent expenditure and resource envelope under Scenarios 0, 1 and 2
Source: Authors’ calculations. Constant 2014 prices.
Whilst the new curriculum introduces some cost savings for the sector, as can be seen in the
reduction of the funding gap against the UBE scenario, the new curriculum, with universal basic
access, is still not likely to be affordable based on current government priorities.
Figure 15 Funding gap under Scenarios 0, 1 and 2
Source: Authors’ calculations. Constant 2014 prices.
6.3.6 Required resource envelope
What would the government’s resource allocation to education have to look like to make the new
curriculum scenario affordable?
If the Government were to meet the costs of each of the three scenarios, we can see what this
means in terms of spending on education as a proportion of GDP and of domestic revenues.6
6 It is not possible to say what this would be as a proportion of the overall budget, since the budget depends on wider Government decisions about other sectors and borrowing.

Analysis of Kenya’s expenditure in education, future sector cost scenarios and benefits of curriculum reform
© Oxford Policy Management 42
In order to meet the costs of the new curriculum scenario, the government would have to
commit up to 6.8% of GDP to education recurrent spending, compared with just 4.9% in
2014. This would be equivalent to allocating 35.1% of domestic revenues to education
recurrent spending in 2030, compared with only 25.4% in 2014.
Figure 16 shows how the sector costs under the three scenarios would compare to GDP, and
Figure 17 compares these costs to domestic revenues. With the increase in enrolment under UBE,
both Scenario 1 and Scenario 2 see the allocation to education needing to rise substantially and
levelling off after 2025. For Scenario 2, the new curriculum, this means almost ten percentage
points more of domestic revenues goes to education in 2030 than it does today.
Figure 16 Required spending as % of GDP under Scenarios 0, 1 and 2
Figure 17 Required spending as % of domestic revenues under Scenarios 0, 1 and 2
Table 32 Required resource envelope under scenarios 0, 1 and 2
2014* 2015 2020 2025 2030
Education recurrent spending as % of GDP
Sc0 4.9% 5.0% 4.5% 4.5% 4.6%
Sc1 4.9% 5.2% 6.6% 7.2% 7.1%
Sc2 4.9% 5.2% 6.2% 6.8% 6.8%
Education recurrent spending as % of domestic resources
Sc0 25.4% 26.0% 23.2% 23.3% 23.6%
Sc1 25.4% 26.7% 34.2% 37.0% 36.8%
Sc2 25.4% 26.8% 32.0% 34.9% 35.1%
Whether the new curriculum scenario is affordable thus depends on a number of uncertainties. The
assumptions around government revenue (19.4% of GDP) could well be pessimistic – revenue
may increase with more tax collection efforts, or high GDP growth. The share of revenue allocated
to education is a political decision about inter-sectoral trade-offs, and depends on all government
priorities. However it is very unrealistic for education to receive more than a third of revenues.
From the other view, the expectations of achieving UBE under the new curriculum – as in Scenario
2 – may need to be reviewed and down-scaled. For example, enrolment in senior secondary may
not reach 100%, more education may take place in the private sector, textbooks may become
cheaper or longer-lasting, PTRs could increase further, or subsidies to higher education may
decrease. These variables are all to some extent policy levers of government, and MOEST can
decide how far to push these directions – if it can afford the costs. MOEST is thus encouraged to
continue testing scenarios in the tool in order to assess the affordability of its policy targets.
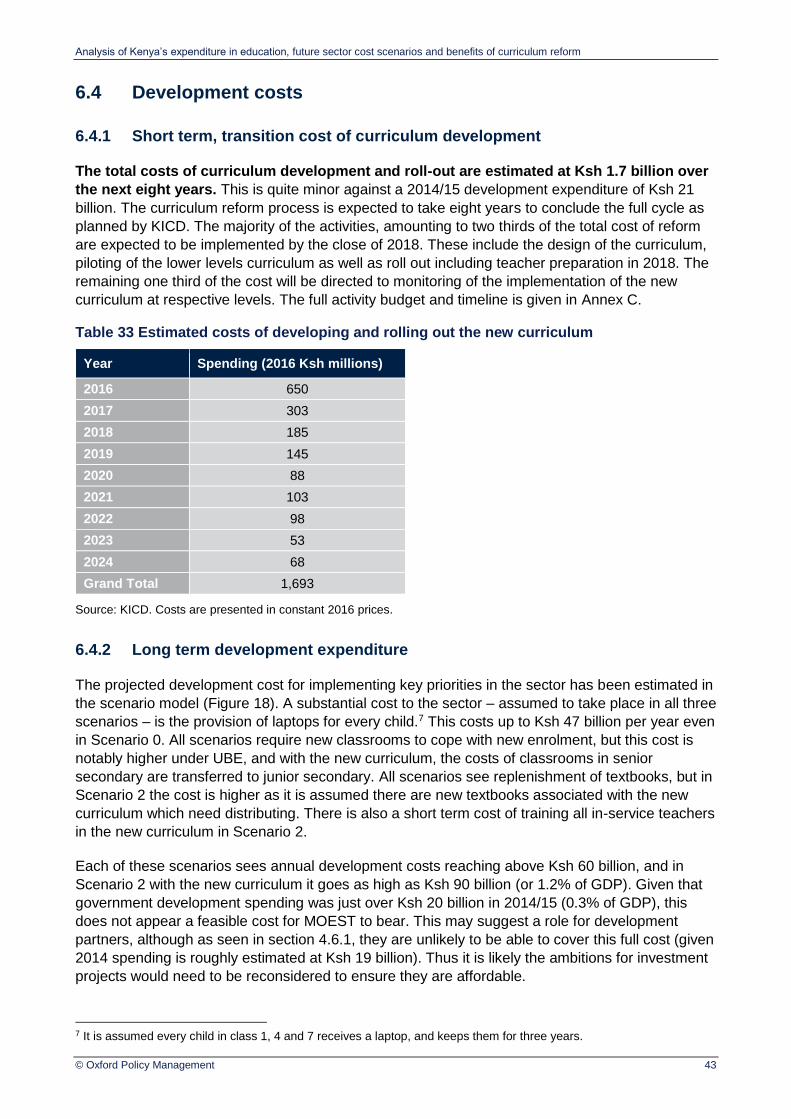
Analysis of Kenya’s expenditure in education, future sector cost scenarios and benefits of curriculum reform
© Oxford Policy Management 43
6.4 Development costs
6.4.1 Short term, transition cost of curriculum development
The total costs of curriculum development and roll-out are estimated at Ksh 1.7 billion over
the next eight years. This is quite minor against a 2014/15 development expenditure of Ksh 21
billion. The curriculum reform process is expected to take eight years to conclude the full cycle as
planned by KICD. The majority of the activities, amounting to two thirds of the total cost of reform
are expected to be implemented by the close of 2018. These include the design of the curriculum,
piloting of the lower levels curriculum as well as roll out including teacher preparation in 2018. The
remaining one third of the cost will be directed to monitoring of the implementation of the new
curriculum at respective levels. The full activity budget and timeline is given in Annex C.
Table 33 Estimated costs of developing and rolling out the new curriculum
Year Spending (2016 Ksh millions)
2016 650
2017 303
2018 185
2019 145
2020 88
2021 103
2022 98
2023 53
2024 68
Grand Total 1,693
Source: KICD. Costs are presented in constant 2016 prices.
6.4.2 Long term development expenditure
The projected development cost for implementing key priorities in the sector has been estimated in
the scenario model (Figure 18). A substantial cost to the sector – assumed to take place in all three
scenarios – is the provision of laptops for every child.7 This costs up to Ksh 47 billion per year even
in Scenario 0. All scenarios require new classrooms to cope with new enrolment, but this cost is
notably higher under UBE, and with the new curriculum, the costs of classrooms in senior
secondary are transferred to junior secondary. All scenarios see replenishment of textbooks, but in
Scenario 2 the cost is higher as it is assumed there are new textbooks associated with the new
curriculum which need distributing. There is also a short term cost of training all in-service teachers
in the new curriculum in Scenario 2.
Each of these scenarios sees annual development costs reaching above Ksh 60 billion, and in
Scenario 2 with the new curriculum it goes as high as Ksh 90 billion (or 1.2% of GDP). Given that
government development spending was just over Ksh 20 billion in 2014/15 (0.3% of GDP), this
does not appear a feasible cost for MOEST to bear. This may suggest a role for development
partners, although as seen in section 4.6.1, they are unlikely to be able to cover this full cost (given
2014 spending is roughly estimated at Ksh 19 billion). Thus it is likely the ambitions for investment
projects would need to be reconsidered to ensure they are affordable.
7 It is assumed every child in class 1, 4 and 7 receives a laptop, and keeps them for three years.
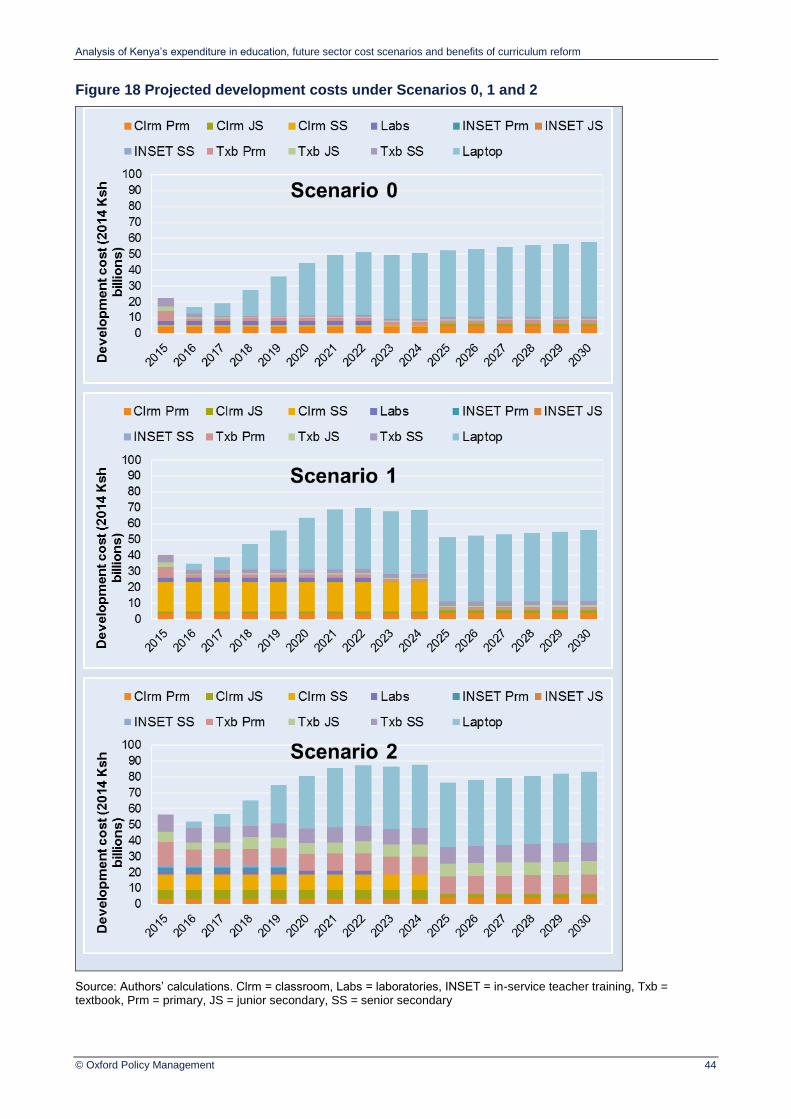
Analysis of Kenya’s expenditure in education, future sector cost scenarios and benefits of curriculum reform
© Oxford Policy Management 44
Figure 18 Projected development costs under Scenarios 0, 1 and 2
Source: Authors’ calculations. Clrm = classroom, Labs = laboratories, INSET = in-service teacher training, Txb = textbook, Prm = primary, JS = junior secondary, SS = senior secondary

Analysis of Kenya’s expenditure in education, future sector cost scenarios and benefits of curriculum reform
© Oxford Policy Management 45
7 Benefits of the curriculum reform
This chapter gives an overview of the type of benefits that might be expected from curriculum
reform. It begins by looking at the benefits included in the projection model, in terms of enrolment
and unit cost reductions. It then gives a brief snapshot of international experience of implementing
education interventions and reforms similar to Kenya’s proposals. Finally, perspectives from Kenya
are set out, based on the curriculum reform development documents and policies.
It is worth noting that there are various levels of benefits that may come from an education reform.
There are immediate benefits to outputs such as the number of children enrolled – or as an
outcome, the number completing. This can be estimated in the scenarios. Then there are the
higher order outcomes in terms of quality of education and student learning. As we will see in
section 7.2, the international literature is lacking robust evidence on these sorts of changes, but
there are studies on how aspects of reforms might affect teaching approaches and learning. With a
lack of evidence to base any projections on, these sorts of benefits have not been included in the
scenarios model. Finally there are long term impact objectives, such as social and health
indicators, political engagement and awareness, and most obviously employment and hence
economic prospects. Without evidence on how learning outcomes will improve, estimating this
eventual impact for Kenya, and monetising it in the case of Kenya, is not feasible. Instead, the
expectations of benefits set out by Kenya’s reform overseers are explained in section 7.3.
Box 7 Chapter 7: Key findings
In the cost scenarios, if universal basic education is achieved, enrolment increases enormously over the scenario with current student flow rates. With UBE, over 1 million students are estimated to complete Senior Secondary in 2021/22, compared with just 327,000 completers with current levels of retention.
The substitution of a year of senior secondary with junior secondary introduces a cost saving to the sector, equivalent to Ksh 33 billion per year in 2030.
International experience relating to elements of the reform planned by Kenya show mixed results, and that the detail of design and implementation are key to success. Teachers need adequate, effective training with materials to be able to use the new curriculum, pedagogy and assessment. However implementing new curricula can be difficult due to structural challenges: class sizes, infrastructure, and cultural norms.
The new curriculum is being designed with the objective of meeting the goal of becoming a middle income industrialised country by 2030, thus providing the human capital for that vision. The technical and vocational skills-focus is expected to prepare youth for a knowledge-intensive economy. The system should become more flexible for learners with different abilities and potentials, and also harmonise Kenya with the East African Community. Finally, the curriculum is expected to increase social cohesion.
7.1 Benefits included in the projection model
One of the main benefits intended by Kenya’s curriculum reform is an increase in relevance and
quality of education provision, leading to a population better prepared for 21st century challenges
and a labour force more productive in an internationally competitive industry. Whilst the increase in
quality cannot be monetised, the projection model does allow estimation of increase in human
capital in terms of graduates of basic education. Through commitment to universal access and full
completion of the new cycle, Kenya will have higher enrolment and consequently higher numbers
of young people leaving the school system with senior secondary education.
The following table shows the number of pupils at different grades of education under the two main
scenarios affecting enrolment. The first relates to continuation of the current curriculum and
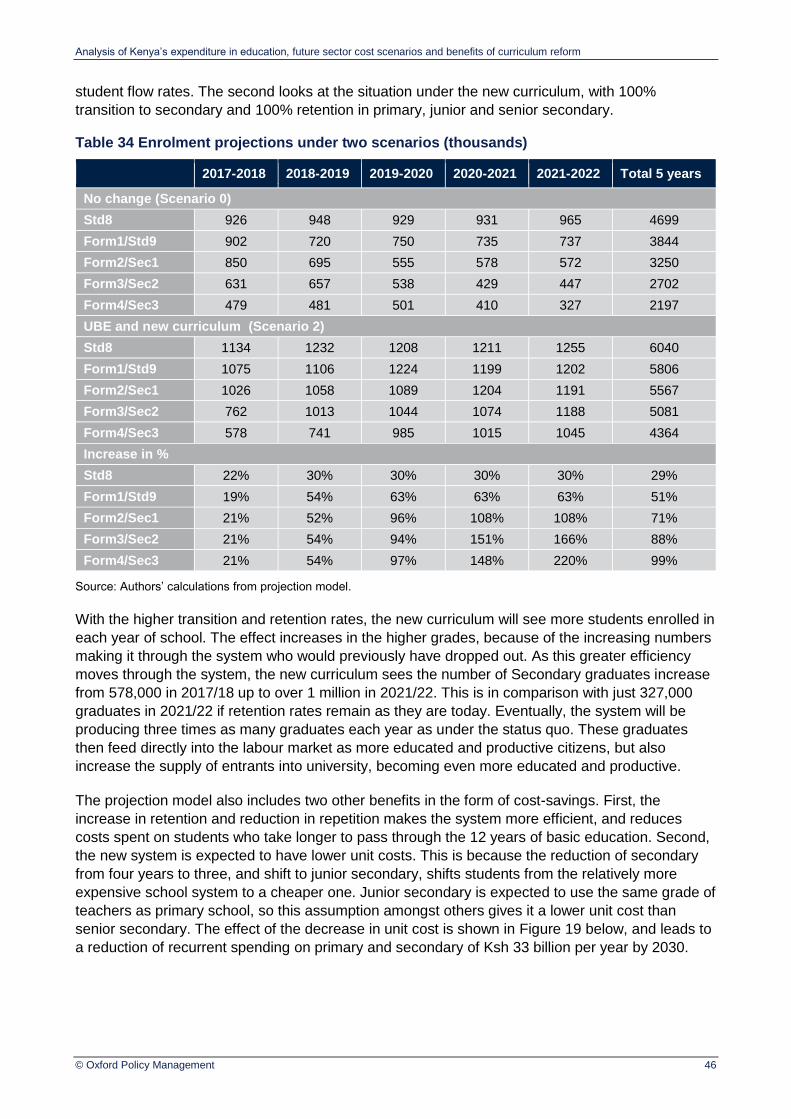
Analysis of Kenya’s expenditure in education, future sector cost scenarios and benefits of curriculum reform
© Oxford Policy Management 46
student flow rates. The second looks at the situation under the new curriculum, with 100%
transition to secondary and 100% retention in primary, junior and senior secondary.
Table 34 Enrolment projections under two scenarios (thousands)
2017-2018 2018-2019 2019-2020 2020-2021 2021-2022 Total 5 years
No change (Scenario 0)
Std8 926 948 929 931 965 4699
Form1/Std9 902 720 750 735 737 3844
Form2/Sec1 850 695 555 578 572 3250
Form3/Sec2 631 657 538 429 447 2702
Form4/Sec3 479 481 501 410 327 2197
UBE and new curriculum (Scenario 2)
Std8 1134 1232 1208 1211 1255 6040
Form1/Std9 1075 1106 1224 1199 1202 5806
Form2/Sec1 1026 1058 1089 1204 1191 5567
Form3/Sec2 762 1013 1044 1074 1188 5081
Form4/Sec3 578 741 985 1015 1045 4364
Increase in %
Std8 22% 30% 30% 30% 30% 29%
Form1/Std9 19% 54% 63% 63% 63% 51%
Form2/Sec1 21% 52% 96% 108% 108% 71%
Form3/Sec2 21% 54% 94% 151% 166% 88%
Form4/Sec3 21% 54% 97% 148% 220% 99%
Source: Authors’ calculations from projection model.
With the higher transition and retention rates, the new curriculum will see more students enrolled in
each year of school. The effect increases in the higher grades, because of the increasing numbers
making it through the system who would previously have dropped out. As this greater efficiency
moves through the system, the new curriculum sees the number of Secondary graduates increase
from 578,000 in 2017/18 up to over 1 million in 2021/22. This is in comparison with just 327,000
graduates in 2021/22 if retention rates remain as they are today. Eventually, the system will be
producing three times as many graduates each year as under the status quo. These graduates
then feed directly into the labour market as more educated and productive citizens, but also
increase the supply of entrants into university, becoming even more educated and productive.
The projection model also includes two other benefits in the form of cost-savings. First, the
increase in retention and reduction in repetition makes the system more efficient, and reduces
costs spent on students who take longer to pass through the 12 years of basic education. Second,
the new system is expected to have lower unit costs. This is because the reduction of secondary
from four years to three, and shift to junior secondary, shifts students from the relatively more
expensive school system to a cheaper one. Junior secondary is expected to use the same grade of
teachers as primary school, so this assumption amongst others gives it a lower unit cost than
senior secondary. The effect of the decrease in unit cost is shown in Figure 19 below, and leads to
a reduction of recurrent spending on primary and secondary of Ksh 33 billion per year by 2030.
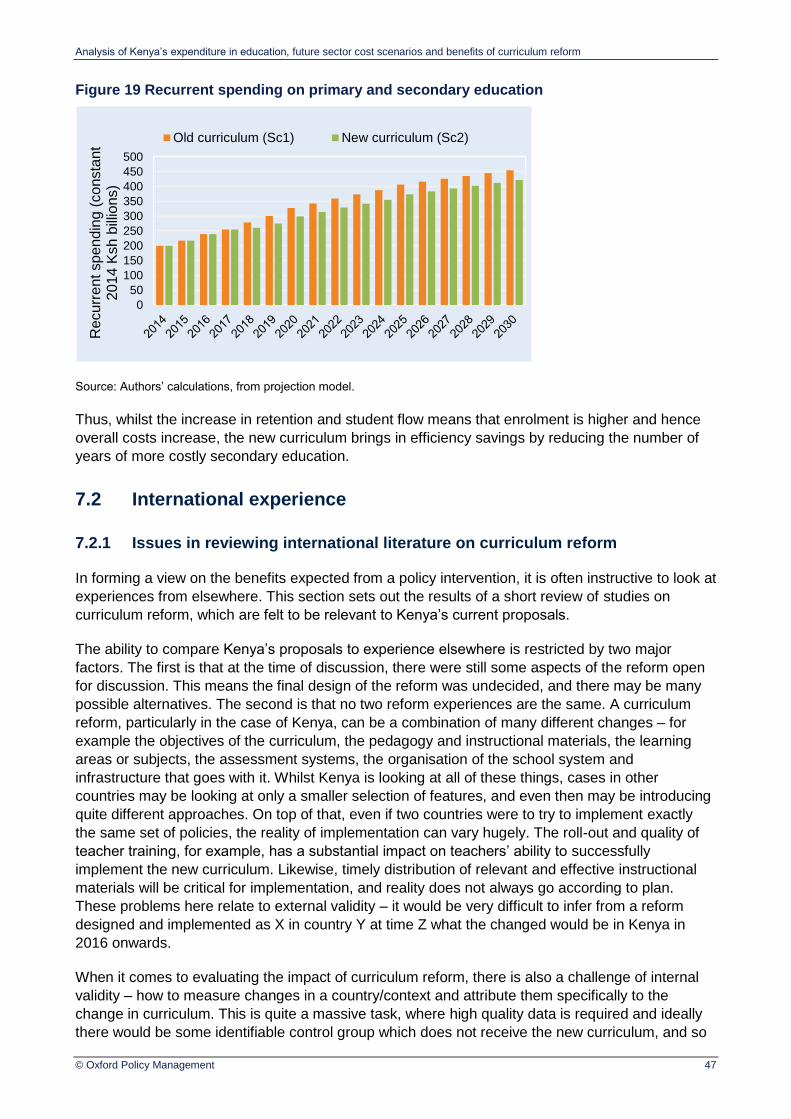
Analysis of Kenya’s expenditure in education, future sector cost scenarios and benefits of curriculum reform
© Oxford Policy Management 47
Figure 19 Recurrent spending on primary and secondary education
Source: Authors’ calculations, from projection model.
Thus, whilst the increase in retention and student flow means that enrolment is higher and hence
overall costs increase, the new curriculum brings in efficiency savings by reducing the number of
years of more costly secondary education.
7.2 International experience
7.2.1 Issues in reviewing international literature on curriculum reform
In forming a view on the benefits expected from a policy intervention, it is often instructive to look at
experiences from elsewhere. This section sets out the results of a short review of studies on
curriculum reform, which are felt to be relevant to Kenya’s current proposals.
The ability to compare Kenya’s proposals to experience elsewhere is restricted by two major
factors. The first is that at the time of discussion, there were still some aspects of the reform open
for discussion. This means the final design of the reform was undecided, and there may be many
possible alternatives. The second is that no two reform experiences are the same. A curriculum
reform, particularly in the case of Kenya, can be a combination of many different changes – for
example the objectives of the curriculum, the pedagogy and instructional materials, the learning
areas or subjects, the assessment systems, the organisation of the school system and
infrastructure that goes with it. Whilst Kenya is looking at all of these things, cases in other
countries may be looking at only a smaller selection of features, and even then may be introducing
quite different approaches. On top of that, even if two countries were to try to implement exactly
the same set of policies, the reality of implementation can vary hugely. The roll-out and quality of
teacher training, for example, has a substantial impact on teachers’ ability to successfully
implement the new curriculum. Likewise, timely distribution of relevant and effective instructional
materials will be critical for implementation, and reality does not always go according to plan.
These problems here relate to external validity – it would be very difficult to infer from a reform
designed and implemented as X in country Y at time Z what the changed would be in Kenya in
2016 onwards.
When it comes to evaluating the impact of curriculum reform, there is also a challenge of internal
validity – how to measure changes in a country/context and attribute them specifically to the
change in curriculum. This is quite a massive task, where high quality data is required and ideally
there would be some identifiable control group which does not receive the new curriculum, and so
0
50
100
150
200
250
300
350
400
450
500
Re
curr
ent sp
en
din
g (
co
nsta
nt
2014 K
sh b
illio
ns)
Old curriculum (Sc1) New curriculum (Sc2)

Analysis of Kenya’s expenditure in education, future sector cost scenarios and benefits of curriculum reform
© Oxford Policy Management 48
can be compared to schools, teachers, and pupils who do get the new curriculum. The enormity of
this task makes it unsurprising that no studies looking at the overall impact of curriculum reform
have been found, particularly with quantitative estimates. Instead of looking at curriculum reform in
its entirety, research tends to focus on particular aspects of a new curriculum and its
implementation. This conclusion was also drawn in a rigorous literature review by Westbrook et al
(2013, p.62): “Few studies explicitly pointed to a specific curriculum model.”
Despite the challenges faced in looking at the overall long term impact of curriculum reform, it is
possible to look at international experiences of the components of curriculum reform. If Kenya’s
proposals are broken up into a number of constituent parts, research on similar projects elsewhere
can be found to give an indication of what works or does not work. This is where studies focusing
on specific aspects of education policy and reform may be useful. These have used varying
methodologies, and been investigating different impacts, but some useful findings can be drawn for
Kenya. The rest of this section sets out the methodology for this brief review of research, and then
runs through evidence on the major aspects of the curriculum reform.
The methodology for this section was a brief review of international experience relevant to the
curriculum reform. There have been a number of recent systematic literature reviews of ‘what
works in education’, and these formed the starting point for identifying research. Westbrook et al
(2013), Evans and Popova (2015), Glewwe and Muralidharan (2015) each looked at a range of
interventions, and Power et al (2014) looked specifically at technology in education. Using the
studies in these papers, there was then some snowballing to follow up further references, and
internet searches around the main topics of the reform that are covered here. Studies were
screened based on their relevance to this assignment and being a credible publication. This is not
intended to be a rigorous literature review itself given the resources available for this assignment.
7.2.2 Overall theory of change for curriculum and pedagogy
This section draws heavily on the summary of an extensive literature review into pedagogy,
curriculum and teaching practices in developing countries carried out by Westbrook et al for DFID
in 2013. Given the wide scope of their research questions which do not refer to one specific
intervention, the authors developed a general theory of change for practices and interventions
under curriculum and teacher training. Their theory of change is shown in Figure 20 given the
relevance to this assignment and its use in summarising the literature. It shows the general stages
in the theory of change through to impact on students, the interlinkages and the assumptions
required for each stage to hold. In addition the diagram sets out the strength of evidence for each
practice, with weak evidence in red, moderate evidence in amber and strong evidence in green.
Further sub-sections look at some specific evidence on aspects of the theory of change and
assumptions and interventions relevant to Kenya’s proposals, drawing out main conclusions on the
importance of the details of implementation.

Analysis of Kenya’s expenditure in education, future sector cost scenarios and benefits of curriculum reform
© Oxford Policy Management 49
Figure 20 Westbrook et al’s Theory of Change
Source: Westbrook et al (2013) p. 43
7.2.3 Competence based curricula and child-centred pedagogy
In a review of literature on curriculum and pedagogy, Westbrook et al (2013) found that most cases
of curricular change were replacing content-driven curricula with process- and objective-driven
curricula. Furthermore, these are often competency or outcomes-based curricula, which are
structured around sets of learning outcomes that all learners are expected to have mastered at the
end of the learning period. These curricula focus on the teaching of skills and attitudes as well
knowledge, and students should be able to apply and integrate these learned competences.
Thematic and interdisciplinary curricula (such as in Uganda and China) are similar but particularly
highlight integration of subject knowledge.
Altinyelken (2009) reviews the shift to child-centred pedagogy that has been seen in Sub-Saharan
Africa. Many papers find that the idea did not take root in classrooms, since pedagogy is so
Analysis of Kenya’s expenditure in education, future sector cost scenarios and benefits of curriculum reform
© Oxford Policy Management 50
complex and multi-dimensional, and as a result there is a wide gap between policy and practice,
with teacher-centred instruction continuing. Altinyelken quotes Farrell (2002, p.256) however who
found ‘It can be done, and where done, it generally produces remarkable learning gains among
even the poorest and most “disadvantaged” children.’
Two cases which explored how new curricula introduced child-centred pedagogy were Tanzania
and Uganda in the mid to late-2000s. In Uganda, Altinyelken (2009) carried out fieldwork in primary
schools which were piloting the new thematic curriculum and shift to child-centred pedagogy.
Vavrus (2009) conducted an ethnographic study of a Tanzanian teacher training college which was
training pre-service teachers in new student-centred learning methods. Both of these studies found
that teachers did understand the new methods, including for example the importance of student
participation, group work and use of teaching and learning materials.
In the case of Uganda, some teachers felt to see improvements in student learning, though they
put this down to the organisation of the new curriculum rather than the child-centred pedagogy. In
her 2010 paper, Altinyelken reports that following introduction of the new curriculum and pedagogy,
teachers found the classroom interaction to be more varied, which made it more enjoyable for the
children. Teachers believed the increased participation built children’s self-esteem, assertiveness
and confidence. With introduction of class teachers (rather than subject teachers) for P1-3, some
teachers felt able to get to know students better and then support them more appropriately; but this
also risks larger loss of instruction time when teachers are absent.
However, there were underlying structural obstacles to effectively using the new pedagogy in
schools. Particular examples given were:
large class sizes, which for example make student interaction and group discussion more
difficult;
the furniture, for example appropriate desk lay-out, and moving furniture around to facilitate
activities was too noisy and disruptive;
lack of or at least insufficient teaching materials linked to the new curriculum;
a hierarchical approach to authority, for example making teachers uncomfortable in asking
students questions as an engagement technique, as it implied they did not know the answers
themselves.
7.2.4 Details of the design: teacher training, content and materials
A number of studies support the conclusion that the devil is in the detail of the design of new
curricula and pedagogy. The teacher training is a particular area of importance. Kenya’s national
School-Based Teacher Development and Instructional Materials intervention project (SbTD), which
trained three key resource teachers per school, led to teachers using more interactive questioning,
more use of group work and equitable learning for boys and girls, helped by use of mother tongue
and code switching and constructive feedback (Hardman et al. 2009, summarised in Westbrook et
al. 2013). Aspects of support for teachers were found to particularly help the improvements: in-
school and in-class support, regular meetings and teacher study guides.
There are many examples of where poor teacher training has been a barrier to improvements in
learning. In their review of the outcomes-based curriculum introduced in South Africa in the late
1990s, Cross et al (2002) concluded that poor and hasty planning led to a misalignment between
the curriculum, teacher development and learning materials. In this case, instead of proper teacher
training, teachers were given ad hoc workshops, and supplied with insufficient materials. They
recommended that local teachers should be involved in new curricula design in order to make it
applicable and accessible. In interviews with teachers implementing Uganda’s thematic curriculum,
Analysis of Kenya’s expenditure in education, future sector cost scenarios and benefits of curriculum reform
© Oxford Policy Management 51
Altinyelken (2010) found that teachers felt the training they received was low quality; specifically
that it was rushed and the tutors themselves were not experienced. Although there were some
positive reports of changes for children (see above), other teachers commented that they had not
understood the new method or the benefits of it, and some even resented it due to the confusion.
Reviewing a range of papers on improving learning outcomes in developing countries, Evans and
Popova (2015) summarise that one-time in-service training sessions at a central location are not
highly effective, and instead long-term teacher mentoring or in-school coaching for changes in
pedagogy are more likely to have an effect on student learning.
The content and supporting materials for curricula are another important factor for effective
implementation. A recurring theme across studies for ineffective implementation of a curriculum
was lack of resources such as textbooks, not just because insufficient numbers were distributed
but because either teachers were not using them as intended or at all. This might be because
teachers did not have the time to use them correctly, or did not want to damage them (Westbrook
et al, 2013). Experience from Kenya itself found that the material in textbooks was too hard for
most children, who struggled to even read the text, never mind engage with the content (Glewwe et
al, 2009). Teachers also need enough support, guidance and detail on how to cover subjects.
When Botswana introduced ‘environmental education’ as learning area in the curriculum, the detail
was left to the discretion of teachers which they were ill-prepared for, and resulted in little effective
teaching (Nkambwe and Essilfie, 2012).
Both of the preceding paragraphs refer to details which matter for reforms to be successful.
Altinyelken (2010) whilst reviewing studies on curriculum change also noted that literature has
increasingly focused on how many education reform initiatives were implemented ineffectively and
failed to meet their objectives. Westbrook et al (2013) found that challenges with implementing
improvements in teachers’ pedagogy included teachers’ lack of subject knowledge (perhaps due to
low achievement, or specific subjects), resistance to change to ingrained beliefs and fear of losing
authority, and a perception of added burden from active learning and student-centred models –
especially with large classes. Without sufficient understanding and pedagogical content
knowledge, implementation was found to be diluted or shallow.
7.2.5 Introducing local content
Kenya’s new curriculum is expected to allow for introduction of county-specific content. Westbrook
et al (2013) found mixed evidence on the success of introducing localised content into curricula.
They look at localised or indigenous curricula which aim to decentralise the curriculum such that
activities and knowledge are included which are seen as useful and relevant to particular groups of
children. Studies found some success in this approach in Mozambique, Afghanistan and
Cambodia, and a common theme to this success was strong links between schools and the
community and use of local teachers. Where less positive findings emerged, reasons included
teachers being concerned that children would miss out on international perspectives, where they
dismissed local knowledge and favoured information in textbooks, or where local content was
unsuccessfully integrated into the national curriculum. Nkambwe and Essilfie’s study of the
introduction of environmental education as a new subject in Botswana may also be relevant here:
where teachers were given responsibility for deciding how to cover the topic, they struggled to
include it effectively. Teachers need to be given sufficient guidance on what to teach when it
comes to local content.
7.2.6 Assessment
It is critical that the assessment system is realigned to any new curriculum, as curricula, pedagogy
and assessment are connected and should relate to each other to achieve the intended teaching
Analysis of Kenya’s expenditure in education, future sector cost scenarios and benefits of curriculum reform
© Oxford Policy Management 52
and learning in the classroom. Westbrook et al (2013) found a number of studies suggesting that
where high-stakes examinations continued despite a new curriculum being introduced, teachers
struggled to implement the new curricula. High-stakes examinations encourage teachers to cover
content rapidly and therefore revert to teacher-central methods, making it difficult to be true to the
objectives of new child-centred and competence-based curricula. This was made worse in
situations where parents believed quality education depended on having authoritative teachers and
examinations for assessment.
However if assessments can be realigned, Westbrook et al’s review found that continuous
formative assessment was more effective than high-stakes summative evaluations. They note the
interesting case of South Africa’s hybrid assessment system, in which standardised tests in
primary school are used for diagnostic purposes by teachers as well as for public information
(Chisholm and Wildeman, 2013, in Westbrook et al, 2013). An assessment system aligned with
curriculum content was concluded to be one of the four facilitating factors for pedagogy to lead to
positive outcomes. For effective implementation, continuous professional development for teachers
must include new curriculum demands such as continuous assessment. Altinyelken (2010) found
teachers in Ugandan primary schools felt they were not adequately trained to be able to implement
continuous assessment, and they faced difficulties using it with large class sizes.
7.2.7 Years of schooling
Kenya is proposing to change from the (3)-8-4-4 organisation to 2-6-3-3-4, in which 12 years of
education are seen as compulsory basic education (primary to senior secondary). Here we do not
present a full review of studies on the impact of changing the number of years of compulsory
schooling; as with other descriptors of a curriculum, the years themselves are not critical, but it is
the quality of implementation that matters. The global education community has increasingly
recognised this, as summarised by Evans and Popova (2015, p.2): “evidence suggests –
unsurprisingly – that additional years of schooling have little impact on economic growth in the
absence of learning, which is a function of education quality (Hanushek and Woessman, 2007).”
Meanwhile there is cumulating evidence that learning profiles – the relationship between learning
outcomes (skills/knowledge mastered) and each additional year of schooling – are too flat (see for
example Pritchett and Beatty, 2012). This means there is little marginal benefit from adding more
years in the absence of other improvements to the education system.
One study from Germany found that when the years of schooling decreased, there was a negative
impact on equity as low performing children fell further behind (Andrietti and Su, 2016). This could
imply that more years of schooling would give children who are struggling a chance to catch up, if
the overall content and burden of the curriculum remained the same and teachers were able to
give more time to assist weaker students.
7.2.8 Use of ICT
There have been numerous studies in recent years looking at the application of digital technologies
in teaching and learning. Glewwe and Muralidharan synthesise this evidence in their 2015 paper.
They find only one paper which looked at the impact of ICT on access, and found no effect on
repetition and dropout rates. However, nine different studies looked at the impact on student
learning. A wide range in impact was found, from significantly negative to significantly positive, and
clearly context is very important. The authors discuss a number of potential channels of impact for
technology-enhanced instruction, including:
Scalable high quality instruction through broadcast technology (TV, radio). This is also
identified in Power et al’s Topic Guide (2014) on education technology, where they find

Analysis of Kenya’s expenditure in education, future sector cost scenarios and benefits of curriculum reform
© Oxford Policy Management 53
interactive radio instruction (IRI) to have positive effects on average, and particularly in cases
where IRI is used in teacher professional development rather than directly in the classroom.
Ability to cover more advanced concepts and content. Again a similar conclusion is drawn by
Power et al who specifically identify the BridgeIT programmes in Tanzania and India where
teachers use their smartphones to play video lessons for their classes via projectors.
Engaging children through interactive modules, and
Customising student learning.
This last channel was also identified as effective by Evans and Popova (2015), whose review
found that computer-assisted learning is most effective where it allows adaptation to individual
students. However computer-assisted learning would be ineffective where there is no tailoring for
students, insufficient training for students and parents on the technology, or where it is used to
substitute for useful teaching time or home study. They also note that the use of the technology
must be integrated into lessons and aligned to the curriculum.
While Power et al (2014) found that access to eReaders or tablets were effective in supporting
early literacy, a study from Kenya itself indicates that supplying all children with eReaders is not
cost-effective. The evaluation of the Primary Math and Reading (PRIMR) Initiative compared three
versions of the intervention: giving eReaders to pupils, or tablets to teachers or to teacher
educators/tutors. All three groups showed similar gains in student learning outcomes, but with the
pupil eReaders the programme costs were substantially higher (Piper and Kwayumba, 2014).
A useful conclusion from Power et al (2014) is that simply increasing students’ access to
computers has no discernible impact on teaching or learning, since they may be used for non-
educational purposes or not used at all. For technology to be effective in learning, it must have a
clear curriculum focus, use relevant curriculum materials, focus on teacher development and
training on pedagogy with the technologies, and evaluation mechanisms.
7.2.9 Equity
A small number of studies made reference to equity effects of curricula. Andrietti and Su (2016)
used PISA assessment data to look at the impact of shifting from a nine year to eight year
curriculum in Germany. The impetus for the reform was that German students spent comparably
longer in school than students in neighbouring countries – so the new curriculum had very similar
content but faster pace of expected learning. The study found that children who were already
falling behind (those who had repeated a grade) were adversely affected by the more challenging
curriculum, whereas well-prepared children performed better with the compressed curriculum. In
effect, the harder (and in this case shorter) curriculum widened the gap between high and low
performing students.
Glewwe and Muralidharan (2015) comment on equity more generally, noting that the natural
heterogeneity across students will mean that an optimal policy for some students is not the same
as for others. Westbrook et al’s review (2013) finds similar results from a number of studies but
with respect to specific groups: that the curriculum can disadvantage marginalised groups,
especially rural children and girls, and often due to poor representation in textbooks. Another
disadvantaged group would be those communities not using the language of curriculum instruction
as their mother tongue. Barriers to including children with disabilities included the lack of training
and knowledge of teachers on how to deal with heterogeneous groups and their differing needs
(Westbrook et al, 2013). In cases where teachers were expected to adapt the curriculum for groups
with special needs, making teaching resources and preparing different types of activities, could
place further burden on teachers if they are not given adequate support and training.

Analysis of Kenya’s expenditure in education, future sector cost scenarios and benefits of curriculum reform
© Oxford Policy Management 54
7.2.10 Conclusions from international experience
Whilst this review was not able to systematically look at all literature on the aspects of curriculum
reform being considered by Kenya, it has shown that the research that exists have found very
mixed results about the impact of interventions and curricula practices. A running theme has been
that the results depend on the details of the design and actual implementation of a policy or
programme. This implies the importance of giving enough time and consideration (including
consultation and then piloting) to designing and rolling out any changes, and an eye for detail in
monitoring that the actual implementation goes to plan. A summary of the findings from
international evidence and how they relate to Kenya’s plans is given in Table 35.
Table 35 Summary of international evidence relating to Kenya’s curriculum reform
Expectation in curriculum reform
International evidence
Introducing competence-based curricula and child-centred pedagogy
There can be a wide gap between policy and practice, as new techniques do not take root in the classroom. Application is
challenged by large class sizes, infrastructure, lack of materials and discomfort from teachers who feel a strong approach to hierarchy.
Where successfully implemented, the classroom interaction is more enjoyable for pupils, and builds their confidence.
Delivering training and materials
The detail of the design is critical for success. Training teachers for a new approach, evidence from Kenya suggests that in-class and in-
school support, regular meetings and study guides improve effectiveness. Ad hoc workshops, rushed trainings with insufficient
materials are likely to be unsuccessful. Schools need to receive – and importantly use – teaching materials like textbooks which are relevant to the new curriculum. At the same
time, the content needs to be appropriate for learners’ levels.
Introducing local content
There is mixed evidence. Success stories emerge when there are strong links between schools and the community and use of local
teachers. The concept struggled when teachers prioritised international knowledge or the content was not successfully
integrated.
Emphasising formative assessment
Evidence suggests that teachers struggle to implement a new curriculum if high-stakes examinations continue. Continuous
formative assessment is found to be more effective than high-stakes summative evaluations, but teachers must be well-trained in using it.
Ensuring 12 years of compulsory education
The global education community has increasingly recognised that it is not the years of schooling alone but the quality of education that
matters.
Focusing on use of ICT in learning
Use of ICT has been found to have positive and negative effects. Strategies found to be more successful include scalable high quality instruction broadcasts, covering more advanced content, interactive
modules for learners, and customised student learning.
Equity
Natural heterogeneity in the population will mean that an optimal policy and curriculum for some learners is not the same for others.
Marginalised groups can be disadvantaged by curricula, for example due to underrepresentation in textbooks. Teachers require adequate support to be able to adapt the curriculum for learners with special
needs.
Analysis of Kenya’s expenditure in education, future sector cost scenarios and benefits of curriculum reform
© Oxford Policy Management 55
7.3 Perspectives from Kenya
The rationale for and objectives of the curriculum reform are set out in key documents, and reflect
the expected benefits of the reform. This section summarises the key benefits expected, focusing
on benefits in terms of outcomes and impacts.
A starting point for the new curriculum is to meet the goals of Vision 2030, which aims to transform
Kenya into a middle income industrialised country. Where the overarching vision is “A globally
competitive and prosperous nation with a high quality of life by 2030,” there is a clear expectation
that the new curriculum will provide the human capital necessary for achieving the vision. The
overall expectation is the system will produce Kenyans with the skills, knowledge and
competencies capable of lifelong learning, in turn making the country internationally competitive
and economically viable. The system would meet the human resource requirements for a changing
and diverse economy, as Kenya becomes newly industrialised (MOEST, 2015b).
The balance of general and technical and vocational skills in the curriculum is intended and
expected to prepare youth for knowledge-intensive economies. This is turn would curb
unemployment and vulnerable employment among young people (MOEST, 2015b).
Harmonising the duration of schooling in line with the East African Community is expected to
improve Kenya’s competitiveness in the region and globally. In addition, it should free up the
movement of teachers and learners within the region.
In addition, the report of the Technical Committee (MOEST, 2015b) implies the new structure is
intended to reduce wastage and educate students with a wide array of relevant and skills through
an all-inclusive curricula. This was based on a shorter elementary education for foundational skills
(6 years of primary rather than 8) followed by a junior secondary level which allows learners to
explore their interests and strengths, before narrowing down in senior secondary.
There is an expectation of greater flexibility through pathways and options for students to exit and
re-enter the system. At the same time these pathways are supposed to give opportunities for high
performance and career progression for learners with diverse abilities and potentials. Academic
routes, particularly to university, would no longer be seen as the only route to success. Ultimately
all learners would be valued for their diversity, and this in turn is expected to reduce the
disengagement of young people and reduce crime (KICD no date – Reform Brief).
There is reference to the curriculum being expected to support the building of social cohesion, as
well as to build identity and belonging by fostering local cultures in the curriculum (presumably
though the introduction of local content) (KICD - Curriculum Reform Proposal & Budget).
Analysis of Kenya’s expenditure in education, future sector cost scenarios and benefits of curriculum reform
© Oxford Policy Management 56
8 Conclusions
Having made good progress in expanding enrolment, and a strong financial commitment to
education, the Government of Kenya is embarking on a reform of the curriculum in order to
address identified weaknesses and challenges in the existing system. The new curriculum will seek
to align education to Vision 2030 and the 2010 Constitution, taking into account aspirations for
skills and human capital required to be a middle income country.
This assignment seeks to provide evidence and a tool for MOEST to support its decision making in
moving ahead with the curriculum reform. It included a review of recent years of education
expenditure and the macroeconomic context within which the education sector sits. Scenarios of
future enrolment and costs for the sector have been created, to inform decisions about policy
parameters in terms of what may be affordable. Finally, the potential benefits of the reform are
reviewed, drawing on the outputs included in the scenarios, international evidence of outcomes,
and Kenya’s expectations of impact.
The report provides a basis for the Government to better understand student flow and the financial
implications of a change in student flow related to the new curriculum. It also provides a starting
point for discussions about the affordability of meeting such a strategy, given the scale of funds
that would be needed from Government. As such, this report and tool should support the country’s
dialogue with sector stakeholders to come to the best combination of inputs and hence resources
and expected results. It thus forms preliminary elements of a sector diagnostic.
This chapter summarises the findings from the assignment, and ends with reflections on the
implications of the planned curriculum reform and recommendations for MOEST and Kenya’s
education stakeholders to move to an affordable solution.
8.1.1 Recent trends in education finance
Over the last five years, Kenya’s GDP grew on average by 5.5% each year in real terms, bringing it
to Ksh 6.2 trillion in 2015/16. Real economic growth has surpassed population growth such that
GDP per capita has increased each year, reaching Ksh 128,000 per person. Out of its GDP, Kenya
has been able to collect between 18.8% and 19.4% of its wealth in domestic revenues each year,
and public expenditure has been between 23% and 26% of GDP in the last five years.
The government allocates over 14% of its total spending to education each year, although this
share has fallen from over 20% in 2011/12. Nevertheless in market prices, the absolute amount
spent on education has increased year on year to reach Ksh 320 billion forecast for 2015/16. This
has stayed above 5% of GDP over the last six years. Within government spending on education,
around 92% to 95% tends to be on recurrent expenditure, with the rest on development.
Primary education receives the largest share of recurrent education spending, at over 40% for the
last five years. Secondary accounts for the second largest share at around 32%. The TVET and
university levels receive around 4% and 14% respectively, and with administration taking 5-8%,
this leaves less than one percent for early childhood education. Meanwhile, calculating unit costs
(average spending per student) of public institutions, the cost increases with the level of education.
Based on this, it costs three times as much to educate a student in secondary education for one
year than it does in primary school, over four times as much in TVET and seven times in university.
However, the gap between unit costs of TVET and university relative to primary have reduced
substantially in recent years, suggesting resource input has not kept up with enrolment at higher
levels.

Analysis of Kenya’s expenditure in education, future sector cost scenarios and benefits of curriculum reform
© Oxford Policy Management 57
In addition to public spending on education, there is a not insignificant amount financed from other
sources and so remaining ‘off-budget’. Development partners spend somewhere up to USD 190
million per year, which roughly matches the amount the government spends on development.
Whilst data on other spending is scarce, estimates of household spending in public basic schools
on board of management teachers and boarding fees puts the amount at Ksh 132 billion per year.
If we assume the cost of private schools is equal to that of public schools, another Ksh 28 billion is
spent each year on primary and secondary education. Compared to around Ksh 280 billion spent
by the government on education, this suggests households are paying half of that amount again on
top of government spend.
8.1.2 Kenya’s curriculum reform
Kenya has developed proposals and policies for the curriculum reform, which build on a number of
policy statements and legal commitments arising over the last eight years. Key defining aspects of
the reform are a shift to competence-based curriculum, which has a structure of 2-6-3-3 years of
schooling for basic education instead of the existing (2)-8-4. Within senior secondary education,
three pathways will be introduced to give students flexible alternatives that cater to different
abilities and interests.
8.1.3 Education projection model
A spreadsheet model was developed and used to project the costs of the education sector and
resources available to the sector from the government budget. The model builds up blocks of
levels of education and working from enrolments through to the costs associated with student
numbers. Inevitably this type of projection is made using hundreds of assumptions about what will
happen, and any number of scenarios could be developed by varying the assumptions in different
combinations. This report presents three scenarios as a way to better understand the potential
implications of policy decisions and what it means for the affordability of the sector.
With GDP predicted to grow by 4% each year, if revenue collection rates remain the same, and the
share of revenue devoted to education remains the same, then the budget available for education
would increase from Ksh 274 billion in 2015 to Ksh 494 billion in 2030 (in real terms). At the same
time, the school age population is expected to grow by a third, from around 18 million to 24 million.
If enrolment rates are also expected to increase towards achieving universal basic education, this
means enrolment numbers could increase quite substantially.
Scenario 0: If the status quo rates of enrolment and retention continue, under the current
curriculum, enrolment in basic education will increase from less than 18 million today to 21 million
in 2030. Recurrent costs would be Ksh 280 billion per year in 2030. In this scenario, the sector’s
costs are easily affordable and the budget surplus to education would be Ksh 35 billion by 2030.
Scenario 1: Under a scenario of complete universal basic education but the current structure of 8-
4-4, with 100% retention and transition and zero repetition, enrolment increases to 24 million by
2030. Recurrent spending thus increases: from Ksh 200 billion in 2014 to over Ksh 468 billion in
2030. This means the sector requires more resources than the projection of government budget
allocation to education, leading to a financial gap of Ksh 223 billion in 2030.
Scenario 2: When the structure of education shifts to 6-3-3-4, it is assumed that one year of
relatively more expensive secondary education is converted into junior secondary, which has the
same lower price as primary education. Under this scenario, the cost of the sector still increases
due to the higher enrolment, but by 2030 it reaches Ksh 434 billion compared with the Ksh 468

Analysis of Kenya’s expenditure in education, future sector cost scenarios and benefits of curriculum reform
© Oxford Policy Management 58
billion needed in the earlier scenario. This means the financing gap is smaller too, at around Ksh
190 billion per year in 2030.
In order to cover the costs of the curriculum reform (Scenario 2), the government would have to
commit an increasing proportion of GDP – from 4.9% in 2014 up to 6.8% in 2030 – to education
recurrent spending. This would be equivalent to over 35% of domestic revenues committed to
education recurrent spending in 2030, far higher than the 25.4% committed in 2014. This shows
the scale of inter-sectoral prioritization that would be required to finance a scenario of full
enrolment and transition. As such, it does not appear realistically affordable. Kenya’s decision
makers can continue to test out other assumptions in the tool to see the affordability, such as
changing the pupil teacher ratio or looking for price reductions.
8.1.4 Benefits of curriculum reform
The scenarios developed in the projection model show the benefits to the sector of increasing
enrolment when universal basic education is pursued. With UBE, over 1 million students are
estimated to complete Senior Secondary in 2021/22, compared with just 327,000 completers with
current levels of retention. This feeds a more educated set of young people into adulthood and the
economy. If the quality of education also improves, as intended by the curriculum reform, then
these young people will be even more skilled and productive workers.
Looking at international experience, there is no study or paper that attempts to fully evaluate the
introduction of a new curriculum. However, experience from interventions which correspond to
aspects of Kenya’s proposals show that positive outcomes can be there, but the detail of design
and implementation quality is key. Sufficient preparation, relevant and quality training for teachers,
matching resources like reaching aids and aligned assessment systems are all critical to the
success of a new curriculum. The research and development work carried out by KICD should help
MOEST to ensure that lessons from other countries are taken into account, and consultation and
testing may be important for making sure the intended implementation of the new curriculum is
suited to the realities for Kenyan schools, teachers and students.
Based on the Government’s policy documents and vision for the curriculum reform, it is the overall
expectation is the new system will produce Kenyans with the skills, knowledge and competencies
capable of lifelong learning, in turn making the country internationally competitive and economically
viable. Greater opportunities for learning technical and vocational skills in the curriculum are
intended and expected to prepare youth for knowledge-intensive economies. This is turn would
curb unemployment and vulnerable employment among young people. The shift in structure to 6-3-
3 is expected to reduce wastage, drop-out and inefficiencies, and the pathways in secondary
education are expected to increase flexibility and options for re-entering the system.
8.1.5 Implications and recommendations
The Government of Kenya is in pursuit of its long term vision of becoming a middle income
economy. The vision, once achieved, is expected to be supported and sustained by a globally
competitive and vibrant education sector. The government is therefore undertaking curriculum
reform as well as other related reforms in the education sector aimed at improving the quality of
education and making it more responsive to the needs of the local, regional and global markets.
This report has reviewed the past trends in education with regard to public inputs to the education
system, enrolments and different types of expenditures. This has been necessary in understanding
the resource environment and the capacity of the system to make adjustments for new projects
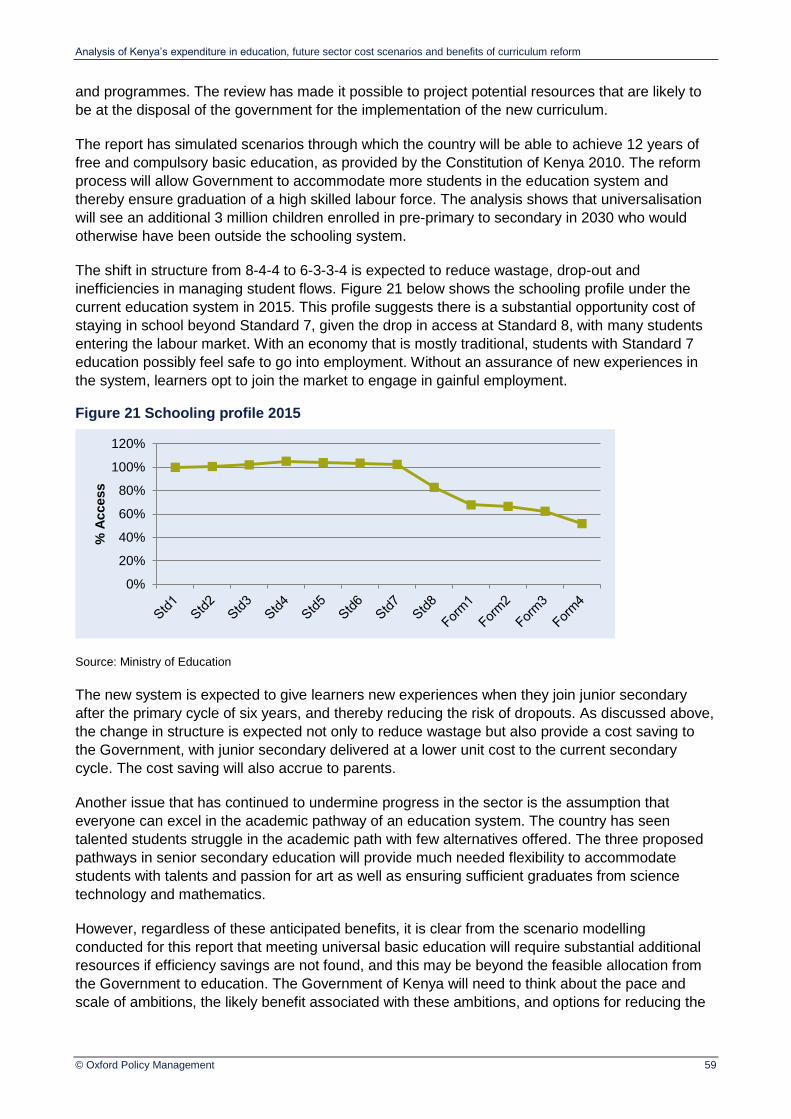
Analysis of Kenya’s expenditure in education, future sector cost scenarios and benefits of curriculum reform
© Oxford Policy Management 59
and programmes. The review has made it possible to project potential resources that are likely to
be at the disposal of the government for the implementation of the new curriculum.
The report has simulated scenarios through which the country will be able to achieve 12 years of
free and compulsory basic education, as provided by the Constitution of Kenya 2010. The reform
process will allow Government to accommodate more students in the education system and
thereby ensure graduation of a high skilled labour force. The analysis shows that universalisation
will see an additional 3 million children enrolled in pre-primary to secondary in 2030 who would
otherwise have been outside the schooling system.
The shift in structure from 8-4-4 to 6-3-3-4 is expected to reduce wastage, drop-out and
inefficiencies in managing student flows. Figure 21 below shows the schooling profile under the
current education system in 2015. This profile suggests there is a substantial opportunity cost of
staying in school beyond Standard 7, given the drop in access at Standard 8, with many students
entering the labour market. With an economy that is mostly traditional, students with Standard 7
education possibly feel safe to go into employment. Without an assurance of new experiences in
the system, learners opt to join the market to engage in gainful employment.
Figure 21 Schooling profile 2015
Source: Ministry of Education
The new system is expected to give learners new experiences when they join junior secondary
after the primary cycle of six years, and thereby reducing the risk of dropouts. As discussed above,
the change in structure is expected not only to reduce wastage but also provide a cost saving to
the Government, with junior secondary delivered at a lower unit cost to the current secondary
cycle. The cost saving will also accrue to parents.
Another issue that has continued to undermine progress in the sector is the assumption that
everyone can excel in the academic pathway of an education system. The country has seen
talented students struggle in the academic path with few alternatives offered. The three proposed
pathways in senior secondary education will provide much needed flexibility to accommodate
students with talents and passion for art as well as ensuring sufficient graduates from science
technology and mathematics.
However, regardless of these anticipated benefits, it is clear from the scenario modelling
conducted for this report that meeting universal basic education will require substantial additional
resources if efficiency savings are not found, and this may be beyond the feasible allocation from
the Government to education. The Government of Kenya will need to think about the pace and
scale of ambitions, the likely benefit associated with these ambitions, and options for reducing the
0%
20%
40%
60%
80%
100%
120%
% A
ccess

Analysis of Kenya’s expenditure in education, future sector cost scenarios and benefits of curriculum reform
© Oxford Policy Management 60
costs. With this in mind, there are three key recommendations for furthering decisions about the
curriculum reform and policy.
Recommendation 1: Conduct a full sector diagnostic and public expenditure review to
better understand where there is room for reducing inefficiencies in the system
It is very likely there is room in the system to reduce wastage and unit costs in delivering
education. A full public expenditure review (PER) would be necessary to see which parts of the
sector have inefficiencies which could be removed without compromising quality service provision.
Further, this report and curriculum development itself is based on aggregate pictures of the sector.
A full sector diagnostic would document the situation on disparity, equity and efficiency in the use
of resources and education outcomes. These analyses would inform where there is room for the
Government to reduce unit costs and make the new reforms more affordable.
Recommendation 2: Use the projection model to test how reviewing the policy options and
ambitions makes the reform more affordable.
The tool is there for policy makers to now iteratively adjust the targets in order to see how this
affects the estimated costs of the sector. Here the PER and diagnostic already recommended
would help inform the quality and equity implications of changes to targets or underlying
assumptions (such as increasing PTRs, for example). For instance, is there room for tightening a
target or assumption, or would this compromise quality, and if so what is the tolerance for this? The
options to reduce costs may need further feasibility and political economy analysis to ensure they
can realistically be implemented.
Recommendation 3: Conduct employment and market analysis to inform the pathways
Given the large cost of implementing a change in curriculum, the Government should be sure that
the ambitions will produce the right outputs to match economic needs – the demands of the labour
market and opportunities for job creation. For instance, one way to compete with middle income
countries is to develop a large manufacturing sector, and to do this the economy needs a labour
force with mostly around nine years of basic education and strong technical and vocational skills.
How will the 12 years of basic education optimise learning for students entering Kenya’s economy?
In Kenya, 83% of workers are employed in the informal sector, equivalent to almost 12 million
people (Table 36). Employment in the informal sector has almost tripled since 2000, and at the
same time this sector has grown as a proportion of all employment from only 70% in 2000. Whilst
the modern sector has also grown, its growth has been far less rapid than the informal sector.
Table 36 Recorded employment in Kenya (thousands), 2000, 2005, 2010, 2014
2000 2005 2010 2014
# % # % # % # %
Modern sector - wage employees
1,695 29% 1,808 22% 2,059 19% 2,370 17%
Modern sector - self-employed or unpaid family workers
65 1% 67 1% 70 1% 103 1%
Informal sector 4,151 70% 6,397 77% 8,826 81% 11,846 83%
Total 5,912 100% 8,272 100% 10,955 100% 14,319 100%
Source: Economic Surveys

Analysis of Kenya’s expenditure in education, future sector cost scenarios and benefits of curriculum reform
© Oxford Policy Management 61
The informal sector has clearly been surviving and thriving with the current levels of education in
the population. How will the new curriculum ensure students leave with competencies to improve
productivity in the economy in general and especially in the informal sector? Will the economy be
able to adapt to create opportunities for the graduates of the system under the new curriculum?
Will the informal sector find ways to make use of their skills, or will employment in the modern
sector evolve? Further employment and market analysis would help answer these questions, and
make sure education policy and economic growth policy are aligned with each other. As part of
this, the Government may want to consider alternative options for learners within the 12 years of
basic education, which are suited to the needs of the economy and reflect the opportunity cost of
education.
These three recommendations together would support Kenya’s stakeholders in coming to a policy
which is affordable, efficient in delivering its outputs and leads to outcomes that will be fully utilised
by the country.
Analysis of Kenya’s expenditure in education, future sector cost scenarios and benefits of curriculum reform
© Oxford Policy Management 62
References / Bibliography
Altinyelken, H K (2009) ‘Pedagogical renewal in sub‐Saharan Africa: the case of Uganda’,
Comparative Education, 46:2, 151-171
Altinyelken, H K (2010) ‘Curriculum change in Uganda: Teacher perspectives on the new thematic
curriculum’, International Journal of Educational Development 30. 151–161
Andrietti, V and Su, X, (2016) ‘Education Curriculum and Student Achievement: Theory and
Evidence’. Universidad Carlos III de Madrid, Working Paper Economic Series 16-07
Commission of Inquiry into the Education System (1999) Totally Integrated Quality Education
Report
Evans D, Popova A (2015) ‘What Really Works to Improve Learning in Developing Countries? An
Analysis of Divergent Findings in Systematic Reviews’, Policy Research Working Paper 7203.
World Bank Africa Region Office of the Chief Economist.
Farrell, J P 2002. ‘The Aga Khan Foundation experience compared with emerging alternatives to
formal schooling’, in School improvement through teacher development: Case studies of the Aga
Khan Foundation projects in East Africa, ed. S.E. Anderson, 247–70. Lisse: Swets and Zeitlinger
Publishers.
Glewwe P, Muralidharan K (2015) ‘Improving School Education Outcomes in Developing
Countries: Evidence, Knowledge Gaps, and Policy Implications’, RISE Working Paper 15/001.
Glewwe, P, Kremer, M, & Moulin, S (2009, January). ‘Many Children Left Behind? Textbooks and
Test Scores in Kenya’, American Economic Journal: Applied Economics, 1(1).
Government of Kenya (2003) Investment Programme for the Economic Recovery Strategy for
Employment and Wealth Creation (IP-ERS) 2003-2007
Government of Kenya (2007) Vision 2030
Hanushek, E A, and Wößmann, L (2007). ‘The role of School Improvement in Economic
Development’, NBER Working Paper No. 12832, National Bureau of Economic Research.
Hardman F, Abd-Kadir J, Agg C, Migwi J, Ndambuku J, Smith F (2009) ‘Changing pedagogical
practice in Kenyan primary schools: The impact of school-based training’, Comparative Education,
45 (1): 65-86.
Jwan, Julius O. (January 2016) Curriculum Reform in Kenya: Rationale and Prospects for
Economic Growth. Presentation by Director/CEO of the Kenya Institute of Curriculum Development
to the Education World Forum. [Accessed at http://www.theewf.org/uploads/pdf/Julius-Jwan-
%E2%80%93-EWF-2016-Presentation.pdf 5/5/16]
Kenya Institute of Curriculum Development (April 2016) Reform Brief, unpublished.
Kenya Institute of Curriculum Development (no date) BECF learning outcomes and areas.
Powerpoint, unpublished.
Kenya Institute of Curriculum Development (no date) Curriculum Reform Proposal & Budget,
unpublished.

Analysis of Kenya’s expenditure in education, future sector cost scenarios and benefits of curriculum reform
© Oxford Policy Management 63
Kenya Institute of Curriculum Development (no date) Draft Basic Education Curriculum
Framework. Powerpoint, unpublished.
Kenya Institute of Curriculum Development (2016) Curriculum Reforms Needs Assessment Report
Kimenyi M S (2013) ‘The bad economics of free primary education’, Bookings Op-Ed. [Accessed
26/10/16 https://www.brookings.edu/opinions/the-bad-economics-of-free-primary-education/]
Michael C, Mungadi R and Rouhani S (2002) ‘From Policy to Practice: Curriculum reform in South
African education’, Comparative Education, 38:2, 171-187
Ministry of Education and Ministry of Higher Education, Science Technology (2012) A Policy
Framework For Education And Training: Reforming Education and Training Sectors in Kenya.
Sessional Paper No 14 of 2012.
Ministry of Education, Science and Technology (2014a) Basic Education Statistical Booklet. With
UNICEF.
Ministry of Education, Science and Technology (2014b) Kenya. Education for All 2015 National
Review. With UNESCO.
Ministry of Education, Science and Technology (2014c) GPE pledge
Ministry of Education, Science and Technology (2015a) National Education Sector Plan 2013-
2018, Volumes 1 and 2
Ministry of Education, Science and Technology (December 2015c) National Curriculum Policy
Ministry of Education, Science and Technology (January 2015b) Report of the National Technical
Committee on Curriculum Reform
Ministry of Education, Science and Technology (2016) Background Information. [Accessed
19/10/16 http://www.education.go.ke/index.php/about-us/background-information]
Nkambwe, E and Essilfie, V N (2012) ‘Misalignment between policy and practice: Introducing
environmental education in school curricula in Botswana’, Educational Research and Review Vol.
7(1), pp. 19-26.
Odhiambo (2012) Taskforce on Aligning Education to the Constitution and Vision 2030
Piper, B and Kwayumba, D (2014) USAID/Kenya Primary Math and Reading (PRIMR) Initiative:
Kisumu Information and Communication Technology (ICT) Intervention. Endline Report. Research
Triangle Institute (RTI), USA
Power T, Gater R, Grant C, and Winters N (2014) Educational Technology Topic Guide. Health &
Education Advice & Resource Team (HEART)
Pritchett L, Beatty A (2012) The negative consequences of overambitious curricula in developing
countries. Washington, DC: Centre for Global Development
Republic of Kenya (2015) Sessional Paper No. 2 of 2015
Resource Mobilisation Sub-Committee (no date) Resource Mobilisation, unpublished.

Analysis of Kenya’s expenditure in education, future sector cost scenarios and benefits of curriculum reform
© Oxford Policy Management 64
SACMEQ (2011) Trends in Achievement Levels of Standard 6 Pupils in Kenya. Policy Brief
Number 1 (June 2011)
Some (2012) Taskforce on Aligning Higher Education to the Constitution and Vision 2030
UNICEF (draft June 2016) Out of school Children situation in Kenya
Uwezo (2015) Are Our Children Learning? The State of Education in Kenya in 2015 and Beyond.
Nairobi: Twaweza East Africa.
Vavrus, F (2009) ‘The cultural politics of constructivist pedagogies: Teacher education reform in
the United Republic of Tanzania’, International Journal of Educational Development 29. 303–311
Westbrook J, Durrani N, Brown R, Orr D, Pryor J, Boddy J, Salvi F (2013) Pedagogy, Curriculum,
Teaching Practices and Teacher Education in Developing Countries. Final Report. Education
Rigorous Literature Review. Department for International Development.
World Bank (2014) Decision Time: Spend more or spend smart? Kenya Public Expenditure Review
Volume I. World Bank Group.
World Bank (draft June 2014) Kenya GPE Primary Education Development Project, Project
Appraisal Document

Analysis of Kenya’s expenditure in education, future sector cost scenarios and benefits of curriculum reform
© Oxford Policy Management 65
Annex A List of people and institutions met
A.1 List of people met or held discussions with in inception phase
Name Organisation Position
Ousmane Niang UNICEF Chief of Social Policy
Daniel Baheta UNICEF Chief of Education
Shweta Sandilya UNICEF Education Specialist
Darius Mogaka MOEST Director Policy
Sebastian Owanga MOEST Assistant Director - Policy
Prof Kaane MOEST NESP Consultant
Lillian Miliza MOEST Finance Officer, Basic Education
Esther Maina MOEST Finance Officer, TVET and University Education
Joan Murigu MOEST Director Basic Education
Turphenah Kirongo MOEST Director Secondary Education
Kapsir MOEST Finance Officer, TVET and University Education
Julius O. Jwan KICD Director / Chief Executive Officer
Jacqueline Onyango KICD Deputy Director
Reuben Nthamburi KICD Deputy Director
Franco Munene KICD Assistant Director - Pure Sciences
Macdonald Obudho KNBS Director Population and Social Statistics
Marie-France Provencher Canadian High Commission First Secretary (Development)

Analysis of Kenya’s expenditure in education, future sector cost scenarios and benefits of curriculum reform
© Oxford Policy Management 66
Annex B County level data
B.1 ECDE gross and net enrolment rates, 2014
Source: MOEST (2014a)
B.2 Primary gross and net enrolment rates, 2014
Source: MOEST (2014a)
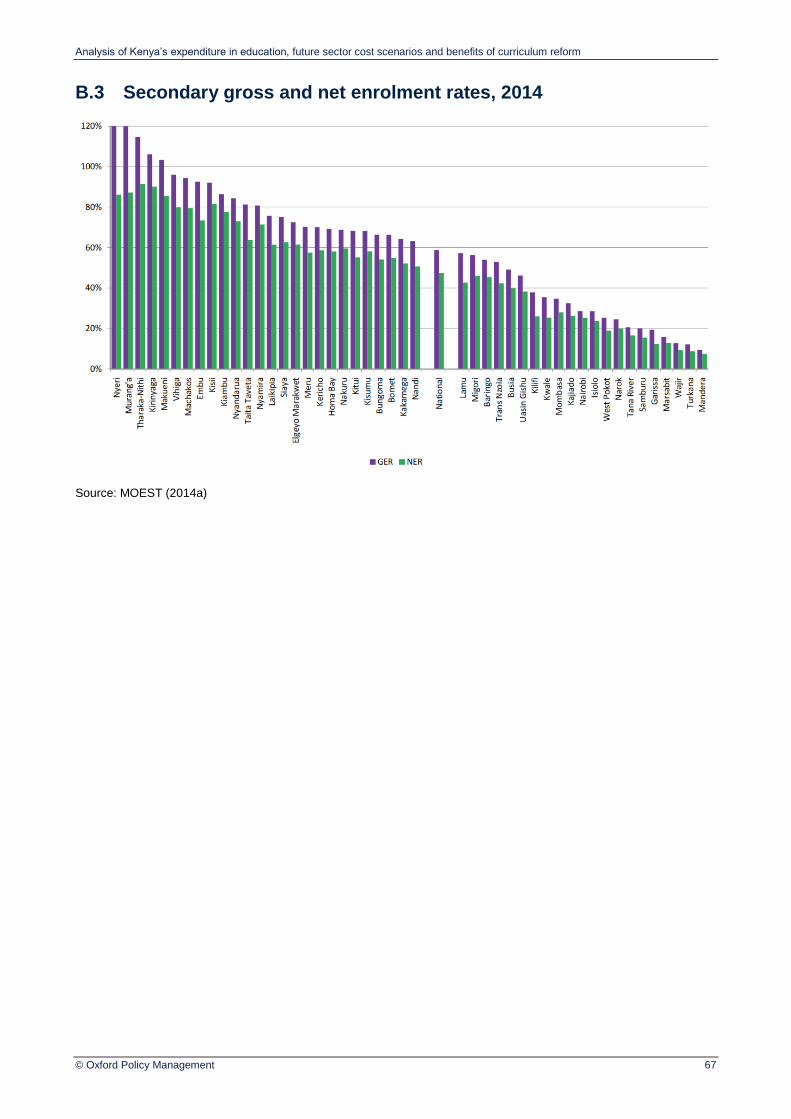
Analysis of Kenya’s expenditure in education, future sector cost scenarios and benefits of curriculum reform
© Oxford Policy Management 67
B.3 Secondary gross and net enrolment rates, 2014
Source: MOEST (2014a)

Analysis of Kenya’s expenditure in education, future sector cost scenarios and benefits of curriculum reform
© Oxford Policy Management 68
B.4 County Spending on ECDE, 2014/15 (Ksh millions)
Total County Expenditure Education, Sports,
Culture and Arts Vote
Education (ECDE)
Total expenditure As % of total County
County Recurrent Development Recurrent Development Recurrent Development Recurrent Development
Baringo 2,945.6 1,215.6 245.4 189.8 61.3 66.4 2.1% 5.5%
Bomet 2,359.5 2,054.0 135.4 456.4 33.8 159.7 1.4% 7.8%
Bungoma 4,584.1 2,561.0 311.2 259.0 77.8 90.6 1.7% 3.5%
Busia 2,971.4 2,025.0 110.5 119.0 27.6 41.7 0.9% 2.1%
Elgeyo Marakwet 2,258.8 1,128.6 167.8 76.0 42.0 26.6 1.9% 2.4%
Embu 3,177.2 625.7 9.7 77.1 6.8 27.0 0.2% 4.3%
Garissa 3,676.6 2,919.6 183.0 46.5 45.8 16.3 1.2% 0.6%
Homa Bay 3,416.2 1,862.9 272.6 83.8 68.2 29.3 2.0% 1.6%
Isiolo 1,759.0 1,086.5 66.5 73.6 16.6 25.8 0.9% 2.4%
Kajiado 3,507.5 1,025.6 137.3 207.6 34.3 72.7 1.0% 7.1%
Kakamega 4,380.1 3,107.2 88.9 473.3 22.2 165.7 0.5% 5.3%
Kericho 3,035.3 1,245.4 251.6 142.8 62.9 50.0 2.1% 4.0%
Kiambu 6,478.6 2,287.3 369.3 251.5 92.3 88.0 1.4% 3.8%
Kilifi 4,535.9 2,986.4 656.0 447.3 164.0 156.5 3.6% 5.2%
Kirinyaga 2,282.4 902.6 70.8 65.1 17.7 22.8 0.8% 2.5%
Kisii 4,254.8 2,283.5 203.9 228.3 51.0 79.9 1.2% 3.5%
Kisumu 4,411.2 1,346.4 62.7 98.2 15.7 34.4 0.4% 2.6%
Kitui 3,936.5 2,964.8 310.3 149.2 77.6 52.2 2.0% 1.8%
Kwale 2,449.2 2,027.4 362.2 206.1 90.5 72.1 3.7% 3.6%
Laikipia 2,410.6 979.2 3.3 49.9 2.3 17.5 0.1% 1.8%
Lamu 1,141.0 576.0 64.3 55.4 16.1 19.4 1.4% 3.4%
Machakos 5,051.7 2,033.6 173.2 92.6 43.3 32.4 0.9% 1.6%
Makueni 3,132.9 1,251.0 222.9 151.3 55.7 53.0 1.8% 4.2%
Mandera 4,106.7 4,913.1 242.0 305.4 60.5 106.9 1.5% 2.2%

Analysis of Kenya’s expenditure in education, future sector cost scenarios and benefits of curriculum reform
© Oxford Policy Management 69
Marsabit 2,468.4 1,919.6 60.3 95.8 15.1 33.5 0.6% 1.7%
Meru 3,985.3 2,268.2 148.8 60.0 37.2 21.0 0.9% 0.9%
Migori 2,857.4 1,905.9 23.0 217.2 5.7 76.0 0.2% 4.0%
Mombasa 5,625.3 2,092.0 122.7 240.1 30.7 84.0 0.5% 4.0%
Murang'a 3,071.2 2,348.1 36.4 210.3 9.1 73.6 0.3% 3.1%
Nairobi 18,724.3 2,298.3 1,242.0 77.5 310.5 27.1 1.7% 1.2%
Nakuru 6,603.6 1,600.2 273.8 152.1 68.5 53.2 1.0% 3.3%
Nandi 2,399.1 2,266.7 132.9 166.5 33.2 58.3 1.4% 2.6%
Narok 4,302.2 2,356.7 303.9 272.7 76.0 95.4 1.8% 4.1%
Nyamira 2,361.6 1,277.8 103.2 51.2 25.8 17.9 1.1% 1.4%
Nyandarua 2,643.2 1,289.0 177.8 57.9 44.4 20.3 1.7% 1.6%
Nyeri 3,739.1 1,076.1 50.1 12.9 12.5 4.5 0.3% 0.4%
Samburu 1,664.7 1,618.2 220.4 119.4 55.1 41.8 3.3% 2.6%
Siaya 2,705.0 1,466.7 111.5 174.7 27.9 61.1 1.0% 4.2%
Taita Taveta 2,558.4 948.5 154.3 82.2 38.6 28.8 1.5% 3.0%
Tana River 1,274.0 982.7 18.0 106.8 12.6 37.4 1.0% 3.8%
Tharaka-Nithi 1,798.3 906.4 52.9 163.9 13.2 57.4 0.7% 6.3%
Trans Nzoia 2,875.4 1,215.9 33.1 161.0 8.3 56.4 0.3% 4.6%
Turkana 3,234.0 5,784.0 41.0 818.0 10.3 286.3 0.3% 4.9%
Uasin Gishu 3,103.0 2,434.5 222.7 368.2 55.7 128.9 1.8% 5.3%
Vihiga 2,234.6 1,271.2 68.0 114.7 17.0 40.1 0.8% 3.2%
Wajir 2,673.7 3,899.4 164.4 122.4 41.1 42.8 1.5% 1.1%
West Pokot 2,388.5 1,645.8 153.4 117.3 38.4 41.0 1.6% 2.5%
National 167,552.8 90,280.3 8,635.0 8,267.8 2,172.7 2,893.7 1.3% 3.2%
Source: Controller of Budget County Expenditure Report 2014/15. The allocation and expenditure numbers come from the Education, Sports, Culture and Arts Vote. The organization of the Ministry in charge of education is not standard across counties. Some counties have education standing alone. Some have education, sports and culture. Some have education, sports, culture and ICT. The actual spending on ECDE has been estimated by using the proportion of ECDE spending out of the vote from counties which do present that data.

Analysis of Kenya’s expenditure in education, future sector cost scenarios and benefits of curriculum reform
© Oxford Policy Management 70
Annex C Curriculum development
C.1 Curriculum development activities, timeline and budget
Activity Year Jan Feb Mar Apr May Jun Jul Aug Sep Oct Nov Dec Budget
1. Development of the Curriculum Framework (BCF) 2016 1.5
2. Meeting with stakeholders to reflect on the eight national goals of Education ( universities, line ministries, colleges, industry, faith-based org., unions and teacher associations)
2016 1.56
3. Communication advocacy and social mobilization on curriculum reform issues and process ( needs assessment report, curriculum framework )
2016 2.2
4. Retreat to tie the theoretical approaches and frameworks to inform the instruction materials
2016 0.5
5. Stakeholders engagement on inculcating values to the learners 2016 1.4
6. Conceptualization meeting for tier 3 with the higher education stakeholders (CUE, KUPCS, Universities, Colleges and tertiary institutions)
2016 0.7
7. Review meeting on APBET in the context of FPE, FDSE 2016 0.7
8. Review the SNE Policy and implementation 2016 0.3
9. Forum to engage experts on service learning and parental empowerment and develop a model
2016 1.4
10. Field visits to institutions to find out how competency based assessment is conducted
2016 0.6
11. Engage KNEC, KICD and other experts on formative and summative assessment for competency based education
2016 2
12. Engagement on development of instructional materials for competency-based curriculum in collaboration with UNESCO-IBE, AKF
2016 1.2
13. Development of Matrices on Pertinent and Contemporary Issues 2016 5.5
14. Validation and approval of ECF 2016 0.6
15. Writing and editing of competency based designs, scope and sequencing
2016 241
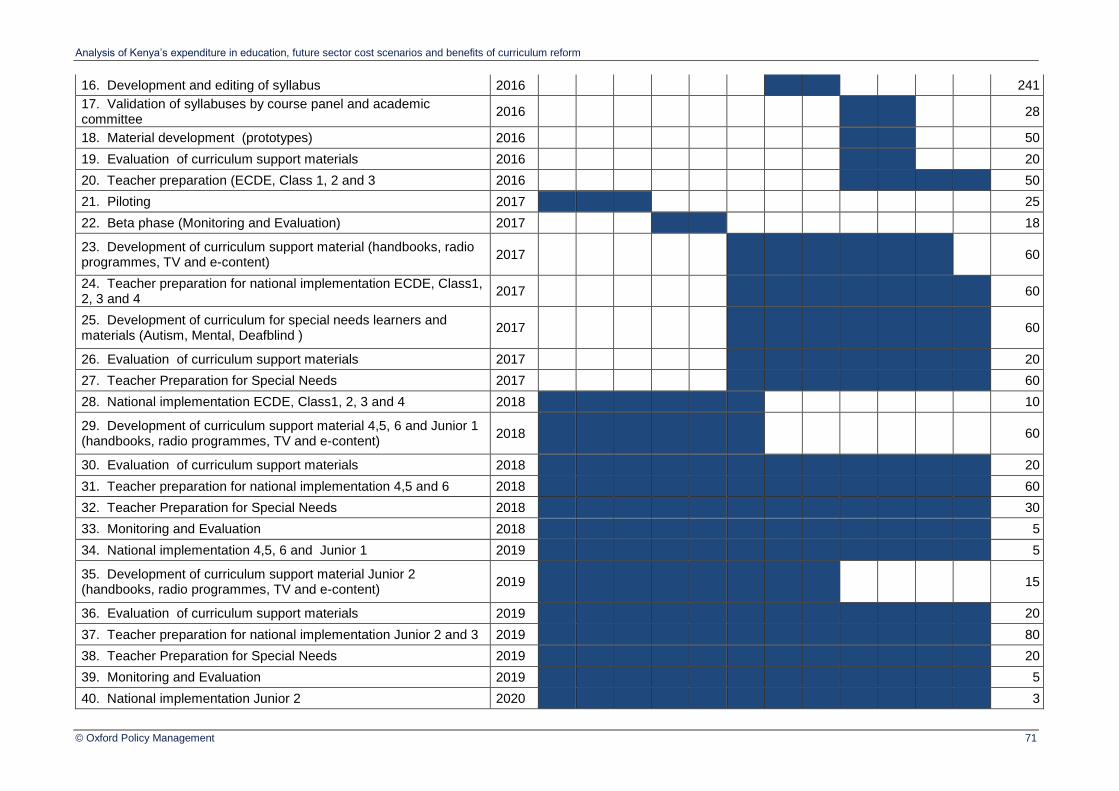
Analysis of Kenya’s expenditure in education, future sector cost scenarios and benefits of curriculum reform
© Oxford Policy Management 71
16. Development and editing of syllabus 2016 241
17. Validation of syllabuses by course panel and academic committee
2016 28
18. Material development (prototypes) 2016 50
19. Evaluation of curriculum support materials 2016 20
20. Teacher preparation (ECDE, Class 1, 2 and 3 2016 50
21. Piloting 2017 25
22. Beta phase (Monitoring and Evaluation) 2017 18
23. Development of curriculum support material (handbooks, radio programmes, TV and e-content)
2017 60
24. Teacher preparation for national implementation ECDE, Class1, 2, 3 and 4
2017 60
25. Development of curriculum for special needs learners and materials (Autism, Mental, Deafblind )
2017 60
26. Evaluation of curriculum support materials 2017 20
27. Teacher Preparation for Special Needs 2017 60
28. National implementation ECDE, Class1, 2, 3 and 4 2018 10
29. Development of curriculum support material 4,5, 6 and Junior 1 (handbooks, radio programmes, TV and e-content)
2018 60
30. Evaluation of curriculum support materials 2018 20
31. Teacher preparation for national implementation 4,5 and 6 2018 60
32. Teacher Preparation for Special Needs 2018 30
33. Monitoring and Evaluation 2018 5
34. National implementation 4,5, 6 and Junior 1 2019 5
35. Development of curriculum support material Junior 2 (handbooks, radio programmes, TV and e-content)
2019 15
36. Evaluation of curriculum support materials 2019 20
37. Teacher preparation for national implementation Junior 2 and 3 2019 80
38. Teacher Preparation for Special Needs 2019 20
39. Monitoring and Evaluation 2019 5
40. National implementation Junior 2 2020 3
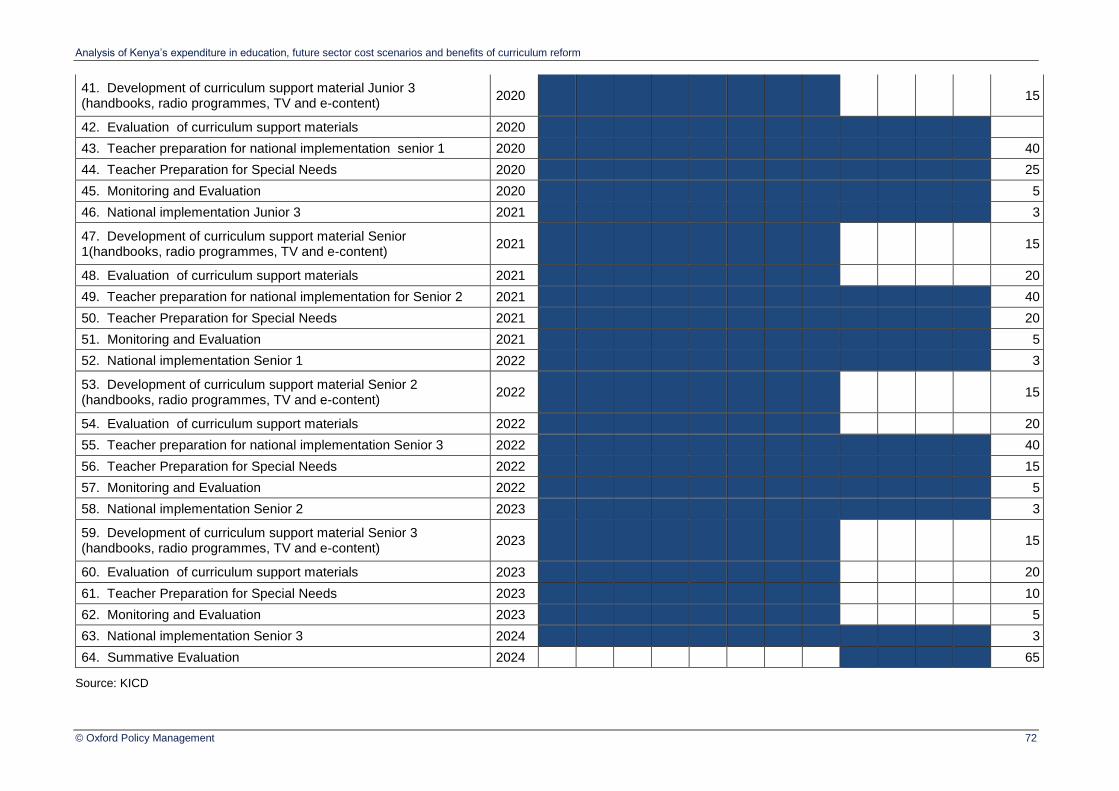
Analysis of Kenya’s expenditure in education, future sector cost scenarios and benefits of curriculum reform
© Oxford Policy Management 72
41. Development of curriculum support material Junior 3 (handbooks, radio programmes, TV and e-content)
2020 15
42. Evaluation of curriculum support materials 2020
43. Teacher preparation for national implementation senior 1 2020 40
44. Teacher Preparation for Special Needs 2020 25
45. Monitoring and Evaluation 2020 5
46. National implementation Junior 3 2021 3
47. Development of curriculum support material Senior 1(handbooks, radio programmes, TV and e-content)
2021 15
48. Evaluation of curriculum support materials 2021 20
49. Teacher preparation for national implementation for Senior 2 2021 40
50. Teacher Preparation for Special Needs 2021 20
51. Monitoring and Evaluation 2021 5
52. National implementation Senior 1 2022 3
53. Development of curriculum support material Senior 2 (handbooks, radio programmes, TV and e-content)
2022 15
54. Evaluation of curriculum support materials 2022 20
55. Teacher preparation for national implementation Senior 3 2022 40
56. Teacher Preparation for Special Needs 2022 15
57. Monitoring and Evaluation 2022 5
58. National implementation Senior 2 2023 3
59. Development of curriculum support material Senior 3 (handbooks, radio programmes, TV and e-content)
2023 15
60. Evaluation of curriculum support materials 2023 20
61. Teacher Preparation for Special Needs 2023 10
62. Monitoring and Evaluation 2023 5
63. National implementation Senior 3 2024 3
64. Summative Evaluation 2024 65
Source: KICD

Analysis of Kenya’s expenditure in education, future sector cost scenarios and benefits of curriculum reform
© Oxford Policy Management 73
Annex D Projection Scenarios Assumptions and Indicators
D.1 Summary of Main Indicators by Scenario
Sc0 Sc1 Sc2
2014 2030 2030 2030
Anticipated Resources
Domestically-generated revenues as % of GDP
19.4% 19.4% 19.4% 19.4%
% domestic resources allocated to education recurrent
25.4% 25.4% 25.4% 25.4%
ECD
Gross enrolment rate 73.6% 73.6% 100.0% 100.0%
% of private 31.5% 31.5% 35.0% 35.0%
% of pupils having school meals 47% 50% 50% 50%
Unit cost per school meal (Ksh) 1,200 1,200 7,800 7,800
Student flow assumptions: Primary to Secondary
Access Class1 100.8% 100% 100% 100%
Repetition rate Class 1 5% 5% 0.0% 0.0%
Retention class1 to 7 97% 100% 100% 100%
Retention 7-8 77% 77% 100% 100%
Transition 8-9 80% 80% 100% 100%
Retention Form1-Form4/Senior Secondary 78% 78% 100% 100%
Introduction of new system
Selection of new structure Key: 0=Current, 1=New system
0 0 1
Target year 2018 2018 2018
Transition 9-10 New system 100% 100% 100%
Average teacher salary in multiple of per capita GDP
Primary (1-6) 3.8 3.6 3.6 3.6
Senior Primary (Std7-Sdt8) or Junior Secondary
4.1 3.9 3.9 3.9
Secondary (Form1-Form4) or Tiers 3 6.3 5.5 5.5 5.5
Primary (1-6)
% of total private 16.4% 16.4% 18.0% 18.0%
Public
Ratio students / teacher (PTR) 36.2 36.2 35.0 35.0
% BOM teachers 16.7% 16.7% 1% 1%
Senior Primary (Std7-Sdt8) or Junior Secondary 3 years
% of total private 14.3% 14.3% 14.3% 14.3%
Public
Students / stream (per class) 35.0 35.0 35.0 35.0
Weekly instructional hours for students 30 30.0 30.0 30.0
Teacher weekly hours of teaching workload 25.4 25.4 27.0 27.0
% BOM teachers 16.7% 17% 1% 1%
Secondary (Form1-Form4) or Tiers 3
% of total private 6.7% 6.7% 6.7% 6.7%

Analysis of Kenya’s expenditure in education, future sector cost scenarios and benefits of curriculum reform
© Oxford Policy Management 74
Sc0 Sc1 Sc2
2014 2030 2030 2030
Public
% in pathway 1: STEM 60.0% 60.0% 60.0%
% in pathway 2: Social Sciences 25.0% 25.0% 25.0%
% in pathway 3: Arts and Sports 15.0% 15.0% 15.0%
Pathway 1: STEM
Students / stream 35.0 35.0 40.0 40.0
Weekly instructional hours for students 30 30.0 30.0 30.0
Pathway 2: Social Sciences
Students / stream 30.0 30.0 30.0
Weekly instructional hours for students 30.0 30.0 30.0
Teacher weekly hours of teaching workload 27.0 27.0 27.0
Pathway 3: Arts and Sport
Students / stream 20.0 20.0 20.0
Weekly instructional hours for students 30.0 30.0 30.0
Teacher weekly hours of teaching workload 27.0 27.0 27.0
% BOM teachers in Secondary all pathways 33.0% 33% 1% 1%
Technical and Vocational: Public Institutions
Number of students 148,142 209,842 1,000,000 1,000,000
Unit cost as multiple of GDP per capita 0.47 0.47 0.47 0.47
University
Students per 100,000 population 1,033 1,033 1,549 1,549
% in public institutions 18.1% 18.1% 40% 40%
Spending on Instructional material and administration as multiple of GDP per capita
0.62 0.62 0.62 0.62
Public financing 100% 100% 100% 100%
Student welfare/loans as multiple of GDP per capita
0.16 1 1 1

Analysis of Kenya’s expenditure in education, future sector cost scenarios and benefits of curriculum reform
© Oxford Policy Management 75
Annex E Stakeholder mapping
E.1 Table of stakeholders with interests or information relevant to the curriculum reform
Institution Rationale
Canadian Government Education sector development partner and current chair of the
Education Development Partners Group
Centre for Mathematics,
Science and Technology
(CEMASTEA)
Responsible for in-service teacher training in mathematics, science
and technology.
College of Education and
External Studies, University
of Nairobi
Teacher training university and centre of research on education in
Kenya
Commission for University
Education (CUE)
Accredit all the University programmes and ensure standards in higher
education.
DFID Kenya
Education sector development partner, implementing support projects
that include the Girls Education Challenge, KEEP and also jointly with
USAID funding Tayari and Tusome initiatives with the MOEST.
Education Standards and
Quality Assurance Council
(ESQAC)
The Council is charged (by the Education Act 2013) to ensure that
education standards are maintained across all the Basic Education
levels.
Elimu Yetu Coalition
Elimu Yetu Coalition is the umbrella union for education CSOs in
Kenya and is currently a member of the steering committee on the
curriculum reforms
Federation of Kenyan
Employers The FKE members absorb majority of the graduates.
Head-teachers Associations
(KEPSHA & KESSHA)
Heads are the chief implementers and currently are agents of the
MOEST in schools.
Kenya Institute of Curriculum
Development (KICD)
The institution charged with curriculum development, currently at the
heart of designing the curriculum. Many staff are members of the
Technical Committee on Curriculum Reform.
Kenya Literature Bureau Involved in producing instructional materials
Kenya National Association
of Parents Associations Parents lobby group, acknowledged by the Basic Education Act
Kenya National Bureau of
Statistics (KNBS) Report data on expenditure in education and population
Kenya National Examinations
Council (KNEC)
The KNEC by the KNEC 2012 Act has specific provisions on the
evaluation of the curriculum.
Kenya National Union of
Teachers
Largest teacher union (mainly primary school teachers), member of the
SC on the curriculum reforms
Kenya Private Schools
Association Representative of private schools.
Kenya Private Sector Alliance
The Kenya Private Sector Alliance is an umbrella union for the private
sector and largely draw the workforce from the graduants. They are
currently spending significant resources to train for placement and
have consistently complained of the quality of the graduates
Kenya Publishers
Association
The Government shall heavily rely on the publishers to produce the
curriculum materials.
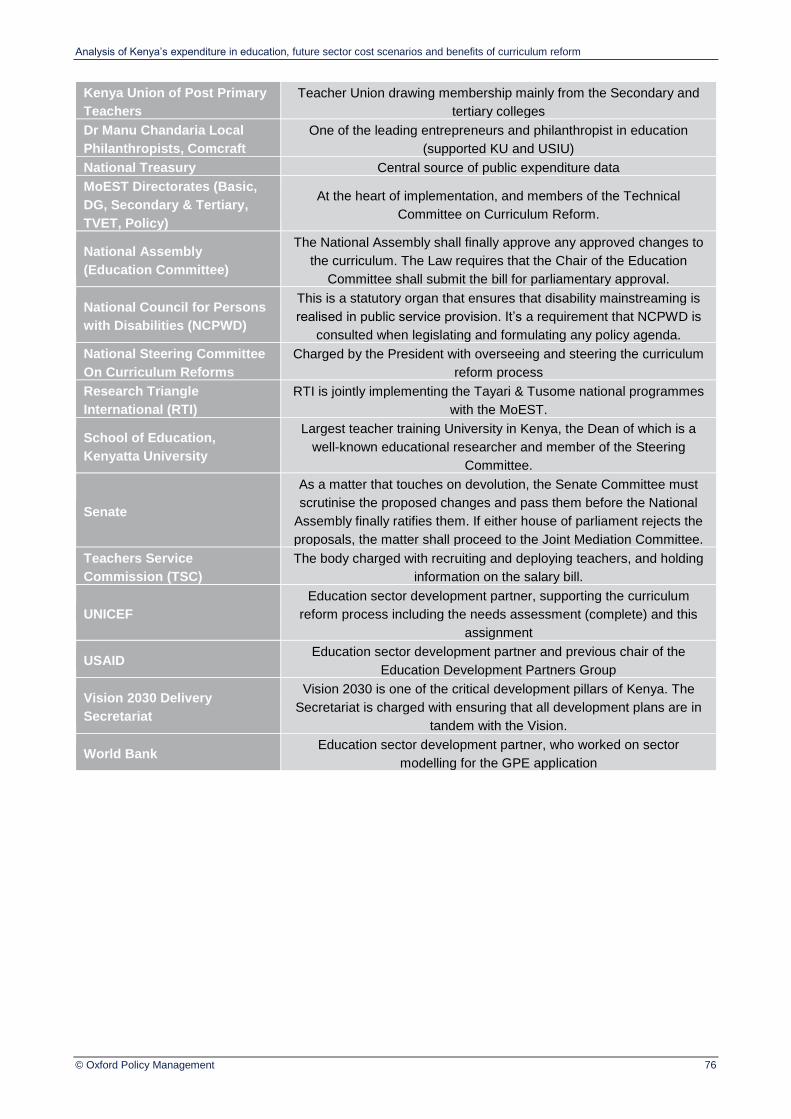
Analysis of Kenya’s expenditure in education, future sector cost scenarios and benefits of curriculum reform
© Oxford Policy Management 76
Kenya Union of Post Primary
Teachers
Teacher Union drawing membership mainly from the Secondary and
tertiary colleges
Dr Manu Chandaria Local
Philanthropists, Comcraft
One of the leading entrepreneurs and philanthropist in education
(supported KU and USIU)
National Treasury Central source of public expenditure data
MoEST Directorates (Basic,
DG, Secondary & Tertiary,
TVET, Policy)
At the heart of implementation, and members of the Technical
Committee on Curriculum Reform.
National Assembly
(Education Committee)
The National Assembly shall finally approve any approved changes to
the curriculum. The Law requires that the Chair of the Education
Committee shall submit the bill for parliamentary approval.
National Council for Persons
with Disabilities (NCPWD)
This is a statutory organ that ensures that disability mainstreaming is
realised in public service provision. It’s a requirement that NCPWD is
consulted when legislating and formulating any policy agenda.
National Steering Committee
On Curriculum Reforms
Charged by the President with overseeing and steering the curriculum
reform process
Research Triangle
International (RTI)
RTI is jointly implementing the Tayari & Tusome national programmes
with the MoEST.
School of Education,
Kenyatta University
Largest teacher training University in Kenya, the Dean of which is a
well-known educational researcher and member of the Steering
Committee.
Senate
As a matter that touches on devolution, the Senate Committee must
scrutinise the proposed changes and pass them before the National
Assembly finally ratifies them. If either house of parliament rejects the
proposals, the matter shall proceed to the Joint Mediation Committee.
Teachers Service
Commission (TSC)
The body charged with recruiting and deploying teachers, and holding
information on the salary bill.
UNICEF
Education sector development partner, supporting the curriculum
reform process including the needs assessment (complete) and this
assignment
USAID Education sector development partner and previous chair of the
Education Development Partners Group
Vision 2030 Delivery
Secretariat
Vision 2030 is one of the critical development pillars of Kenya. The
Secretariat is charged with ensuring that all development plans are in
tandem with the Vision.
World Bank Education sector development partner, who worked on sector
modelling for the GPE application