Analysis of Impediments to Fair Housing Choice Hampton Roads ...

Analysis of Impediments to
Fair Housing Choice
May 12, 2010 Lexington County Community Development Department 212 South Lake Drive Lexington, South Carolina 29072 (803) 785-8121 www.lex-co.com Prepared by Training & Development Associates, Inc. in cooperation with the Lexington County Community Development Department

i
CONTENTS
CONTENTS ........................................................................................................................................ i
SECTION I: INTRODUCTION ............................................................................................................. 3
What is Fair Housing? ................................................................................................................. 3
What is an Analysis of Impediments to Fair Housing? ............................................................... 3
Methodology ............................................................................................................................... 4
SECTION II: DEMOGRAPHIC AND ECONOMIC OVERVIEW .............................................................. 5
Overview ..................................................................................................................................... 5
General Market Conditions ......................................................................................................... 6
Housing Supply and Demand .................................................................................................... 11
Housing Needs .......................................................................................................................... 18
SECTION III: EVALUATION OF FAIR HOUSING STATUS .................................................................. 24
Complaints and Compliance Reviews ....................................................................................... 24
SECTION IV: PUBLIC SECTOR ANALYSIS ......................................................................................... 26
Overview ................................................................................................................................... 26
Federal and State Grant and Loan Programs ............................................................................ 29
Employment, Housing and Transportation Linkage ................................................................. 36
Property Tax Policies ................................................................................................................. 38
Zoning and Site Selection .......................................................................................................... 40
Building and Housing Codes.................................................................................................... 422
Land Development Regulations ................................................................................................ 43

Lexington County, South Carolina 2010 Analysis of Impediments to Fair Housing Choice
ii
Permit Fees ............................................................................................................................. 433
Planning Commission, Board of Zoning Appeals and the Building Code Board of Appeals ..... 44
Water and Sewer ...................................................................................................................... 45
Wastewater ............................................................................................................................... 45
Health Care Facilities................................................................................................................. 46
SECTION V: PRIVATE SECTOR ANALYSIS ....................................................................................... 48
Overview ................................................................................................................................... 48
The Mortgage Market ............................................................................................................... 48
Foreclosures Issues ................................................................................................................... 51
Alternative Lending Sources ..................................................................................................... 53
Homeowners Insurance ............................................................................................................ 54
Advertising ................................................................................................................................ 55
SECTION VI: CONCLUSIONS AND RECOMMENDATIONS .............................................................. 56
1. Limited Affordable Housing .................................................................................................. 56
2. Lack of Awareness Concerning Discrimination and Fair Housing ......................................... 56
3. Limited Housing Options for Homeless and Special Needs Populations .............................. 57
4. Insufficient Energy Efficiency ................................................................................................ 57
5. Limited Public Transportation ............................................................................................... 57
6. Excessive Loan Denials .......................................................................................................... 58
7. Lack of Education .................................................................................................................. 58

Lexington County, South Carolina 2010 Analysis of Impediments to Fair Housing Choice
3
SECTION I: INTRODUCTION
What is Fair Housing?
Fair Housing is the right of individuals to obtain the housing of their choice, free from
discrimination based on race, color, religion, sex, disability,1 familial status,2 or national origin.
This right is assured by the Federal Fair Housing Act, as amended, and other legislation which
makes it unlawful to discriminate in the sale, rental, financing, and insuring of housing.
Under the Fair Housing Act an aggrieved person may, not later than one year after an alleged
discriminatory housing practice has occurred, file a complaint directly with the U.S. Department
of Housing and Urban Development (HUD), or a State or local agency enforcing laws that are
“substantially equivalent” to the Fair Housing Act. Upon the filing of such a complaint, HUD
has the responsibility to serve notice of the complaint and conduct an investigation into the
alleged discriminatory housing practice. The Fair Housing Act also enables aggrieved parties to
pursue redress through the courts, without limit on the recovery of damages and attorney’s fees.
What is an Analysis of Impediments to Fair Housing?
HUD requires all governing authorities that are required to prepare a Consolidated Plan in order
to receive HUD funds to certify that they will “affirmatively further fair housing” within their
jurisdictions. This requirement is codified, for local jurisdictions, in the Consolidated Plan
requirements under 24 CFR 91.225. Affirmatively furthering fair housing may be grouped into
three categories:
Intent – The obligation to avoid policies, customs, practices, or processes whose intent or purpose is to impede, infringe, or deny the exercise of fair housing rights by persons protected under the Act.
Effect – The obligation to avoid policies, customs, practices, or processes whose effect or impact is to impede, infringe, or deny the exercise of Fair Housing rights by persons protected under the Act.
Affirmative Duties – The Act imposes a fiduciary responsibility upon public agencies to anticipate policies, customs, practices, or processes that previously, currently, or may potentially impede, infringe, or deny the exercise of fair housing rights by persons protected under the Act.
1 Under the Fair Housing Act, a person with a disability has a physical or mental impairment that substantially limits one or more major life activities; has a record of such impairment; or is regarded
as having such an impairment. This does not include current, illegal use of, or addiction to, a controlled substance. 2 The protected class of “familial status” protects households with children under age 18. These protections also apply to any person who is or plans to become pregnant. Note, familial status is
defined in terms of the presence or expected presence of children and does not include marital status or sexual orientation.

Lexington County, South Carolina 2010 Analysis of Impediments to Fair Housing Choice
4
The first two obligations pertain to public agency operations and administration, including those
of employees and agents, while the third obligation extends to private as well as public sector
activity.
Methodology
This report was prepared on behalf of Lexington County to consider the common fair housing
issues present in the County. Since housing market activity crosses all jurisdictions, the analysis
provides an opportunity to identify opportunities for collaboration and coordination among the
communities within Lexington County.
The information presented is intended to assist the County to evaluate and update fair housing
issues presented in the previous Analysis of Impediments to Fair Housing Choice (AI) dated
September 2001. This report was prepared by Training and Development Associates and
involved data collection and analysis from a variety of sources, including:
Demographic data available through the U.S. Census Bureau, as well as descriptive data pertaining to the housing market and trends in real estate over the past ten years.
Mortgage lending trends through the analysis of data available through the Home Mortgage Disclosure Act (HMDA). Enacted by Congress in 1975 and implemented by the Federal Reserve Board's Regulation C, HMDA requires lending institutions to report public loan data. Using the loan data submitted by these financial institutions, the Federal Financial Institutions Examination Council (FFIEC) creates aggregate and disclosure reports for each metropolitan area (MA) that are available to the public at central data depositories located in each MA.
Source documents, including the AI conducted previously by Lexington County.
Anecdotal information collected from research and/ or discussions with local stakeholders.
Locally-generated reports and other relevant data pertaining to the Lexington County housing market, patterns, and local economy.
A review of the information available on predatory lending.

Lexington County, South Carolina 2010 Analysis of Impediments to Fair Housing Choice
5
SECTION II: DEMOGRAPHIC AND ECONOMIC OVERVIEW
Overview Comprised only of a handful of small South Carolina frontier settlements in the early 1700s, Lexington County entered the 21st Century as the state's second fastest growing county. Major travel routes—the Congaree River, the Charleston to Augusta Railroad, and various trade routes—were instrumental in the area's early development. These same factors fuel Lexington County's growth today. Located in the Columbia Metropolitan Statistical Area (MSA), the County contains a portion of the state's capital city of Columbia, two interstate highways (I-20 and I-26), and Lake Murray, one of South Carolina's most popular recreational lakes. Lexington's strategic location in the center of the state, its accessibility to major transportation networks, and its natural and recreational amenities have combined to fuel the County's sustained residential, commercial and economic growth in recent decades. Figure 1 depicts the location of the County within the state and the municipalities, communities and major features such as interstates within Lexington County.
Figure 1. Lexington County Location Map

Lexington County, South Carolina 2010 Analysis of Impediments to Fair Housing Choice
6
General Market Conditions Socio-economic data provide a necessary foundation for effective planning efforts and help local decision-makers and service providers develop a clear picture of the human characteristics of the community. Information such as the following, along with other related factors, are instrumental in guiding the development of relevant policies, programs, and services to meet the need of low-income and special needs populations:
Number of residents, along with their race, age composition, and family status
Income and employment data
Health and public safety statistics
Household characteristics
Information on educational attainment
Population
In 2000 Lexington County's population was 216,014 and by 2009 it had risen to 245,856. From 1990 to 2000 Lexington County's population increased by 28.9 percent (an increase of 48,403 people), and by 2009 by another 13.8 percent (an increase of 29,105 people). Figure 2 illustrates the population distribution within the County. The more rural areas of the County in the southeast, west, and southwest are less populated. The highest population concentrations occur in the eastern portion of the County nearest the City of Columbia and along the Calhoun County border. The tracts in and surrounding the Town of Lexington, the Red Bank area located south of I-20, and areas to the west of the cities of Cayce and West Columbia and the town of Springdale, have densities that indicate a transition to suburban development.

Lexington County, South Carolina 2010 Analysis of Impediments to Fair Housing Choice
7
Figure 2. Lexington County Population (2009)
Table 1. Population General Demographics3
Description 1990 Census 2000 Census 2004 Estimate 2009 Projection
Percent Change
1990 to 2000
2004 to 2009
Total Population 167,501 216,014 229,751 245,856 29.00% 7.00%
Total Households 61,592 83,240 92,730 103,895 35.10% 12.00%
Gender
Male 81,613 48.70% 104,977 48.60% 111,755 48.60% 119,739 48.70% 28.60% 7.10%
Female 85,888 51.30% 111,037 51.40% 117,996 51.40% 126,117 51.30% 29.30% 6.90%
Age of Population
The County has experienced a general aging of its resident population with the population over the age of 65 increasing significantly more rapidly than the rate of increase of the population as a whole. This resulted in the median age of the total population increasing from 37.5 in 2004 to 38.9 in 2009.
3 Data obtained from the Central Midlands Council of Governments and are the most recent available.

Lexington County, South Carolina 2010 Analysis of Impediments to Fair Housing Choice
8
Table 2. Population by Age4
Description 1990 Census 2000 Census 2004 Estimate 2009 Projection
Percent Change
1990 to 2000
2004 to 2009
0 to 4 12,166 7.30% 14,762 6.80% 14,814 6.50% 15,447 6.30% 21.30% 4.30%
5 to 14 24,477 14.60% 32,246 14.90% 30,839 13.40% 31,178 12.70% 31.70% 1.10%
15 to 19 12,715 7.60% 14,495 6.70% 15,079 6.60% 16,536 6.70% 14.00% 9.70%
20 to 24 11,845 7.10% 12,684 5.90% 14,827 6.50% 15,719 6.40% 7.10% 6.00%
25 to 34 29,778 17.80% 31,137 14.40% 30,818 13.40% 30,841 12.50% 4.60% 0.10%
35 to 44 28,731 17.20% 37,197 17.20% 36,659 16.00% 35,385 14.40% 29.50% -3.50%
45 to 54 19,611 11.70% 31,828 14.70% 35,712 15.50% 38,645 15.70% 62.30% 8.20%
55 to 64 13,300 7.90% 19,676 9.10% 25,478 11.10% 31,419 12.80% 47.90% 23.30%
65 to 74 9,579 5.70% 12,225 5.70% 14,266 6.20% 18,125 7.40% 27.60% 27.10%
75 to 84 4,221 2.50% 7,352 3.40% 8,132 3.50% 9,167 3.70% 74.20% 12.70%
85+ 1,083 0.70% 2,412 1.10% 3,127 1.40% 3,394 1.40% 122.70% 8.50%
Median Age
Total Population 32.6 35.8 37.5 38.9 9.50% 4.00%
Minority Composition
Lexington County continues to become slightly more diverse with increasing black and Hispanic minority populations. Black population increased by an additional 9.1 percent between 2004 and 2009, and Hispanic population by 27.5 percent.
Table 3. Population by Race/Ethnicity5
Description 1990 Census 2000 Census 2004 Estimate 2009 Projection
Percent Change
1990 to 2000
2004 to 2009
White 147,356 88.00% 181,844 84.20% 192,875 84.00% 205,795 83.70% 23.40% 6.70%
Black 18,437 11.00% 27,274 12.60% 29,565 12.90% 32,268 13.10% 47.90% 9.10%
American Indian or Alaska Native
330 0.20% 725 0.30% 771 0.30% 825 0.30% 119.70% 7.00%
Asian 1,010 0.60% 2,342 1.10% 2,480 1.10% 2,638 1.10% 131.90% 6.40%
Some Other Race 368 0.20% 1,706 0.80% 1,808 0.80% 1,926 0.80% 363.60% 6.50%
Two or More Races
2,123 1.00% 2,252 1.00% 2,404 1.00% 6.70%
Ethnicity
Hispanic Ethnicity 1,302 0.80% 4,146 1.90% 5,244 2.30% 6,686 2.70% 218.40% 27.50%
Not Hispanic or Latino
166,199 99.20% 211,868 98.10% 224,507 97.70% 239,170 97.30% 27.50% 6.50%
4 Data obtained from the Central Midlands Council of Governments and are the most recent available.
5 Data obtained from the Central Midlands Council of Governments and are the most recent available.

Lexington County, South Carolina 2010 Analysis of Impediments to Fair Housing Choice
9
Income
The County has realized a slight improvement in the general wealth of the population. An increasing number of households raised their income levels, most likely as a result of the general improvement in economic conditions among the residents of the midlands region of the state around the capital of Columbia during the early portion of the period 2004 to 2009.
Table 4. Households by Income6
Description 1990 Census 2000 Census 2004 Estimate 2009 Projection
Percent Change
1990 to 2000
2004 to 2009
$0 - $15,000 11,305 18.40% 10,431 12.50% 11,041 11.90% 11,595 11.20% -7.70% 5.00%
$15,000 - $24,999 10,403 16.90% 10,582 12.70% 10,661 11.50% 10,057 9.70% 1.70% -5.70%
$25,000 - $34,999 11,179 18.20% 10,755 12.90% 11,038 11.90% 11,625 11.20% -3.80% 5.30%
$35,000 - $49,999 13,114 21.30% 14,578 17.50% 15,551 16.80% 15,312 14.70% 11.20% -1.50%
$50,000 - $74,999 10,849 17.60% 18,426 22.10% 20,082 21.70% 21,316 20.50% 219.20% 6.10%
$75,000 - $99,999 2,904 4.70% 10,239 12.30% 12,705 13.70% 15,855 15.30% 252.60% 24.80%
$100,000 - $149,999 1,324 2.10% 5,954 7.20% 8,582 9.30% 13,217 12.70% 349.70% 54.00%
$150,000 and Over 498 0.80% 2,275 2.70% 3,070 3.30% 4,918 4.70% 356.80% 60.20%
Average Household Income
$38,332 $54,131 $58,230 $58,509 41.20% 0.50%
Median household Income
$32,918 $44,705 $47,991 $53,329 35.80% 11.10%
Per Capita Income $14,156 $20,859 $23,502 $24,899 47.40% 5.90%
Employment and Business
The trend of increasing incomes was supported by a steady rate of employment of around 96 percent of the population with more than 70 percent of the population over the age of 16 in the labor force through 2008.
6 Data obtained from the Central Midlands Council of Governments and are the most recent available.

Lexington County, South Carolina 2010 Analysis of Impediments to Fair Housing Choice
10
Table 5. Employment and Business7
Description 1990 Census 2000 Census 2008 Estimate 2013 Projection
Change
1990-2000
2008-2013
Population Age 16 or Older
128,368 165,839 195,007 212,827 29.20% 9.10%
In Labor Force 93,354 72.70% 115,218 69.50% 136,857 70.20% 149,239 70.10% 23.40% 9.00%
Employed 89,499 95.90% 110,429 95.80% 131,285 95.90% 143,126 95.90% 23.40% 9.00%
Unemployed 3,450 3.70% 4,279 3.70% 5,167 3.80% 5,666 3.80% 24.00% 9.70%
In Armed Forces 386 0.30% 510 0.40% 405 0.30% 447 0.30% 32.10% 10.40%
Not in Labor Force 35,014 27.30% 50,621 30.50% 58,150 29.80% 63,588 29.90% 44.60% 9.40%
Number of Employees (Daytime Population)
104,599
Number of Establishments
9,110
Employees in Blue Collar Occupations
40,009 36.20%
Employees in White Collar Occupations
70,420 63.80%
Housing Units
With increasing incomes and a steady rate of employment, the housing stock also continued to grow throughout the past decade.
Table 6. Housing Units8
Description 1990 Census 2000 Census 2007 Estimate 2012 Projection
Change
1990-2000
2007-2012
Owner Occupied 46,869 69.40% 64,265 70.60% 67,821 65.80% 70,218 63.00% 37.10% 3.50%
Renter Occupied 14,723 21.80% 18,975 20.90% 25,167 24.40% 29,291 26.30% 28.90% 16.40%
Vacant 5,918 8.80% 7,738 8.50% 10,051 9.80% 11,924 10.70% 30.80% 18.60%
Total 67,510 90,978 103,039 111,433 34.80% 8.10%
Education
Reflecting the increase among the entry level worker age group and the combination of modest increases among the 25 to 34 and 45 to 54 year age groups and absolute losses among the 35 to 44 year age groups (all prime child rearing age groups) the County is expecting substantial decreases in their school-age populations. The kindergarten through grade 8 school age population is projected to decrease by more than 29 percent and the grades 9 through 12 school age population by more than 11 percent.
7 Data obtained from the Central Midlands Council of Governments and are the most recent available. Because
data for 2009 are not consistently available, in some instances 2007-2012 or 2008-2013 data are used. 8 Data obtained from the Central Midlands Council of Governments and are the most recent available. Because
data for 2009 are not consistently available, in some instances 2007-2012 or 2008-2013 data are used.

Lexington County, South Carolina 2010 Analysis of Impediments to Fair Housing Choice
11
Table 7. Education Attainment9
Description 1990 Census 2000 Census 2007 Estimate 2012 Projection
Change
1990-2000
2007-2012
Population Age 25 or Older
106,303 141,827 162,437 175,697 33.40% 8.20%
Grade K-8 8,976 8.40% 6,466 4.60% 4,962 3.10% 3,517 2.00% -28.00% -29.10%
Grade 9-12 15,188 14.30% 16,566 11.70% 14,781 9.10% 13,091 7.50% 9.10% -11.40%
High School Graduate 32,207 30.30% 41,774 29.50% 48,239 29.70% 52,115 29.70% 29.70% 8.00%
Some College, No Degree
19,128 18.00% 29,604 20.90% 31,172 19.20% 31,543 18.00% 54.80% 1.20%
Associates Degree 8,535 8.00% 11,444 8.10% 18,218 11.20% 23,354 13.30% 34.10% 28.20%
Bachelor's Degree 14,920 14.00% 24,128 17.00% 29,759 18.30% 33,500 19.10% 61.70% 12.60%
Graduate Degree 7,355 6.90% 10,780 7.60% 15,306 9.40% 18,577 10.60% 46.60% 21.40%
No Schooling Completed
1,065 0.80%
Housing Supply and Demand
Favorable market conditions exist in the Lexington submarket of the larger Columbia MSA and support the continued limited production of approximately 400 new rental units from 2004 through 2007. Through the 1990s, about 1,300 single-family unit permits were issued a year in the Lexington submarket. In the Lexington submarket, as of mid-2004, the new developments are concentrated near Lake Murray. Prices in new developments range from approximately $70,000 for a starter home to more than $700,000 for a custom luxury home. Although some speculative homes are being built, most homebuilders delay pulling a building permit until a sales contract is executed. From 1990 through 1999, approximately 2,100 units (single family and multi-family) were permitted in the Lexington submarket. More than 93 percent of the permits issued were for rental units in projects consisting of five or more units per building. About three percent of the permits were for duplexes, which tend to be owner-occupied units. The remaining four percent of the permits were for triplexes and quadruplexes, which are typically rental units. In the Lexington submarket, the years 1993 through 1995 experienced the most activity when nearly 50 percent of the multi-family units were permitted. Even as the economy began to contract in 2000 and 2001, very strong multi-family permit activity persisted in some submarkets of the Columbia MSA, of which Lexington is a part. However, activity fell off sharply in the Lexington submarket in 2000, and only 79 multi-family units were permitted. In 2001, the number of multi-family units picked up dramatically with 420 units permitted. Since 2001, activity in the Lexington submarket decreased significantly.
9 Data obtained from the Central Midlands Council of Governments and are the most recent available. Because
data for 2009 are not consistently available, in some instances 2007-2012 or 2008-2013 data are used.

Lexington County, South Carolina 2010 Analysis of Impediments to Fair Housing Choice
12
Approximately 390 were permitted from 2002 to2004, less than the total number of permits issued in 2001.10
Housing Units
Lexington County has been experiencing a steady growth in the number of housing units and this growth is shown in the figure below. During the decade of the 2000s, the overall inventory of housing units increased by 16.7 percent. Between 1990 and 2000, the number of housing units grew to 106,582 total units. Building permit data also reflects a rapid development. The County issued permits for 16,372 new housing units between 2000 and 2008. Yet the slump in the housing market, starting the year 2007 and continuing through 2009, has led to a decrease in residential building permits (21.8 percent drop in building permits between 2006 and 2007, and 38.4 percent between 2007 and 2008).
Figure 4. Residential Building Permit Activity
Housing Mix
The figure below depicts the total mix of housing structures by the classifications of single family, multi-family and mobile homes/other. Compared to the State, Lexington County has a slightly larger percentage of single-family units and mobile home units, but a smaller percentage of multi-family units.
10
Source: Analysis of the Columbia-Lexington, South Carolina Housing Market as of August 1, 2004; U.S. Department of Housing and Urban Development, Policy Development and Research.
Figure 3. Housing Growth

Lexington County, South Carolina 2010 Analysis of Impediments to Fair Housing Choice
13
Figure 5. Units in Structures
Age of Housing
Lexington County has had two distinctly strong periods of residential growth. First in the decade of the 1970s, some 21,924 units were built. Then in the 1990s, 25,618 units were constructed. However, the first decade of the 21st century has seen a slowing of activity. In the first five years of the decade, a 9.4 percent decrease was realized compared to a similar period in the previous decade. However, the period from 2005 to 2008 has seen a marked and steep drop off in housing development activity.
Figure 6. Age of Housing
Occupancy
Lexington County’s vacancy rate in 2007 was 7.9 percent, a full percentage point higher than in 2006. The state of South Carolina’s rate of 15.8 percent in 2007 was 0.4 percent higher in 2006. When the various separate communities in the County are compared to one another, a considerable range becomes evident. The various municipalities within Lexington County together have a total of more than 2,600 vacant units for an overall vacancy rate of 6.8 percent. This ranges from a low of 3.1 percent in Pine Ridge to a high of 14.5 percent in Swansea.

Lexington County, South Carolina 2010 Analysis of Impediments to Fair Housing Choice
14
High vacancy rates typically suggest an excess of housing units relative to demand. The proximity of eastern Lexington County to the vigorous Columbia job market is responsible for the generally lower vacancy rates in that part of the County.
Figure 7. Vacancy Rates by Census Tract
Tenure
The 2000 homeownership rate for Lexington County was 77.2 percent, which was higher than both the statewide average of 72.2 percent and the nationwide rate of 66.2 percent. However, by 2006 that rate had slipped to 75.2 percent in the County, following a statewide trend that had lowered South Carolina’s rate to 70.3 percent. The heaviest concentrations of home owners are in the Cayce, Springdale, Pine Ridge, Swansea, and Gaston areas, as well as in the areas adjacent to Lake Murray. Other areas exhibiting high rates of homeownership east of the town of Gilbert, south of Highway 1, west of State Highway 378, and bounded by Aiken County on the southwest. The areas west of the town of Lexington and the City of West Columbia have the lowest rate of homeownership.

Lexington County, South Carolina 2010 Analysis of Impediments to Fair Housing Choice
15
Figure 8. Homeownership Rates
Home Value
Lexington County had an owner-occupied dwelling median in 2000 of $106,300 published by the 2000 Census. This value is greater than the State of South Carolina 2000 median owner-occupied dwelling value of $94,900. The residential housing values in 2006 in Lexington County are greater than the Census values accounted for in the year 2000. The values have increased by $19,300 or 18.2 percent to $125,600 by 2006. In 2008 more than 61 percent of all housing in Lexington County is valued at $150,000 or less. The census reported 101,592 homes in the year 2006 meaning that this county has gone through a high level of growth, adding a sum of 10,226 homes since 2000, or 11.2 percent.11
Figure 9. Housing Units by Value
11
http://www.ecanned.com/V2/lexington-county-south-carolina/2006-housing-report-for-lexington-county-south-carolina.html

Lexington County, South Carolina 2010 Analysis of Impediments to Fair Housing Choice
16
Cost of Housing Stock
The median monthly housing costs for mortgaged owners was $1,126, for non-mortgaged owners $332, and for renters $685. Twenty-seven percent of owners with mortgages, 14 percent of owners without mortgages, and 39 percent of renters in Lexington County spent 30 percent or more of household income on housing.12
Local Housing Statistics
For towns within Lexington County, the following table provides a summary of local housing statistics.
Table 8. Summary Housing Statistics for Lexington County Towns
Cit
y
Occ
up
ied
Un
its
Vac
ant
Un
its
Occ
asio
nal
ly
Occ
up
ied
Per
cen
t O
ccu
pie
d
Per
cen
t V
acan
t
Ow
ner
Occ
up
ied
Ren
ter
Occ
up
ied
Per
cen
t O
wn
er
Occ
up
ied
Per
cen
t R
ente
r
Occ
up
ied
Ave
rag
e H
ou
seh
old
Siz
e (o
wn
ed)
Ave
rag
e H
ou
seh
old
Siz
e (r
ente
d)
Batesburg- Leesville 2,167 279 19 88.6% 11.4% 1,463 704 67.6% 32.4% 2.48 2.55
Cayce 5,133 384 16 93.1% 6.9% 3,364 1,769 65.6% 34.4% 2.32 2.44
Chapin 249 12 - 95.5% 4.5% 220 29 88.4% 11.6% 2.49 2.79
Gaston 484 48 3 91.0% 9.0% 399 85 82.5% 17.5% 2.69 2.72
Gilbert 181 14 - 92.9% 7.1% 150 31 82.9% 17.1% 2.76 2.77
Irmo 3,911 155 2 96.2% 3.8% 3,347 564 85.6% 14.4% 2.81 2.85
Lexington 3,644 381 9 90.6% 9.4% 2,591 1,053 71.2% 28.8% 2.68 2.08
Oak Grove 3,368 258 10 92.9% 7.1% 2,582 786 76.7% 23.3% 2.48 2.25
Pelion 192 19 1 91.0% 9.0% 169 23 88.1% 11.9% 2.69 2.74
Pine Ridge 606 20 1 96.9% 3.1% 518 88 85.5% 14.5% 2.66 2.47
Red Bank 3,281 217 5 93.8% 6.2% 2,767 514 84.4% 15.6% 2.72 2.47
Seven Oaks 6,633 346 11 95.1% 4.9% 4,046 2,587 61.0% 39.0% 2.47 2.17
Swansea 224 38 4 85.5% 14.5% 152 72 67.9% 32.1% 2.30 2.56
West Columbia 5,968 468 22 92.8% 7.2% 3,239 2,729 54.3% 45.7% 2.14 2.12
Total 36,041 2,639 103 93.2% 6.8% 25,007 11,034 69.4% 30.6%
Source: www.maps-n-stats.com/us_sc.html
Workforce Housing and Affordability
In Lexington County, the Fair Market Rent (FMR) for a two-bedroom apartment is $710. To afford this level of rent and utilities, without paying more than 30 percent of its income on housing, a household must earn $2,367 monthly or $28,400 annually. Assuming a 40-hour work week for 52 weeks per year, this income level translates into a Housing Wage of $13.65.
12
Source: American Community Survey, 2005-2007
Lexington County, South Carolina 2010 Analysis of Impediments to Fair Housing Choice
17
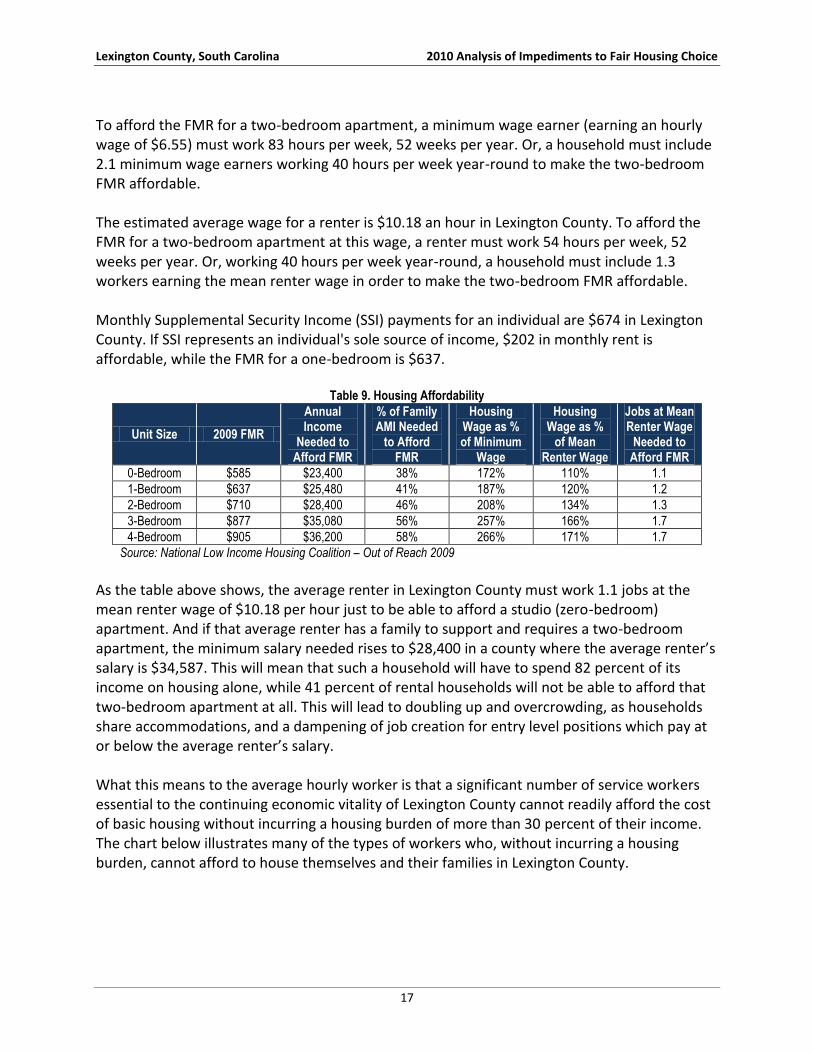
To afford the FMR for a two-bedroom apartment, a minimum wage earner (earning an hourly wage of $6.55) must work 83 hours per week, 52 weeks per year. Or, a household must include 2.1 minimum wage earners working 40 hours per week year-round to make the two-bedroom FMR affordable. The estimated average wage for a renter is $10.18 an hour in Lexington County. To afford the FMR for a two-bedroom apartment at this wage, a renter must work 54 hours per week, 52 weeks per year. Or, working 40 hours per week year-round, a household must include 1.3 workers earning the mean renter wage in order to make the two-bedroom FMR affordable. Monthly Supplemental Security Income (SSI) payments for an individual are $674 in Lexington County. If SSI represents an individual's sole source of income, $202 in monthly rent is affordable, while the FMR for a one-bedroom is $637.
Table 9. Housing Affordability
Unit Size 2009 FMR
Annual Income
Needed to Afford FMR
% of Family AMI Needed
to Afford FMR
Housing Wage as % of Minimum
Wage
Housing Wage as %
of Mean Renter Wage
Jobs at Mean Renter Wage
Needed to Afford FMR
0-Bedroom $585 $23,400 38% 172% 110% 1.1
1-Bedroom $637 $25,480 41% 187% 120% 1.2
2-Bedroom $710 $28,400 46% 208% 134% 1.3
3-Bedroom $877 $35,080 56% 257% 166% 1.7
4-Bedroom $905 $36,200 58% 266% 171% 1.7
Source: National Low Income Housing Coalition – Out of Reach 2009
As the table above shows, the average renter in Lexington County must work 1.1 jobs at the mean renter wage of $10.18 per hour just to be able to afford a studio (zero-bedroom) apartment. And if that average renter has a family to support and requires a two-bedroom apartment, the minimum salary needed rises to $28,400 in a county where the average renter’s salary is $34,587. This will mean that such a household will have to spend 82 percent of its income on housing alone, while 41 percent of rental households will not be able to afford that two-bedroom apartment at all. This will lead to doubling up and overcrowding, as households share accommodations, and a dampening of job creation for entry level positions which pay at or below the average renter’s salary. What this means to the average hourly worker is that a significant number of service workers essential to the continuing economic vitality of Lexington County cannot readily afford the cost of basic housing without incurring a housing burden of more than 30 percent of their income. The chart below illustrates many of the types of workers who, without incurring a housing burden, cannot afford to house themselves and their families in Lexington County.

Lexington County, South Carolina 2010 Analysis of Impediments to Fair Housing Choice
18
Figure 10. Rental Market
2008 Fair Market Rent:
1BR Unit $637 per month 2BR Unit $710 per month
©Copyright 2000-2009 Center for Housing Policy
Rental data are from HUD’s report on fair market rents for the year 2009 and are based on a survey or recently occupied units. The hourly wage needed to afford is the hourly wage that must be earned so that this rent does not exceed 30 percent of income, a standard measure of affordability. It is based on a concept developed by the National Low Income Housing Coalition.
Wage data are as of November, 2008 and were obtained from a propriety database of salary information by geographic location maintained by Salary.com.
Housing Needs
Renter Households
Nearly one-half (49.7 percent) of all renter households with incomes at or below 80 percent area median income experience at least one housing problem. This represents 5,743 households. Of this number 46.1 percent (5,336) have housing burdens more than or equal to 30 percent of their income and 2,516 (21.8 percent) have housing burdens that exceed 50 percent of their income. There are also 407 (3.5 percent) of the target rental households that have housing problems associated with substandard conditions alone.
Extremely Low-Income Renters
Among extremely low-income renters, large related households (i.e. those with five or more members) experience many more housing problems than other groups—82.3 percent experience housing problems, 73.9 percent pay 30 percent or more for housing, and 49.5

Lexington County, South Carolina 2010 Analysis of Impediments to Fair Housing Choice
19
percent pay 50 percent or more for housing. Extremely low-income elderly households experience less housing problems than other groups, with 53.5 percent encountering housing problems, 51.4 percent encountering a 30 percent or more cost-burdened and 37.2 percent encountering a 50 percent or more cost-burdened.
Very Low-Income Renters
Among very low-income renters, 67.3 percent of persons living alone experience housing problems. Among those renters that are 30 percent or more cost burdened, 66.9 percent are persons living alone and 51.2 percent are small related households. Small related households (i.e. those with two to four members) are less likely to be 50 percent or more cost burdened while elderly and individual and unrelated households (i.e. a person living alone or a householder who shares the home with nonrelatives) are more likely to pay 50 percent or more for housing.
Low- Income Renters
A higher percentage (40.3 percent) of large related households (i.e. those with five or more persons) experience one or more housing problems than other low-income groups. Elderly households are more likely to be cost burdened—nearly one-third spend more than 30 percent of income for housing expenses. They are more likely to be severely cost burdened, as 15.0 percent spend more than half of their income on housing expenses. Of the individuals living alone, nearly one-quarter are cost burdened by 30 percent or more.
Moderate- to Upper-Income Renters
Some 7.4 percent of moderate- to upper-income renter households (546 households) are experiencing some sort of housing problem. Nearly 3 percent of them (200 households) are experiencing a cost burden of more than 30 percent and 30 households (0.04 percent) are experiencing a cost burden of more than 50 percent. Some 141 small elderly households (20.4 percent) and 139 large related households (25.3 percent) are the most seriously impacts groups among these renters. Most of the small elderly households’ problems are associated with cost burdens exceeding 30 percent, while the large related households’ problems are exclusively associated with substandard living condition (i.e. overcrowding or incomplete plumbing or kitchen facilities).
Owner Households
More than 52 percent (7,940) of all owner households with incomes at or below 80 percent of area median income experience a housing problem. The percentage of extremely low-income owners who experience a cost burden over 30 percent is 50.1 percent (7,630). Those who experience a cost burden over 50 percent are 28.5 percent (4,337) of this ownership group.

Lexington County, South Carolina 2010 Analysis of Impediments to Fair Housing Choice
20
However, a relative small percentage, 2.0 percent (310), of this group of owner households are experiencing housing problems strictly associated with substandard physical conditions.
Extremely Low-Income Owners
Among extremely low-income homeowners, 96.4 percent of large related households experience the greatest number of housing problems (i.e. incomplete plumbing or kitchen facilities, overcrowding or cost burden). They also experience the greatest incidence of cost burden over 30 percent, as well as over 50 percent. Just 29.3 percent of elderly households experience cost burden over 50 percent, while more than one-half of the large and small related homeowner households pay 50 percent or more of their income to cover housing expenses, with 49.5 percent of individual owners living alone paying more than 50 percent.
Very Low-Income Owners
More than 83 percent of large related households experience some housing problems. With the exception of elderly households (of which 26.8 percent are 30 percent cost burdened), nearly one-half (45.7 percent) of all very low-income owners are 30 percent or more cost burdened. And 40.5 percent, individuals and unrelated households have the highest incidence of spending more than 50 percent of their income for housing expenses.
Low-Income Owners
Non-elderly owners are much more likely than elderly owners to experience one or more housing problems, with large related households, at 51.5 percent, encountering the most problems. More than 40 percent of individual and unrelated households experience a cost burden of more than 30 percent but only 11 percent experience a cost burden of more than 50 percent. Large related and elderly households are least likely to be 50 percent or more costs burdened. Overall, owners are more likely than renters to experience a cost burden.
Moderate- to Upper-Income Owners
Non-elderly owners are more likely than elderly owners to experience housing problems in this income grouping, just as among the low-income owners. Large related households, at 14.2 percent, are encountering the most problems and 15.2 percent of individuals and unrelated households are experiencing housing problems. But in all cases where households in this group are experiencing problems, those tend to be associated with a housing cost burden of more than 30 percent.

Lexington County, South Carolina 2010 Analysis of Impediments to Fair Housing Choice
21
Table 10. Low-Income Households in Lexington County (2000) 13
(HUD Table 1C)
Household by Type, Income, & Housing
Problem
Renters Owners
To
tal
Ho
use
ho
lds
Eld
erly
1 &
2
Mem
ber
Ho
use
ho
lds
Sm
all R
elat
ed
(2 t
o 4
)
Lar
ge
Rel
ated
(5 o
r M
ore
)
All
Oth
er
Ho
use
ho
lds
To
tal R
ente
rs
Eld
erly
1 &
2
Mem
ber
Ho
use
ho
lds
Sm
all R
elat
ed
(2 t
o 4
)
Lar
ge
Rel
ated
(5 o
r M
ore
)
All
Oth
er
Ho
use
ho
lds
To
tal O
wn
ers
Household Income of 50% or Less of MFI
1,073 2,828 502 2,518 6,921 4,417 3,138 622 1,604 9,781 16,702
Household Income of 30% or Less of MFI
699 1,394 283 1,434 3,810 2,013 1,219 258 839 4,329 8,139
% with any housing problems 53.5 75.3 82.3 72.8 70.9 54.3 70.5 98.4 64.2 63.4 66.9
% Cost Burden Over 30% 51.4 73.8 73.9 71.8 69 53.1 69.3 84.9 61.9 61.3 64.9
% Cost Burden Over 50% 37.2 51.9 49.5 59.6 51.9 29.3 58.7 69.8 49.5 43.9 47.6
Household Income of 31% to 50% MFI
374 1,434 219 1,084 3,111 2,404 1,919 364 765 5,452 8,563
% with any housing problems 41.2 53.6 56.6 67.3 57.1 27 60.1 83.5 64.1 47.6 51.1
% Cost Burden Over 30% 41.2 51.2 31.5 66.9 54.1 26.8 59.1 64.3 62.1 45.7 48.7
% Cost Burden Over 50% 14.4 8 1.8 20.3 12.6 12.5 28.7 16.2 40.5 22.4 18.8
Household Income of 51% to 80% MFI
400 1,858 444 1,945 4,647 2,770 4,488 970 1,910 10,138 14,785
% with any housing problems 32.5 24.9 40.3 25.4 27.3 16.6 44.4 51.5 43.5 37.3 34.2
% Cost Burden Over 30% 32.5 20.3 11 24.2 22.1 15.7 41.8 40.7 43.5 34.9 30.9
% Cost Burden Over 50% 15 2.1 0 2.3 3.1 2.9 10.2 5.2 11 7.9 6.4
13
U.S. Department of Housing and Urban Development, the Comprehensive Housing Affordability (CHAS) Database.

Lexington County, South Carolina Analysis of Impediments to Fair Housing Choice
22
Disproportionate Needs
Information available from the 2000 census has been analyzed to identify the extent to which racial or ethnic groups may have disproportionately greater needs compared to the housing needs of all groups in Lexington County. The U.S. Department of Housing and Urban development considers that a “disproportionately greater need exists when the percentage of persons in a category is at least 10 percentage points higher than the percentage of persons in a category as a whole.” The table below illustrates that when white households are used as the standard from which disproportion is measured, the following conclusions can be drawn:
Black rental family households, in general but not in any one category of income are disproportionately needy;
Hispanic rental family households, in all categories, are disproportionately needy;
Black owner family households with incomes of 50 percent or more of the median are disproportionately needy; and
Hispanic owner family households with incomes of 30 percent or less of the median and 80 percent or more of the median are disproportionately needy.
Table 11. Households with Any Housing Problems
Household
Percent of Median Family Income
30% or Less
30 to 50% 50 to 80% 80% or More
All Households
Renter Family Households
White 75.3% 50.9% 27.7% 4.5% 25.4%
Black 78.3% 50.0% 23.2% 12.2% 41.6%
Hispanic 68.4% 100.0% 93.8% 45.2% 68.6%
All Households 70.9% 57.1% 27.3% 7.4% 33.2%
Owner Family Households
White 74.7% 64.1% 43.3% 9.0% 17.6%
Black 73.2% 64.4% 55.1% 23.5% 32.6%
Hispanic 91.8% 62.5% 8.2% 25.0% 34.0%
All Households 63.4% 47.6% 37.3% 9.8% 20.9%
Source: CHAS Data Book
When using all households as the standard from which disproportion is measured, the following conclusions can be drawn:
Hispanic renter households at all income levels above 30 percent of the median are disproportionately needy;
Lexington County, South Carolina Analysis of Impediments to Fair Housing Choice
23
Black owner households at all income levels are disproportionately needy; and
Hispanic owner households with incomes of 30 percent or less of the median, 30 to 50 percent of the median, and 80 percent or more of the median are disproportionately needy.
In addition to HUD’s definition of disproportionate needs, it is important to draw attention to some of the lending practices and foreclosure data identified in the County.
Lexington County, South Carolina Analysis of Impediments to Fair Housing Choice
24
SECTION III: EVALUATION OF FAIR HOUSING STATUS
Complaints and Compliance Reviews
Under the South Carolina Fair Housing Law enacted in 1989, it is unlawful to refuse to sell, rent, or finance a dwelling on the basis of race, color, religion, sex, familial status, national origin, or handicap. Apartments, houses, mobile homes, and vacant lots to be used for housing are covered by the Fair Housing Law. With few exceptions anyone who has control over residential property and real estate financing must adhere to these regulations. This includes rental managers, property owners, real estate agents, landlords, banks, developers, builders, and individual homeowners who are selling or renting their property.
The South Carolina Human Affairs Commission (SCHAC) administers the Fair Housing Law and has the authority to investigate complaints, subpoena witnesses, issue orders, hold hearings and enforce findings. The jurisdiction of the SCHAC includes both the public and private sectors. The SCHAC is composed of fifteen members, with two members from each congressional district appointed by the Governor, with the advice and consent of the Senate, and three members at-large appointed by the Governor. Members serve a term of three years, with no more than two consecutive terms.
To register a complaint with the SCHAC, the aggrieved party must officially file the complaint within 180 days after the date of the alleged discrimination. Within 10 days of the initial filing the Compliance staff of the Commission investigates the complaint and notifies the applicant of the validity of the complaint. If a violation has occurred, a formal complaint form is completed. During this process, every effort is made to mediate and resolve the problem. The primary mechanism used for mediation and resolution of complaints is the Mediation/Alternative Dispute Resolution effort. This effort is a voluntary process designed to facilitate case closure by bringing the parties in dispute together and reaching a mutually acceptable solution. An impartial party facilitates negotiations. It precludes the investigation process and usually results in both Respondent and Complainant emerging with a "win-win" solution to the problem.
Investigations must be completed within 100 days after the filing of a complaint. If the SCHAC determines that there are no reasonable grounds for the complaint, the complaint is dismissed. If the determination is that there are reasonable grounds for the complaint and settlement efforts are unsuccessful, one of the following options may be pursued:
Either party may elect to have the claim decided in a civil action. If this option is chosen the SCHAC must initiate and maintain a civil action on behalf of the aggrieved person within 30 days from the date of election.
If neither party chooses to elect a civil action, SCHAC refers the charge to the Chairman of the Commission to designate a panel of three members to sit and hear the complaint.

Lexington County, South Carolina Analysis of Impediments to Fair Housing Choice
25
The complainant may choose to sue the respondent in State court. If this option is chosen it is done at the expense of the participants, with no involvement by SCHAC.
As illustrated in table below, there have been relatively few fair housing complaints filed against entities in Lexington County in recent years. A total of 16 complaints have been filed since 2000. Of these complaints, ten allege racial discrimination and two allege discrimination based on multiple bases. Four of the complaints allege discrimination on the basis of gender.
Table 12. Fair Housing Complaints Filed (July 1, 2000 through June 30, 2009)
Complaint Type and Action
7/20
00-6
/200
1
7/20
01-6
/200
2
7/20
02-6
/200
3 7/20
03-
6/20
04
7/20
04-
6/20
05
7/20
05-
6/20
06
7/20
06-
6/20
07
7/20
07-6
/200
8
7/20
08-6
/200
9
Rac
e
Gen
der
Mu
ltip
le
Bas
es
Rac
e
Gen
der
Mu
ltip
le
Bas
es
Rac
e
Gen
der
Rac
e
Total filed by type 0 0 0 2 1 0 4 1 2 3 2 1 0 0
Resolution
Dismissed 0 0 0 2 0 0 1 0 0 0 0 1 0 0
No cause 0 0 0 0 1 0 3 0 2 1 1 0 0 0
Uncooperative 0 0 0 0 0 0 0 0 0 0 0 0 0 0
Conciliation 0 0 0 0 0 0 0 1 0 2 1 0 0 0
Total for year 0 0 0 3 7 5 1 0 0
Source: The South Carolina Human Affairs Commission
Four of the complaints filed during this five-year period were resolved through conciliation. Conciliation is reached when both parties come to a mutual understanding or when a settlement is negotiated. Eight of the complaints were determined by the Commission to have no cause. Four of the complaints were dismissed for lack of jurisdiction.

Lexington County, South Carolina Analysis of Impediments to Fair Housing Choice
26
SECTION IV: PUBLIC SECTOR ANALYSIS
Overview
Fair Housing is the right of individuals to obtain the housing of their choice, free from discrimination based on race, color, religion, sex, disability, familial status, or national origin. This right is assured by the Federal Fair Housing Acts of 1968 and 1988, as amended, which makes it unlawful to discriminate in the sale, rental, financing, and insuring of housing.
The Lexington County Analysis of Impediments discusses the results of recent analyses of impediments and the steps the County intends to take to implement policies that will prevent and eliminate housing discrimination in Lexington County.
State Perspective
The South Carolina Human Affairs Commission (SCHAC) enforces the State law against discrimination, which is considered substantially equivalent to the FHA. The South Carolina Fair Housing Law makes it illegal to discriminate in housing because of race, color, religion, sex, national origin, physical or mental handicaps, or familial status (families with children). The law applies to the sale, rental and financing of residential housing. Apartments, houses, mobile homes; and, even vacant lots to be used for housing, are covered by the Fair Housing Law. With a few exceptions anyone who has control over residential property and real estate financing must obey the law. This includes rental managers, property owners, real estate agents, landlords, banks, developers, builders, insurers, appraisers, and individual homeowners who are selling or renting their property.
Between January and April of 2008, South Carolina Department of Commerce conducted a survey to determine needs that exist regarding fair housing. The survey was distributed to jurisdictions that had previously received Community Development Block Grant (CDBG) funds. The purpose of the survey was to follow up on barriers previously identified in a study conducted in August of 1997 and updated in 2003. All recipients of CDBG funds are required, as a condition of receiving such funds, to take proactive steps “to affirmatively further fair housing.” HUD interprets those broad objectives to mean:
Promote fair housing choice for all persons
Provide opportunities for inclusive patterns of housing occupancy regardless of race, color, religion, sex, familial status, disability and national origin
Promote housing that is structurally accessible to, and usable by, all persons, particularly persons with disabilities
Foster compliance with the nondiscrimination provisions of the Fair Housing Act, defined as any actions, omissions, or decisions that restrict, or have the effect of
Lexington County, South Carolina Analysis of Impediments to Fair Housing Choice
27
restricting, the availability of housing choices, based on race, color, religion, sex, disability, familial status, or national origin.
The survey was distributed to a total of 134 different individuals representing local governments. A total of 48 survey responses were returned. Responders included locally elected officials, chief elected or executive officials, representatives of councils of government (COGs), and other related administrative staff.
Survey Results
38 percent of respondents stated there was no general understanding of the fair Housing Act by the general public.
40 percent of the respondents indicated that the general public was not aware of the role that the SC Human Affairs Commission plays in Fair Housing
61 percent of respondents had an established procedure in place to deal with fair housing issues.
77 percent of respondents reported that social service organizations are doing a competent job of making fair housing referrals.
61 percent of the respondents reported that a lack of pre‐housing counseling leaves both renters and sellers with insufficient understanding of the financial responsibilities that come with renting or buying a home.
83 percent of respondents indicated that realtors and public housing agencies include equal employment opportunity and/or fair housing language in their advertising for housing vacancies.
77 percent of the respondents reported that their community had passed a fair housing ordinance.
90 percent of respondents stated that a lack of job opportunities affected where one lives.
60 percent of respondents stated that there was a lack of affordable rental housing for low-income individuals making 50 percent of the median income or less. In addition, 52 percent of their responses indicate that both moderate-income individuals earning 80 percent of median income and those earning 120 percent of median income are also experiencing an inability to find affordable rental properties within their means.
52 percent of respondents stated that zoning laws or regulations restrict or limit manufactured housing, rental unit locations or group homes in their communities.

Lexington County, South Carolina Analysis of Impediments to Fair Housing Choice
28
58 percent of respondents indicated that their community had examined its building, zoning, and/or permitting requirements to eliminate those that restrict affordable housing.
75 percent of respondents cited the fact that a lack of transportation imposes additional restrictions on where a individual or family with a low to moderate income may live
48 percent of respondents indicated that builders and developers and 44 percent of property owners were not aware of Americans with Disabilities Act requirements that address basic housing needs for the disabled and elderly.
63 percent of respondents indicate that predatory lending is viewed as a fair housing impediment.
75 percent of respondents stated that their community would be willing to participate in a task force or study that addresses impediments to fair housing
Following is a list of impediments and commonly perceived barriers to fair housing identified by survey respondents.
Lack of Infrastructure
Lack of transportation to work
Lack of affordable rental and homeownership choices
Lack of funds for housing
Lack of housing counseling services
Lack of model tools and strategies to facilitate provision of affordable housing
Effects of predatory lending
Not In My Back Yard “NIMBY” Factor
Community perceptions

Lexington County, South Carolina Analysis of Impediments to Fair Housing Choice
29
Federal and State Grant and Loan Programs
Each year, the County of Lexington receives approximately $1.5 million in federal funds from the U. S. Department of Housing and Urban Development under the Community Development Block Grant (CDBG) program and approximately $650,000 under the HOME Investment Partnerships Program (HOME). In recent years, Lexington County has committed the following funding to projects:
FY2009-2010 projects were funded with $1.5 million from the County’s 2009 CDBG allocation, uncommitted CDBG funds from previous years, and $638,925 from its HOME allocation
FY2008-2009 projects were funded with $1.4 million from the County’s 2008 CDBG allocation, uncommitted CDBG funds from previous years, $750,000 from its HOME allocation, and $5,090 from its American Dream Downpayment Initiative allocation
FY2007-2008 projects were funded with $1.3 million from the County’s 2007 CDBG allocation, $71,610 of CDGB funds from prior years, and $89,558 in other funds
FT2006-2007 projects were funded with $1.0 million from the County’s 2006 CDBG allocation and uncommitted funds from previous years.
Community Development Block Grant (CDBG)
The County began receiving CDBG funds in 2000. The CDBG program is a flexible program that provides communities with resources to address a wide range of unique community development needs. Beginning in 1974, the CDBG program is one of the longest continuously run programs at HUD. The CDBG program provides annual grants on a formula basis to 1,209 general units of local government and States.
The CDBG program works to ensure decent affordable housing, to provide services to the most vulnerable in our communities, and to create jobs through the expansion and retention of businesses. CDBG is an important tool that helps local governments to tackle serious challenges facing their communities. The CDBG program has made a difference in the lives of millions of people and their communities across the Nation.
The annual CDBG appropriation is allocated between States and local jurisdictions called "non-entitlement" and "entitlement" communities respectively. Entitlement communities are comprised of central cities of Metropolitan Statistical Areas (MSAs); metropolitan cities with populations of at least 50,000; and qualified urban counties with a population of 200,000 or more (excluding the populations of entitlement cities). States distribute CDBG funds to non-entitlement localities not qualified as entitlement communities.

Lexington County, South Carolina Analysis of Impediments to Fair Housing Choice
30
HUD determines the amount of each grant by using a formula comprised of several measures of community need, including the extent of poverty, population, housing overcrowding, age of housing, and population growth lag in relationship to other metropolitan areas.
Over a one, two, or three-year period, as selected by the grantee, not less than 70 percent of CDBG funds must be used for activities that benefit low- and moderate-income persons. In addition, each activity must meet one of the following national objectives for the program: benefit low- and moderate-income persons, prevention or elimination of slums or blight, or address community development needs having a particular urgency because existing conditions pose a serious and immediate threat to the health or welfare of the community for which other funding is not available.
HOME Investment Partnerships Program
Lexington County has been a Participating Jurisdiction (PJ) in the HOME program since July 1, 2008. The HOME program is authorized under Title II of the Cranston-Gonzalez National Affordable Housing Act, as amended. Program regulations are at 24 CFR Part 92. HOME provides formula grants to states and localities that communities use often in partnership with local nonprofit groups to fund a wide range of activities that build, buy, and/or rehabilitate affordable housing for rent or homeownership or provide direct rental assistance to low-income people.
HOME is the largest federal block grant to state and local governments designed exclusively to create affordable housing for low-income households. Each year it allocates approximately $2 billion among the states and hundreds of localities nationwide. The program was designed to reinforce several important values and principles of community development:
HOME's flexibility empowers people and communities to design and implement strategies tailored to their own needs and priorities.
HOME's emphasis on consolidated planning expands and strengthens partnerships among all levels of government and the private sector in the development of affordable housing.
HOME's technical assistance activities and set-aside for qualified community-based nonprofit housing groups builds the capacity of these partners.
HOME's requirement that grantees (known as participating jurisdictions or PJs) match 25 cents of every dollar in program funds mobilizes community resources in support of affordable housing.
HOME funds are awarded annually as formula grants to participating jurisdictions. HUD establishes HOME Investment Trust Funds for each grantee, providing a line of credit that the jurisdiction may draw upon as needed. The program's flexibility allows States and local

Lexington County, South Carolina Analysis of Impediments to Fair Housing Choice
31
governments to use HOME funds for grants, direct loans, loan guarantees or other forms of credit enhancement, or rental assistance or security deposits.
States are automatically eligible for HOME funds and receive either their formula allocation or $3 million, whichever is greater. Local jurisdictions eligible for at least $500,000 under the formula ($335,000 in years when Congress appropriates less than $1.5 billion for HOME) also can receive an allocation. Communities that do not qualify for an individual allocation under the formula can join with one or more neighboring localities in a legally binding consortium whose members' combined allocation would meet the threshold for direct funding. Other localities may participate in HOME by applying for program funds made available by their State. Congress sets aside a pool of funding, equivalent to the greater of $750,000 or 0.2 percent of appropriated funds, which HUD distributes among insular areas.
The eligibility of households for HOME assistance varies with the nature of the funded activity. For rental housing and rental assistance, at least 90 percent of benefiting families must have incomes that are no more than 60 percent of the HUD-adjusted median family income for the area. In rental projects with five or more assisted units, at least 20 percent of the units must be occupied by families with incomes that do not exceed 50 percent of the HUD-adjusted median. The incomes of households receiving HUD assistance must not exceed 80 percent of the area median. HOME income limits are published each year by HUD.
Participating jurisdictions may choose among a broad range of eligible activities, using HOME funds to provide home purchase or rehabilitation financing assistance to eligible homeowners and new homebuyers; build or rehabilitate housing for rent or ownership; or for "other reasonable and necessary expenses related to the development of non-luxury housing," including site acquisition or improvement, demolition of dilapidated housing to make way for HOME-assisted development, and payment of relocation expenses. PJs may use HOME funds to provide tenant-based rental assistance contracts of up to two years if such activity is consistent with their Consolidated Plan and justified under local market conditions. This assistance may be renewed. Up to 10 percent of the PJ's annual allocation may be used for program planning and administration.
As the PJ for the State, the SC State Housing Finance and Development Authority ensures that HOME funds are distributed in a manner that is reasonably equitable to all regions of the state. The State of South Carolina has fourteen other local PJs which receive direct funding from HUD for their areas of service. These PJs include: Charleston County, Spartanburg County, Greenville County, Richland County, Waccamaw Consortium (Horry, Georgetown, Williamsburg), Sumter County Regional HOME Consortium (Sumter, Lee, Clarendon, Kershaw), Beaufort-Jasper Consortium (Beaufort, Jasper, Hampton, Colleton), Anderson City and County Consortium, Upper Savannah HOME Consortium (Abbeville, McCormick, Edgefield, Saluda, Greenwood, Laurens), City of Charleston, City of Columbia, City of Spartanburg, Lexington County, and the City of Greenville. The Authority does not regulate the administration of the other PJs; however, it does encourage applicants and participants alike to work with local funding sources to leverage all available resources in the state.
Lexington County, South Carolina Analysis of Impediments to Fair Housing Choice
32
Section 8 Housing Voucher (Public Housing)
The Section 8 Rental Voucher Program enables affordable housing choices for very low-income households by permitting families to choose privately owned rental housing. The housing choice voucher program is the Federal government's major program for assisting very low-income families, the elderly, and the disabled to afford decent, safe, and sanitary housing in the private market. Since housing assistance is provided on behalf of the family or individual, participants are able to find their own housing, including single-family homes, townhouses and apartments. The participant is free to choose any housing that meets the requirements of the program and is not limited to units located in subsidized housing projects. In South Carolina the State Housing Finance and Development Authority is responsible for administering this program and works locally through public housing agencies (PHAs).
A family that is issued a housing voucher is responsible for finding a suitable housing unit of the family's choice where the owner agrees to rent under the program. This unit may include the family's present residence. Rental units must meet minimum standards of health and safety, as determined by the PHA. A housing subsidy is paid to the landlord directly by the PHA on behalf of the participating family. The family then pays the difference between the actual rent charged by the landlord and the amount subsidized by the program. Under certain circumstances, if authorized by the PHA, a family may use its voucher to purchase a modest home.
Since the demand for housing assistance often exceeds the limited resources available to HUD and the local housing agencies, long waiting periods are common. In fact, a PHA may close its waiting list when it has more families on the list than can be assisted in the near future. PHAs may establish local preferences for selecting applicants from its waiting list. For example, PHAs may give a preference to a family who is:
Homeless or living in substandard housing,
Paying more than 50 percent of its income for rent, or
Involuntarily displaced.
Families who qualify for any such local preferences move ahead of other families on the list that do not qualify for any preference. Each PHA has the discretion to establish local preferences to reflect the housing needs and priorities of its particular community.
The Cayce Housing Authority, which is managed by the Columbia Housing Authority, consists of 40 units in four different housing communities. The goals for the Cayce Housing Authority 2005-10 Five Year Plan include reviewing opportunities for increasing the number of affordable housing units in Cayce through acquisition of Section 8 certificates, construction, or renovation. All expansion will be dependent on HUD regulations.

Lexington County, South Carolina Analysis of Impediments to Fair Housing Choice
33
South Carolina Housing Trust Fund
The South Carolina Housing Trust Fund is a State-funded program designed to provide financial assistance in the development, rehabilitation, and acquisition of affordable housing for low-income households throughout the State. This includes single-family homes, group homes for the disabled, and emergency shelters for battered women and their children. The South Carolina Housing Trust Fund accelerates the State’s response to the production of affordable housing through innovative financing used by the nonprofit and private sectors. It builds partnerships among governmental entities, qualified nonprofits, for-profits, and those in need of affordable housing. It strives to maximize the utilization of Federal, State, and/or other housing assistance programs in leveraging other public and private resources. Applications for the South Carolina Housing Trust Fund are accepted for homeownership acquisition, emergency repair, owner-occupied rehabilitation, group homes, supportive housing, and rental housing.
The South Carolina State Housing Finance and Development Authority, the State’s affordable housing entity, has provided $2 billion for homeownership mortgage loans since the inception of the program in 1979. This milestone translates into providing the financing for more than 36,000 homes for families in South Carolina to experience the American dream of owning their own home.
The Authority offers 30-year, fixed-rate mortgage loans at below market interest rates to qualified home buyers under the Homeownership program. Loans available under this program include the traditional first-time homebuyer loans, single parent loans, and loans for persons with disabilities or their caregivers. Eligibility is based on income, family size, sale price, and the county in which the home is located. The Authority also offers down payment and closing cost assistance to eligible borrowers reducing out-of-pocket expenses.
When the homeownership program was created over two and on-half decades ago, the Authority made approximately 2,700 loans in the first year for a total investment of $9.9 million. The average loan amount at that time was $32,651 and the average income was $15,938. The program has significantly evolved over the years to meet the homeownership needs in the State, reaffirming its commitment to providing affordable, quality housing. The average loan amount is approximately $104,621 and the average income is $36,344. The Authority works with approximately 185 lending partners across the State to market its mortgage product.
Emergency Shelter Grant (ESG)
The Emergency Shelter Grant (ESG) program is a competitive grant issued each year to community-based shelters and traditional housing facilities as well as nonprofit organizations that provide housing and counseling assistance to the State's homeless population and to those

Lexington County, South Carolina Analysis of Impediments to Fair Housing Choice
34
at-risk of becoming homeless. In South Carolina this program is administered through the Governor’s Office of Economic Opportunity.
Housing Opportunities for Persons with AIDS (HOPWA)
HUD's Office of HIV/AIDS Housing manages the HOPWA program in collaboration with 44 States and its area Community Planning and Development offices in providing guidance and program oversight. The office works with other HUD offices to ensure that all HUD programs and initiatives are responsive to the special needs of people with HIV/AIDS. One of the primary functions of the office is to administer the HOPWA program through providing guidance and oversight.
HOPWA funding provides housing assistance and related supportive services and grantees are encouraged to develop community-wide strategies and form partnerships with area nonprofit organizations. HOPWA funds may be used for a wide range of housing, social services, program planning, and development costs. These include, but are not limited to, the acquisition, rehabilitation, or new construction of housing units; costs for facility operations; rental assistance; and short-term payments to prevent homelessness. HOPWA funds also may be used for health care and mental health services, chemical dependency treatment, nutritional services, case management, assistance with daily living, and other supportive services.
The statewide HOPWA program is administered by the SC Department of Health and Environmental Control (DHEC), STD/HIV Division. DHEC distributes the funds to regional Ryan White Care Providers and/or eligible nonprofit organizations that assist persons with HIV/AIDS.
The HOPWA entitlement amount for FY2008-2009 was $1,138,000 for the City of Columbia and the surrounding six counties of Calhoun, Fairfield, Kershaw, Lexington, Richland, and Saluda. These funds are administered by the City of Columbia.
Low Income Housing Tax Credit Program
The Low Income Housing Tax Credit (LIHTC) program was created by the Tax Reform Act of 1986 as an alternate method of funding housing for low- and moderate-income households, and has been in operation since 1987. Until 2000, each State received a tax credit of $1.25 per person that it can allocate towards funding housing that meets program guidelines. This per capital allocation was raised to $1.50 in 2001, to $1.75 in 2002, and adjusted for inflation beginning in 2003. These tax credits are then used to leverage private capital into new construction or acquisition and rehabilitation of affordable housing.
The tax credits are determined by the development costs, and are used by the owner. However, often, because of IRS regulations and program restrictions, the owner of the property will not be able to use all of the tax credits, and therefore, many LIHTC properties are owned by limited partnership groups that are put together by syndicators. In this manner, a variety of companies

Lexington County, South Carolina Analysis of Impediments to Fair Housing Choice
35
and private investors participate within the LIHTC program, investing in housing development and receiving credit against their Federal tax liability in return.
Tax credits must be used for new construction, rehabilitation, or acquisition and rehabilitation. Projects must also meet the following requirements:
20 percent or more of the residential units in the project are both rent restricted and occupied by individuals whose income is 50 percent or less of area median gross income or 40 percent or more of the residential units in the project are both rent restricted and occupied by individuals whose income is 60 percent or less of area median gross income.
When the LIHTC program began in 1987, properties receiving tax credits were required to stay eligible for 15 years. This eligibility time period has since been increased to 30 years.
The South Carolina State Housing Finance and Development Authority is responsible for administering this program. The Internal Revenue Service administers federal oversight of the program.
Multi-Family Tax Exempt Bond Financing Program
The Multi-Family Tax Exempt Bond Financing Program provides affordable rental housing opportunities to lower income South Carolinians through the construction of new units or the preservation of existing units through rehabilitation. It is administered by the State Housing Finance and Development Authority.
Single Family Homeownership Program
Homeownership – Mortgage Revenue Bonds
The Homeownership Program is the core of the State Housing Finance and Development Authority’s operations, and provides affordable homeownership opportunities for low-to-moderate income first-time homeowners in South Carolina, primarily through the sale of tax-exempt mortgage revenue bonds. The combination of funds generated by the sale of these bonds and prepayments support the homeownership program. These funds are recycled to finance new reduced interest rate mortgages for first-time homebuyers and used for other related affordable housing activities.
First-Time Home Buyer Mortgage Loan Program
South Carolina State Housing Finance and Development Authority assists low to moderate income SC families and individuals by offering a competitive market fixed interest rate

Lexington County, South Carolina Analysis of Impediments to Fair Housing Choice
36
mortgage loan. SC State Housing also offers down payment assistance based on availability, which may be used toward down payment and closing costs.
Mortgage Loan Assistance Program
The South Carolina State Housing Finance and Development Authority's new low interest rates and down payment assistance program is available for to assist state residents in the purchase of new homes. As of Monday, January 4, 2010, SC the Authority set its rates at 5.25 percent in categories I and II, which include borrowers earning 50.01 percent and above of median income, and 5 percent for those in category III, covering borrowers earning 50 percent and below of the median income as well as disabled borrowers. All categories offer up to $5,000 down payment assistance. Down payment assistance is repayable for borrowers in category I and forgivable in categories II and III.
First-time home buyers may also take advantage of up to $8,000 in federal tax credits if they purchase a home before April 30, 2010, with a 60-day extension if a binding contract is in place prior to that deadline. Members of the Armed Forces, Military Intelligence and Foreign Service who are on extended overseas duty or who have been on active duty for more than 90 days in 2008 and 2009 have another year to use the tax credit (through June, 30, 2011).
Employment, Housing and Transportation Linkage
Established in October 2002, the Central Midlands Regional Transit Authority (CMRTA) is committed to providing safe, dependable and accessible public transit service to the heart of the Midlands, including Columbia, Cayce, West Columbia, Forest Acres, Arcadia Lakes, Springdale, St. Andrews area, Harbison and the Village at Sandhills. Since 2002, the CMRTA has provided transportation for more than 14 million passengers, expanded route services and introduced 43 new ADA accessible buses that offer a safer and more comfortable mode of transportation. In addition to the regular fixed route service, Dial-A-Ride Transit (DART) service is also available in the Midlands to anyone certified as unable to use the regular fixed route service due to a physical or mental disability.
The Central Midlands Regional Transit Authority (CMRTA) provides limited public transportation routes within Lexington County. Therefore, the vast majority of the County’s residents drive alone in private, personal transportation (i.e. cars) for most of their transportation needs resulting in a 20 to 25 minute work trip. This is very much in keeping with national averages for such trips and illustrates the relatively low level of transit usage in most communities, including Lexington County. For some populations, limited availability to public transportation, coupled with housing burdens, can impede access to job opportunities.
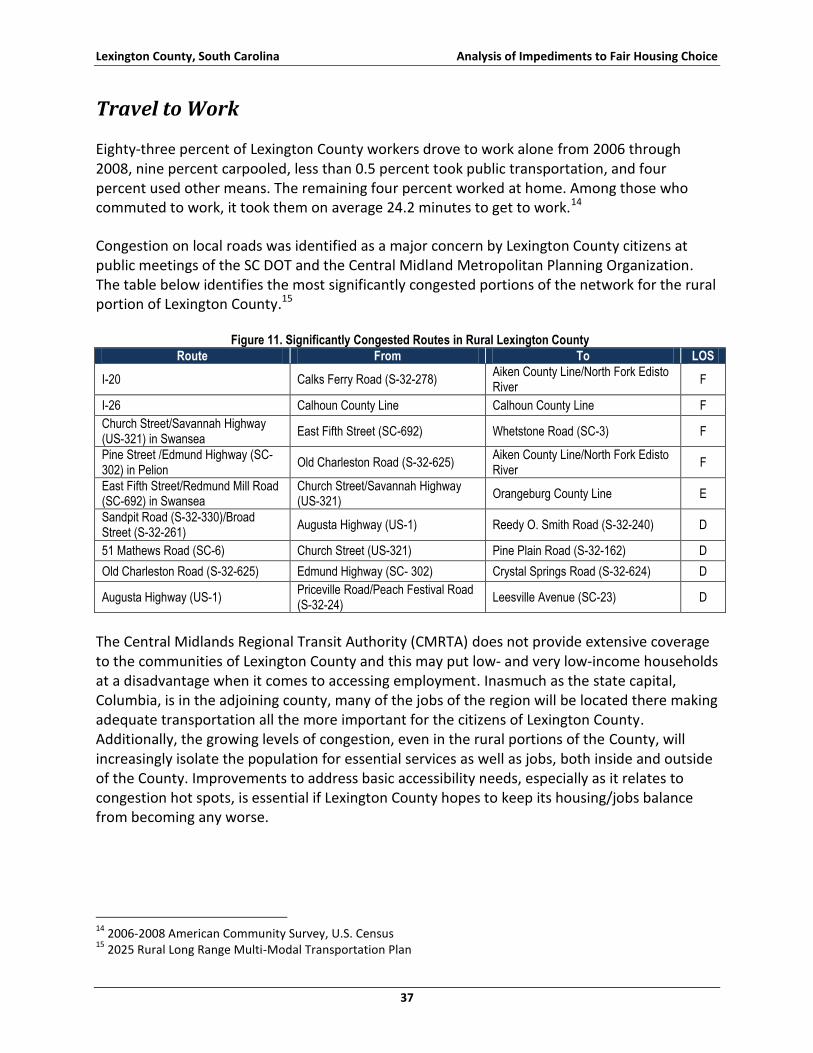
Lexington County, South Carolina Analysis of Impediments to Fair Housing Choice
37
Travel to Work
Eighty-three percent of Lexington County workers drove to work alone from 2006 through 2008, nine percent carpooled, less than 0.5 percent took public transportation, and four percent used other means. The remaining four percent worked at home. Among those who commuted to work, it took them on average 24.2 minutes to get to work.14
Congestion on local roads was identified as a major concern by Lexington County citizens at public meetings of the SC DOT and the Central Midland Metropolitan Planning Organization. The table below identifies the most significantly congested portions of the network for the rural portion of Lexington County.15
Figure 11. Significantly Congested Routes in Rural Lexington County
Route From To LOS
I-20 Calks Ferry Road (S-32-278) Aiken County Line/North Fork Edisto River
F
I-26 Calhoun County Line Calhoun County Line F
Church Street/Savannah Highway (US-321) in Swansea
East Fifth Street (SC-692) Whetstone Road (SC-3) F
Pine Street /Edmund Highway (SC- 302) in Pelion
Old Charleston Road (S-32-625) Aiken County Line/North Fork Edisto River
F
East Fifth Street/Redmund Mill Road (SC-692) in Swansea
Church Street/Savannah Highway (US-321)
Orangeburg County Line E
Sandpit Road (S-32-330)/Broad Street (S-32-261)
Augusta Highway (US-1) Reedy O. Smith Road (S-32-240) D
51 Mathews Road (SC-6) Church Street (US-321) Pine Plain Road (S-32-162) D
Old Charleston Road (S-32-625) Edmund Highway (SC- 302) Crystal Springs Road (S-32-624) D
Augusta Highway (US-1) Priceville Road/Peach Festival Road (S-32-24)
Leesville Avenue (SC-23) D
The Central Midlands Regional Transit Authority (CMRTA) does not provide extensive coverage to the communities of Lexington County and this may put low- and very low-income households at a disadvantage when it comes to accessing employment. Inasmuch as the state capital, Columbia, is in the adjoining county, many of the jobs of the region will be located there making adequate transportation all the more important for the citizens of Lexington County. Additionally, the growing levels of congestion, even in the rural portions of the County, will increasingly isolate the population for essential services as well as jobs, both inside and outside of the County. Improvements to address basic accessibility needs, especially as it relates to congestion hot spots, is essential if Lexington County hopes to keep its housing/jobs balance from becoming any worse.
14
2006-2008 American Community Survey, U.S. Census 15
2025 Rural Long Range Multi-Modal Transportation Plan

Lexington County, South Carolina Analysis of Impediments to Fair Housing Choice
38
Planning for Transit Improvements
On October 16, 2009, approximately 85 citizens responded to an invitation from Debbie Summers, Lexington County Council Councilmember, to participate in a Transit Summit. The purpose was to begin a discussion of transit needs and possibilities for the county that would inform the Lexington County Council. Small group discussions produced extensive lists of ideas, and evaluations indicated a consensus that Lexington County needs transit now. Lexington County along with its regional government partners should continue efforts to explore public transportation needs in an effort to improve mobility options for residents.
The Summit participants concluded the following:
Lexington County needs transit to address issues of growth, traffic congestion, economic development, air quality, and quality of life. The response in Summit attendance and the high-energy participation showed a clear interest in and support for developing workable public transit in Lexington County.
The need for transit affects all elements of the population – business, education, municipal and county government, human service organizations, faith communities, as well as riders and transit planners and providers.
Presentations illustrated doable approaches to public transit to fit the needs of rural areas and small communities as well as urban and suburban areas of the County.
Lexington County Council is the appropriate body to take the lead in planning for transit that serves the County and connects with regional transit initiatives.
Capable and willing resource people are available to assist Lexington County in planning and developing transit options.
Support and cooperation of Lexington County municipalities will be key to developing a viable transit system.
Property Tax Policies
Across the country, older counties – with the support of the Federal government – have begun to invest in economic and community development programs designed to revitalize their decaying urban cores. Lexington County is no exception. The foundation upon which this kind of development is built is the ability to achieve fairness in the appraisal process within these neighborhoods. Since the starting point for most bank appraisals is the tax department, discriminatory assessment practices can undermine a homebuyer’s ability to secure mortgage financing in an amount commensurate with the property’s true market value.

Lexington County, South Carolina Analysis of Impediments to Fair Housing Choice
39
Although the Fair Housing Act specifically prohibits the consideration of the racial or ethnic composition of the surrounding neighborhood in arriving at appraised values of homes, no practical means exist to investigate violations of this kind. One reliable approach, however, is to review, periodically, the assessment policies and practices of the taxing jurisdiction since their valuations generally comprise the bases for private appraisals.
Property tax assessment discrimination against low-income groups occurs when lower value properties and/or properties in poorer neighborhoods are assessed for property tax purposes at a higher percentage of market value, on average, than other properties in a jurisdiction. Regressive assessments (the tendency to assess lower value properties at a higher percentage of market value than higher value properties) are not uncommon in this country. They result from political pressures, practical problems in assessment administration and the use of certain inappropriate appraisal techniques. Assessments tend to remain relatively rigid at a time when property values are rising in middle income neighborhoods and are declining or remaining at the same level in low-income neighborhoods.
Inequities in property tax assessments are a problem for both lower-income homeowners and low-income tenants. Millions of low-income families own homes. Variations in assessment-to-market value ratios between neighborhoods or between higher and lower value properties can make a difference of several hundred dollars or more each year in an individual homeowner’s property tax bill. In addition to causing higher property tax bills, discriminatorily high assessment levels can also have an adverse impact upon property values. Buyers are less likely to purchase a property if the property taxes are perceived as too high thereby making the property less attractive and reducing its market value.
Another common inequity is the assessment of multi-family dwellings at a higher ratio to market value than single family dwellings. This type of inequity may be considered a form of discrimination against low-income groups because a higher percentage of low-income than middle-income persons live in multi-family rental dwellings. The requirement to pay a higher assessment is passed on to the tenant in the form of higher rent. Quite often, higher assessments also make it difficult for landlords to maintain property within the limits of the property’s rent structure leading to substandard housing conditions.
Most jurisdictions rely heavily on a market value approach to determining value when conducting their property assessment appraisals. Under this approach, an appraiser compares recent sale prices of comparable properties within the area – in addition to site visits and a good deal of expert speculation – in arriving at an appraised value. The limitations inherent in market value approaches are many. Most prominent among them are the cumulative result of decades of discriminatory valuations, especially where the neighborhood is a minority one. Unless some radical re-appraisal process has been conducted within the preceding 10-year period, the present market value approach merely compounds past discrimination.
While the market value approach may operate successfully in some jurisdictions, a substantial percentage of jurisdictions rely primarily on a replacement cost approach in valuing properties.

Lexington County, South Carolina Analysis of Impediments to Fair Housing Choice
40
Making determinations of value based on comparable sales is a complex task, which requires considerable exercise of judgment. Assessor’s departments, which must appraise every property within a jurisdiction, often do not find it feasible to make the detailed individual analysis required to apply the market value approach.
South Carolina’s constitution requires that property be taxed equitably. When similar properties in the same taxing district are taxed differently because conditions have changed over a long period of time, the system becomes unequal. South Carolina law now requires counties to reassess every five years. An employee from the County Assessor’s office visits and measures each home to determine square footage. The employee also notes other information, such as age, type of construction, type of heating and air conditioning, number of floors, and whether the structure has a garage, deck, swimming pool or other amenities.
The Assessor’s Office then considers this information along with similar properties that have sold in the area, adjusting that sales information to fit each property. For rental or commercial property, an evaluation is made on how much income the property produces, what the operating expenses are and what kind of investment return can be reasonably expected. With all of this information, the Assessor’s Office then determines the market value of the property.
Zoning and Site Selection
Zoning may have a positive impact and can help to control the character of the communities that make up a jurisdiction. In zoning a careful balance must be achieved to avoid promoting barriers to equal housing.
Professor Richard T. Lal, Arizona State University surveying the view of representative studies concerning the nature of zoning discrimination states:
“If land-use zoning for the purpose of promoting reason, order and beauty in urban growth management is one side of the coin, so can it be said that exclusion of housing affordable to low and moderate income groups is the other…as practiced, zoning and other land-use regulations can diminish the general availability of good quality, low-cost dwellings…”16
In considering how zoning might create barriers to fair housing, four key areas are often evaluated because of the possible adverse effects they could have on families and persons with disabilities:
Definitions used for “families” and “group homes,”
Regulations (if any) regarding group homes,
16
Professor Richard T. Lal, Arizona State University, “The Effect of Exclusionary Zoning on Affordable Housing”

Lexington County, South Carolina Analysis of Impediments to Fair Housing Choice
41
Ability for group homes or other similar type housing to be developed, and
Unreasonable restrictions on developing multi-family units, such as lot size requirements.
While the definition of group care facility is broader in terms of the number of people that can be served and not limited to related temporary disability, group housing is much more restricted in where it is permitted under zoning designations in many locations. Lexington County does not have a specific definition for family or group homes in its zoning ordinance and as a result does not have any institutional restraints on their placement, with one notable exception. When zoning was initially introduced in the County, existing subdivisions with covenants and restrictions that would limit the development of such facilities were set aside with a separate zoning category of R-1. This zone represents approximately 1 to 2 percent of the area of the County, and is the only area in which such facilities may not be developed. For the remaining 98 percent of the County where all of the other zoning categories are existent, family care and group homes are permitted. And even though restricted in the R-1 zone, Lexington County does not allow these uses to be prohibited in opposition to existing State and Federal regulations.
The Lexington County Comprehensive Plan discusses the various land uses permitted within the County, including residential, commercial, and recreational/open space. The 2001 Fair Housing AI discussed the zoning process at length. The chart below is excerpted from the County’s zoning ordinance and identifies areas in which residential development and special needs housing is allowed and prohibited. It would appear that residential attached housing with 3 or more units (multi-family) and retirement center/assisted living housing, the most likely form of affordable housing to be developed for vulnerable populations, are restricted from the R1 and R2 districts where they might be integrated into the existing, stable and pleasant residential fabric.
Table 13. Allowable Activities by Zoning District
R1 R2 R3 D RA RD LC C1 C2 ID LR Activities
Power Plants
Professional Services
Radioactive Materials Handling
Railroad
Recycling Centers
Research Services
Residential Detached
Residential Attached (2 dwelling units)
Residential Attached (3 or more dwelling units)
Retirement Centers/Assisted Living
The County’s use of performance-based zoning allows for a great deal of openness, resulting in considerable diversity in construction (for example, there are no required minimum lot sizes). The R-1 zoning area, covering less than 2 percent of the County, is the only category that restricts mobile homes. However, this classification is only in the areas that were already
Lexington County, South Carolina Analysis of Impediments to Fair Housing Choice
42
established with subdivisions that had restrictive covenants prohibiting mobile homes when zoning was first introduced in the County in 1980.
Actions before the Zoning Board of Appeals usually require the use of a quasi-judicial hearing procedure and the finding of facts. Such legal hurdles can be used as a way to discourage locally undesirable land uses (LULUs) from being sited in more affluent and politically effective communities and neighborhoods. These types of situations could represent potential impediments to fair housing. However, Lexington County’s boards and commissions do not require legal representation in such cases and have adopted a “user friendly” approach to the application of the quasi-judicial hearing procedure so that average citizens can effectively and easily operate within the system
Lexington County might consider gauging how well they, as well as the municipalities within the county, are doing in balancing jobs and housing. This can be accomplished by looking at the Comprehensive Plan and the Capital Improvement Plan to see if they include housing and affordable housing provisions. The performance-based zoning ordinance in use in the County allows for considerable flexibility and the widespread use of the Intensive Development (ID) and Restrictive Development (RD) zoning districts (comprising more than 98 percent of the County) means that high density, mixed use and mixed income development are permitted in the vast majority of the County. The addition of fair share provisions in the formal plans and policies of Lexington County and the jurisdictions within the County could also be a helpful step toward being sure that the needs of the very low- and low-income residents of the County are met equitably and responsibility by all. This is achieved by avoiding over-concentrations of lower income housing by requiring that all jurisdictions provide sufficient affordable housing opportunities for lower households residing in their communities.
Building and Housing Codes
The Building Codes Ordinance in Lexington County provides the minimum standards to protect health and public well being through structural strength, means of egress, stability, sanitation, adequate light and ventilation, and to provide safety to life and property from fire and other hazards attributed to the built environment. The Building Codes Ordinance covers every residential building within the unincorporated areas of Lexington County and the town limits of Chapin, Irmo, Gilbert, Summit, Pine Ridge, and Swansea. All other jurisdictions within the County are responsible for devising and enforcing their own codes. Care must be taken or building codes can increase the cost of housing substantively by restricting cost-saving materials and techniques or, administratively, by conflicting with various enforcement agencies.
Lexington County uses the International Building Code; it has chosen not to adopt a local housing code and has no minimum housing standard. It therefore provides considerable flexibility for the production of housing for all market segments, including affordable housing. Particular concern and attention is usually paid to the impact of building and housing codes on the rehabilitation of existing housing since using more modern and state-of-the-art codes on older homes can result in the rehabilitation process becoming so expensive as to make the

Lexington County, South Carolina Analysis of Impediments to Fair Housing Choice
43
project unsupportable by the rents affordable to the low- and very low-income renting households in the community. Given that the housing stock in Lexington County has been more recently developed than in other areas, however, there is little activity at present involving the rehabilitation of older stock for reuse. Rehabilitation of existing units is voluntary and not mandated.
Land Development Regulations
Lexington County subdivision regulations provide standards to coordinate proposed road locations as part of a subdivision with other existing or planned roads, ensure adequate and timely construction of infrastructure, and encourage the best environment for the health, safety, convenience and prosperity of current and future residents of Lexington County. Subdivision Regulations are used in conjunction with the County’s stormwater ordinance, zoning ordinance and land development manual, as well as the access policy and private roads policy, where applicable. Additional regulations of the Army Corps of Engineers, SCDOT, SCDHEC, FEMA and County flood policy may apply.
Lexington County was the first in the state to implement a sediment erosion control management system. The County provides relief for stormwater and sedimentation fees to developers who apply “low impact development” practices, allowed through the County’s stormwater management office, which only requires a minimum parking allocation for each development site.
Permit Fees
Fees for permits of new and rehabilitation construction projects can be excessive and prohibitive. This is especially the case when applied to housing affordable to low- and very low-income households, and especially for rental households. The problem with such fees are that they are paid up-front and on an individual building basis. These fees have a direct immediate cost impact to such structures. Buyers and sellers take these costs into consideration when planning future development. Even though Lexington County’s fees were adjusted before the drafting of the 2005-2010 version of the Consolidated Plan in order to bring them into line with neighboring and comparable jurisdictions in the State, vigilance has been maintained so that the fee increases have been in line with the Consumer Price Index and no higher. This will ensure that as economic conditions change the fees do not become a burden and an impediment to the development, maintenance, and rehabilitation of housing for the vulnerable segments of the local housing market. A comparison with comparable and neighboring counties conducted two years ago indicated that Lexington County’s fees were very competitive and that recent increases represented a minimal increase compared with those counties. Noted below is the existing schedule of fees for Lexington County.

Lexington County, South Carolina Analysis of Impediments to Fair Housing Choice
44
Table 14. Building Permits
Construction Value Residential Fees Commercial Fees
Less than $3,000 $15 (minimum) $15 (minimum)
$3,000 to $19,999 $4 per $1,000 (or % thereof) $4 per $1,000 (or % thereof)
$20,000 to $99,999 $80 for 1st $20,000 + $3 per additional $1,000 (or % thereof)
$4 per $1,000 (or % thereof)
$100,000 to $499,999 $320 for 1st $100,000 + $2 per additional $1,000 (or % thereof)
$400 for 1st $100,000 + $3 per additional $1,000 (or % thereof)
$500,000 or More $1,120 for 1st $500,000 + $1 per additional $1,000 (of % thereof)
$1,600 for 1st $500,000 + $2 per additional $1,000 (or % thereof)
Residential and commercial permit fees are calculated at the time of permit issuance. Construction value is based on building valuation data as published by the International Codes Council.
Planning Commission, Board of Zoning Appeals and the Building Code Board of Appeals
The members of the Board of Zoning Appeals, each representing a Council District, hear appeals and requests for variances from the Zoning Ordinance. The members of the Building Codes Board of Appeals, each representing a specific area of technical expertise related to the building industry, hear appeals and requests for variances from the provisions of the Building Codes Ordinance. The Board meets only when there are requests or appeals filed and the meetings are scheduled as quickly as possible for the convenience of the applicant(s). The members of the Lexington County Planning Commission are appointed by the Lexington County Council and may serve only two consecutive terms. No appointed official in Lexington County is allowed to serve on more than one public body at a time, thereby limiting the opportunities for undue influence on the processes of government. To date, there have been no official complaints made against members of these bodies or with regard to the actions and decision taken by them.
Even though the members of these boards and commissions are selected from the population of the various council districts in Lexington County, they may not necessarily be representative of or conversant with the concerns of the very low- and low-income residents whose housing choices are impacted by their decisions. Inasmuch as many very low- and low-income households are also likely to be less educated and less involved in the local political scene, they are much less likely to be chosen or to seek appointment to these time consuming, volunteer bodies. As a result, even though very well-meaning, the members of these boards and commissions may not serve the best interest of the most vulnerable and ill-housed in a community. This situation can be even more complicated if the members of these boards and committees tend to be chosen from the real estate and development professional communities. This can sometimes lead to conflicts of interest between the public and private interests in which case the private and short term interest will most likely be more articulately expressed and considered. That notwithstanding, however, there have been no complaints filed against any of these bodies since the 2001 Analysis of Impediments document was produced according to the records of the Community Development Department or the Planning and GIS Department of Lexington County.

Lexington County, South Carolina Analysis of Impediments to Fair Housing Choice
45
Water and Sewer
The Joint Municipal Water and Sewer Commission was formed in October 1992 under provisions of existing State code of the Joint Municipal Water Systems Act, and consisted of four initial members, including the County of Lexington, City of Cayce, Town of Pelion and Town of Swansea. Currently, it consists of seven additional members, including the City of West Columbia, Town of Batesburg-Leesville, Town of Springdale, Town of Gaston, the Gilbert-Summit Rural Water District, Town of Lexington, and South Congaree, bringing the current total to eleven members. Its purpose is to pursue, through the cooperative efforts of its representative members, water and wastewater systems expansion within Lexington County in order to promote and support further economic development, and to address health, environmental and quality of life concerns brought on by the lack of such services within the County. Utilizing the systems resources available from its members, as well as the resources of its own, the Commission’s goal is to meet water and wastewater service needs in certain unincorporated areas of Lexington County. It is governed by representatives appointed by the governing bodies of its members.
The Commission began officially operating as a separate entity on July 1, 1993 when the Lexington County Council formally conveyed its water and sewer systems assets and liabilities to the Commission. At that time, total fixed assets were approximately $8.3 million, and the total number of accounts was about 1,100. Since its creation, the system’s assets have grown to more than $47 million, and the number of customer accounts is more than 7,000. The Commission serves both industrial and residential customers in unincorporated areas of the County. The Commission purchases its water from the City of West Columbia’s Lake Murray Plant. The Commission’s current area of operations includes more than 50 square miles in Lexington County.
The Town of Lexington provides water and sewer service to nearly 9,000 customers both within the town limits and in unincorporated areas of Lexington County. The City of Cayce and Towns of Batesburg-Leesville, Chapin, Lexington, Pelion, and Swansea all operate water distribution systems. Some draw water directly from a local source, but many purchase water from larger providers. In addition, two special purpose districts also provide water to County residents. The Gilbert-Summit Rural Water District was established by the General Assembly in 1970s for service to the towns of Gilbert and Summit. The system now serves some areas immediately adjacent to both towns. Its water supply is from groundwater wells. The Gaston Rural Community Water District was established by the General Assembly in 1966.
Wastewater
The City of Columbia’s main treatment plant is located on the Congaree River. With more than 850 miles of sewer lines, the City provides sewage treatment services for all of Columbia and portions of northwest, north central, northeast, and lower Richland County, and portions of northeast Lexington County.

Lexington County, South Carolina Analysis of Impediments to Fair Housing Choice
46
The Lexington County Joint Municipal Water and Sewer Commission operates two wastewater treatment plants. The Two Notch Road Plant serves part of the I-20 and US-1 Industrial Corridor. The Old Barnwell Treatment Facility, located off Platt Springs Road, serves the growing Platt Springs Road and Red Bank areas.
The City of Cayce operates wastewater treatment facilities and provides service within the City as well as portions of the Town of Springdale and several areas of unincorporated Lexington County. The Town of Lexington, Town of Chapin, and Town of Swansea all have sewage treatment facilities and primarily serve the residents of their immediate jurisdictions. The City of West Columbia contracts with the City of Columbia for treatment of wastewater for their customers.
The provision of basic utilities like water and sewer services can sometimes add considerable costs to an affordable housing development. Especially when line extensions are required to a new and previously undeveloped site, the burden on the builder can be enough to make the project unattractive. This may also be the case where there is the need to upgrade and improve service in existing areas. Owners of LIHTC properties must deduct estimated utility costs when they establish the net rent they will charge their tenants. These estimates may be much higher than the actual utility costs if the estimates are based on older properties with less efficient construction and appliances. Gross rents are capped as a percentage of the residents’ eligible income, so estimating higher utility costs translates into actual reduced cash flows from the net rents, leaving the owner with less money available to service the mortgage and cover operating and maintenance costs.
Health Care Facilities
Lexington County Hospital opened in 1971 and quickly became a leader in providing quality health care to its community. The Center operates as a public, nonprofit entity governed by a board of directors that are appointed by the Lexington County Council. From its beginning as a 125-bed County hospital, the facility has grown into a 384-bed, modern medical complex anchors a comprehensive network of 600-plus affiliated physicians, including six strategically located community medical and urgent care centers, an occupational health center, the largest extended care facility in the State, and an Alzheimer’s Care Center. The Health Directions program provides a complete array of health and wellness classes. The facility employs more than 5,000 people in and around Lexington County and offers a wide array of community outreach programs, education, and health screenings
The hospital has expanded from its single main campus located on Highway 378 in West Columbia to a network of facilities that include six community outpatient facilities. These community centers located in Irmo, Swansea, Chapin, Batesburg-Leesville, Gilbert, and Lexington help to make healthcare accessible and convenient to all residents of Lexington County.

Lexington County, South Carolina Analysis of Impediments to Fair Housing Choice
47
Lexington County Public Health Department is part of the Region 3 Public Health Office. Services include WIC supplemental foods and nutrition education for eligible pregnant and post-partum women and infants and children up to age five; maternity care and education for pregnant women; family planning counseling and education and birth control; health screenings for HIV, STDs and TB; immunization; nutrition; lead screening; and social services. Services also include environmental health issues, such as restaurant inspections, on-site sewage, rabies, and West Nile Virus. This region does not deny services due to a client's inability to pay.
Healthcare is particularly important to many of the population segments that are heavily represented among the very low- and low-income populations of Lexington County. The elderly, the disabled, and those with special needs are especially vulnerable to health care issues and in need of ready access to medical facilities. Lexington County should periodically evaluate the geographic distribution of these population segments as relates to the location of medical and healthcare facilities and as relates to accessibility. While emphasis may be placed on expanding and improving the new and modern facilities located in the more developed eastern portion of the County, attention should continue to be directed to the older established but poorer communities where many of these populations are clustered.
Figure 12. Lexington Medical Center Sites
Main Campus
2720 Sunset Boulevard (Highway 378), West Columbia, South Carolina 29169
Community Medical Centers (Urgent Care Centers and a wide range of outpatient services)
7035 St. Andrews Road, Columbia, South Carolina 29212
811 West Main Street, Lexington, South Carolina 29072
557 Columbia Avenue, Chapin, South Carolina 29036
338 East Columbia Avenue, Batesburg-Leesville, South Carolina 29070
4080 Augusta Highway (Hwy 1), Gilbert, South Carolina 29054
935 West Second Street, Swansea, South Carolina 29160
Medical Office Buildings
Lexington Medical Park 1, 2728 Sunset Blvd., West Columbia, South Carolina 29169
Lexington Medical Park 2, 146 North Hospital Drive, West Columbia, South Carolina 29169
Lexington Medical Office Building, 110 East Medical Lane, West Columbia, South Carolina 29169
Irmo Medical Park, 7033 St. Andrews Rd., Columbia, South Carolina 29212
Specialized Care
Carrol Campbell Center (Alzheimer’s Care), 802 Old Cherokee Road, Lexington, South Carolina 29072
Lexington Medical Center (Extended Care), 815 Old Cherokee Road, Lexington, South Carolina 29072
LMC Occupational Medicine, 300 West Dunbar Road, West Columbia, South Carolina 29170

Lexington County, South Carolina Analysis of Impediments to Fair Housing Choice
48
SECTION V: PRIVATE SECTOR ANALYSIS
Overview
Since most housing transactions occur in the private sector, and are not significantly impacted by the local government(s), an analysis of impediments must explore housing in the private sector in Lexington County.
This section provides an in-depth review of private real estate and lending activity over the past decade and identifies trends that have an impact on fair housing.
The Mortgage Market
Lenders in Lexington County, SC
Homeownership rates are important to a community’s financial well-being. Prospective homebuyers expect to have access to mortgage credit, and programs that offer homeownership must be available without regard to discrimination, income, or profession. To truly live up to fair housing law, all persons must have the ability to live where they want and can afford.
Access to mortgage credit enables residents to own their homes and access to home improvement loans allows them to keep older houses in good condition. Access to refinancing loans assures achievement of the dreams that all Americans have. All of these help keep neighborhoods attractive and residents vested in their communities.
Inadequate lending performance results in various long term and far ranging community problems, and of these, disinvestment is probably the most devastating. Disinvestment in Lexington County by its lenders would reduce housing finance options for borrowers and weakens competition in the mortgage market for low- and moderate-income neighborhoods. High mortgage costs, less favorable mortgage loan terms, deteriorating neighborhoods, reduced opportunities for homeownership, reduced opportunities for home improvement and the lack of affordable housing are only a few of the consequences of inadequate lending performance. Financial decay in the business sector as well as in the private sector is also a result of disinvestment in the form of business relocation, closure and bankruptcy. Full service local lenders that have traditionally served residents and businesses are one of the main elements that keep neighborhoods stable.
Significant changes are occurring in the lending market not only in Lexington County but throughout the United States. The number and type of lenders have changed over the last ten years, and it is a common occurrence to read about national lenders buying local lenders. These national lending institutions are becoming increasingly more active locally, as the market share of national corporations is growing yearly. The newest issue to emerge from the changes in the

Lexington County, South Carolina Analysis of Impediments to Fair Housing Choice
49
market is the substantial growth of the sub-prime market and the impact these lenders have on communities and neighborhoods. More and more we see local, commercial banks lose market share to lenders outside the city.
Like most suburbs of a Metropolitan Statistical Area (MSA), Lexington County is highly influenced by lending activity throughout the area. In this context, much of the information in this section refers to the MSA as a whole.
There were 66 financial institutions with a home or branch office in Lexington County, and whose data make up the 2009 report Offices and Branches of FDIC-Insured Banks. Home Mortgage Disclosure Act reporting methods do not allow for a distinction between those lenders that wrote business in Lexington County from those that did not. In addition, other lending institutions that do not have a home or branch office in the MSA wrote business throughout Lexington County. The lenders with offices and branches in the County are noted below.
The physical presence of financial institutions in communities facilitates relationships with banks, and the location of these institutions is a primary concern for a community. Areas left without branches or with access to only ATM machines must find alternative sources for services (such as checking cashing businesses or finance companies), which can be more expensive than traditional financial institutions or credit unions.
Lending Activity in Lexington County, SC
The statistical database used for this analysis was the Home Mortgage Disclosure Act (HMDA) data for 2007. HMDA data on loan activity are reported to document home purchase, refinancing, and home improvement loans. The broadest measure of lending activity is total market activity, which covers all three categories of home loans (purchase, refinance, and home improvement). By far the most significant loan activity in the County was for the purposes of refinancing an existing loan (68.7 percent) followed by mortgages for home purchases (23.5 percent). It is not surprising that refinance loans are so significant since they are thought of as a common way for homeowners to access cash.
Table 15. Depository Institutions in Lexington County
Institution Office/
Branches (2009)
Ameris Bank 2
Arthur State Bank 2
Bank of America, National Association 9
Branch Banking & Trust Company 12
Capitalbank 1
Carolina First Bank 8
Congaree State Bank 2
First Citizens Bank & Trust Company 6
First Community Bank, National Association 6
First National Bank of the South 1
First Reliance Bank 3
Regions Bank 2
SCBT National Association 2
Southern First Bank, National Association 1
The National Bank of South Carolina 2
Wachovia Bank, National Association 7
Source: FDIC, 2009

Lexington County, South Carolina Analysis of Impediments to Fair Housing Choice
50
Of all of the loan applications filed with the banks in Lexington County during 2007, white customers accounted for the greatest number, not surprisingly since they also account for more than 80 percent of the County’s population. However, black applicants were nearly 24 percent more likely to have their application rejected because of inappropriate debt-to-income ratios, nearly 73 percent more likely to be rejected because of inadequate collateral, more than 58 percent more likely to be rejected because of insufficient cash even though their rejection rates for all other reasons comparable to if not better than that for white applicants. Applicants from
other population groups also suffered from worse rates of rejection in a few cases such as Native Americans and Asians for lack of collateral. The black/white disparity seems to be related to the generally lesser accumulation of wealth among the black applicants, which often is associated with a higher degree of indebtedness.
Table 16. Reasons for Denial by Race
Rac
e
Deb
t-to
-
Inco
me
Rat
io
Em
plo
ymen
t
Cre
dit
Co
llate
ral
Cas
h
Info
rmat
ion
Inco
mp
lete
Mo
rtg
age
Insu
ran
ce
Oth
er
Ap
plic
atio
ns
Native American 12.5% 0.0% 37.5% 37.5% 12.5% 0.0% 0.0% 0.0% 0.0% 8
Asian 22.6% 0.0% 24.5% 37.7% 3.8% 0.0% 11.3% 0.0% 0.0% 53
Black 20.3% 1.0% 34.4% 17.2% 1.6% 4.2% 7.3% 0.0% 14.1% 576
Hawaiian/Pacific Islander
0.0% 0.0% 0.0% 0.0% 0.0% 0.0% 0.0% 0.0% 100.0% 4
White 16.4% 1.4% 33.5% 21.8% 2.4% 4.1% 7.3% 0.2% 12.8% 7,995
Applicants for both refinance and home improvement loans already have histories as borrowers and have equity in their homes. For these reasons, securing additional financing ought to be easier. There are, in fact, two types of home refinance loans. One involves borrowing funds in the amount of the existing mortgage at a lower interest rate so that the homeowner’s monthly mortgage payment is lower. Certainly, this type of loan is favorable, since the homeowner will be better able to afford remaining in the home and will continue to support the community. The second type is one in which the homeowner extracts accumulated equity in order to afford a large-ticket expense, such as a wedding or a new vehicle, or to consolidate accumulated smaller debts. This type of refinance can be viewed less favorably, since the owner is disinvesting in the property by withdrawing his accumulated wealth. From a lender’s point of view, the reduced owner’s equity represents a higher risk for the lender.
Figure 13. Applications by Loan Purpose

Lexington County, South Carolina Analysis of Impediments to Fair Housing Choice
51
Table 17. Reasons for Denial by Loan Purpose
Lo
an P
urp
ose
Deb
t-to
-
Inco
me
Rat
io
Em
plo
ymen
t
Cre
dit
Co
llate
ral
Cas
h
Info
rmat
ion
Inco
mp
lete
Mo
rtg
age
Ins.
Oth
er
Home Mortgage 17.0% 3.5% 34.5% 12.9% 5.5% 7.5% 8.7% 0.1% 10.3%
Home Improvement 7.4% 0.5% 65.8% 15.3% 0.0% 0.5% 2.2% 0.5% 7.7%
Refinance 16.4% 0.5% 27.8% 27.8% 0.5% 2.5% 6.6% 0.1% 17.8%
Home improvement loan applications historically have the highest rate of denials, but this could be due to the fact that there is no separate category for reporting second mortgages and equity-based lines of credit, and lenders use the Home Improvement category to report this activity.
Table 18. Denials by Loan Purpose
Loan Purpose Denials % Denials Total % Total Denials/Total
Home Mortgage 3,125 30.8% 10,258 23.5% 30.5%
Home Improvement 668 6.6% 3,412 7.8% 19.6%
Refinance 6,353 62.6% 30,033 68.7% 21.2%
Although home improvement loans may be a means for financially ailing homeowners to generate funds for needed repairs, in 2007 the denial rate for this type of loan was 19.6 percent. An important consideration in this area is the fact that more than one-half (56.2 percent) of Lexington County’s housing stock is over 30 years old. Reinvestment in the form of home improvement is crucial to maintaining the supply of homes. Furthermore, without improvements, homeowners will be unable to command a fair market value once they decide to sell. Rising denial rates on these types of loans may reflect changing policies in the lending industry, but this is an area that warrants some attention in Lexington County. The associated disinvestment can have an undesirable effect on the community when it occurs in great numbers.
When loans are denied, lenders record the reasons for these decisions. The chart above shows the percent of denials by reason for 2007 for all loans of all types. Overall, the most common reason for denying loans is the applicant’s credit history.
Foreclosures Issues
The areas in and around the southeastern Lexington County communities of Gaston and Swansea have seen some of the most highest foreclosure activity in the 18 months between January 2007 and June 2008. The towns and environs of Lexington and Red Bank have also experienced relatively heavy foreclosure activity, as have Irmo and Seven Oaks in the communities in the northern end of the County near Lake Murray.

Lexington County, South Carolina Analysis of Impediments to Fair Housing Choice
52
Figure 14. Estimated Number of Foreclosures (January 2007 - June 2008)
In those developing areas in southeastern Lexington County where the incidence of foreclosures has been high (87), there is also high minority population concentration (22 percent). This is also the area of recent development, some of which was undoubtedly first time home buyer which most likely was impacted by the recent difficulties with predatory lending and sub-prime loans. Other areas of significant minority population, most notably immediately adjacent to the City of Columbia on the County’s eastern border with a 43 percent minority population, suffered a relatively modest 44 foreclosures between January 2007 and June 2008. Within the western portions of the City of Lexington and its environs, 56 foreclosures were recorded in this area of 27 percent minority population. The West Columbia area with a 44 percent minority population only experienced 23 foreclosures. However, the areas immediately south of Lake Murray where the minority population is 15 percent suffered 138 foreclosures.

Lexington County, South Carolina Analysis of Impediments to Fair Housing Choice
53
Figure 15. Percent Minority Population
Alternative Lending Sources
While conventional lenders focus their marketing efforts on consumers with few or no credit blemishes (those with “A” credit), an alternative source of loan funds for consumers with lower credit scores (“B” or “C” credit) is sub-prime lending institutions. Borrowers find the application process easier, and the loan approval quicker and more certain when dealing with these institutions. Although this is true sub-prime lenders charge higher interest rates to help mitigate the increased risk in lending to consumers with poorer credit histories. Interestingly, consumers who borrow from sub-prime lenders often do qualify for loans from conventional lenders, but succumb to marketing tactics that encourage them choose sub-prime institutions over conventional. Recent studies by Freddie Mac, the Government Sponsored Entity that purchases mortgages from lenders and packages them into securities that are sold to investors, show that between 25 percent and 35 percent of consumers receiving high cost loans in the sub-prime market qualify for conventional loans. This may be a result of the loss of conventional lenders in the community. Having fewer lenders from which to choose, consumers select those that are conveniently located, even at a higher price.
Another source of loans is check cashing or “payday” lenders. Check cashing outlets (such as currency exchanges) cash payroll, government and personal checks for a fee. Their popularity increases as customers lose access to banks or cannot afford rising fees associated with the inability to maintain minimum balance requirements. Consumers use these outlets for their banking needs and are charged for the services they receive. These businesses offer temporary “payday loans” by accepting a postdated check from the customer, who receives the funds

Lexington County, South Carolina Analysis of Impediments to Fair Housing Choice
54
immediately, minus a fee. When used regularly, these fees can equate to double-digit interest rates.
Although these services tend to be located in areas of highest minority and low-income concentration, they are also found in very close proximity to local lenders. Customarily, however, they fill the void left by banks that have moved from the area.
While most sub-prime lenders serve a need by targeting borrowers with sub-par credit histories, some go too far. Those that do are known as predatory lenders. Lending becomes predatory when lenders target specific populations (such as low-income, minority, or elderly homeowners), charge excessive fees, frequently refinance the loan, and often mislead the borrower. Since wealth is often tied to property ownership, this system threatens to deprive residents of their assets by overextending their home’s equity and, in some cases, foreclosing on the homes of people who cannot afford the high interest rates and associated fees.
Mainstream financial institutions often unwittingly exclude the very groups targeted by predatory lenders when they market loan products. Additionally, unknowing consumers find themselves in devastating positions due to a lack of financial savvy. The lending process can be complicated and often consumers are ill prepared to deal with the large volume of paperwork required for the loan process. Most predatory lenders, however, do not provide quality counseling for consumers seeking their products and use the consumers’ ignorance as their opportunity to reap profits. In the end, borrowers pay substantially higher interest rates and purchase unnecessary credit, life and disability insurance products.
Homeowners Insurance
Fair housing is about expanding the housing choice for those restricted by economic, social, political and other forces. The persistence of unfair housing underlies unequal education, unequal access to jobs, unequal income, and redlining.
Redlining is an exclusionary practice of realtors, insurance companies and financial institutions that exists when there is a lack of activity by [an] institution to extend credit or coverage to certain urban neighborhoods because of their racial composition; or they are denied because of the year-to-year change in racial composition and the age of structure in a neighborhood regardless of the creditworthiness or insurability of the potential buyer and policy holder or the condition of the property.
Over 30 years ago, an observation was made that “insurance is essential to revitalize our [American] cities. It is the cornerstone of credit. Without insurance, banks and other financial institutions will not—and cannot—make loans. New housing cannot be repaired. New businesses cannot expand, or survive. Without insurance, buildings are left to deteriorate, and services, goods and jobs diminish.”17 This statement can accurately describe many cities in
17
National Advisory Panel on Insurance in Riot Affected Areas, 1968.

Lexington County, South Carolina Analysis of Impediments to Fair Housing Choice
55
2009 as well as those in 1968. Investigations and statistical and applied research throughout the United States has shown that residents of minority communities have been discouraged in pursuit of homeownership, while many predominantly white neighborhoods have been successful in attracting those seeking the American dream of owning a home.
Discrimination in the provision of housing insurance has a lasting effect on the vitality of America’s neighborhoods. Many traditional industry underwriting practices which may have some legitimate business purpose also adversely affect minorities and minority neighborhoods. While more recent studies have found little evidence of differential treatment of mortgage applications, evidence does suggest that lenders may favor applicants from Community Reinvestment Act (CRA)-protected neighborhoods if they obtain private mortgage insurance (PMI). The requirement of obtaining this additional type of insurance may actually mask lender redlining of low-income and minority neighborhoods. For loan applicants who are not covered by PMI, there is strong evidence that applications for units in low-income neighborhoods are less likely to be approved. Furthermore, these potential homeowners are more likely to be subject to policies that provide more limited coverage in case of a loss, and are likely to pay more for comparable policies.
Advertising
In the context of fair housing, discriminatory advertising is any advertising that indicates any preference, limitation, or discrimination based on race, color, religion, sex, handicap, familial status or national original, or an intention to make any such preference, limitation, or discrimination. Overt or tacit discriminatory preferences or limitations are often conveyed through the use of particular words, phrases or symbols must be avoided.

Lexington County, South Carolina Analysis of Impediments to Fair Housing Choice
56
SECTION VI: CONCLUSIONS AND RECOMMENDATIONS
1. Limited Affordable Housing
When there is limited affordable housing lower income populations may be forced into
substandard housing. Other households will look to alternative housing options—such as
doubling up where households combine to cut housing expenses. When forced to live in
housing in poor condition, it leads to disparate treatment of protected class families and
individuals.
While there may not be enough affordable housing, there are steps Lexington County can
continue to take that help to make moderately priced housing affordable to lower income
households. These include continuing to provide assistance to community housing
development organizations (CHDOs) and continuing homebuyer assistance programs that bring
the price of housing within reach of many more households. The County should also continue
to encourage area nonprofit organizations to develop affordable housing options. Finally, for
lower income homebuyers, homebuyer education and counseling are critical. Promotion of
programs that help prospective borrowers understand all aspects of the home buying and
maintenance process will encourage a higher rate of successful homeownership.
2. Lack of Awareness Concerning Discrimination and Fair Housing
Public education regarding the rights and responsibilities afforded by fair housing laws is a
critical element towards the promotion of fair housing opportunities and enforcement. This
includes the education of housing and financial providers, as well as citizens. Everyone needs to
know what may constitute a violation and what they can do if they feel they have been
discriminated against. It is also important that lenders, housing providers, and their agents
understand their responsibilities and when they may be violating fair housing laws.
Education is a key element to ensure fair housing choice. It is imperative that individuals and
families seeking housing know their rights and responsibilities and that those involved in the
housing industry understand their rights and responsibilities, as well. The County should
continue its efforts to educate the public through Fair Housing Month activities and through
homebuyer education and counseling programs. The County should also work with lenders,
housing providers, and their agents to provide training on fair housing laws to ensure they
know and comply with their responsibilities.

Lexington County, South Carolina Analysis of Impediments to Fair Housing Choice
57
3. Limited Housing Options for Homeless and Special Needs Populations
For those that are homeless or have special needs, limited permanent housing options are
available. In addition, many citizens may be on the brink of becoming homeless because they
have to spend too much of their income on housing (many times not decent or safe housing).
In addition to encouraging the development of affordable housing, Lexington County should
continue to actively engage local nonprofit organizations that provide permanent affordable
housing options for the homeless and special needs populations. Programs that increase family
self-sufficiency and prepare homeless and special needs populations to transition into
permanent housing opportunities—such as financial literacy, credit counseling, and rental
assistance—are vital and needed. Additionally, continued intra-government coordination and
collaboration among regional and adjacent agencies will help Lexington County to identify
housing needs and mobilize resources to meet those needs.
4. Insufficient Energy Efficiency
A lack of energy efficiency increases utility costs and can make otherwise affordable housing
too expensive to maintain. Drafty windows and doors, little or no insulation, and/or a lack of
shade can increase heating and cooling costs leading tenants and homeowners to go without
air conditioning in the summer or to use space heaters in the winter—both of which can
compromise health and safety. This is particularly concerning for those in manufactured
housing, which is generally less energy efficient and occupied by lower income households.
By providing information on making energy efficient improvements, Lexington County can help
its citizens, especially those most in need, lower utility costs. The County should also continue
its education efforts toward mobile home park operators to encourage landscaping and site
planning that contribute to energy efficiency.
5. Limited Public Transportation
The Central Midlands Regional Transit Authority (CMRTA) provides limited public transportation
routes within Lexington County. As a result, public transportation is not widely used by county
residents. For some populations, limited availability to public transportation, coupled with
housing burdens, can impede access to job opportunities.
Lexington County along with its regional government partners should continue efforts to
explore public transportation needs in an effort to improve mobility options for residents. The

Lexington County, South Carolina Analysis of Impediments to Fair Housing Choice
58
County and its regional government partners should also address issues of growth, traffic
congestion, economic development, air quality, and quality of life as relates to public
transportation.
6. Excessive Loan Denials
The rates of rejection for loan applications were higher among black applicants than white
applicants due to inappropriate debt-to-income ratios, inadequate collateral, and insufficient
cash. Applicants from other population groups also suffered from worse rates of rejection in a
few cases such as Native Americans and Asians for lack of collateral. The black/white disparity
seems to be related to generally lesser accumulation of wealth among the black applicants,
which often is associated with a higher degree of indebtedness.
Work is needed to decrease the rate of loan denials among low-income and minority residents.
Efforts the County can take include encouraging and supporting homebuyer education and
counseling programs. This includes ensuring creative outreach to those most at risk. The County
should also continue to monitor Home Mortgage Disclosure Act data on a regular basis to
identify and address changes or patterns in lending practices that impact low-income, minority,
and special needs households.
7. Lack of Education
Fair housing is about expanding the housing choice for those restricted by economic, social,
political and other forces. The persistence of unfair housing underlies unequal education,
unequal access to jobs, unequal income, and redlining. As such, efforts to improve educational
and skill levels while recruiting jobs that pay above minimum wages is warranted.
Because a public education that produces an employable workforce with higher earning
potential will help improve creditworthiness of future homebuyers, the public school system
needs to ensure that tomorrow’s residents have the skills needed to be competitive in the job
marketplace, as well as to be educated consumers armed with skills to make informed
decisions. Lexington County also should continue to encourage efforts to increase access to
advanced training and education opportunities. In addition, the County should continue to
work with economic development organizations to encourage the recruitment of higher-wage
jobs particularly to less developed areas of the county.