Analysis of Government Education in Chandigarh: A calculation of Per Capita Expenditure. Edu Exp...
33
Centre for Civil Society 1 Analysis of Government Education in Chandigarh: A calculation of Per Capita Expenditure - Shruthi Jayaram Introduction This project aims to analyze the efficiency and the efficacy of government spending on education in the Union Territory of Chandigarh, with special regard to elementary and secondary education. It calculates per capita expenditure on education in schools, with disaggregates of elementary and secondary per capita education expenditure. The Elementary education system in India is the second largest in the world. The 10+2 system is the system adopted by all the states/UT’s in the nation. Education in India is basically divided into four stages, although there still exist variations in the number of classes constituting the Primary, Upper Primary, High and Higher Secondary school stages, age for admission to class I, medium of instruction, public examinations, teaching of Hindi and English, number of working days in a year, academic session, vacation periods, fee structure, and compulsory education. With specific regard to the Union Territory of Chandigarh, primary education consists of standard I-V, middle education of standard VI-VIII, secondary education of standard IX-X and senior secondary education of standard XI-XII. Elementary education is from standard I-VIII, secondary from IX-X and senior secondary from XI-XII. The minimum age for admission into primary school is 6+. Teaching of Hindi and English is compulsory, and there is no minimum age prescribed for writing of secondary education (standard X) examinations. This is in contrast with most other states/UT’s where this varies between 14+ and 16+ years. Chandigarh has come a long way in the education scenario, with an overall literacy rate of 81.76% 1 , as covered by the 2001 census, which is considerably higher than the nation wide average of 65%. Its rural-urban literacy split is also suggestive of a relatively efficient education system, the figures being, again, considerably greater than the national average. School structure in Chandigarh As in most states in the country, schools in Chandigarh can be classified into private, government and centrally sponsored schools. In the third category come Navodaya Vidyalayas (1), and Kendriya Vidyalayas (8). Currently, there are 105 government schools and around 40 private schools in Chandigarh 2 There are two boards functioning in the union territory of Chandigarh, the Central Board of Secondary Education (CBSE) and the Indian School Certificate (ISC). Of these boards, the CBSE incorporates both government and private schools, whereas the ISC board has only private schools attached to it. As on 2004-5, there are 28 government and 17 private schools (Senior Secondary) and 104 government and 36 private schools (Secondary) under the CBSE board, and 5 private schools under the ISC Board. 1 About Chandigarh. http://sampark.chd.nic.in/pls/esampark_web/chandigarh. Accessed on 13 June, 2005 2 District Education Officer. 10 June, 2005. Memo No. DEO/UT/Stat/2005/6891-93. Statistics Division, District Education Office. Chandigarh
Transcript of Analysis of Government Education in Chandigarh: A calculation of Per Capita Expenditure. Edu Exp...

Centre for Civil Society 1
Analysis of Government Education in Chandigarh: A calculation of Per Capita Expenditure
- Shruthi Jayaram
Introduction
This project aims to analyze the efficiency and the efficacy of government spending on education in the Union Territory of Chandigarh, with special regard to elementary and secondary education. It calculates per capita expenditure on education in schools, with disaggregates of elementary and secondary per capita education expenditure.
The Elementary education system in India is the second largest in the world. The 10+2 system is the system adopted by all the states/UT’s in the nation. Education in India is basically divided into four stages, although there still exist variations in the number of classes constituting the Primary, Upper Primary, High and Higher Secondary school stages, age for admission to class I, medium of instruction, public examinations, teaching of Hindi and English, number of working days in a year, academic session, vacation periods, fee structure, and compulsory education. With specific regard to the Union Territory of Chandigarh, primary education consists of standard I-V, middle education of standard VI-VIII, secondary education of standard IX-X and senior secondary education of standard XI-XII. Elementary education is from standard I-VIII, secondary from IX-X and senior secondary from XI-XII. The minimum age for admission into primary school is 6+. Teaching of Hindi and English is compulsory, and there is no minimum age prescribed for writing of secondary education (standard X) examinations. This is in contrast with most other states/UT’s where this varies between 14+ and 16+ years.
Chandigarh has come a long way in the education scenario, with an overall literacy rate of 81.76%1, as covered by the 2001 census, which is considerably higher than the nation wide average of 65%. Its rural-urban literacy split is also suggestive of a relatively efficient education system, the figures being, again, considerably greater than the national average.
School structure in Chandigarh
As in most states in the country, schools in Chandigarh can be classified into private, government and centrally sponsored schools. In the third category come Navodaya Vidyalayas (1), and Kendriya Vidyalayas (8). Currently, there are 105 government schools and around 40 private schools in Chandigarh2
There are two boards functioning in the union territory of Chandigarh, the Central Board of Secondary Education (CBSE) and the Indian School Certificate (ISC). Of these boards, the CBSE incorporates both government and private schools, whereas the ISC board has only private schools attached to it. As on 2004-5, there are 28 government and 17 private schools (Senior Secondary) and 104 government and 36 private schools (Secondary) under the CBSE board, and 5 private schools under the ISC Board.
1 About Chandigarh. http://sampark.chd.nic.in/pls/esampark_web/chandigarh. Accessed on 13 June, 2005 2 District Education Officer. 10 June, 2005. Memo No. DEO/UT/Stat/2005/6891-93. Statistics Division, District Education Office. Chandigarh

Centre for Civil Society 2
Government Schools in Chandigarh: An overview
Government schools in Chandigarh are funded entirely directly by the Central Government and Government grants, along with nominal fee collections (A student pays around Rs 20 per month at a premium government schools, even this nominal fee has substantial subsidies and discounts attached) and endowments. Details of this funding can be seen in the Detailed Demand for Grants Documents, which is a budget estimate put forth to the Lok Sabha on an annual basis, as well as the financial statements of the District Education Office, U.T Secretariat.
Government Schools in Chandigarh are uniformly under the CBSE system. But, they also administer a board examination at the Standard VIII as well as the standard V level, which is conducted by the Union Territory Board of Chandigarh. This board holds this exam at all Government Schools and serves as a standard for academically weaker students to measure up to before they are allowed to sit for CBSE board examinations. This is a unique and efficient system; as it effectively screens out incompetent students at the standard IX level itself, leading to better results. Criticism of this include that it is not strictly necessary, and therefore is unwarranted expense, it is administered too early (the age of ten) and that it serves as discouragement to weak students to the continuance of education.3 The UT board follows CBSE syllabus, but has a separate board of paper-setters. The exam procedures are handled by the District Education Office. Admission procedures in government schools are centralized, as are teacher recruitments. The DEO handles all admissions, which (especially at the standard XI level) are accorded strictly on merit and preference bases.
Subsidies: Even with the nominal fees, there are many subsidies granted at government schools. Girl children are educated at zero tuition fees from standard I through standard XII. Admission fees are waived for girl students from standard I to standard V. Students belonging to SC/ST classes are given a 50% subsidy on both tuition and admission fees through classes I-XII. Merit awards and scholarships are awarded to deserving students.
Method of Funding: Even though the funding for Government schools is done by the Central Government, it has to go through the District Education Office and the Directorate of Public Instruction. Funds up to Rs 5000 are at the discretion of the Principal, and any amount exceeding that has to be appealed for by the school to the District Education Office (DEO). The DEO checks the demand, and if approved, forwards it to the Directorate of Public Instruction (DPI), which draws the funds and sends it to the school. The whole process takes between one to two weeks. An audit is conducted every three years to regulate spending and introduce accountability into the system.
Model Schools vs. Non-Model Schools: There are two types of government schools in Chandigarh, Model and Non- Model. Both of these come under the CBSE Board, and differ principally in the medium of instruction (English in Model schools and Hindi and Punjabi in non-Model schools). There are 47 Model and 57 non-Model schools in Chandigarh. It is seen that the results of these schools are drastically different, with model schools on par with private schools and non-Model schools putting in a pretty dismal performance (see table). The two kinds of
3 Sharma, C M. 2005. Interview by author. Verbal Interview. Jawahar Navodaya Vidyalaya, Sector 25, Chandigarh. June 28, 2005

Centre for Civil Society 3
schools are, however, regulated by the same authorities and receive roughly the same amount in the form of government grants and aid.
Non-Model Schools Model Schools Total Pass Percentage 65.61 87.52 74.61
Candidates appeared 7049 4951 12000 No. Passed 4686 4354 9040 No. Failed 2363 597 2960
(Results of the Standard VIII examination conducted by the UT Board 2005)4
Sarva Shiksha Abhiyaan
“Sarva Shiksha Abhiyan (SSA) is Government of India's flagship programme for achievement of Universalisation of Elementary Education (UEE) in a time bound manner, as mandated by 86th amendment to the Constitution of India making free and compulsory Education to the Children of 6-14 years age group, a Fundamental Right.”5 SSA has been implemented in the Union Territory of Chandigarh since 2003-4. There are over 400 SSA centres across the city, but there are no specific schools funded by this scheme. Rather, this scheme involves volunteers and part time teachers to spread awareness about the necessity for elementary education to the people of Chandigarh. Schools lacking teachers are provided with extra teachers, workshops and other teacher training programs are conducted, and computer literacy encouraged. The volunteers work mainly in slum areas and other financially backward areas and conduct programs like evening classes for adults, free extra coaching etc. An average SSA volunteer is paid Rs 8000 a month for services rendered. This payment is funded directly under the Centrally sponsored SSA scheme. SSA approvals for the year 2003-4 for the Union Territory of Chandigarh were Rs 598.77 lacs.6
Jawahar Navodaya Vidyalayas
Jawahar Navodaya Vidyalayas are a unique initiative of the Central Government to promote higher education among the rural talented children. They were launched in 1985 as the brainchild of Rajiv Gandhi and the aim was the setting up of a JNV in every district of the country. So far, there have been 510 JNV’s set up across the country. JNV’s offer education at standard VI-XII level and 75% of their seats are reserved for rural children and the only criterion for admission is an entrance test at the standard VI level that is conducted by the CBSE.
JNV Chandigarh is among the top JNV’s in the nation, with consistently good results over the past five years. It is affiliated to the CBSE Board and is a 100% residential school. It is 100% funded by the Government, i.e. the students pay no fees for academics, boarding, lodging and the like. It comes directly under the Ministry of Human Resource Development and is thus not required to go through the state/UT education department. It does not, therefore, administer the standard V and VIII examinations conducted by the UT Board. A brief profile of JNV Chandigarh is attached in the appendix.
4 Tribune Correspondents. 2 April, 2005. The Tribune. Chandigarh Edition. 5 Mission statement, Sarva Shiksha Abhiyaan, Government of India 6 Data from table of SSA approvals, http//ssa.nic.in. Accessed on June 15, 2005.

Centre for Civil Society 4
An interesting policy of the JNV’s is the student exchange program adopted in standard IX. 30% of the children are chosen on a lot basis and are sent for a years study to a sister JNV across the country. This is a free program conducted in the interests of cultural exchange and exposure!
Kendriya Vidyalayas
This is another initiative of the Central Government to cater to the educational needs of the children of Central Government employees. It is an attempt to provide uniform education to these children whose parents are subject to frequent transfers, and is now open to civilians as well. Kendriya Vidyalayas also come straight under the Ministry of Human Resource Development and are 100% government funded, i.e. the students are required to pay minimum tuition fees. They provide education at standard I-XII level. There are eight KV’s in Chandigarh. A brief profile of the KV’s in Chandigarh is provided at the appendix.
Questions to be answered
The first question to be answered is “What constitutes expenditure on education?” While the expenditure by the Department of Education does form a major chunk of education expenditure, the other departments like the Ministry of Home Affairs, and the Department of Welfare also spend on education. These figures are significant when it comes to the calculation of overall expenditure on education.
The second question is, is this expenditure justified? How much, on average, does it actually cost to provide children with education of the quality provided by government schools? Does this figure match the per capita estimated and actually spent amount? In this regard, an educated comparison with the expenditure of an average private school may prove useful. This study evaluates the per capita expenditure of 5 prominent private schools in Chandigarh and compares the government figure so obtained.
What are the trends in the results of these schools? A surprising figure obtained from the CBSE Regional Office, Chandigarh, says that in the academic year 2004-5, the pass percentages in standard XII in government schools in the U.T was 85.64%, which is almost 5% more than in private schools (79.19%)7. This is in contrast with CBSE results in almost every other part of the nation in 2004-5. What are the possible reasons for this? Interviews with Meenakshi Mohindra, the principal of a leading private school in Chandigarh, C M Sharma, Principal of JNV Chandigarh and A K Malhotra, Office-in-charge, GMHSS – 16, throw some light on this. What are the trends in the other indicators of school performance like drop out ratios, and teacher student ratios?
In contrast, the CBSE Standard X results for the academic year 2004-5 are reverse indicators. The pass percentage for government schools is 56.64% as contrasted with 85.81% for private schools8. What does this indicate? Why is there such a large discrepancy between secondary and senior secondary education?
This project hopes to analyze and answer all these questions. Data with regard to enrolment ratios, pass percentages, and trends in the same are examined and analyzed. Also, data with regard to government expenditure on education is derived from the Detailed Demand for Grants
7 2005. Press note issued by CBSE. 19 May, 2005. CBSE Regional Office, Chandigarh 8 2005. Press note issued by CBSE. 19 May, 2005. CBSE Regional Office, Chandigarh

Centre for Civil Society 5
documents for the years 1999-00 to 2005-6 and imputed into the calculation of per capita expenditure.
Demand for Grants
In pursuance of Article 113 of the Constitution, the estimates of expenditures from the Consolidated Fund are submitted in the form of the Demand for Grants documents. For Union Territories without legislature (such as Chandigarh), a separate Demand is presented. Each Demand normally includes the total provisions required for a service, that is, provisions on account of revenue expenditure, capital expenditure, grants and also loans and advances relating to the service. Two kinds of expenditure is shown in the Demand for Grants, “voted” and “charged”. “Voted” expenditure is that which requires parliamentary vote and “charged” expenditure is that which does not. It contains the estimated demand for the forthcoming financial year, as well as the actual amount spent in the previous financial year, and the estimates and the revised estimates in the current financial year. It lists out each Departments spending, and goes into details of the scheme for which the amount is being spent, as well as the break up of the spending under each scheme. Expenditure is also classified into “plan” and “non-plan”. Capital expenditure such as building and major works comes under Plan expenditure, whereas teacher’s salaries and other recurring expenditure come under non-plan.
The analysis The first question that will be addressed is what determines expenditure on education? This project uses the following as the base expenditures on education. These are derived from the Demand for Grants documents. Expenditure on Primary Education
1. Expenditure by the Ministry of Home Affairs on Education: (Major Head 2202, 01.227) Scholarships, and Scholarships and Stipends to children of Vulnerable groups among SC’s
2. Expenditure by the Department of Elementary Education And Literacy (Major Head 2202) on Direction and Administration: Salaries, Medical Treatment (if applicable), office expenses, rent, rates, taxes, publication, supplies and material, scholarships and stipends and other charges.
3. Expenditure by the Department of Elementary Education And Literacy (Major Head 2202, 01.102) on Assistance to Non-Government Primary Schools, by way of Grants in aid
4. Expenditure by the Department of Elementary Education And Literacy (Major Head 2202, 02 on the State Institute of Education, Sector 32, Salaries, Medical Treatment, Office Expenses and Publication.
5. Expenditure by the Department of Elementary Education And Literacy (Major Head 2202, 01.800) on Other expenditure and Other Schemes
6. Expenditure by the Department of Elementary Education And Literacy (Major Head 2236, 02.102) on mid day meals
7. Capital Expenditure on Building and Major Works (Major Head 4402) Expenditure on Secondary Education 8. Expenditure by the Department Of Secondary And Higher Education (Major Head 2202,
02.101) on Inspection: Establishment, salaries, medical treatment and office expenses 9. Expenditure by the Department Of Secondary And Higher Education (Major Head 2202,
02.109) on Government Secondary Schools: Salaries, Medical Treatment, Office Expenses, supplies and material

Centre for Civil Society 6
10. Expenditure by the Department Of Secondary And Higher Education (Major Head 2202, 02.110) on Assistance to Non-Govt Secondary Schools by way of grants in aid.
11. Expenditure by the Department Of Secondary And Higher Education (Major Head 2202, 02.107 on State Merit Scholarships
12. Expenditure by the Department Of Secondary And Higher Education (Major Head 2202, 02.800) on Other Expenditure, Teachers Training, Lump Service, and Vocational Courses
13. Capital Expenditure by the Department of Education (Major Head 4202) on Major Works, Elementary and Secondary Schools.
Thus, with these estimates the total actual expenditure on education was calculated for the years 2003-4, 2002-3 and 2001-2 and the total estimated expenditure for the years 2005-6, 2004-5 and 2003-4, split up for primary and secondary education
Expenditure (All data in thousands of Rupees)
2005-6 2004-5 2003-4 2002-3 2001-2 2000-1
Estimate (Primary) 533375 438110 395474 332530 315124 309299 Estimate (Secondary) 340650 314648 285480 271810 256370 252498
Estimate (Total) 874025 752758 680954 604340 571494 561797 Actual (Primary) NA NA 414181 363758 310415 300977
Actual (Secondary) NA NA 296129 287352 255920 256976 Actual (Total) NA NA 710310 651110 566335 557953
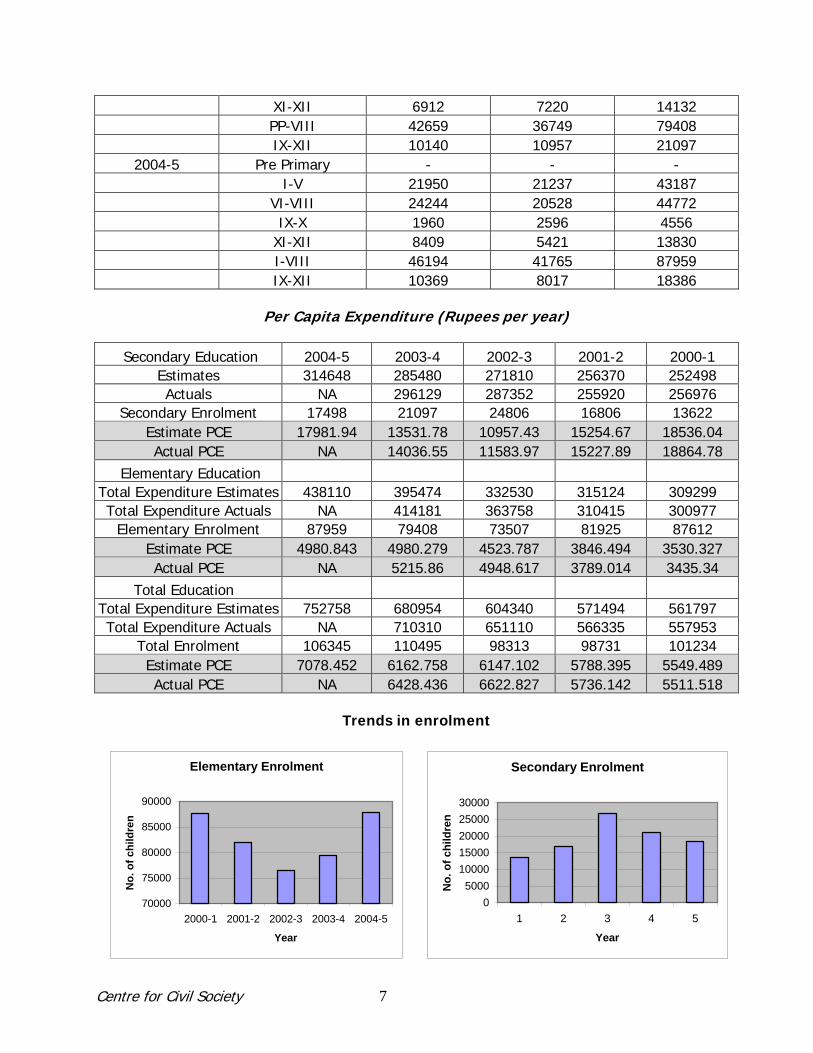
Enrolment information for Government Schools in Chandigarh is given below9
Year Standard Boys Girls Total 2000-1 Pre Primary 2833 2259 5092
I-V 22510 19774 42284 VI-X 21698 19956 41654 XI-XII 5613 6591 12204 PP-VIII 46487 41125 87612 IX-XII 6167 7455 13622
2001-2 Pre Primary 2816 2299 5115 I-V 21198 18614 39812 VI-X 21918 20001 41919 XI-XII 5548 6337 11885 PP-VIII 43285 38640 81925 IX-XII 8195 8611 16806
2002-3 Pre Primary 3212 2563 5775 I-V 23818 20805 44623 VI-X 21149 19430 40579 XI-XII 5869 6562 12431 PP-VIII 40673 35781 76454 IX-XII 13375 13579 26954
2003-4 Pre Primary - - I-V 21778 18594 40372 VI-X 24109 21892 46001
9 Statistics of Education in States: Numerical Data, Form ES-I, Ministry of HRD, Government of India
Centre for Civil Society 7
XI-XII 6912 7220 14132 PP-VIII 42659 36749 79408 IX-XII 10140 10957 21097
2004-5 Pre Primary - - - I-V 21950 21237 43187 VI-VIII 24244 20528 44772 IX-X 1960 2596 4556 XI-XII 8409 5421 13830 I-VIII 46194 41765 87959 IX-XII 10369 8017 18386
Per Capita Expenditure (Rupees per year)
Secondary Education 2004-5 2003-4 2002-3 2001-2 2000-1
Estimates 314648 285480 271810 256370 252498 Actuals NA 296129 287352 255920 256976
Secondary Enrolment 17498 21097 24806 16806 13622 Estimate PCE 17981.94 13531.78 10957.43 15254.67 18536.04 Actual PCE NA 14036.55 11583.97 15227.89 18864.78
Elementary Education Total Expenditure Estimates 438110 395474 332530 315124 309299 Total Expenditure Actuals NA 414181 363758 310415 300977
Elementary Enrolment 87959 79408 73507 81925 87612 Estimate PCE 4980.843 4980.279 4523.787 3846.494 3530.327 Actual PCE NA 5215.86 4948.617 3789.014 3435.34
Total Education Total Expenditure Estimates 752758 680954 604340 571494 561797 Total Expenditure Actuals NA 710310 651110 566335 557953
Total Enrolment 106345 110495 98313 98731 101234 Estimate PCE 7078.452 6162.758 6147.102 5788.395 5549.489 Actual PCE NA 6428.436 6622.827 5736.142 5511.518
Trends in enrolment
Elementary Enrolment
70000
75000
80000
85000
90000
2000-1 2001-2 2002-3 2003-4 2004-5
Year
No.
of c
hild
ren
Secondary Enrolment
05000
1000015000200002500030000
1 2 3 4 5
Year
No.
of c
hild
ren

Centre for Civil Society 8
Source: District Education Office, Chandigarh As can be seen from the graphs, enrolment in Chandigarh has been fluctuating pretty wildly, with secondary enrolment reaching a peak, whereas elementary enrolment dipping to a trough.
Trends in total expenditure and per capita expenditure
Total Elementary Expenditure
050000
100000150000200000250000300000350000400000450000500000
2004-5
2003-4
2002-3
2001-2
2000-1
Year
Rup
ees
(in th
ousa
nds)
Estimates Actuals
Total Secondary Expenditure
0
50000
100000
150000
200000
250000
300000
350000
2004-5
2003-4
2002-3
2001-2
2000-1
Year
Rup
ees
(in th
ousa
nds)
EstimatesActuals
Source: District Education Office, Chandigarh The government has clearly been factoring in enrolment trends in both budgeted and actual expenditures. It has been raising expenditures constantly, both in the elementary and secondary sections. The rise in secondary expenditure can be accounted for by the theory of adaptive expectations. Expenditure is generally budgeted on the basis of last year’s enrolment figures, as the estimates are calculated on 31st March and enrolment on 30th September of any given year. The government was unable to predict the extent of the rise in enrolment and therefore kept raising the expenditure, but could not keep up with the rise in enrolment (as is shown by the secondary PCE graphs). When there was a fall in 2003-4 and 4-5, the government actually expected a rise in enrolment, and therefore the Per Capita Expenditure rose.
Elementary Per Capita Expenditure
0100020003000400050006000
2004
-5
2003
-4
2002
-3
2001
-2
2000
-1
Year
Rup
ees
per y
ear
Estimate PCActual PC
Secondary Per Capita Expenditure
0
5000
10000
15000
20000
2004
-5
2003
-4
2002
-3
2001
-2
2000
-1
Year
Rup
ees
per y
ear
Estimate PCActual PC
Source: District Education Office, Chandigarh

Centre for Civil Society 9
It can be seen that per capita expenditure on elementary education has been rising in the period 2000-2002, and then has remained more or less constant. In contrast, per capita expenditure on secondary education is more or less proportional to the enrolment graph, total expenditure increasing at a constant pace, with allowances for inflation. The second question to be examined is, is this expenditure justified? This is a subjective question and thus, can be addressed in a variety of ways, including comparison to private schools, quality of education, efficiency of expenditure, and measures of quality of spending such as infrastructure. The first aspect that will be dealt with is a comparison with a private school. The case study adopted for the same is Devan Aggarwal Bhavan Vidyalaya, a leading private school in Chandigarh, affiliated to the Bharatiya Vidya Bhavan Trust and the Central Board of Secondary Education. A brief overview of this school, it’s functioning and why it is suitable for the case study is provided below Devan Aggarwal Bhavan Vidyalaya: Established in 1983, this school has an excellent academic record with a cent percent pass in standard X and XII for the past years and a 98.5% pass percentage overall (across all classes). It has two cells, one for the mentally handicapped and the other for slum children that are fully subsidized. The school does not receive any grants or aids from the government, and is thus fully autonomous. In the academic year 2004-5, the annual expenditure of the school was Rs 126.62 lacs, which works out to a per capita expenditure of Rs 7673.88 per year (inclusive of the two Cells, which have 150 students) or Rs 9044.28 per year (exclusive of the two cells) Thus, it can be seen that, in Chandigarh, a ballpark estimate shows that government spending on education is sufficiently lower than private spending, so when fees, PTA funds etc are incorporated, the two figures are comparable. Most Model schools have an active PTA, and funds are drawn from here to meet school requirements that are not sanctioned by the Government, or are in addition to sanctioned funds. The next question that will be addressed is what is the quality of education provided in these government schools? To answer this, we first need to ask ourselves what the possible indicators for quality of education in schools are. Indicators that suggest themselves are pass percentages and enrolment ratios and pupil teacher ratios. Given below are the pass percentages of model and non-Model government schools for standard X and XII (academic year 2000-2001 to 2004-2005)10 and private schools for the academic year 2004-511
Standard Government PrivateX 56.64% 85.61%
XII 85.64% 79.19%
Year Type of School Standard Appeared Passed Pass Percentage 2000-2001 Model X 2409 1843 76.50
Non-Model X 2990 1045 34.95 Total X 5399 2888 53.49 Model XII 4305 3551 82.49 Non-Model XII 1263 815 64.53
10 Statistics Division, DE Office, UT of Chandigarh 11 2005. Press note issued by CBSE. 19 May, 2005. CBSE Regional Office, Chandigarh
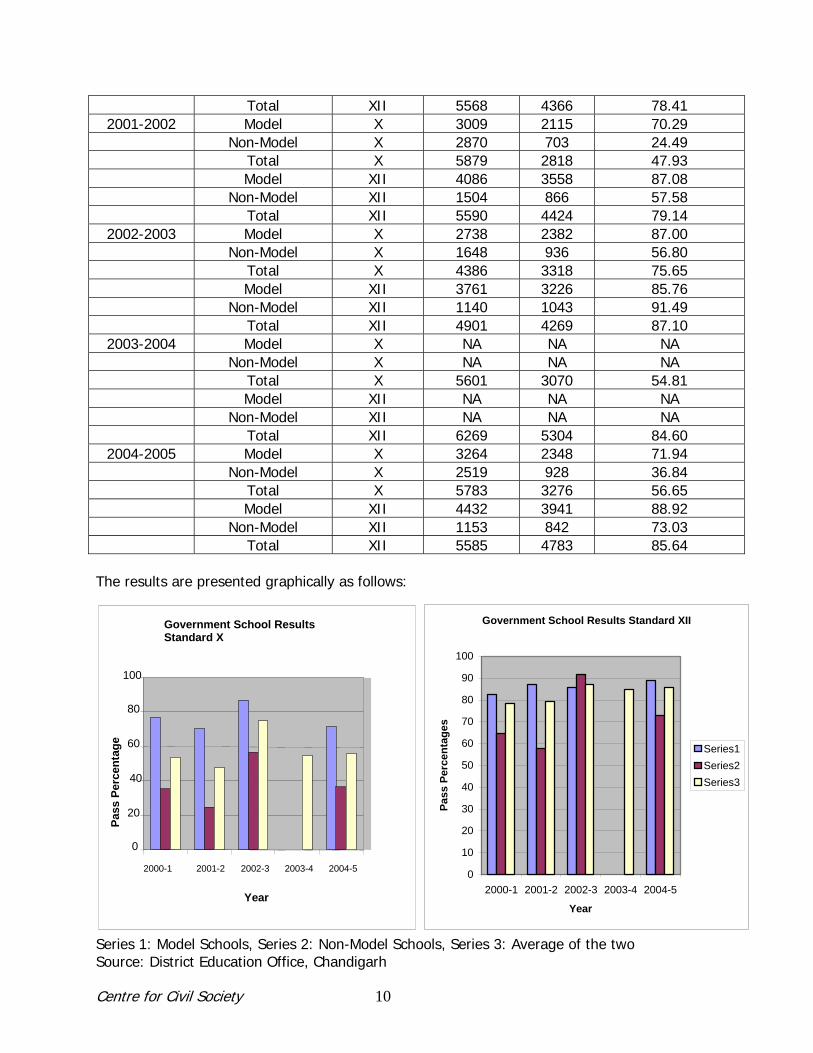
Centre for Civil Society 10
Total XII 5568 4366 78.41 2001-2002 Model X 3009 2115 70.29
Non-Model X 2870 703 24.49 Total X 5879 2818 47.93 Model XII 4086 3558 87.08 Non-Model XII 1504 866 57.58 Total XII 5590 4424 79.14
2002-2003 Model X 2738 2382 87.00 Non-Model X 1648 936 56.80 Total X 4386 3318 75.65 Model XII 3761 3226 85.76 Non-Model XII 1140 1043 91.49 Total XII 4901 4269 87.10
2003-2004 Model X NA NA NA Non-Model X NA NA NA Total X 5601 3070 54.81 Model XII NA NA NA Non-Model XII NA NA NA Total XII 6269 5304 84.60
2004-2005 Model X 3264 2348 71.94 Non-Model X 2519 928 36.84 Total X 5783 3276 56.65 Model XII 4432 3941 88.92 Non-Model XII 1153 842 73.03 Total XII 5585 4783 85.64
The results are presented graphically as follows:
Series 1: Model Schools, Series 2: Non-Model Schools, Series 3: Average of the two Source: District Education Office, Chandigarh
Government School Results Standard XII
0
10
20
30
40
50
60
70
80
90
100
2000-1 2001-2 2002-3 2003-4 2004-5
Year
Pass
Per
cent
ages
Series1Series2Series3
Government School Results Standard X
0
20
40
60
80
100
2000-1 2001-2 2002-3 2003-4 2004-5
Year
Pass
Per
cent
age

Centre for Civil Society 11
What are the possible reasons for the observed trends in the standard XII pass percentages in 2004-5? Ms. Meenakshi Mohindra, Principal of Devan Aggarwal Bhavan Vidyalaya, points out the following reasons
1. There are 19 Model Schools offering Senior Secondary Education, while only 9 non-Model schools do so. Moreover, the non-Model schools offer only the Arts stream, whereas the Model schools offer Science, Commerce and Arts streams. Hence, due to greater facilities available, results are also better at the senior secondary level.
2. Inadequate salaries accorded to private school teachers, the Govt norm for a teacher’s salary at the senior secondary level is a meagre Rs 6500 a month, which is the amount quoted and paid to most private school teachers. And as Ms. Mohindra succinctly put it, “If you pay peanuts, all you’re going to get is monkeys!” Total Quality Management cannot be achieved at minimal costs!
3. Govt School teachers get added perks as well as job stability and security, while private schools have a “hire and fire” policy.
4. Private schools often hire poor quality staff as the authorities are generally autonomous and can use their discretion to hire staff. This leads to a bias when it comes to staff selection and ambiguous uncles and nephews are granted plush jobs.
5. Also, private schools have strict rules with regard to attendance requirements. Students find it difficult to meet these, especially in standards XI and XII where entrance exam preparation is given priority. Hence, after standard X, many students migrate over to government schools, which are more lax in their attendance requirements in order to prepare well. These are students with the benefit of a private school education up to Std. X and therefore lead to better results at the standard XII level.
But what about the standard X results? Why are they so much better for private schools vis-à-vis government schools in Chandigarh? Suggested reasons are 1. Even though Model Government schools seem to be doing their job at producing results,
non-Model schools show extremely poor results, thereby dragging the average down. There are 39 Model and 37 Non-Model schools offering education at the standard X level, which works out to a pretty even enrolment split.
2. Universal Retention Policy (URP) of the Government: This policy, introduced in 1992, and re-introduced as part of the Sarva Shiksha Abhiyaan (SSA) scheme of the Government, says that until standard V, no student can be made to fail at any class. This is useful in theory, but in practice, students who have not received or are not capable of a certain minimum level of basic education are also made to pass, leading to the formation of a huge backlog of ignorance. This reflects in classes VI-X and is generally weeded out at the board exam level, as the U.T Board exams are slightly lenient.
3. Poor attendance levels of both students and teachers 4. Non-academic responsibilities of teachers: With special regard to Chandigarh U.T, Ms.
Mohindra said that government school teachers are given a host of non-academic responsibilities, including Census duty and Election duty. This makes it all the more difficult for them to give their 100% to the school and its activities.
5. Job security: This actually acts as a deterrent towards performance, as there is no incentive to provide better results.
6. However, even though job security exists, mid-session transfers and dislocation of staff lead to unsettling atmospheres in schools and deters performance.

Centre for Civil Society 12
Thus, with regard to quality of education, it can be concluded that Model school results are comparable to private schools, whereas Non-Model schools lag behind.
Model Schools vs Non-Model Schools: Why the difference in performance?
Peripherally, the facilities and amenities available to Model and Non- Model schools in Chandigarh are the same, but the results are strikingly contrast, as is evident in the above tables. Why this difference? The Director of Public Instruction, D. P. Mangat, offers possible reasons
1. Lack of motivation among both teachers and students 2. Students of non-Model schools are from relatively poorer sections of society. They do not
get proper guidance at home. For them, education has no, or little, significance. This is not all. Children go away to their native villages for about four to five months in the middle of the session for farming and other chores, breaking the link.
3. The medium of instruction in non-Model schools is Hindi or Punjabi. A growing increase in the awareness of people with respect to the importance of English leads to a higher popularity for Model Schools.
4. Senior Secondary facilities at non-Model schools are relatively poorer, with Science and Commerce streams not being offered, only Arts. Also, the absolute number of non-Model schools offering education at the Senior Secondary level is relatively less.
5. Poorer facilities and infrastructure: The computer literacy drive launched in 2000 did not take off in non-Model schools due to lack of interest and drive
6. Low attendance rates due to lack of regulation and attendance requirements 7. There is generally a well-run PTA in most Model schools, which non-Model schools are
unable to have due to the financial backwardness of the students that attend them. Thus, regulation by the PTA is noticeably missing in non-Model schools.
8. Peripheral facilities like sports, music, and theatre are lacking in non-Model schools as compared to Model schools. As Ram Kumar Sharma, Principal, GMHSS -16 says, “These are critical to the overall development of a child’s personality”
What is being done to rectify this?
The Education Department of the UT Government is in the process of taking steps to combat this difference between Model and non-Model schools. An ambitious project of Rs 3.5 crores is being launched to raise non-Model schools to Model standard. Facilities that are to be improved are infrastructure, teachers training, and computer education12. Also, The UT Education Department, has decided to introduce English in all non-model schools from class I. According to the new scheme, students can also opt for English as medium of instruction. As of now, this option is available only to class I students. With each academic session, an additional class would be added for the change in the medium of instruction. Also, about 300 postgraduate and graduate JBT teachers, besides 200 nursery teachers, would be given a three-week training in the Regional Institute of English.13
General measures undertaken
12 Tribune Correspondent. 2005. Tribune. July 28, 2004. Chandigarh 13 Tribune Correspondent. 2005. Tribune. February 23, 2003. Chandigarh, India

Centre for Civil Society 13
In addition, the Government of Chandigarh has also undertaken the following measures to improve education as a whole (both Model and non-Model schools) in the city.
1. IT education being introduced in all Government schools from Class VI onwards. 2. IT in vocational stream introduced at +2 stages. 3. Computer science being introduced as an elective subject at 10+2 level in a phased
manner. 4. Information on performance of students being assessable to their parents through
Internet for improving academic efficiency. 5. Web site of the education department being developed. 6. Computerization of Departmental examinations being taken up. 14
The economics of schooling in Chandigarh
On the basis of the above information, it can be concluded that the government school system in Chandigarh is working with a reasonable degree of success. At least in comparison with national averages, Chandigarh has been above average with respect to both rural and urban literacy levels with a fair degree of consistency. Are these sufficient indicators of a successful system? One should think so, as they are borne out by indicators such as pass percentages and enrollment figures.
There are indications of a perfectly competitive market between government Model schools and private schools in Chandigarh. Admissions in Model schools are sought for by students, with nearly 1500 applicants for the 185 seats in Government Model Higher Secondary School, Sector – 16 in 200415. So much so, government schools have had to conduct entrance tests and interviews at the standard XI admission levels. Schools (especially top-notch rated schools such as the GMHSS - 16, GMHSS - 33 etc) are comparable with private schools in terms of results, infrastructure and faculty.
Why is there this market? What is it about Chandigarh that sets it apart from the average state in terms of quality of government school education? There are many possible reasons. They will be examined one by one.
Historical Background: Chandigarh is well known to be the first “planned city” of the nation. Jawaharlal Nehru’s brainchild, the final approvals of the site for the city were made in March 1948. At the time of planning, sufficient space and infrastructure were allotted for educational institutions; moreover, each sector was allotted space for one school. The idea was to create mini-societies in each sector, autonomous and independent of other sectors. This plan included the building of a school in each sector. Thus, schools in Chandigarh are not lacking in space or infrastructure.
Financial Development: Due to the prosperity that descended on Punjab and nearby areas as a result of the Green Revolution in 1967-78, Chandigarh became the home of many rich and prosperous families, and showed a startling spurt in growth and development, both economic and agricultural. The Green Revolution incorporated a continued expansion of farming areas, the double cropping of existing farmland and improved genetic seed usage and had a significant
14 Education Secretary (Chandigarh Administration). 2000. Letter No. DPT-UT-S7-11/2000. 25 October, 2005. 15 Gayatri, Geetanjali. 2004. Tribune. “Entrance tests at model schools to cope with rush”. 6 May, 2004. Chandigarh

Centre for Civil Society 14
economic impact. It spurred industrial growth in areas like fertilizer, pesticide and fungicide production, better irrigation methods required the generation of hydro-electric power, which boosted industrial development and economic development too. All this translated into the creation of a wealthy section of the society, which had the money to educate their children and boost their own already existing prosperity. The per capita income of Chandigarh has consistently remained one among the three highest across all Indian States.16 PTA’s are a major source of funds in government schools.
Simplicity of the system: The funding system of government schools in Chandigarh is relatively simple. Firstly, being a Union Territory without Legislature, funds come straight from the Centre to the schools, the layers of authority between the Centre and the school being limited only to the DEO and the DPI. Also, local bodies (such as the Municipal Corporation) do not provide funding to government schools. Moreover, the only major Centrally Sponsored Scheme running in Chandigarh is that of the SSA. The system, even though it is old, has managed to retain a modicum of transparency. Media Involvement: Media involvement in education in Chandigarh is high, with the Tribune and the Hindustan Times regularly interviewing government school principals, publishing articles on Model and Non-Model schools, government initiatives etc. Thus, local bodies like the DEO and the DPI are highly answerable to the media and the general public as well. This maintains efficiency and transparency, if only to a limited extent. On average, there are around 15-20 articles every month in The Tribune, a prominent local daily in Chandigarh regarding education and government schooling. Conclusion Thus, it can be seen that, for the above and other reasons, Chandigarh serves as an example of a Union Territory where the government schooling system is working with a fair amount of efficiency. This speaks highly of the importance of planning and forethought in the allocation of land and space for educational institutions and also tells us that the right infrastructure can take us far in the pursuit of goals. The removal of the bottlenecks of poor infrastructure, poor quality of teachers, low funds etc will lead to the formation of a market, and a pure market economy always produces results. Chandigarh is a good example of how a system builds itself, given minimal intervention and removal of basic bottlenecks. Also, the efficiency of a market system is place-specific, people in Chandigarh are financially and socially prepared to deal with a pure market process, this might not be the case in other cities.
16 See Appendix III
Centre for Civil Society 15
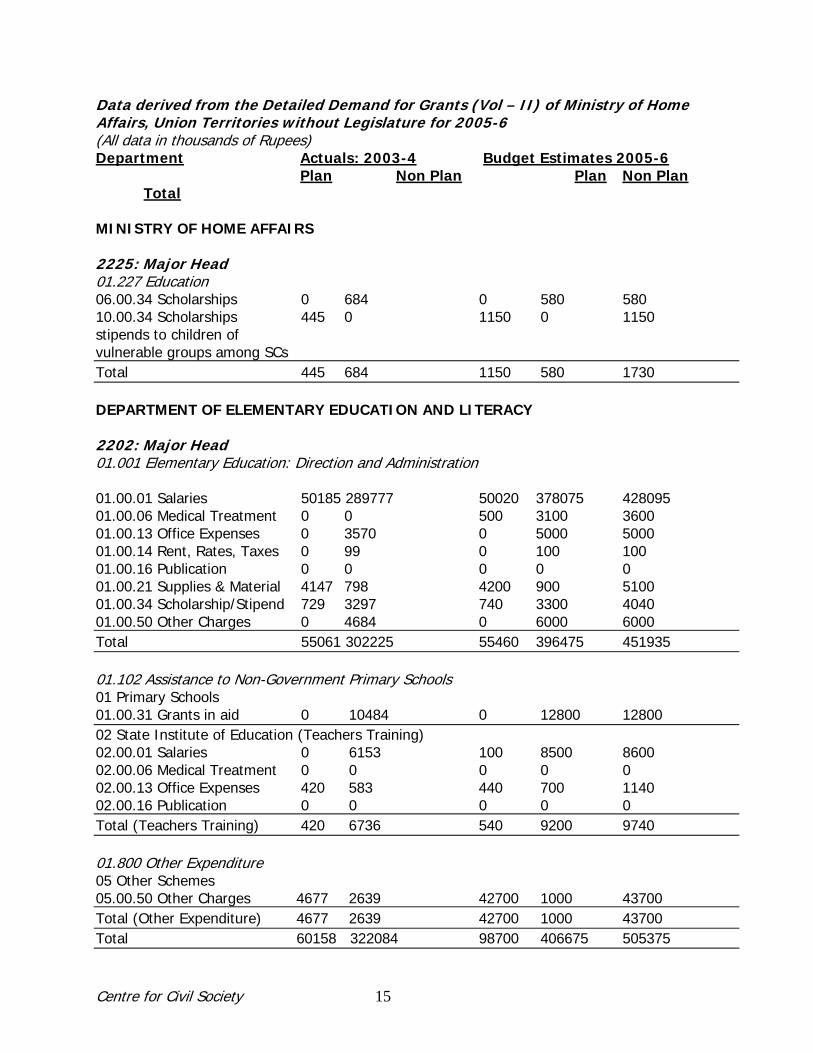
Data derived from the Detailed Demand for Grants (Vol – II) of Ministry of Home Affairs, Union Territories without Legislature for 2005-6 (All data in thousands of Rupees) Department Actuals: 2003-4 Budget Estimates 2005-6 Plan Non Plan Plan Non Plan Total MINISTRY OF HOME AFFAIRS 2225: Major Head 01.227 Education 06.00.34 Scholarships 0 684 0 580 580 10.00.34 Scholarships 445 0 1150 0 1150 stipends to children of vulnerable groups among SCs Total 445 684 1150 580 1730 DEPARTMENT OF ELEMENTARY EDUCATION AND LITERACY 2202: Major Head 01.001 Elementary Education: Direction and Administration 01.00.01 Salaries 50185 289777 50020 378075 428095 01.00.06 Medical Treatment 0 0 500 3100 3600 01.00.13 Office Expenses 0 3570 0 5000 5000 01.00.14 Rent, Rates, Taxes 0 99 0 100 100 01.00.16 Publication 0 0 0 0 0 01.00.21 Supplies & Material 4147 798 4200 900 5100 01.00.34 Scholarship/Stipend 729 3297 740 3300 4040 01.00.50 Other Charges 0 4684 0 6000 6000 Total 55061 302225 55460 396475 451935 01.102 Assistance to Non-Government Primary Schools 01 Primary Schools 01.00.31 Grants in aid 0 10484 0 12800 12800 02 State Institute of Education (Teachers Training) 02.00.01 Salaries 0 6153 100 8500 8600 02.00.06 Medical Treatment 0 0 0 0 0 02.00.13 Office Expenses 420 583 440 700 1140 02.00.16 Publication 0 0 0 0 0 Total (Teachers Training) 420 6736 540 9200 9740 01.800 Other Expenditure 05 Other Schemes 05.00.50 Other Charges 4677 2639 42700 1000 43700 Total (Other Expenditure) 4677 2639 42700 1000 43700 Total 60158 322084 98700 406675 505375
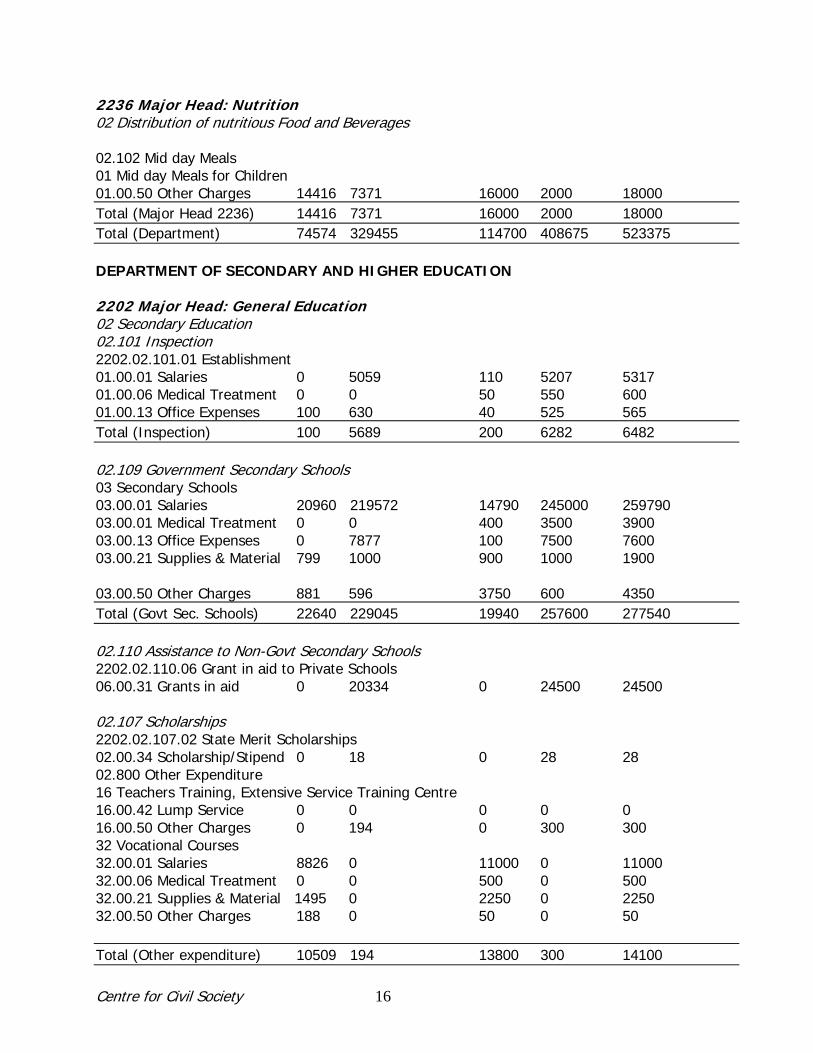
Centre for Civil Society 16
2236 Major Head: Nutrition 02 Distribution of nutritious Food and Beverages 02.102 Mid day Meals 01 Mid day Meals for Children 01.00.50 Other Charges 14416 7371 16000 2000 18000 Total (Major Head 2236) 14416 7371 16000 2000 18000 Total (Department) 74574 329455 114700 408675 523375 DEPARTMENT OF SECONDARY AND HIGHER EDUCATION 2202 Major Head: General Education 02 Secondary Education 02.101 Inspection 2202.02.101.01 Establishment 01.00.01 Salaries 0 5059 110 5207 5317 01.00.06 Medical Treatment 0 0 50 550 600 01.00.13 Office Expenses 100 630 40 525 565 Total (Inspection) 100 5689 200 6282 6482 02.109 Government Secondary Schools 03 Secondary Schools 03.00.01 Salaries 20960 219572 14790 245000 259790 03.00.01 Medical Treatment 0 0 400 3500 3900 03.00.13 Office Expenses 0 7877 100 7500 7600 03.00.21 Supplies & Material 799 1000 900 1000 1900 03.00.50 Other Charges 881 596 3750 600 4350 Total (Govt Sec. Schools) 22640 229045 19940 257600 277540 02.110 Assistance to Non-Govt Secondary Schools 2202.02.110.06 Grant in aid to Private Schools 06.00.31 Grants in aid 0 20334 0 24500 24500 02.107 Scholarships 2202.02.107.02 State Merit Scholarships 02.00.34 Scholarship/Stipend 0 18 0 28 28 02.800 Other Expenditure 16 Teachers Training, Extensive Service Training Centre 16.00.42 Lump Service 0 0 0 0 0 16.00.50 Other Charges 0 194 0 300 300 32 Vocational Courses 32.00.01 Salaries 8826 0 11000 0 11000 32.00.06 Medical Treatment 0 0 500 0 500 32.00.21 Supplies & Material 1495 0 2250 0 2250 32.00.50 Other Charges 188 0 50 0 50 Total (Other expenditure) 10509 194 13800 300 14100

Centre for Civil Society 17
Total (Secondary Education) 33249 255280 33940 288710 322650 CAPITAL SECTION 4202 Major Head: Capital Outlay on Education, Sports and Culture 01 General Education 01.201 Elementary Education 01 Building 01.00.53 Major Works 10152 0 10000 0 10000 01.202 Secondary Education 05 Building 05.00.53 Major Works 7600 0 18000 0 18000 Total (General Education) 17752 0 28000 0 28000 Data derived from the Detailed Demand for Grants (Vol – II) of Ministry of Home Affairs, Union Territories without Legislature for 2004-5 (All data in thousands of Rupees) Department Actuals: 2002-3 Budget Estimates 2004-5 Plan Non Plan Plan Non Plan Total MINISTRY OF HOME AFFAIRS 2225: Major Head 01.227 Education 06.00.34 Scholarships 0 612 0 560 560 10.00.34 Scholarships 46 0 650 0 650 stipends to children of vulnerable groups among SCs Total 46 612 650 560 1210 DEPARTMENT OF ELEMENTARY EDUCATION AND LITERACY 2202: Major Head 01.001 Elementary Education: Direction and Administration 01.00.01 Salaries 15232 292357 52000 300000 352000 01.00.06 Medical Treatment 0 0 600 2950 3550 01.00.13 Office Expenses 0 1842 0 3700 3700 01.00.14 Rent, Rates, Taxes 0 100 0 100 100 01.00.16 Publication 0 0 0 0 0 01.00.21 Supplies & Material 4146 0 3900 800 4700 01.00.34 Scholarship/Stipend 730 3252 740 3300 4040 01.00.50 Other Charges 0 5422 0 5800 5800 Total 20108 302973 57240 316650 373890 01.102 Assistance to Non-Government Primary Schools 01 Primary Schools 01.00.31 Grants in aid 0 9816 0 12250 12250 02 State Institute of Education (Teachers Training)

Centre for Civil Society 18
02.00.01 Salaries 0 5196 100 6100 6200 02.00.06 Medical Treatment 0 0 0 500 500 02.00.13 Office Expenses 244 499 500 700 1200 02.00.16 Publication 0 0 0 0 0 Total (Teachers Training) 244 6415 640 7300 7900 01.800 Other Expenditure 05 Other Schemes 05.00.50 Other Charges 2450 8959 17160 1100 18262 Total (Other Expenditure) 2450 8959 17160 1100 18262 Total 22802 320099 75000 337300 412300 2236 Major Head: Nutrition 02 Distribution of nutritious Food and Beverages 02.102 Mid day Meals 01 Mid day Meals for Children 01.00.50 Other Charges 4850 1757 15500 1800 17300 Total (Major Head 2236) 4850 1757 15500 1800 17300 Total (Department) 29876 322184 93400 339600 433000 DEPARTMENT OF SECONDARY AND HIGHER EDUCATION 2202 Major Head: General Education 02 Secondary Education 02.101 Inspection 2202.02.101.01 Establishment 01.00.01 Salaries 0 4952 1900 5000 6900 01.00.06 Medical Treatment 0 0 50 550 600 01.00.13 Office Expenses 0 480 40 525 565 Total (Inspection) 0 5432 2250 6018 8268 02.109 Government Secondary Schools 03 Secondary Schools 03.00.01 Salaries 15056 216299 13000 220000 233000 03.00.01 Medical Treatment 0 0 550 3500 4050 03.00.13 Office Expenses 0 4787 200 7000 7200 03.00.21 Supplies & Material 0 585 2800 1000 3800 03.00.50 Other Charges 4746 15 4600 600 5200 Total (Govt Sec. Schools) 19802 221686 21150 232100 253250 02.110 Assistance to Non-Govt Secondary Schools 2202.02.110.06 Grant in aid to Private Schools 06.00.31 Grants in aid 0 21219 0 23500 23500 02.107 Scholarships 2202.02.107.02 State Merit Scholarships

Centre for Civil Society 19
02.00.34 Scholarship/Stipend 0 16 0 30 30 02.800 Other Expenditure 16 Teachers Training, Extensive Service Training Centre 16.00.42 Lump Service 0 185 0 0 0 16.00.50 Other Charges 0 0 0 300 300 32 Vocational Courses 32.00.01 Salaries 8200 0 10000 0 10000 32.00.06 Medical Treatment 0 0 500 0 500 32.00.21 Supplies & Material 788 0 2100 0 2100 32.00.50 Other Charges 692 0 1800 0 1800 Total (Other expenditure) 9680 185 14400 300 14700 Total (Secondary Education) 29482 248538 37800 261948 299748 CAPITAL SECTION 4202 Major Head: Capital Outlay on Education, Sports and Culture 01 General Education 01.201 Elementary Education 01 Building 01.00.53 Major Works 5528 0 3900 0 3900 01.202 Secondary Education 05 Building 05.00.53 Major Works 9332 0 14900 0 14900 Total (General Education) 14860 0 18800 0 18800 Data derived from the Detailed Demand for Grants (Vol – II) of Ministry of Home Affairs, Union Territories without Legislature for 2003-4 (All data in thousands of Rupees) Department Actuals: 2001-2 Budget Estimates 2003-4 Plan Non Plan Plan Non Plan Total MINISTRY OF HOME AFFAIRS 2225: Major Head 01.227 Education 06.00.34 Scholarships 0 230 0 370 370 10.00.34 Scholarships 24 0 650 0 650 and stipends to children of vulnerable groups among SCs Total 24 230 650 370 1020 DEPARTMENT OF ELEMENTARY EDUCATION AND LITERACY 2202: Major Head 01.001 Elementary Education: Direction and Administration 01.00.01 Salaries 226 263727 65420 282004 347424 01.00.13 Office Expenses 0 2042 0 1940 1940

Centre for Civil Society 20
01.00.14 Rent, Rates, Taxes 0 100 0 100 100 01.00.16 Publication 0 0 0 0 0 01.00.21 Supplies & Material 4832 0 4150 800 4950 01.00.34 Scholarship/Stipend 733 3179 740 3500 4240 01.00.50 Other Charges 0 4282 0 5800 5800 Total 5791 273330 70310 294144 364454 01.102 Assistance to Non-Government Primary Schools 01 Primary Schools 01.00.31 Grants in aid 0 11192 0 12000 12000 02 State Institute of Education (Teachers Training) 02.00.01 Salaries 0 5819 100 6180 6280 02.00.13 Office Expenses 270 525 440 630 1070 02.00.16 Publication 0 0 0 0 0 Total (Teachers Training) 270 6344 540 6810 7350 01.800 Other Expenditure 05 Other Schemes 05.00.50 Other Charges 0 804 2450 800 3250 Total (Other Expenditure) 0 804 2450 800 3250 Total (Elementary Education) 6061 291670 73300 313754 387054 02 Secondary Education 02.101 Inspection 2202.02.101.01 Establishment 01.00.01 Salaries 150 4375 500 4635 5135 01.00.13 Office Expenses 0 390 100 500 600 Total (Inspection) 150 4765 600 5135 5735 02.109 Government Secondary Schools 03 Secondary Schools 03.00.01 Salaries 83 201760 15000 213545 228545 03.00.13 Office Expenses 0 4828 0 4570 4570 03.00.21 Supplies & Material 0 0 800 1000 1800 03.00.50 Other Charges 500 555 3700 600 4300 Total (Govt Sec. Schools) 583 207143 19500 219715 239215 02.110 Assistance to Non-Govt Secondary Schools 2202.02.110.06 Grant in aid to Private Schools 06.00.31 Grants in aid 0 20899 0 22500 22500 02.107 Scholarships 2202.02.107.02 State Merit Scholarships 02.00.34 Scholarship/Stipend 0 14 0 30 30

Centre for Civil Society 21
02.800 Other Expenditure 16 Teachers Training, Extensive Service Training Centre 16.00.42 Lump Service 0 198 0 0 0 16.00.50 Other Charges 0 0 0 200 200 32 Vocational Courses 32.00.01 Salaries 7832 0 8800 0 8800 32.00.21 Supplies & Material 0 0 1200 0 1200 32.00.50 Other Charges 796 0 100 0 100 Total (Vocational Courses) 8628 0 10100 0 10100 Total (Other expenditure) 8628 198 10100 200 10300 Total (Secondary Education) 9361 233019 30200 247580 277780 2236 Major Head: Nutrition 02 Distribution of nutritious Food and Beverages 02.102 Mid day Meals 01 Mid day Meals for Children 01.00.50 Other Charges 3400 3065 15500 1800 17300 Total (Major Head 2236) 3400 3065 15500 1800 17300 CAPITAL SECTION 4202 Major Head: Capital Outlay on Education, Sports and Culture 01 General Education 01.201 Elementary Education 01 Building 01.00.53 Major Works 5965 0 7400 0 7400 01.202 Secondary Education 05 Building 05.00.53 Major Works 13540 0 7700 0 7700 Total (General Education) 19500 0 15100 0 15100 Data derived from the Detailed Demand for Grants (Vol – II) of Ministry of Home Affairs, Union Territories without Legislature for 2002-3 (All data in thousands of Rupees) Department Actuals: 2000-1 Budget Estimates 2002-3 Plan Non Plan Plan Non Plan Total MINISTRY OF HOME AFFAIRS 2225: Major Head 01.227 Education 06.00.34 Scholarships 0 258 0 350 350 10.00.34 Scholarships 40 0 500 0 500

Centre for Civil Society 22
stipends to children of vulnerable groups among SCs Total 40 258 500 350 580 DEPARTMENT OF ELEMENTARY EDUCATION AND LITERACY 2202: Major Head 01.001 Elementary Education: Direction and Administration 01.00.01 Salaries 0 254641 6360 268000 274360 01.00.13 Office Expenses 0 1723 0 1750 1750 01.00.14 Rent, Rates, Taxes 0 100 0 100 100 01.00.16 Publication 0 0 0 0 0 01.00.21 Supplies & Material 4995 0 250 0 250 01.00.34 Scholarship/Stipend 734 2546 740 3500 4240 01.00.50 Other Charges 0 6015 0 6000 6000 Total 5729 265025 7350 279350 286700 01.102 Assistance to Non-Government Primary Schools 01 Primary Schools 01.00.31 Grants in aid 0 10652 0 11500 11500 02 State Institute of Education (Teachers Training) 02.00.01 Salaries 0 6620 100 7000 7100 02.00.13 Office Expenses 135 550 400 700 1100 02.00.16 Publication 145 0 0 0 0 Total (Teachers Training) 280 7170 500 7700 8200 01.800 Other Expenditure 05 Other Schemes 05.00.50 Other Charges 0 660 2450 800 3250 Total (Other Expenditure) 0 660 2450 800 3250 Total 6009 283507 10300 299350 309650 02 Secondary Education 02.101 Inspection 2202.02.101.01 Establishment 01.00.01 Salaries 0 4134 1000 4250 5250 01.00.13 Office Expenses 0 1125 320 530 850 Total (Inspection) 0 5259 1320 4780 6100 02.109 Government Secondary Schools 03 Secondary Schools 03.00.01 Salaries 0 193502 10370 205000 215370 03.00.13 Office Expenses 0 4437 0 4350 4350

Centre for Civil Society 23
03.00.21 Supplies & Material 0 0 670 800 1470 03.00.50 Other Charges 498 565 3760 600 4360 Total (Govt Sec. Schools) 498 198504 14800 210750 225550 02.110 Assistance to Non-Govt Secondary Schools 2202.02.110.06 Grant in aid to Private Schools 06.00.31 Grants in aid 0 18803 0 20000 20000 02.107 Scholarships 2202.02.107.02 State Merit Scholarships 02.00.34 Scholarship/Stipend 0 18 0 30 30 02.800 Other Expenditure 16 Teachers Training, Extensive Service Training Centre 16.00.42 Lump Service 0 260 0 350 350 32 Vocational Courses 32.00.01 Salaries 7200 0 8300 0 8300 32.00.21 Supplies & Material 0 0 1230 0 1230 32.00.50 Other Charges 1139 0 250 0 250 Total (Vocational Courses) 8339 0 9780 0 9780 Total (Other expenditure) 8339 260 9780 350 10130 Total (Secondary Education) 8837 222844 25900 235910 261810 2236 Major Head: Nutrition 02 Distribution of nutritious Food and Beverages 02.102 Mid day Meals 01 Mid day Meals for Children 01.00.50 Other Charges 500 1866 15500 1800 17300 Total (Major Head 2236) 500 1866 15500 1800 17300 CAPITAL SECTION 4202 Major Head: Capital Outlay on Education, Sports and Culture 01 General Education 01.201 Elementary Education 01 Building 01.00.53 Major Works 8797 0 5000 0 5000 01.202 Secondary Education 05 Building 05.00.53 Major Works 25295 0 10000 0 10000 Total (General Education) 34092 0 15000 0 15000

Centre for Civil Society 24
Data derived from the Detailed Demand for Grants (Vol – II) of Ministry of Home Affairs, Union Territories without Legislature for 2002-3 (All data in thousands of Rupees) Department Estimates 2001-2002 Plan Non Plan MINISTRY OF HOME AFFAIRS 2225: Major Head 01.227 Education 06.00.34 Scholarships 0 500 10.00.34 Scholarships 500 0 stipends to children of vulnerable groups among SCs Total 500 500 DEPARTMENT OF ELEMENTARY EDUCATION AND LITERACY 2202: Major Head 01.001 Elementary Education: Direction and Administration 01.00.01 Salaries 1410 267800 01.00.13 Office Expenses 0 1734 01.00.14 Rent, Rates, Taxes 0 100 01.00.16 Publication 0 0 01.00.21 Supplies & Material 480 0 01.00.34 Scholarship/Stipend 300 540 01.00.50 Other Charges 740 6200 Total 2930 279374 01.102 Assistance to Non-Government Primary Schools 01 Primary Schools 01.00.31 Grants in aid 0 10700 02 State Institute of Education (Teachers Training) 02.00.01 Salaries 0 7000 02.00.13 Office Expenses 270 650 02.00.16 Publication 0 0 Total (Teachers Training) 270 7650 01.800 Other Expenditure 05 Other Schemes 05.00.50 Other Charges 0 900 Total (Other Expenditure) 0 900

Centre for Civil Society 25
Total 3200 298624 02 Secondary Education 02.101 Inspection 2202.02.101.01 Establishment 01.00.01 Salaries 50 4200 01.00.13 Office Expenses 0 500 Total (Inspection) 50 4700 02.109 Government Secondary Schools 03 Secondary Schools 03.00.01 Salaries 1600 203000 03.00.13 Office Expenses 0 4200 03.00.21 Supplies & Material 650 800 03.00.50 Other Charges 500 565 Total (Govt Sec. Schools) 2750 208565 02.110 Assistance to Non-Govt Secondary Schools 2202.02.110.06 Grant in aid to Private Schools 06.00.31 Grants in aid 0 19000 02.107 Scholarships 2202.02.107.02 State Merit Scholarships 02.00.34 Scholarship/Stipend 0 30 02.800 Other Expenditure 16 Teachers Training, Extensive Service Training Centre 16.00.42 Lump Service 0 350 32 Vocational Courses 32.00.01 Salaries 8625 0 32.00.21 Supplies & Material 0 0 32.00.50 Other Charges 1200 0 Total (Vocational Courses) 9825 0 Total (Other expenditure) 9825 350 Total (Secondary Education) 12625 232645 2236 Major Head: Nutrition 02 Distribution of nutritious Food and Beverages 02.102 Mid day Meals 01 Mid day Meals for Children 01.00.50 Other Charges 1800 1500 Total (Major Head 2236) 1800 1500 CAPITAL SECTION 4202 Major Head: Capital Outlay on Education, Sports and Culture

Centre for Civil Society 26
01 General Education 01.201 Elementary Education 01 Building 01.00.53 Major Works 9000 0 01.202 Secondary Education 05 Building 05.00.53 Major Works 11100 0 Total (General Education) 20100 0 Data derived from the Detailed Demand for Grants (Vol – II) of Ministry of Home Affairs, Union Territories without Legislature for 2001-2 (All data in thousands of Rupees) Department Estimates 2000-2001 Plan Non Plan MINISTRY OF HOME AFFAIRS 2225: Major Head 01.227 Education 06.00.34 Scholarships 0 500 10.00.34 Scholarships 500 0 stipends to children of vulnerable groups among SCs Total 500 500 DEPARTMENT OF ELEMENTARY EDUCATION AND LITERACY 2202: Major Head 01.001 Elementary Education: Direction and Administration 01.00.01 Salaries 1000 260000 01.00.13 Office Expenses 0 1677 01.00.14 Rent, Rates, Taxes 0 100 01.00.16 Publication 0 0 01.00.21 Supplies & Material 480 900 01.00.34 Scholarship/Stipend 740 3540 01.00.50 Other Charges 0 6200 Total 2220 274637 01.102 Assistance to Non-Government Primary Schools 01 Primary Schools 01.00.31 Grants in aid 0 9652 02 State Institute of Education (Teachers Training) 02.00.01 Salaries 100 8000

Centre for Civil Society 27
02.00.13 Office Expenses 135 550 02.00.16 Publication 145 0 Total (Teachers Training) 380 8550 01.800 Other Expenditure 05 Other Schemes 05.00.50 Other Charges 0 860 Total (Other Expenditure) 0 860 Total 2600 291479 02 Secondary Education 02.101 Inspection 2202.02.101.01 Establishment 01.00.01 Salaries 100 3950 01.00.13 Office Expenses 0 400 Total (Inspection) 100 4350 02.109 Government Secondary Schools 03 Secondary Schools 03.00.01 Salaries 1800 197000 03.00.13 Office Expenses 300 3900 03.00.21 Supplies & Material 1300 1250 03.00.50 Other Charges 500 565 Total (Govt Sec. Schools) 3900 202715 02.110 Assistance to Non-Govt Secondary Schools 2202.02.110.06 Grant in aid to Private Schools 06.00.31 Grants in aid 0 16903 02.107 Scholarships 2202.02.107.02 State Merit Scholarships 02.00.34 Scholarship/Stipend 0 30 02.800 Other Expenditure 16 Teachers Training, Extensive Service Training Centre 16.00.42 Lump Service 0 300 32 Vocational Courses 32.00.01 Salaries 7700 0 32.00.21 Supplies & Material 0 0 32.00.50 Other Charges 1500 0 Total (Vocational Courses) 9200 0 Total (Other expenditure) 9200 300 Total (Secondary Education) 13200 224298 2236 Major Head: Nutrition 02 Distribution of nutritious Food and Beverages

Centre for Civil Society 28
02.102 Mid day Meals 01 Mid day Meals for Children 01.00.50 Other Charges 500 1500 Total (Major Head 2236) 500 1500 CAPITAL SECTION 4202 Major Head: Capital Outlay on Education, Sports and Culture 01 General Education 01.201 Elementary Education 01 Building 01.00.53 Major Works 10000 0 01.202 Secondary Education 05 Building 05.00.53 Major Works 15000 0 Total (General Education) 25000 0

Centre for Civil Society 29
Appendix I
Brief Profile of Kendriya Vidyalayas in Chandigarh17
School
Std I-V
Std VI-X
Std XI-XII
Total
PP X
PP XII
Annual Exp
PCE/Year
2004-5
KV Sector 29
525
401
73
999
92.06
100.00
8088136
8096.23
KV Sector 31
727
825
338
1890
89.70
92.50
14441255
7640.88
KV Sector 47
517
579
286
1382
88.10
98.56
10780105
7800.37
KV 3BRD
596
561
199
1356
96.26
97.94
10685928
7880.48
KV High Ground
548
417
98
1063
95.83
97.56
9274394
8724.74
KV Zirakpur
324
226
18
568
96.97
0.00
6013871
10587.80
KV 1 Chandi Mandir
466
406
195
1067
91.78
96.40
8368426
7842.95
KV 2 Chandi Mandir
522
595
127
1244
95.76
100.00
8821614
7091.33
Totals
4225
4010
1334
9569
92.78
91.41
76473729
7991.82
2003-4
KV Sector 29
484
346
53
883
90.56
76.47
6971801
7895.58
KV Sector 31
692
798
309
1799
82.50
93.60
12571434
6988.01
KV Sector 47
533
630
241
1404
95.45
87.75
9921339
7066.48
KV 3BRD
553
517
160
1230
96.29
96.60
9498026
7721.97
KV High Ground
541
399
104
1044
95.20
94.80
9526053
9124.57
KV Zirakpur
192
174
0
366
100.00
0.00
4141726
11316.19
KV 1 Chandi Mandir
357
372
218
947
93.30
85.79
7008575
7400.82
KV 2 Chandi Mandir
535
624
68
1227
97.27
100.00
8965702
7307.01
Totals
3887
3860
1153
8900
92.64
87.74
68604656
7708.39
* PP = Pass percentage, Annual Exp = Annual Expenditure in Rupees
17Kendriya Vidyalaya Regional Office, Chandigarh

Centre for Civil Society 30
Appendix II
A brief profile of the Jawahar Navodaya Vidyalaya, Chandigarh18
Year
Standard
Enrollment
Drop Out
Pass Percentage
Annual Expenditure
Per Capita Expenditure
2004-5 VI-X 357
0 -
XI-XII 106 0 -
Total 463 0 - 11558000 24963.28
X - - 96%
XII - - 100%
2003-4 VI-X 336 11 -
XI-XII 118 0 -
Total 454 11 - 11167000 24596.91
X - - 96.60%
XII - - 90.10%
2002-3 VI-X 315 18 -
XI-XII 80 1 -
Total 395 19 - 9837000 24903.79
X - - 89.60%
XII - - 90%
2001-2 VI-X 306 15 -
XI-XII 68 2 -
Total 374 17 - 8049000 21521.39
X - - 90.47%
XII - - 65.70%
2000-1 VI-X 299 12 -
XI-XII 66 1 -
Total 365 13 - 7534000 20641.09
X - - 88.60%
XII - - 96.80%
• Per Capita Expenditure in Rupees/Year, Annual Expenditure in Rupees
18 Jawahar Navodaya Vidyalaya Office, Sector 25, Chandigarh

Centre for Civil Society 31
Appendix III19 Per Capita NSDP (State Income) at Current Prices in India
{(As on 30.11.2004) (1994-1995 to 2003-2004)}
States/UTs 1994- 1995- 1996- 1997- 1998- 1999- 2000- 2001- 2002- 2003-
95 96 97 98 99 0 1 02 03 04 Andhra Pradesh 17.7 14.3 12 4 19.9 7.8 11 7.2 4.2 9.4
Arunachal Pradesh 6.9 19.8 -1.3 7.6 11.3 4 7.4 0.6 5.7 NA Assam 13.6 7.8 5.6 7.7 10.8 14.2 6.3 2.9 6.5 7.1 Bihar 11 -9.8 31.6 0.3 12 6.7 11.3 2.1 10.5 3.3
Jharkhand 9.5 7 4.8 32.4 11.8 -4 -14.9 7.3 6 NA Goa 16.7 15 19 23.6 23.3 10.2 9.5 2.2 NA NA
Gujarat 29 8.1 18.2 2.7 14.6 -0.4 0 11.5 6.5 NA Haryana 16.2 10.4 16.9 5.5 10.3 9.1 10.3 6.6 7.3 NA Himachal Pradesh 20.1 12.2 12.8 12.8 19.7 12.5 8.9 8.9 4.8 NA
Jammu & Kashmir 5.7 12.6 11.4 9.5 22.1 6.7 3.3 4.2 NA NA
Karnataka 14.3 14 14.2 7.7 22.4 6.6 8.8 -1.6 5.7 NA Kerala 20.2 20.2 13.8 9 12.6 10.5 12.7 -0.7 10.4 10.1
Madhya Pradesh 7.8 10 12.9 7 13.1 10.2 -9 12.4 -4.9 NA Chhatisgarh 6.8 7.1 11.7 10.4 9.1 3.5 -4.6 20.5 -0.5 NA Maharashtra 12.1 18.3 10.5 6 9 11.4 -5 10.9 8.8 NA
Manipur 4.2 12.5 14.3 10.8 10 13 -0.6 7.1 7.2 NA Meghalaya 6.6 17.6 7 11.2 16 9.7 12 2.8 6.1 NA Mizoram 5.7 24.6 11.5 1.5 8.8 10.6 24 6.5 NA NA Nagaland 11.5 8.7 6.8 10.6 -4.9 1.5 40 7.3 NA NA
Orissa 18.4 20.5 -6.3 21.8 9.9 8.2 -2.2 8 3.2 14.7 Punjab 10.7 10 12.2 8.1 13 7.6 6.8 4 2.4 NA
Rajasthan 23.7 10.7 19.3 8.9 12.3 3.3 -1.5 9.3 -7.2 15.6 Sikkim 1.9 15.7 11.2 14.4 16.2 12.1 12.9 13 8.7 5.5
Tamil Nadu 17.3 12.5 12.3 16 13 5.6 10.9 -0.2 5.5 9.5 Tripura 2.2 20.7 18.8 19.1 14 19.8 15.6 14.5 NA NA
Uttar Pradesh 13.8 9.8 18.8 3.3 8.9 7 2.3 6.3 5.5 NA Uttaranchal 20.2 6.4 6.9 6.9 8.8 5.1 12.4 4.5 NA NA West Bengal 14.1 17.2 9 18.5 16.8 8.6 9 10.7 4.9 NA Andaman &
Nicobar Islands 16.4 5.2 13 8.7 -10.3 8.6 10.3 5.8 NA NA Chandigarh 15.5 17.1 16.5 11 13.1 9.7 8.4 5.3 7.8 NA
Delhi 18.7 4.5 15.1 18.4 11.7 7.7 14.6 3.2 8.5 NA Pondicherry 12.4 11 52.7 38 11.9 2.1 19.8 4.2 4.1 NA India (Per
Capita NNP) 15.2 14.6 13.9 9.9 13.3 8.5 6 8.4 5.4 10.3
19 Per Capita income. http://www.indiastat.com/india/ShowDataSec.asp?secid=60802&ptid=131. Sourced from Central Statistical Organization. Accessed on 5 July, 2004.

Centre for Civil Society 32
References
"Educational Statistics." Official Website. Government of Chandigarh. http://www.chandigarh.nic.in/ statistics/cif_edusch.pdf Aggarwal, Yash. 2001. Universal Access and Retention - Analytical Report. New Delhi: Educational Consultants India Ltd. Central Board of Secondary Education. 2005. Notes and Orders, Press Note dated 19/05/05 District Education Officer. 10 May. 2005. Memo No. DEO/UT/Stat/2005/6891-93. Statistics Division, District Education Office, Chandigarh. Education Secretary (Chandigarh Administration). 25 October, 2000. Letter DPT-UT-S7-11/2000, Chandigarh in Figures. Chandigarh. Gayatri, Geetanjali. 6 May, 2004. “Entrance tests at model schools to cope with rush”. Tribune. http://www.tribuneindia.com/2004/20040506/cth1.htm Accessed on June 13, 2005 Government of India. 2001-2. Selected Education Statistics. Planning, Monitoring and Statistics Division, Department of Education, Ministry of Human Resource Development. Mehta, A C. 2004. Elementary Education in India - where do we stand?. New Delhi: Educational Consultants India Limited, 2004 Mehta, Arun C. "Can there be Alternative Indicators of Enrolment? A Critical Review of the frequently Used Indicators." Journal of Educational Planning and Administration: 551-565 Ministry of Home Affairs. 1999-00. Government of India. Detailed Demand for Grants (Union Territories without Legislature) Ministry of Home Affairs. 2000-2001. Government of India. Detailed Demand for Grants (Union Territories without Legislature) Ministry of Home Affairs. 2002-2003. Government of India. Detailed Demand for Grants (Union Territories without Legislature) Ministry of Home Affairs. 2003-2004. Government of India. Detailed Demand for Grants (Union Territories without Legislature) Ministry of Home Affairs. 2004-2005. Government of India. Detailed Demand for Grants (Union Territories without Legislature) Ministry of Home Affairs. 2005-2006. Government of India. Detailed Demand for Grants (Union Territories without Legislature) Mohindra, Meenakshi. 2005. Interview by author. Verbal Interview. Devan Aggarwal Bhavan Vidyalaya, Sector 27, Chandigarh. June 28, 2005

Centre for Civil Society 33
Raj, Des. 2005. Interview by author. Verbal Interview. Directorate of Public Instruction, Sector 9, Chandigarh. June 28, 2005 Sharma, C M. 2005. Interview by author. Verbal Interview. Jawahar Navodaya Vidyalaya, Sector 25, Chandigarh. June 28, 2005 Sharma, Monica. 25 July, 2002. “Why model schools are the ‘preferred ones’”. Tribune. Chandigarh. http://www.tribuneindia.com/2002/20020626/cth2.htm Accessed on 29 May, 2005 Sharma, Monica. 5 July, 2003. “No more science seats in model schools”. Tribune. Chandigarh http://www.tribuneindia.com/2003/20030706/cth2.htm#2 Accessed on 20 June, 2005 Singh, Gurjan. 2005. Interview by author. Verbal Interview. Govt. Girls Model High School. Sector 8B, Chandigarh. June 29, 2005 Statistics of Education in States: Numerical Data, 2001-2. Form ES-I, Ministry of HRD, Government of India Statistics of Education in States: Numerical Data, 2002-3. Form ES-I, Ministry of HRD, Government of India Statistics of Education in States: Numerical Data, 2003-4. Form ES-I, Ministry of HRD, Government of India Statistics of Education in States: Numerical Data, 2004-5. Form ES-I, Ministry of HRD, Government of India Tribune Correspondent. 15 March, 2003. “Administration plans to uplift model schools”. Tribune, Chandigarh. http://www.tribuneindia.com/2005/20050316/cth2.htm Tribune Correspondent. 23 May, 2004. “Girls outshine Boys”. Tribune, Chandigarh. http://www.tribuneindia.com/2004/20040524/cth1.htm UNESCO Institute of Statistics. 2002-2003. Annual Education Survey.