Analysis of goniophotometric reflection curves -...
8
Journal of Research of the National Bureau of Standards Vol. 48, No.6, June 1952 Research Paper 233 5 Analysis of Goniop hotometric Reflection Curves Isadore Nimeroff Surface ap pearance, apart fr om texture, is defined by the goniophotomet ric c ur ve gi ving t he a ngular dis tribution of the re fl ected ligh t, but a s ummary of c urre nt gonio photo- metr ic tec hn iq ues s hows t ha t essen tia l parts of these fundamenta l data have been neg l ected. An est ablis hed metho d of stati st ics is app lied to the probl em of goniopho tomet ric-cu rve analysis and interpret ation whereby such data are re du ced to dispersion, skewness, and k ur tosis indexes. The kurtosis index is sho wn to co rrelate bette r with s ubj ect ive est im ates of the dist inc tness of the re fl ected images t han t he co nve ntional meas ure, 60 0 spec ul ar gloss. Th e kurtos is index is applied to o ne problem in the sel ect ion of optimum glossmete r geometrY·: :ii 1. Introduction II In pursuit of a m ethod for specifying glossiness, or luster, of surfaces many th eorists, researchers, and engineers, physical and psychophysical, have devoted t hought and time to theorizing and experimenting. T eehniqu es for measur ement have b een devised, ranging from observation wIth a smgle set to obser- vations involving many se t of illuminating a nd viewing co nditions. The former of these techniques is an oversimplified solution to the proble m; the latt er is too costly and time consuming to perform for every surfa ce und er consideration. Such a complete set of data was published by Thaler [1] 1 for a seri es of magn esium oxide surfaces. A compromise b etween these extremes is required. Sueh a com- promise involves obtaining goniophotometric curv e near the angle of specular re fle ction in the plane of measur ement for one unidire ctional inciden ce angle. 2 2. Goniophotometers The earliest known goniophotometer is the one devised by Bouguer [2] in attempting to corroborate Lamb ert 's law [3 ] by experiment al evidence. Since then many goniophotometers have b een developed and described. The problem of how to analyze and interpret the curves obtained on goniophotometers till remains. This pap er proposes using an estab- lished statistical method to analyze monoplane goniophotometric re fle ction curves, yielding numerics that correlate with sp ecular glo s and e timates of dis tinc tness-of-image gloss. Many workers in the fi eld of glo simetr y have realized that the only way to specify completely the optical properties of refl ecting surfaces is by analy z- ing goniophotometric curves of the reflected light. In the interest of economy one goniophotometric reflection curv e for one angle of incidence and one plane of view may provide an adequate account of what happens to the flux reflected by a surface. This flux distribution can be measur ed visually or photoelectrically. Th e mo st d etailed description of a visual goniopho to meter is given by McNichola [4] . Hi instrument had provision for diffuse and unidi- 1 F igures in brackets indicate tbe literature references at the end of tbis paper. , Photometric definitions and terms used here are contained in a paper by Hammond and NimerofI [6]. 441 rectional illumination and multiplane view. He used his goniophotometer to obtain di tribution curv es for diffusing media. Wetlaufer and Scot t [5 ] described a photoelectric goniophotometer with recta n.gul ar so ur ce and receiver apertures summing to 50' by 5.5°, bu t the relative siz es of these apertures were not given . Th ey ob tained goniophotometric data ncar the angle of sp ecular reflection with 45 ° incidence for 13 ma terials exhibiting reflection ranging from nearly co mpletely pecular to nearly completely diffu e, and drew co nclusions about the relative merits of large and small inciden ce angles in the measur em ent of specular gloss. Only one incidence angle was used, and no analysis of the goniopho torn etric data was mad e. In a pap er on 60 ° sp ecular-gloss meas ur ement [6} Hammond and Nimeroff described the optics of a photoelectronic monoplane goniophotometer having high resolution, 0 .3 0 circular sour ce, and 0.6° cir cular receiver apert ures. With thi instrument fractional refl ectan ce curv es were obtained for a erie of sp ecimens obviously differing in appearance, yet having approximately the same 60 ° pecular-gloss readings according to the A TM Method [7].3 Th e curves indicated that these specimens h ad r ad ically different fra ctional-refl ectan ce di stributions. If the information contained in these curv es could be adequately expr essed as a single number , a better index of gloss characteri stics would be obtained than is possible from the simple measur ement of sp ec ul ar gloss. 3. The Concept of Moments A method for the description of these fra ctional- reflectan ce curves may be found in the fi e ld of sta- tistics, where the techniqu e of chara cterizing various types of frequency di stributions is of fundamental importance. In stati st ics the meas ur es of dispersion, skewness, and peakedness have b een found to facili- tate co mparison between distributions. These measures ar e computed by the u sc of moments. A brief resume of the con cept of moments follows . With observed frequenci es, iI, i2, . . ., i n, cor- responding to variabl es, Xl, X2. . • ., Xn, and with the sum of the frequencies, i1 +il+' . . +fn equal 3 Wherever 60° specular gloss is mentioned this method is implied.
-
Upload
hoangtuyen -
Category
Documents
-
view
235 -
download
0
Transcript of Analysis of goniophotometric reflection curves -...
Journal of Research of the National Bureau of Standards Vol. 48, No.6, June 1952 Research Paper 2335
Analysis of Goniophotometric Reflection Curves Isadore Nimeroff
Surface appearance, apart from texture, is defined b y t he goniophotometri c curve gi ving t he a ngular distribution of the reflected light, but a summary of current go niophotometric techniques shows t hat essential parts of these fundamenta l data have been neglected. An established method of statistics is applied to the problem of goniopho tometri c-curve analys is and interpretation whereby such data a re reduced t o dispersion, skewness, and kur tosis indexes. The ku r tosis index is shown to correlate better with subjective estimates of t he d istinctness of t he reflected images t han t he conventional measure, 60 0 spec ular gloss. The kurtosis index is applied to one problem in t h e selection of optimum glossmeter geometrY·: :ii
1. Introduction II In pursuit of a method for specifying glossiness,
or luster, of surfaces many theorists, researchers, and engineers, physical and psychophysical , have devoted thought and time to theorizing and experimenting. T eehniqu es for measurement have been devised, ranging from observation wIth a smgle set to observations involving many set of illuminating and viewing conditions. The former of these techniques is an oversimplified solu tion to the problem; the latter is too costly and time consuming to perform for every surface under consideration. Such a complete set of data was published by Thaler [1] 1 for a series of magnesium oxide surfaces. A compromise between these extremes is required . Sueh a compromise involves obtaining goniophotometric curve near the angle of specular reflection in the plane of measuremen t for one unidirectional incidence angle.2
2 . Goniophotometers
The earliest known goniophotometer is the one devised by Bouguer [2] in attempting to corroborate Lambert's law [3] by experimental evidence. Since then many goniophotometers have been developed and described . The problem of how to analyze and interpret the curves obtained on goniophotometers till remains. This paper proposes using an estab
lished statistical method to analyze monoplane goniophotometric reflection curves, yielding numerics that correlate with specular glo s and e timates of dis tinc tness-of -image gloss.
Many workers in the field of glo simetry have realized that the only way to specify completely the optical properties of reflecting surfaces is by analyzing goniophotometric curves of the reflected light. In the interest of economy one goniophotometric reflection curve for one angle of incidence and one plane of view may provide an adequate account of what happens to the flux reflected by a surface. This flux dis tribu tion can be measured visually or photoelectrically. The most detailed description of a visual goniopho tometer is given by M cNichola [4] . Hi instrument had provision for diffuse and unidi-
1 F igures in brackets indicate tbe literature references at the end of tbis paper. , Photometric definitions and terms used here are contained in a paper by
Hammond and NimerofI [6].
441
rectional illumination and multiplane view. H e used his goniophotometer to obtain di tribution curves for diffusing media.
Wetlaufer and Scot t [5] described a photoelectric goniophotometer with rectan.gular source and receiver apertures summing to 50' by 5.5°, but the relative sizes of these apertures were not given . They ob tained goniophotometric data ncar the angle of specular reflection with 45° incidence for 13 materials exhibiting reflection ranging from nearly completely pecular to nearly completely diffu e, and drew
conclusions about the rela tive merits of large and small incidence angles in the measurement of specular gloss. Only one incidence angle was used, and no analysis of the goniopho tornetric data was made.
In a paper on 60° specular-gloss measurement [6} Hammond and Nimeroff described the optics of a photoelectronic monoplane goniophotometer having high resolution, 0.3 0 circular source, and 0.6° circular receiver apertures. With thi instrument fractional reflectance curves were obtained for a erie of specimens obviously differing in appearance, yet having approximately the same 60° pecular-gloss readings according to the A TM Method [7].3 The curves indicated that these specimens had radically different fractional-reflectance distributions. If the information contained in these curves could be adequately expressed as a single number, a better index of gloss characteristics would be obtained than is possible from the simple measurement of specular gloss.
3. The Concept of Moments
A method for the description of these fractionalreflectance curves may be found in the field of statistics, where the technique of characterizing various types of frequ ency distributions is of fundamental importance. In statistics the measures of dispersion, skewness, and peakedness have been found to facilitate comparison between distributions . These measures are computed by the usc of moments. A brief resume of the concept of moments follows .
With observed frequ encies, iI, i2, . . ., i n, corresponding to variables, Xl, X2. . • ., Xn , and with the sum of the frequencies, i1 +il+' . . +fn equal
3 Wherever 60° specular gloss is mentioned this method is implied.
n :to ~di, we define the kth moment,
1 n n ~di Xr ~diX~
1 1 J.i. k n N
~di 1
(1)
n where N = ~Ji . In other words, the kthmoment is
1 . the arithmetic mean of the kth powers of the variate, X t . When the axis of moments is taken about the .centroid of mean, X, or the variable Xi then,
n ~d;(xi- x)k
1 (2) 7rk N
is the lcth monent about the centroid, or mean.
4 . Curve Analysis
Harrison [8] suggests that polar-intensity distribution curves should be analyzed to obtain the desired information about surface appearance . He suggests also that these polar curves should not be considered as composed of ellipses, circles, and straight lines, because the specular components (lines) cannot be separated physically from the diffuse components (circles). Barkas [9] suggests a method for theoretically separating these two components for fairly matte surfaces by substituting an equivalent surface for a physical surface . The Barkas treatment has not yet been applied to semiglossy and glossy surfaces.
Pokrowski [10] found that by summing the diffuse reflection and the specular-reflection components one could obtain for a given angle of illumination the distribution of reflected flux for all directions. The computation of these components is made on the assumption that diffuse reflection obeys Lambert's law and that the specular reflection obeys Fresnel's law [11] for an equal distribution of mirror facets oriented at all possible angles. Chinmayanandam {l2] derived an exponential expre sion to account theoretically for the reflection from optically rough surfaces by assuming that the angles between the reflecting elements and the gross plane are randomly distributed according to the probability law.
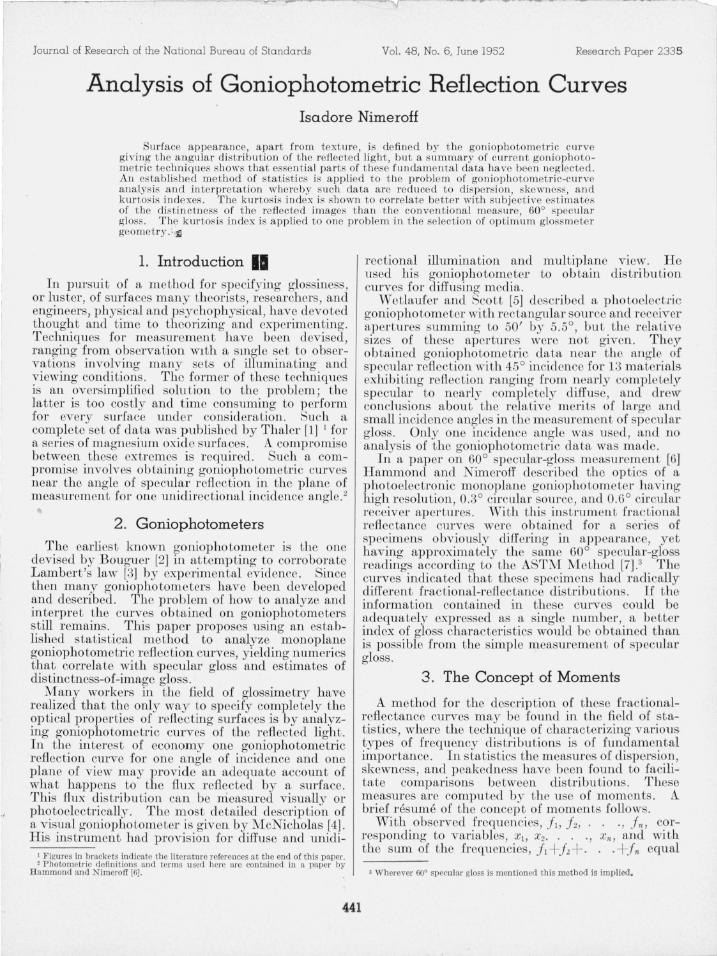
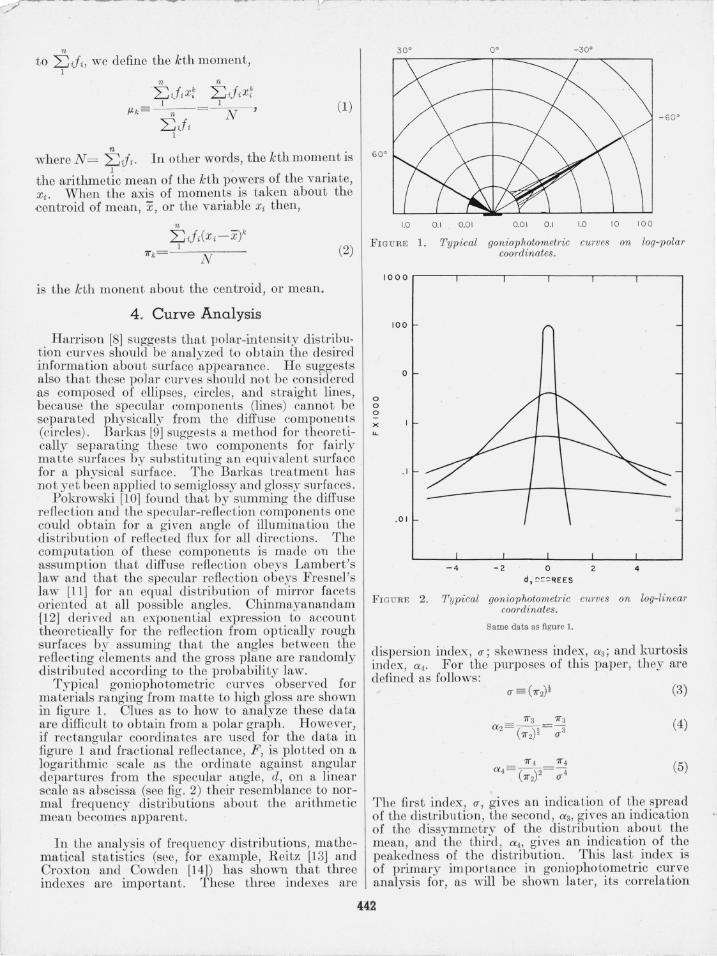
Typical goniophotometric curves observed for materials ranging from matte to high gloss are shown in figure 1. Clues as to how to analyze these data are difficult to obtain from a polar graph. However, if rectangular coordinates are used for the data in figure 1 and fractional reflectance, F , is plotted on a logarithmic scale as the ordinate against angular departures from the specular angle, d, on a linear scale as abscissa (see fig . 2) their resemblance to normal frequency distributions about the arithmetic mean becomes apparent.
In the analysis of frequency distributions, mathematical statistics (see, for example, Reitz [13] and Croxton and Cowden [14]) has shown that three indexes are important. These three indexes are
30 0
600
1.0
F IGURE
o o o
x "-
1000
100
o
. 1
.01
0 .1 0.01
1. Typical
-4
0 0
0 .0 1 0 .1
goniophotometric coordinates.
-2 o d, !::!:::REES
-300
- 60 0
1.0 10 100
curves on log-polar
2 4
FIGU RE 2. T ypical goniophotometric curves on log-lin ear coordinates.
Same data as fi gure 1.
dispersion index, (J' ; skewness index, a 3; and kurtosis index, CX4' For the purposes of this paper, they are defined as follows:
(3)
(4)
(5)
The first index, (J' , gives an indication of the spread of the distribution, the second, a 3, gives an indication of the dissymmetry of the distribution about the mean, and the third, a4, gives an indication of the peakedness of the distribution. This last index is of primary importance in goniophotometric curve analysis for, as will be shown later, its correlation
442
with estimates of dis tinctness-of-refiec ted-image gloss is almost perfec t .
A 'method was devised by Pelton [1 5] in which he obtains a series of measurements of photometric brightne s, B o, by tilting a specimen about an axis in the photometric plane. Thus he obtained a type of goniophotometric distribution curve with simultaneously varying incidence and viewing angles. This curve sugges ted to him an analogy to the frequency distribut ion curve according to the law of probability. H e thell computed the dispersion index, u , (usually called s tandard deviation) using the relation,
(6)
where e is the angle of tilt of the specimen . This equation is analogous to taking the square root of eq (1), for which k = 2. As the standard deviation has an inverse rela tion to the sharpness of his curves, Pelton took l /u as a measure of wha t he called " peakiness ."
4 .1. Computation Short Cuts
To shorten the computa tion we define deviates, d j , from an assumed mean, X' . Then moments
(7) N
about x' are r ela ted to 'Irk about the mean by the general expression obtained from the expansion of the binomial in eq (2),
(8)
where
( k) k! t = t! (k - t)!'
t being an integer having values, 0 -::;' t -::;' lc . The first five m om ent about th e mean ( 'IrQ, 71"1, 71"2 ,
71"3, and 'Ir4) are in table 1. Dispersion, skewness, and kurtosis indexes may then be defined in terms of these moments.
T ABL E 1. Definiti on cf indexes
k
1 o
2 "2- v l
jJ2-3pIV2+2p~ "4 -4V IV3+ 6/1~V2X3v~
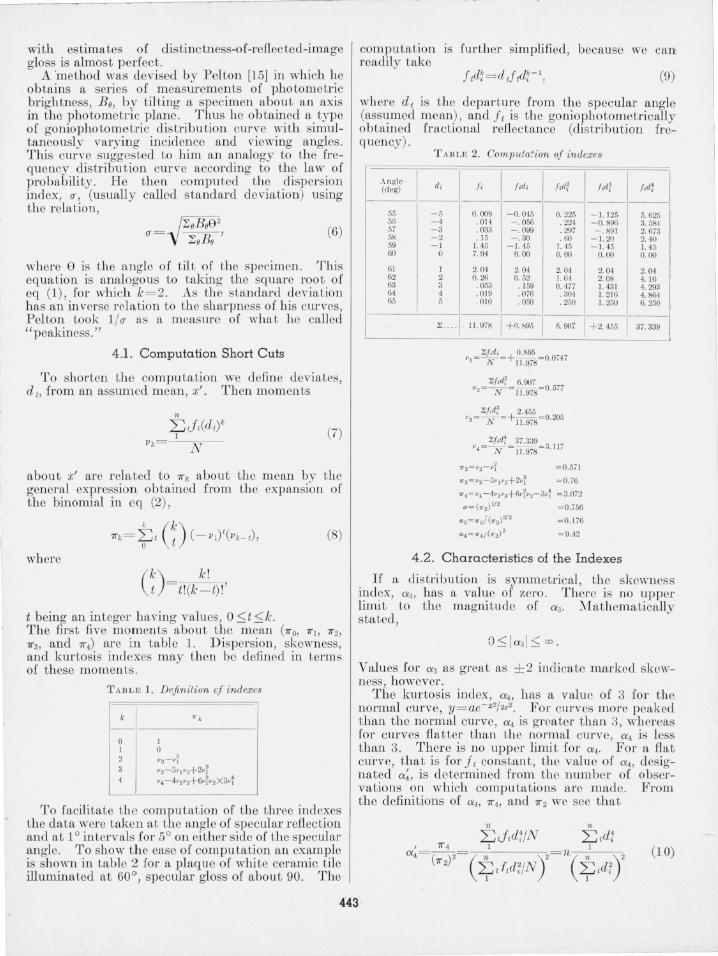
To facilitate the computation of the three indexes the data were taken a t the angle of specular reflection and at 10 intervals for 5 0 on either side of the pecular angle. To show the ease of computation an example is shown in table 2 for a plaque of white ceramic tile illuminated at 60°, specular gloss of about 90. The
computation is furth er simplified, because we can readily take
(9)
where d t is the departure from the sp ecular angle (assumed mean), and ft is the goniophotometrically obtained fractional reflectance (distrihution frequency).
Angle (deg)
55 56 57 58 59 60
61 62 63 64 65
T A BLE 2. Computa:ion of indexes
d,
- 5 - 4 - 3 - 2 - 1
0
1 2 3 4 5
1:: ____
[ , I,d, /id; ---------
0.009 - 0.045 0. 225 . 014 - . 056 . 224 . 033 - .099 . 297 . 15 - . 30 . 60
1. 45 - 1.45 1. 45 7. 94 0.00 0. 00
2. 04 2. 04 2. 0·1 0.26 0. 52 1. 04 . 053 . 159 0. 177 . 019 . 076 .30'1 . 010 . 050 . 250
------11. 978 +0. ~95 6.907
1::/,d, 0.895 _ " =iV=+ 11.978=0.0147
Xf;d; 6.907 '2 =iV= 11.978 = 0. 577
1::[id~ 2.455 "3=iV=+1l .97 = 0.205
xf;d1 37.339 · , =iV= 11.978 =3. 117
1I'" z= "'2-vi = O. 57L
1I'"3="3-ih/l"2+2,,1 = 0 .76
1I"4 =v4. - 4vI Jla+6J1ivz-3v1 =3 .072
u = ("2) 1/2 = 0.756
«3="3/("2)312 = 0.176
«'="4/("2)2 = 9.42
l id: ---
- 1. 125 - 0.896 -. 89 [
- 1. 20 - 1.45
0. 00
2. 04 2. 08 1. 431 1. 216 1. 250
---+2. 455
4.2. Characteristics of the Indexes
/idt ---
5.625 3.584 2. 673 2. 40 1. 45
, 0. 00
i
2. 04 4. 16 4. 293 4. 864 6.250
---37. 339
If a distribution is sJImnetrical , the skewness index, (X3, has a value of zero . There is no upper limit to the magni tude of (X3. Mathematically s tated,
0 -::;' I cx31 :::; 00 •
Values for (X3 as great as ± 2 indicate marked skewness, however.
The kurtosis index. (X4 , has a valu e of 3 for the normal curve, y = ae- z2/2U2. For curve more peaked than the normal curve, (X4 is greater than 3, whereas for curves :flatter than th e normal curve, (X4 is less than 3. There is no upper limit for (X4 . For a fla t curve, that is for } ; constant, the valli e of (X4 , designated (X~ , is determined from the number of observations on which computations are made. From the definitions of (X4. 'Ir4, and 'Ir2 we see tha t
(10)
443
----.-" ------- .--- ~--.~ ---~- - -- -- .----~~---~-~--
where n = N /.f i=number of angle settings. The general case for 1 ° intervals is shown as follows: We have
(II)
where X i represen ts positive numbers ranging from 1 to M, since observations are made at posi tive and negative angles. Then , n = 2M + 1 since n includes di= O°. The sums of the first two even powers of
The upper limi ting value, La~, of the kurtosis index for a complete diffusor aslv[ increases wi thout bo und IS
La~= g / 5 = 1.8 . M -+CX)
The lower limi t occurs when 111= 1, observations are taken at th e specular ± 1°. In this C.lse a~= 1.8- 0.3 = 1.5. state, mathematically:
1.5 ::; a~::; 1.8.
that is when angle and at Thus we may
For the number of the interval s used in this analysis, that is five in tervals on either side of the specular angle, n= 11 , 1v[ = 5. Thus for a completely diffu sing surface, that is, one having constanLji
Should we wish to defin e a scale of peakedness for which a perfect diffuser is ass igned the value zero, then we may sub tract a~ from a4 , and call the resulting difference th e peakedness index, P.
Thus (13 )
If the ordinates of one distribution are a constan t factor of the corresponding ordinates of another distribution, then the indexes IY, a3, and a4 for one distribution will equal the corresponding indexes for the other. To distingui sh one eurve from the oth er, one poin t on eaeh curve needs to be specified . A convenien t point is the value of the fractional refle ctance at the specular angle.
The dispersion index, !!, is at its lower limit for completely specular reflection, and is large for completely diffuse refl ection. The lower limit is zero, b ecause di= Oo at the specular angle. The value for completely diffuse rrflection is determined as foll ows:
the firs t 1.V£ natural numbers may be compuLC'd from the following equ ations:
and
~iXt=(3M2+:M - 1 )(2~ + 1)( M(~ + 1))
Thus (1 2)
For completely diffuse reflection, j l= constan t,
But from eq 11
Here also n= 2M+ l , and from eq 12
(14)
For the number of the intervals used in this analysis, M = 5. Thus when}i is constant, !!= 3.16.
The characteristics for the indexes, a 4 and IY, lead to conclusions about th eir utili ty in describing surface appearance. Consider the ranges of these two indexes for the number of observations used in this analysis. Mathem atically stated, from flat to peaked curves, the ranges are 1.78 ::; a4::; (X) and 3.16>IY>O. When a r'eflection curve is flat , a4 has a small value in its range, while IY has a large value in its range. Conversely, when a curve describes a completely specular r eflection, a;l is at its upper limit, and IY is at its lower limit . Thus a 4 may indicate glossiness directly , and!! may indicate glossiness inversely .
5 . Application to Glossimetry
The practice of glossimetry is now quite well established and generally yields satisfactory discriminations, but must be recognized as an abridged goniopho tometric technique. Just as in the problems of colorimetry, the standardization of abridged methods of measurement is necessary t o enable one to obtain on a common basis rapid comparisons during production of a specific material. The gen-
444
€ral method of analyzing goniophotometric distribution curves described in this paper may be the means -of arriving at some instrumental D'eometry and recommended procedures for making objective evaluations of the surface appearance attribute ascribable to gloss.
Subjective observations on the specular gloss of specimens are usually made without usc of anglemeasuring devices. Therefore, as the skewness index is a measure of dissymmetry of a distribution, no attempt is made to correlate this index with the surface-appearance attribute ascribable to gloss.
The first problem confronting this analysis is, do the indexes a4 and (]" correlate with surface appearance, specular gloss, and distinctness-of-image gloss, as well as or better than the existing glossimetry techniques? If the correlations prove satisfactory, the next problem is how to interpret this analysis so that instrument geometry for abridged methods may be selected wiseJy. Three important geometric variables of a glossmeter are (l) angle of incidence, (2) receiver aperture size, (3) Lhe ratio of the angular size of the source to the receiver aperture.
5.1. Correlation with Distinctness of Reflected Images
One of the attribu tes of surface appearance is the dis tinctness with which images arc reflected. This attribute is influenced by at least two properties of specimens. One of th e properties is the smoothness of the surface, the other is the diffuse reflection oi the specimen. Lack of smoothness tends to distort the reflected images, and diffuse reflection controls the contrast between highlight and shadow.
Heretofore no satisfactory method has been devised to measure objectively distinctness-oI-image gloss. Hunter [16] in 1936 described a photographic technique for recording distinctness of reflected images. However , no quantitative analysis was indicated in his paper.
a. Experimental Conditions
As there is need for a quantitative index of distinctness of reflected images, the kurtosis index wa tested for correlation with distinctness of image estimates. For this experiment estimates were made by six observers, ranging in familiarity with the pr?blems from thoroughly experienced to completely nalVe.
The 22 specimens used were of the following materials: Polished black glass, sand-blasted black glass, acid-etched black glass, polished white Vitrolite, depolished white Vitrolite, and white ceramic tile. These specimens were placed on a black cloth-covered table. The table was placed near a window so that the specimens were illuminated by north-sky light. The estimates made by the observers were on the distinctness of the images of the crossbars of the window. Observers were permitted to turn, tilt, or raise the specimens during the evaluations. The observers arranged the specimens in the order' of estimated decreasing distinctness of the reflected images. The resulting
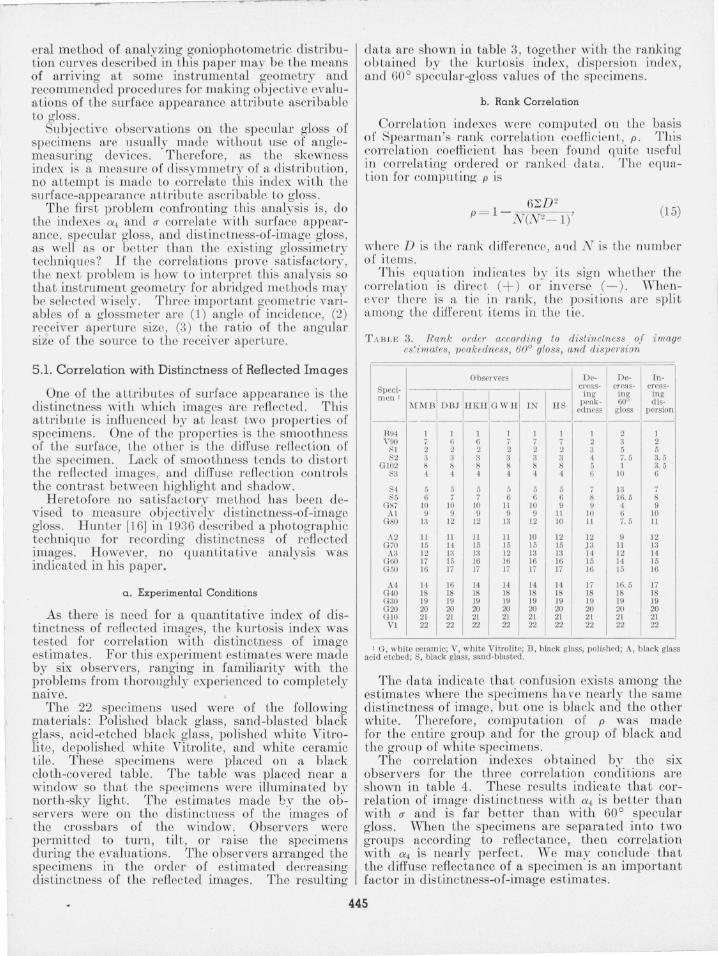
data are shown in table 3, together with the ranking obtained by the kurtosis index, dispersion index, and 60° specular-gloss values of the specimens.
h . Rank Correlation
Correlation indexes were computed on the basis of Spearman's rank correla tion coefficient, p. This correlation coeffi cie nt has been found quite useful in correlating ordered or ranked data. The equation for computing p is
(15)
where D is the rank difference, and N is the number of items.
This equation indicates by its sign whether the correIa tio n is direc t. (+ ) or in verse (-) . Whene\'er there is a tic in rank, the positions arc split among the different items in the tic.
T ABL8 3. Rank order according 10 disiinrtness oj i mage es:imates, peakedness, 60° gloss, and dispcI'sion
Observers De· Do- In · 8peci· crcas- crca s- crcas-men 1
lN l~ ing ing ing
MMB DBJ llKll own penk· 60° dis· cdness gloss persion
---------- ------B94 1 1 1 1 1 1 1 2 1 V90 7 6 6 7 7 7 2 3 2
81 2 2 2 2 2 2 3 5 5 82 3 3 3 3 3 3 4 7.5 3.5
0102 8 8 8 8 8 8 5 1 3.5 83 4 4 4 4 4 4 6 10 6
84 5 5 5 5 5 5 7 13 7 85 6 7 7 6 6 6 8 16.5 8
087 10 10 10 Jl 10 9 9 4 9 Al 9 9 9 9 9 Jl 10 6 10
080 13 12 12 13 12 10 11 7.5 II
.'1.2 11 11 11 II 10 12 12 9 12 GiO 15 14 15 15 15 15 13 11 13 A3 12 13 13 12 13 13 l4 12 14
060 17 15 16 16 16 16 15 14 15 050 16 17 17 17 17 17 16 15 16
.'1.4 14 16 14 14 14 14 17 16.5 17 040 18 18 18 18 18 18 18 18 18 030 19 19 19 19 19 19 19 19 19 020 20 20 20 20 20 20 20 20 20 010 21 21 21 21 21 21 21 21 21
V1 22 22 22 22 22 22 22 22 22
1 0, white ceramic; V, white Vitrolite; B, black glass, polished; A, black glass acid etched; 8, black glass, sand·blasted .
The data indicate that confusion exists among the estimates where the specimens ha ve nearly the same distinctness of image, but one is black and the other white. Therefore, computation of p was made for the entire group and for the group of black and the group of white specimens.
The correlation indexes obtained by the six observers for the three correlation conditions are shown in table 4. These results indicate that correlation of image distinctness with a4 is better than with (]" and is far better than with 60 ° specular gloss. When the specimens are separated into two groups according to reflectance, then correlation with a4 is nearly perfect. We may conclude that the diffuse reflectance of a specimen is an important factor in distinctness-of-image estimates.
445
....... - -_. ~ --,-- ------~.~.~~---., ... ------~-----------....,
TABLE 4. Summary of correlation coefficients
Observer
DEI HKE
I N H S
MMB GWH
Rank correlation coefficien t
Black and white Black only White only
0.975 0.965 . 968 .958 .962 . 951 . 963 . 952 .957 .952 .955 .948
60° gloss
o. 795 1. 000 o. 988 • 7b6 1. 000 . 988 · 771 1. 000 . 988 · 773 1. 000 . 988 · 765 1. 000 . 988 · 760 1. 000 . 988
60° gloss
O. 664 1. 000 1. 000 · 664 1. 000 1. 000 · 664 1. 000 1. 000 · 664 1. 000 1. 000 · 664 1. 000 1. 000 · 664 1. 000 1. 000
60° gloss
0.993 . 993 .993 . 993 .986 .993
Mean. 0.963 0.954 0.775 1. 000 0. 988 0.664 1. 000 1. 000 0.992
5.2. Correlation With 60° Specular Gloss
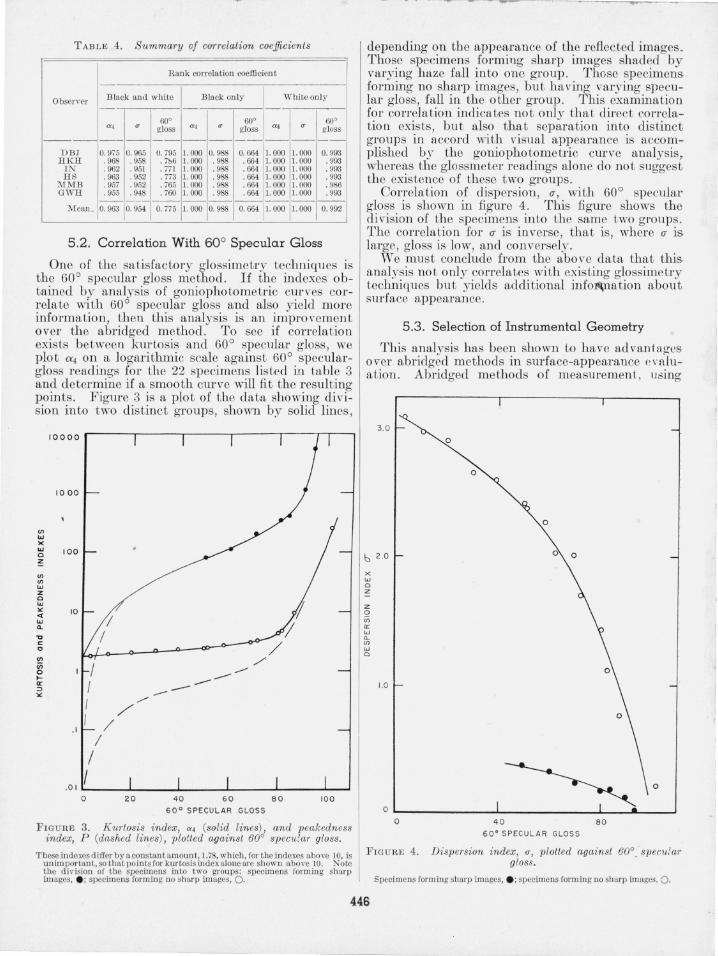
One of the satisfactory glossimetry techniques is the 60° specular gloss method . If the indexes obtained by analysis of goniophotometric curves correlate with 60° specular gloss and also yield more information, then this analysis is an improvement over the abridged method. To see if correlation exists betweeu kurtosis and 60° specular gloss, we plot iX4 on a logarithmic scale against 60° speculargloss readings for the 22 specimens listed in table 3 and determine if a smooth curve will fit the resulting points. Figure 3 is a plot of the data showing division into two distinct groups, shown by solid lines,
(/)
w )(
w o z (/) (/) w Z o w
"" ..: w 0..
." C o (/)
en o 0-cr ::J
""
10000
1000
100
10
. 1
/ I {
I
I /
/' /
--/'
,/
-------
f /
/
I .O IL-____ ~ ______ ~ ____ ~~ ____ ~ ______ ~~
o 20 40 60 80 10 0
60 ° SPECULAR ·GLOSS
FIGURE 3. Kurtosis index, a4 (solid lines), and peakedness index, P (dashed lines), plotted against 60° specular gloss.
These indexes differ by a constant am ount, 1.78, which, for the indexes above 10. is nnimportant, so that points for kurtosis index alone are shown above 10. N ote t he division of the specimens into two groups: specimens formiug sharp images, . ; specim ens formiug n o sharp images, O.
depending on the appearance of the reflected images . Those specimens forming sharp images shaded by varying haze fall into one group. Those specimens forming no sharp images, but having varying specular gloss, fall in the other group . This examination for correlation indicates not only that direct correlation exists, but also that separation into distinct groups in accord with visual appearance is accomplished by the goniopho tometric curve analysis, whereas the glossmeter readings alone do not suggest the existence of these two groups .
Correlation of dispersion, IJ, with 60° specular gloss is shown in figure 4 . This figure shows the division of the specimens into the same two groups. The correlation for IJ is inverse, that is, where IJ is large, gloss is low, and conversely.
We mu st conclude from the above data tha t this analysis not only correlates with existing glossimetry techniques but yields additional infoM;nation about surface appearance.
5.3. Selection of Instrumental Geometry
This analysis has been shown to have advantages over abridged methods in surface-appearance evaluation. Abridged methods of measurement, using
3.0
o
o
o
6 2 .0
x w o Z
z 2 <J)
cr w "<J)
w o
1.0
o ~ o ~ ____________ ~ ______________ ~ __ ~L-__ ~
o 40 80 GO· SPECULAR GLOS S
FIGURE 4. Dispersion index, u, plotted against 600 specular gloss.
Specimens formiug sharp images, . ; specimens formiug no sharp images. O.
446 I . i
glossmeters, are required to obtain information economically during the production of materials. Glossmeters, as well as goniophotometers, should have geometry to yield optimum discrimination between specimens. Assuming that the receiver is adequately sensitive, the resolution and the incidence angle may be chosen to yield this optimum discrimination.
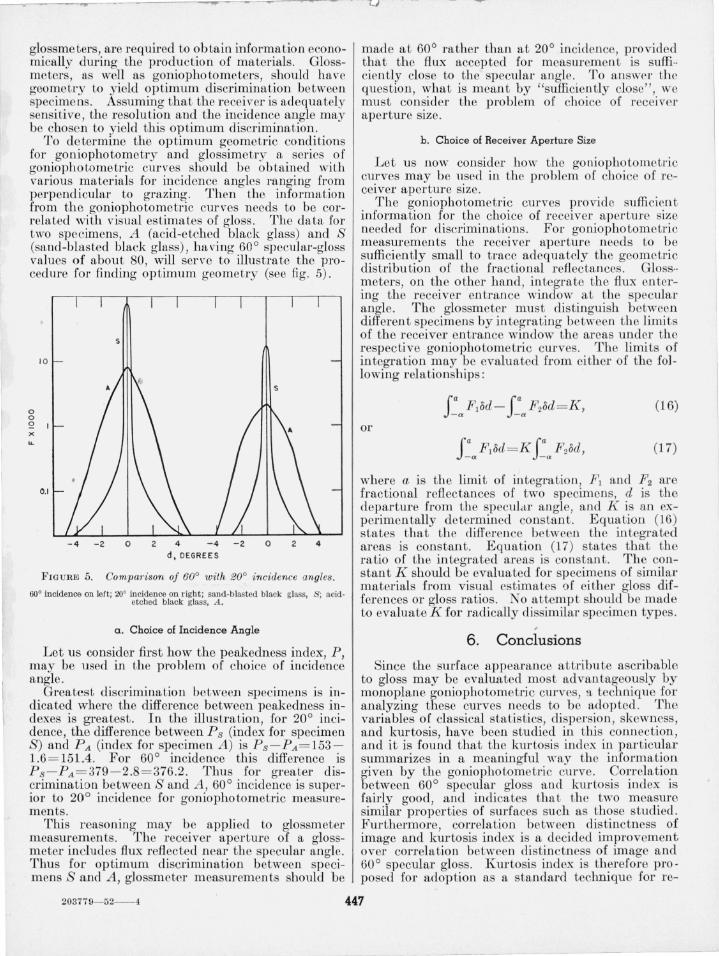
To determine the optimum geometric conditions for gonio pho tometry and glossimetry a series of goniopho tometric cunes should be obtained with \Tarious materials for incidence angles ranging from perpendicular to grazing. Then the information from the goniopho tometric curves needs to be correla ted with visual estimates of gloss. The data for two specimens, A (acid-etched black glass) and S (sand-blasted black glass), ha ving 60° specular-gloss values of about 80, will serve to illustrate the procedure for finding optimum geometry (see fig . 5).
o o
10
2 I x IL
0.1
s
-4 -2 o 2 4 - 4 -2 0 2 4 d. DEG REE S
FIGURE 5. C01npm'ison of 60° with 20° incidence angles.
60° incidence on lef t ; 20° incidence on right; sand· blasted black glass, S; acidetched black glass, A .
a . Choice of Incidence Angle
Let us consider first how the peakedness index, P, may be used in the problem of choice of incidence angle.
Greatest discrimination between specimens is indicated where the difference between peakedness indexes is greatest. In the illustration, for 20° incidence, the difference between Ps (index for specimen S) and P A (index for specimen A) is P s - PA = 153 -1.6 = 151.4. For 60° incidence this difference is P s - PA = 379 - 2.8= 376 .2. Thus for greater discrimination between S and A, 60 ° incidence is superior to 20° incidence for goniophotometric measurements.
This reasoning may be applied to glossmeter measurem ents. The receiver aperture of a glossmeter includes flux reflected near the specular angle. Thus for optimum discrimination between specimens S and A, glossmeter measuremen ts should be
made at 60° rather than at 20° incidence, provided that the flux accepted for measurement i suffi .. ciently close to the specular angle. To a nsw(,r th e que tion, what is meant by "sufficiently close", we must consider the problem of choice of receiver aperture size.
h. Choice of Receiver Aperture Size
Let us now consider how the go niopho tometric curves may be llsed in the problem of choice of receiver aperture size.
The goniophotometric curves provide sufficien t information for the choice of receiver aper ture size needed for discriminations. For goniophotometric m easurements the receiver aperture needs to be sufficiently small to trace adequately the geometric distribu tion of the fractional reflectances. Gloss .. meters, on the other hand, in tegrate the flux en tering the receiver entrance window at the specular angle. The glossmeter must distingui h between different specimens by integrating between the limits of the receiver entrance window the areas under the respective goniophotometric curves. The limits of in tegration may be evaluated from either of the following relation hip :
fa F1od - f aF20d= K , (16)
or
(17)
where a i th e limit of integration, Fl and F2 are fractional reflectances of two specimens, d is the departure from the specul.tr angle, and K is an experimentally determined co nstan t . Equation (16) states tha t the difference between the integrated areas is constant. Equation (17) states that the ratio of the integrated areas is constant. The constant K should be evaluated for specimens of similar materials from visual e timates I)f either gloss differences or gloss ratios. No attemp t should be made to evaluate K for radically eli imilar specimen types.
, 6 . Conclusions
Since the surface appearance attribute ascribable to gloss may be evaluated most advantageously by monoplane goniophotometric curves, a techniqu e for analyzing these curves needs to be adopted. The variables of classical statistics, dispel' ion , skewness, and kurtosis, have been studied in this connection , and it is found that the kur to is index in particular summarizes in a meaningful way the information given by the goniophotometric curve. Correlation between 60° specular gloss a nd kurtosis index is fairly good, and indicates that the two measure similar properties of surfaces such as those studied. Furthermore, correlation between distinctness of image and kurtosis index is a decided improvement over correlation between distinctness of image and 60° specular gloss. Kur tosis index is therefore pro posed for adoption as a standard technique for re-
203779- 52--4 447
- ---- ---~--~- -~ -- •
ducing goniophotometric data to meaningful numbers. This index has been applied successfully for choosing instrumental geometry for abridged goniophotometry, that is, glossimetry.
7. References
[1] F. Thaler, Die diffuse Reflexion des Lichtes an matten Oberflachen, Ann. Physik [4]11,996 (1903).
[2] P . Bouguer, Optice de diversis luminis gradibus dimentien dis. Opus posthumum in lucem editum a D. de la Caille et in latinum conversum a J oachimo Richtenberg, J . S. Joannis Thomae Trattner. Book 2, section 3, art. 3 (1762) .
[3] J. H. Lambert, Photometria sive de mensura gradibus luminis, colorum, et umbrae, Augsburg (1760) .
[4] H . J . McNicholas, Equipment for measuring the reflect ive and transmissive properties of diffusing media, J. Research NBS 13, 2] 1, (1934) RP704.
[5] L . A. Wetlaufer and vI'. E. Scott, The measurement of gloss, Ind. Eng. Chern. , Anal. Ed. 12, 647 (1940).
[6] H . K . Hammond, III, and 1. Nimeroff, Measurement of sixty-degree specular gloss, J . Research NBS 44, 585 (1950) RP2105.
[7] ASTM tentative method of test for 60° specular gloss of paint finishes, D 523, Book of ASTM Standards, Part 4 (1949).
448
I8] V. G. W. Harrison, Definition and measurement of gloss, p . 106 (Patra, Cambridge, England, 1945).
I9] W . W. Barkas, Analysis of light scattered from a surface of low gloss into its specular and diffuse components. Proc. Phys. Soc. (London) 51,274 (1939).
[10] G. 1. Pokrowski, Zur Theorie der Diffusen Lichtreflexion, Z. Physik. Part I , 30, p . 66 (1924), Part II, 35, p . 34 (1925), Part III, 35, p . 390 (1926), Part IV, 36, p. 472 (1926).
Ill] A. Fresnel, Cal cuI des t eintes que polarization developpe dans lames cristall isees, Ann . chim. phys. 17, 194, 312 (1821 ).
[12] T . K. Chinmayanandam, On the specular reflection from rough surfaces, Phys. R ev. (London) [II], 13, 96 (1919).
[] 3] H . L. Reitz, Mathematical Statistics (The Open Court Publishing Co. , LaSalle, II!. , 1927).
[14] F . E . Croxton and D . J . Cowden, Applied general statistics (Prentice Hall, New York , N. Y., 1946).
[15] M . P . Pelton, The luster of t extile fabrics and a method of measurement, Trans. Opt. Soc. (London) 31, 184 (1930) .
[16] R. S. Hunter, Gloss inves tigations using reflected images of a target pattern, J . Research NBS 16, 357 (1936) RP879.
WASHINGTON, February 29, 1952.
---~-----