Saving fuel, saving costs Impacts and reduction potential for ...
PNNL-16282
Analysis of Energy Saving Impacts of New Commercial Energy Codes for the Gulf Coast M.A. Halverson K. Gowri E.E. Richman December 2006 Prepared for U.S. Department of Energy under Contract DE-AC05-76RL01830
DISCLAIMER This report was prepared as an account of work sponsored by an agency of the United States Government. Neither the United States Government nor any agency thereof, nor Battelle Memorial Institute, nor any of their employees, makes any warranty, express or implied, or assumes any legal liability or responsibility for the accuracy, completeness, or usefulness of any information, apparatus, product, or process disclosed, or represents that its use would not infringe privately owned rights. Reference herein to any specific commercial product, process, or service by trade name, trademark, manufacturer, or otherwise does not necessarily constitute or imply its endorsement, recommendation, or favoring by the United States Government or any agency thereof, or Battelle Memorial Institute. The views and opinions of authors expressed herein do not necessarily state or reflect those of the United States Government or any agency thereof.
PACIFIC NORTHWEST NATIONAL LABORATORY
operated by BATTELLE
for the UNITED STATES DEPARTMENT OF ENERGY
under Contract DE-AC05-76RL01830
Printed in the United States of America
Available to DOE and DOE contractors from the Office of Scientific and Technical Information,
P.O. Box 62, Oak Ridge, TN 37831-0062; ph: (865) 576-8401 fax: (865) 576-5728
email: [email protected]
Available to the public from the National Technical Information Service, U.S. Department of Commerce, 5285 Port Royal Rd., Springfield, VA 22161
ph: (800) 553-6847 fax: (703) 605-6900
email: [email protected] online ordering: http://www.ntis.gov/ordering.htm
This document was printed on recycled paper. (8/00)
Analysis of Energy Saving Impacts of New Commercial Energy Codes for the Gulf Coast M.A. Halverson K. Gowri E.E. Richman December 2006 Prepared for the U.S. Department of Energy under Contract DE-AC05-76RL01830 Pacific Northwest National Laboratory Richland, Washington 99352
iii
Summary
At the request of the Government Accountability Office (GAO), DOE’s Building Energy Codes Program (BECP)1 undertook an analysis of the energy savings and cost impacts associated with the use of newer and more efficient commercial building energy codes in the states of Louisiana and Mississippi. Four building types were modeled – offices, schools, hospitals and retail buildings. These buildings were modeled in two climate locations covering the range of weather conditions typically found in the Gulf Coast region – New Orleans, Louisiana and Jackson, Mississippi. BECP looked at three levels of energy standards – ASHRAE 90-75, ASHRAE 90.1-2001, and ASHRAE 90.1-2004 – that cover both the full range of standards currently on the books in Louisiana and Mississippi and the logical next standards for these states. The results of the analysis were that for all building types and all locations, going to a newer standard saved energy. Energy cost savings of 7% to 34% could be achieved by moving from ASHRAE Standard 90-75 to ASHRAE Standard 90.1-2001. An additional energy cost savings of 7% to 14% could be achieved by moving from ASHRAE Standard 90.1-2001 to ASHRAE Standard 90.1-2004. The driving force behind these savings is lighting power allowance reduction. The newer standards call for the use of less lighting power and thus save energy because of lower lighting loads and reduced cooling loads. Also looked at were the additional energy cost savings that would be achieved by the use of “above code” or green building programs such as the US Green Building Council’s Leadership in Energy and Environmental Design LEED program, the ASHRAE Advanced Energy Design Guides, or if building owners decided to go for the Federal tax credits specified in the Energy Policy Act of 2005. Going to these programs would allow energy cost savings even higher than those associated with ASHRAE Standard 90.1-2004. Two specific sets of enhancements were applied to all buildings to show the savings that would be achievable for what might be considered typical items a designer might consider. However, savings from these enhancements resulted in levels of performance not always eligible for LEED energy points, demonstrating how hard it is to achieve significant energy savings by simply “tweaking” a few building parameters. The cost-effectiveness of these programs was not evaluated because the methods designers might use to achieve these savings are highly variable. A high-level incremental cost analysis indicated that for all buildings in all locations, these enhancements would be cost-effective as well, with simple paybacks ranging from up to 4 years for retail buildings and negative simple paybacks for other building types. The results of the cost analysis should be considered to be approximate only because incremental building costs, especially windows and fenestration, are hard to estimate without obtaining actual bids. No bids were obtained as part of this analysis.
1 Pacific Northwest National Laboratory (PNNL) Building Energy Codes Program is funded by the U.S. Department if Energy. PNNL is managed by Battelle Memorial Institute under DOE Contract DE-AC05-76RL0-1830.
iv
Contents
Summary ............................................................................................................................ iii Background......................................................................................................................... 1 Simulation Description ....................................................................................................... 2
Simulation Description ................................................................................................. 2 Building Types............................................................................................................ 2 Baseline Standards ...................................................................................................... 2 Modeling of Baseline Standards ................................................................................. 3 Target Standards ......................................................................................................... 3 Modeling of Target Standards .................................................................................... 4 Above Code and Green Program Targets ................................................................... 4 Modeling of Above Code and Green Building Targets .............................................. 5 Climate Locations ....................................................................................................... 5 Discussion of Simulation Modeling............................................................................ 6
Economic Analysis ............................................................................................................. 8 Fuel Costs Used in this Study....................................................................................... 8 First Costs Used in This Study..................................................................................... 8 Economic Analysis Methodology................................................................................. 8
Discussion of Simulation Results ..................................................................................... 10 Site and Source Energy Usage and Energy Cost Results ........................................ 10
Discussion of ASHRAE Standard 90.1-1989 Baseline .................................................... 13 Evaluation of “Above Code” and Green Standards.......................................................... 15 Cost Effectiveness of New Energy Standards .................................................................. 16 References......................................................................................................................... 21 APPENDIX A. Simulation Modeling.............................................................................. 24 APPENDIX B. Simulation Results.................................................................................. 27 APPENDIX C. Evaluation of “Above Code” and Green Building Programs................. 36 APPENDIX D. Evaluation of Lighting Cost Effectiveness............................................. 49
Analysis Method.......................................................................................................... 49 Cost Analysis Basis ..................................................................................................... 50 Lighting Power Density and Equipment Cost Comparison.................................... 51 Analysis Results........................................................................................................... 58 Additional Adoption Considerations ........................................................................ 58
Exterior Lighting Power Densities............................................................................ 58 Lighting Controls – Occupancy Sensors................................................................... 59 Compliance and Additional Lighting Power Allowances ........................................ 59
APPENDIX E. Evaluation of Envelope Cost Effectiveness............................................ 62 Basis of Envelope First Costs ..................................................................................... 62 Roof Insulation ............................................................................................................ 62 Wall Insulation ............................................................................................................ 63 Windows....................................................................................................................... 63
v
Tables Table 1 New Orleans Results – Site and Source Energy and Energy Costs.................... 10 Table 2 Jackson Results - Site and Source Energy and Energy Costs............................ 10 Table 3 New Orleans Results – Incremental Percent Improvement Over Previous Standard ............................................................................................................................ 11 Table 4 Jackson Results – Incremental Percent Improvement Over Previous Standard . 11 Table 5 Differential Energy Cost Per Square Foot (over Previous Standard) – New Orleans .............................................................................................................................. 12 Table 6 Differential Energy Cost Per Square Foot (over Previous Standard) – Jackson 12 Table 7 Addition of Estimated Standard 90.1-1989 Results to Table 1 – New Orleans . 14 Table 8 Addition of Estimated Standard 90.1-1989 Results to Table 2 – Jackson.......... 14 Table 9 Overall Cost Effectiveness - Standard 90-75 to 90.1-2001 in New Orleans ...... 17 Table 10 Overall Cost Effectiveness - Standard 90-75 to 90.1-2001 in Jackson ............ 18 Table 11 Overall Cost Effectiveness - Standard 90.1-2001 to 90.1-2004 in New Orleans........................................................................................................................................... 18 Table 12 Overall Cost Effectiveness - Standard 90.1-2001 to 90.1-2004 in Jackson ..... 19 Table A- 1 Modeling Parameters for New Orleans Louisiana by Building Type ........... 24 Table A- 2 Modeling Parameters for Jackson MS Building Prototypes.......................... 25 Table B- 1 Office Results for New Orleans..................................................................... 27 Table B- 2 School Results for New Orleans.................................................................... 28 Table B- 3 Hospital Results for New Orleans ................................................................. 29 Table B- 4 Retail Results for New Orleans ..................................................................... 30 Table B- 5 Office Results for Jackson ............................................................................. 31 Table B- 6 School Results for Jackson ............................................................................ 32 Table B- 7 Hospital Results for Jackson.......................................................................... 33 Table B- 8 Retail Results for Jackson.............................................................................. 34 Table C- 1 Energy Cost Per Square Foot Associated with Various Above Code and Green Building Levels – New Orleans ............................................................................. 37 Table C- 2 Energy Cost Per Square Foot Associated with Various Above Code and Green Building Levels – Jackson ..................................................................................... 38 Table C- 3 Level 1 and Level 2 Results for Office – New Orleans................................. 40 Table C- 4 Level 1 and Level 2 Results for School – New Orleans................................ 41 Table C- 5 Level 1 and Level 2 Results for Hospital – New Orleans ............................. 42 Table C- 6 Level 1 and Level 2 Results for Retail – New Orleans ................................. 43 Table C- 7 Level 1 and Level 2 Results for Office – Jackson ......................................... 44 Table C- 8 Level 1 and Level 2 Results for School – Jackson ........................................ 45 Table C- 9 Level 1 and Level 2 Results for Hospital – Jackson...................................... 46 Table C- 10 Level 1 and Level 2 Results for Retail – Jackson........................................ 47 Table D- 1 Whole Building Model Comparison – 90-75 to 90.1-2001-Louisiana.......... 52 Table D- 2 Whole Building Model Comparison – 90-75 to 90.1-2001-Mississippi ....... 53 Table D- 3 Whole Building Model Comparison – 90.1-1989 to 90.1-2001-Louisiana... 54 Table D- 4 Whole Building Model Comparison – 90.1-1989 to 90.1-2001-Mississippi 55 Table D- 5 Whole Building Model Comparison – 90.1-2001 to 90.1-2004-Louisiana... 56 Table D- 6 Whole Building Model Comparison – 90.1-2001 to 90.1-2004-Mississippi 57

1
Background The Government Accountability Office (GAO) requested the help of DOE’s Building Energy Code Program (BECP) in estimating the energy savings and cost impacts of adopting newer and more energy efficient commercial building energy codes in the states of Louisiana and Mississippi. This report is in response to that request.
2
Simulation Description Simulation Description This section describes the process of simulating buildings for this study. Climate zones, standards (baseline, target, and above code/green targets), and modeling of all standards is discussed.
Building Types At GAO’s request, simulations of offices, schools, and hospitals were made, because these building types are likely to receive Federal funding for construction. Simulations were also performed for retail buildings, because retail buildings constitute a large fraction of commercial building energy usage. Prototypes for office, school, hospital, and retail buildings were developed as part of ongoing work within DOE’s Commercial Building Integration Program. The four building prototypes used were the medium office, primary school, hospital, and stand-alone retail building prototypes developed by Michael Deru and Brent Griffith at the National Renewable Energy Laboratory for use as “benchmarks” for tracking DOE’s progress to its goal of Zero Energy Buildings. These are developmental prototypes and it is possible that the final prototypes, used by DOE will be slightly different. These prototypes were developed using data from the 2003 Commercial Building Energy Consumption Survey (EIA 2005) and the equipment and systems recommendations of Appendix G - Performance Rating Method of ANSI/ASHRAE/IESNA Standard 90.1-2004 (ASHRAE 2004a). The benchmarks consist of documented input files for the EnergyPlus simulation tool (DOE 2006). (See Appendix A for general descriptions of the buildings as modeled and the specific systems and performance parameters used in the simulations.)
Baseline Standards GAO requested the use of current state codes as the baseline for this analysis. For Louisiana, the baseline is therefore ANSI/ASHRAE/IESNA Standard 90.1-2001 (ASHRAE 2001)2 . For Mississippi, the baseline is ANSI/ASHRAE/IESNA Standard 90-75. (ASHRAE 1975) See DOE’s status of state energy codes at http://www.energycodes.gov/implement/state_codes/index.stm for history of these state codes. 2 While Louisiana has Standard 90.1-2001 on the books as required code, discussions between GAO and state energy office staff indicate that the “typical” construction of buildings that were destroyed by Hurricane Katrina was more equivalent to ASHRAE Standard 90.1-1989. PNNL will attempt (did we or not?) to provide a “pseudo-baseline” of Standard 90.1-1989 for Louisiana (and Mississippi) using published results from DOE’s determination of energy savings for ASHRAE Standard 90.1-1999.
3
Modeling of Baseline Standards All baseline standards – ASHRAE Standard 90-75 and ASHRAE Standard 90.1-2001 – contain sufficient procedures or tables to identify baseline envelope requirements. Standard 90.1-2001 also contains very explicit requirements for lighting and heating, ventilating, and air conditioning (HVAC) equipment and system efficiency that are useful. However, ASHRAE Standard 90-75 contains some very old HVAC equipment requirements and some non-prescriptive lighting requirements, as noted below. Virtually all of the equipment efficiency provisions of ASHRAE Standard 90-75 have been superseded by the National Appliance Energy Conservation Act (NAECA), the Energy Policy Act of 1992 and further DOE rulemakings on equipment efficiency. It is, therefore, impossible to obtain HVAC and service water heating (SWH) equipment that is as inefficient as allowed in Standard 90-75. Current HVAC and SWH equipment efficiencies will be used for both the baseline and new standard cases.3 Standard 90-75 does not contain prescriptive lighting requirements, but rather directs the user to an Illuminating Engineering Society (IES) design handbook. The guidance in this handbook was evaluated and produced estimates of what would be allowable lighting power density requirements. These requirements will be considered to be the lighting power density requirements for Standard 90-75. Note that these requirements lead to very high lighting power densities – higher even than current practice would indicate, so there will be considerable savings associated with lighting if this baseline is used.4
Target Standards GAO’s goal in this analysis was to look at newer standards for both Mississippi and Louisiana. For Mississippi, new standards choices would be: ANSI/ASHRAE/IESNA Standard 90.1-1989 (ASHRAE 1989) ANSI/ASHRAE/IESNA Standard 90.1-1999 (ASHRAE 1999) ANSI/ASHRAE/IESNA Standard 90.1-2001 (ASHRAE 2001) ANSI/ASHRAE/IESNA Standard 90.1-2004 (ASHRAE 2004a) For Louisiana, the only possible target standard that is published is ANSI/ASHRAE/IESNA Standard 90.1-2004.5 Given that ANSI/ASHRAE/IESNA Standard 90-1999 is the minimum standard mandated for state commercial building energy codes as a result of DOE’s formal determination of energy savings (required by the Energy Conservation and Production Act as amended by 3 However, it is likely that a number of buildings destroyed by Katrina were built prior to 1992 using less efficient equipment. 4 Older reports evaluating Standard 90-75 assumed even high lighting power densities that used here. (See, for instance, A.D. Little, Inc 1975). Use of the somewhat lower values detailed in Appendix A ensures that the results of this analysis are conservative. 5 See Footnote 2
4
the Energy Policy Act of 1992) (DOE 2002), DOE chose not to consider ANSI/ASHRAE/IESNA Standard 90.1-1989 as an option for Mississippi. Given that two of the choices are ANSI/ASHRAE/IESNA Standard 90.1-1999 and 90.1-2001 and the fact that these standards are essentially identical in southern climates (see Boulin, Halverson, and Hunn, 2005 for details), the first option modeled for Mississippi will be Standard 90.1-2001. Standard 90.1-2004 will be modeled for both states. Simulation Matrix by State Standards >>>> Standard 90-75 Standard 90.1-
2001 Standard 90.1-2004
Building Type Office MS LA and MS LA and MS School MS LA and MS LA and MS Hospital MS LA and MS LA and MS Retail MS LA and MS LA and MS
Modeling of Target Standards All target standards (Standard 90.1-2001 and 90.1-2004) are fully prescriptive in terms of envelope, mechanical, and lighting systems.
Above Code and Green Program Targets GAO also wanted to look at the energy implications of adopting above code or green programs. Typical above code programs might be ASHRAE’s Advanced Energy Design Guides (AEDG) (targeted at 30% above ASHRAE Standard 90.1-1999) (ASHRAE 2004b and ASHRAE 2006b). For purposes of this study, the energy usage of buildings 30% more energy efficient than ASHRAE Standard 90.1-2004 will be calculated. The building models used to show energy savings for Standard 90.1-2004 will be manipulated to achieve 30% savings. The typical green building program in the commercial sector is US Green Building Council (USGBC) Leadership in Energy and Environmental Design (LEED) program (USGBC 2005). The newest version is version 2.2 and the baseline energy standard for that version is ASHRAE Standard 90.1-2004. LEED does not actually require more energy efficiency than the baseline standard, but does provide points for achieving higher levels of energy efficiency. For purposes of this study, the energy usage of buildings that achieve various energy point levels under LEED version 2.2 will be calculated. The building models used to show energy savings for Standard 90.1-2004 will be manipulated to achieve the desired level of savings.
5
GAO was also interested in providing an estimate of energy savings associated with the Energy Policy Act of 2005 commercial tax credit level of 50% below ASHRAE Standard 90.1-2001. This value will be calculated based on manipulation of Standard 90.1-2001 results.
Modeling of Above Code and Green Building Targets The results from the ASHRAE Standard 90.1-2004 simulations will be decreased by 30% to represent a typical “30% better than code” program such as ASHRAE’s Advanced Energy Design Guide (AEDG).6 The results from the same simulation will be decreased by the following amounts, corresponding to 1 through 10 LEED energy points:
LEED Energy Points 1 10.5% Savings 2 14% Savings 3 17.5% Savings 4 21% Savings 5 24.5% Savings 6 28% Savings 7 31.5% Savings 8 35% Savings 9 38.5% Savings 10 42% Savings
A level of 50% below that of Standard 90.1-2001 will also be calculated to correspond to the commercial tax credit level in the Energy Policy Act of 2005.
Climate Locations GAO is focused primarily on the Gulf Coast region that was hit by Hurricane Katrina. For that reason, climate locations in the Southern parts of the states of Louisiana and Mississippi will be favored in this analysis. The options for climate locations for each state (based on available Typical Meteorological Year 2 (TMY2) weather data) are as follows: Louisiana: Baton Rouge, Lake Charles, New Orleans, and Shreveport. Mississippi – Jackson and Meridian The most appropriate location for Louisiana is undoubtedly New Orleans given the notoriety of that location and the association of New Orleans with the devastation of Hurricane Katrina. For purposes of this report, only the New Orleans climate will be evaluated in Louisiana. The most appropriate location for Mississippi is harder to decide. Both Jackson and Meridian are in the middle of the state, well away from the Gulf Coast. In terms of energy impact, the Mississippi Gulf Coast is closer to New Orleans than either Jackson or Meridian. Jackson is the state capital and is chosen solely for that reason. 6 ASHRAE’s AEDG for small office and small retail used Standard 90.1-1999 as the baseline. The difference in efficiency between Standard 90.1-1999 and Standard 90.1-2004 is roughly 5%.
6
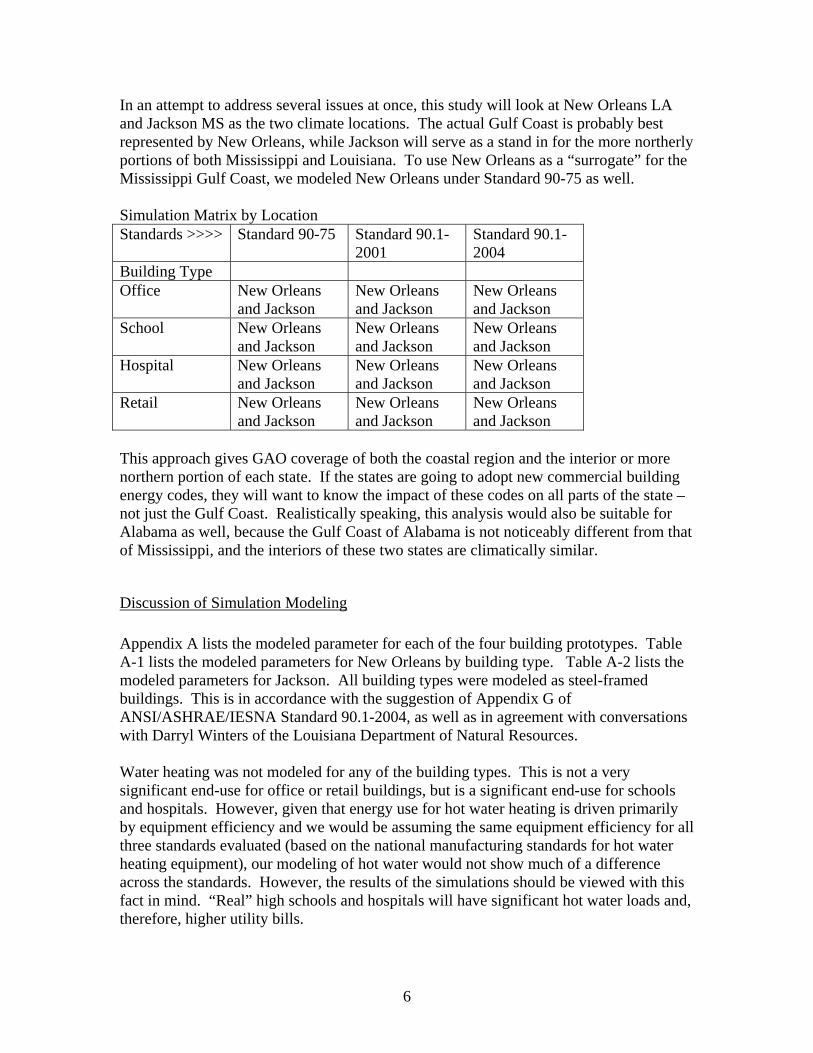
In an attempt to address several issues at once, this study will look at New Orleans LA and Jackson MS as the two climate locations. The actual Gulf Coast is probably best represented by New Orleans, while Jackson will serve as a stand in for the more northerly portions of both Mississippi and Louisiana. To use New Orleans as a “surrogate” for the Mississippi Gulf Coast, we modeled New Orleans under Standard 90-75 as well. Simulation Matrix by Location Standards >>>> Standard 90-75 Standard 90.1-
2001 Standard 90.1-2004
Building Type Office New Orleans
and Jackson New Orleans and Jackson
New Orleans and Jackson
School New Orleans and Jackson
New Orleans and Jackson
New Orleans and Jackson
Hospital New Orleans and Jackson
New Orleans and Jackson
New Orleans and Jackson
Retail New Orleans and Jackson
New Orleans and Jackson
New Orleans and Jackson
This approach gives GAO coverage of both the coastal region and the interior or more northern portion of each state. If the states are going to adopt new commercial building energy codes, they will want to know the impact of these codes on all parts of the state – not just the Gulf Coast. Realistically speaking, this analysis would also be suitable for Alabama as well, because the Gulf Coast of Alabama is not noticeably different from that of Mississippi, and the interiors of these two states are climatically similar.
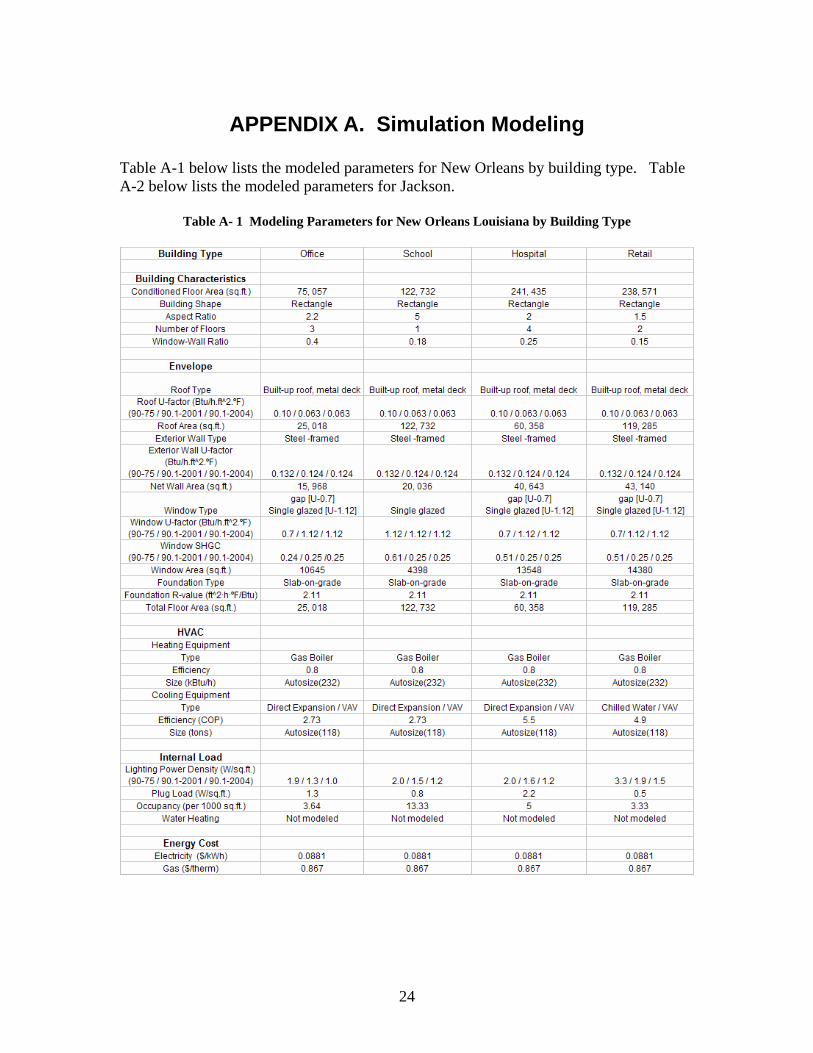
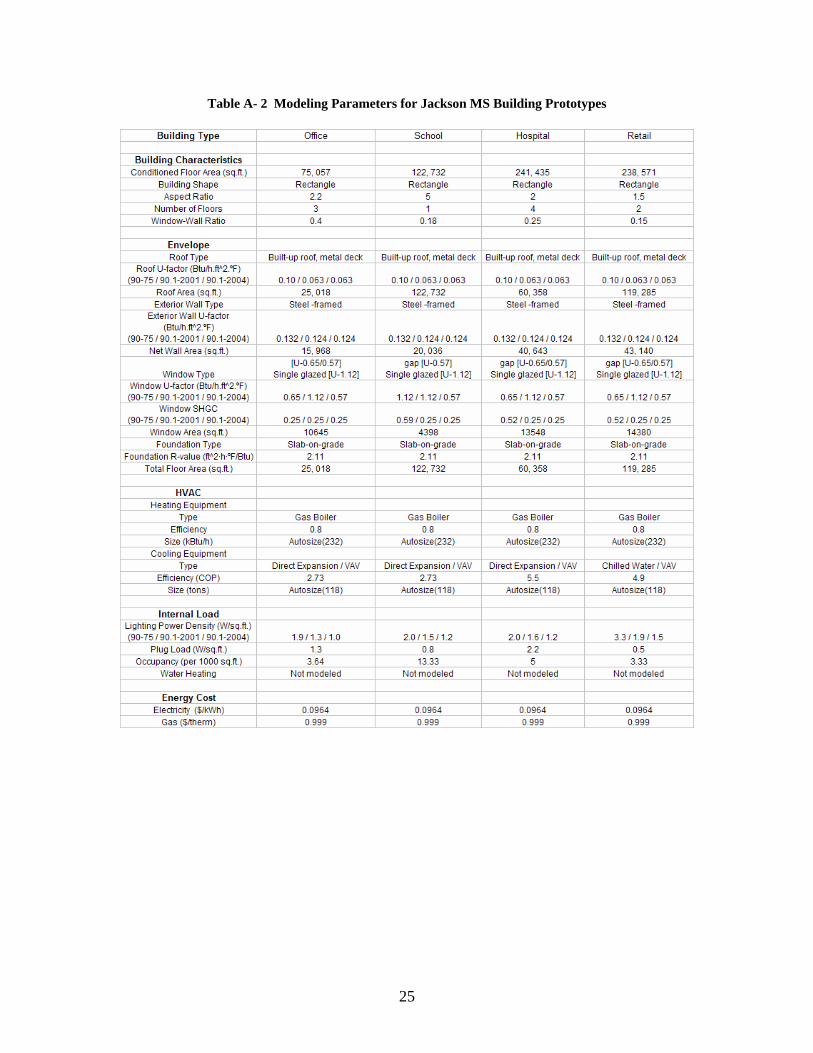
Discussion of Simulation Modeling Appendix A lists the modeled parameter for each of the four building prototypes. Table A-1 lists the modeled parameters for New Orleans by building type. Table A-2 lists the modeled parameters for Jackson. All building types were modeled as steel-framed buildings. This is in accordance with the suggestion of Appendix G of ANSI/ASHRAE/IESNA Standard 90.1-2004, as well as in agreement with conversations with Darryl Winters of the Louisiana Department of Natural Resources. Water heating was not modeled for any of the building types. This is not a very significant end-use for office or retail buildings, but is a significant end-use for schools and hospitals. However, given that energy use for hot water heating is driven primarily by equipment efficiency and we would be assuming the same equipment efficiency for all three standards evaluated (based on the national manufacturing standards for hot water heating equipment), our modeling of hot water would not show much of a difference across the standards. However, the results of the simulations should be viewed with this fact in mind. “Real” high schools and hospitals will have significant hot water loads and, therefore, higher utility bills.
7
Standards 90.1-2001 and 90.1-2004 contain provisions for additional lighting power allowances for retail buildings. The additional lighting power allowances are based on display area, not floor area and therefore are highly dependent on how the display area is organized. These allowances are not included in the lighting power estimates for the retail building. Standard 90-75 does not contain these allowances. The implication is that “real” retail buildings may have somewhat higher interior lighting power and may therefore have higher cooling loads and lower heating loads than modeled here. DOE will be addressing this aspect of retail buildings in upcoming modeling approaches, but there is currently no useful data on the size and configuration of retail display areas that could be used in this study. Standards 90.1-2001 and 90.1-2004 contain requirements for exterior building grounds and parking lot lighting, as long as that lighting is powered by the building service. No good reference for “typical” amounts of parking lot or grounds lighting associated with various building types exists. Exterior lighting was not modeled in the simulations for this report. In cases where buildings do have significant exterior lighting, “real” buildings may have higher utility bills than those modeled here.
8
Economic Analysis The economic analysis portion of this study focused simply on comparing the first costs associated with improving the energy efficiency of the four prototypical buildings (by bringing them up to compliance with newer and more efficient energy codes) and the decreased utility costs of those buildings brought about by decreased energy usage attributable to use of new energy codes. Fuel Costs Used in this Study Prices for electricity and natural gas were obtained from DOE’s Energy Information Administration (EIA). For electricity, data was taken from EIA’s reports of electrical utility sales revenue at http://www.eia.doe.gov/cneaf/electricity/page/sales_revenue.xls. These prices are “blended” rates that incorporate the total sales dollars (both energy and demand charges) on a per kWh basis. For natural gas, prices were taken from EIA’s 2006 Annual Energy Outlook at http://www.eia.doe.gov/oiaf/aeo/supplement/sup_ogc.xls. These prices reflect the prices of natural gas only and not transportation or local utility surcharges.
For Louisiana, the prices used were 8.81 cents per kWh for electricity and 86.7 cents per therm for natural gas. For Mississippi, the prices used were 9.64 cents per kWh for electricity and 99.9 cents per therm for natural gas.
First Costs Used in This Study Changes in first costs associated with additional insulation, better performing windows, and reduced lighting power density were developed to do simple life cycle costing of the different levels of standards. Changes in first cost associated with HVAC equipment efficiency changes between standards levels were not calculated because equipment efficiencies are typically governed by national manufacturing standards. This means that equipment that meets the older, out-dated efficiency standards found in Standard 90-75 is no longer manufactured. See the discussion of specific costs used in this report in Appendix D - Evaluation of Cost Effectiveness. Economic Analysis Methodology The basis of the economic methodology is to compare the increased first costs of the prototypical buildings with estimated annual energy cost savings. The overall equation for increased first cost for any prototype building is:
9
Incremental First Cost of Building = Roof area * Incremental Cost of Additional Roof Insulation + Opaque Wall Area * Incremental Cost of Additional Wall Insulation + Window Area * Incremental Cost of Better Windows + Floor Area * Incremental Cost of Lower Lighting Power Density
Roof area, opaque wall area, window area, and floor area are all specified in Tables A-1 and A-2 for all prototype buildings. Incremental costs of roof insulation, wall insulation, better windows, and lower lighting power density are discussed in the previous section. 7 The overall equation for annual energy cost savings is:
Annual Energy Cost Savings = Floor Area * Incremental Energy Costs Floor area is specified in Tables A-1 and A-2 for all prototype buildings. Incremental energy costs are shown in Tables 5 and 6.
7 There are other portions of the building covered by AHSRAE Standard 90. This lists includes only those portions that were modeled for this analysis. Water heating equipment (previously mentioned), pipe and duct insulation, HVAC and lighting controls, skylights, transformers, and motors could also contribute to the energy savings and first costs.
10
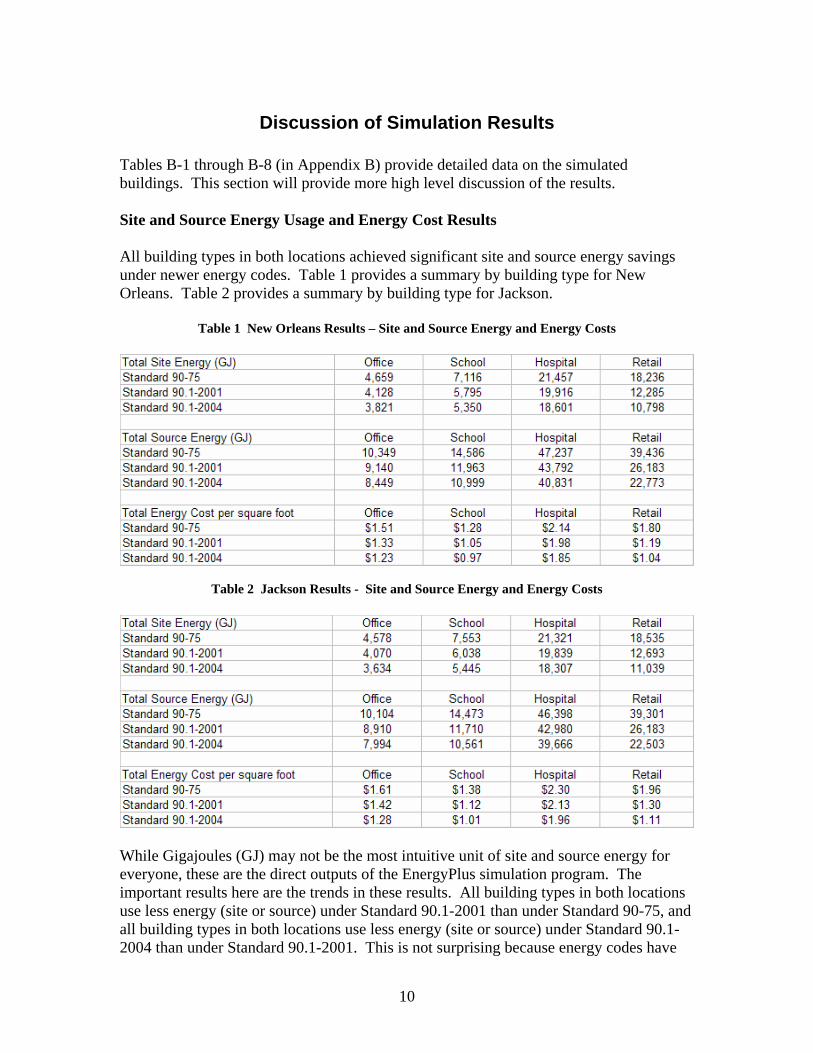
Discussion of Simulation Results Tables B-1 through B-8 (in Appendix B) provide detailed data on the simulated buildings. This section will provide more high level discussion of the results. Site and Source Energy Usage and Energy Cost Results All building types in both locations achieved significant site and source energy savings under newer energy codes. Table 1 provides a summary by building type for New Orleans. Table 2 provides a summary by building type for Jackson.
Table 1 New Orleans Results – Site and Source Energy and Energy Costs
Table 2 Jackson Results - Site and Source Energy and Energy Costs
While Gigajoules (GJ) may not be the most intuitive unit of site and source energy for everyone, these are the direct outputs of the EnergyPlus simulation program. The important results here are the trends in these results. All building types in both locations use less energy (site or source) under Standard 90.1-2001 than under Standard 90-75, and all building types in both locations use less energy (site or source) under Standard 90.1-2004 than under Standard 90.1-2001. This is not surprising because energy codes have
11
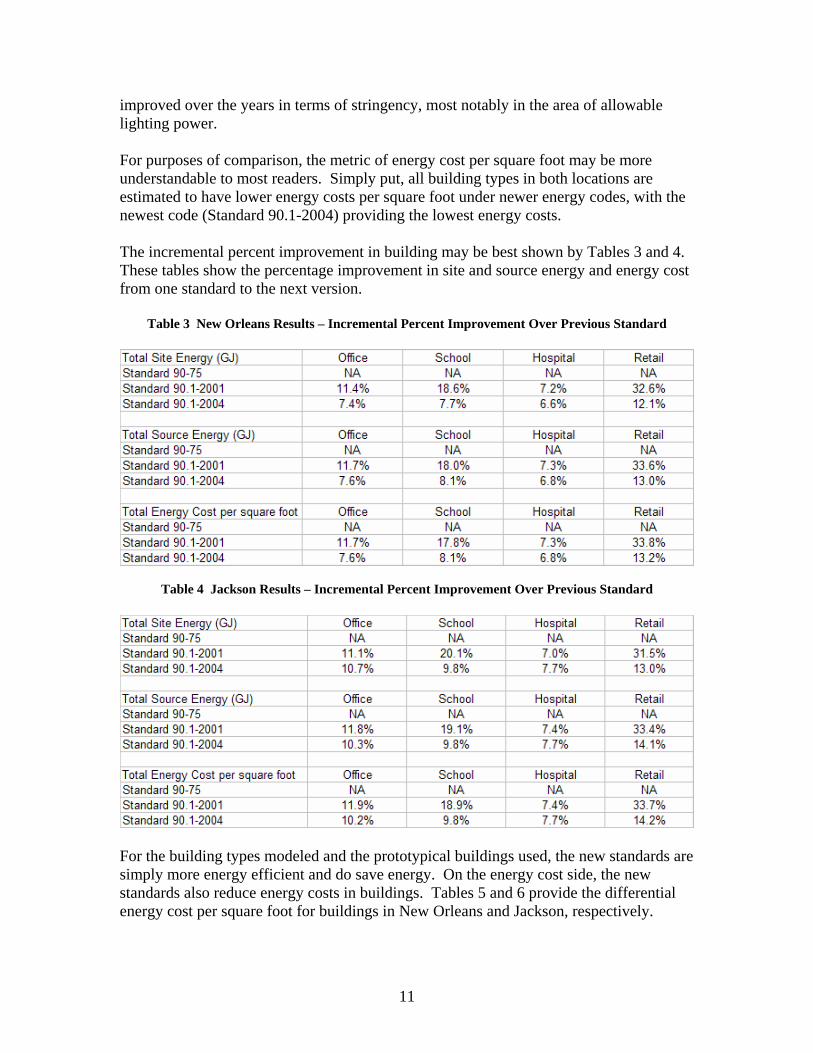
improved over the years in terms of stringency, most notably in the area of allowable lighting power. For purposes of comparison, the metric of energy cost per square foot may be more understandable to most readers. Simply put, all building types in both locations are estimated to have lower energy costs per square foot under newer energy codes, with the newest code (Standard 90.1-2004) providing the lowest energy costs. The incremental percent improvement in building may be best shown by Tables 3 and 4. These tables show the percentage improvement in site and source energy and energy cost from one standard to the next version.
Table 3 New Orleans Results – Incremental Percent Improvement Over Previous Standard
Table 4 Jackson Results – Incremental Percent Improvement Over Previous Standard
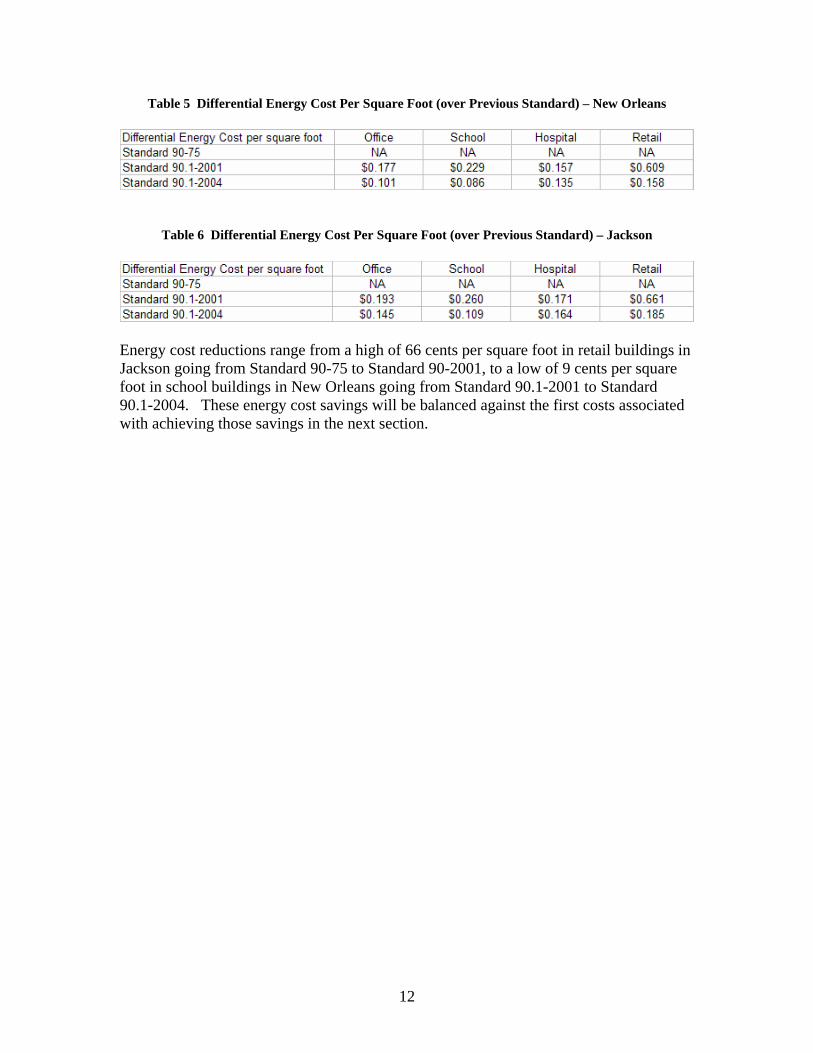
For the building types modeled and the prototypical buildings used, the new standards are simply more energy efficient and do save energy. On the energy cost side, the new standards also reduce energy costs in buildings. Tables 5 and 6 provide the differential energy cost per square foot for buildings in New Orleans and Jackson, respectively.
12
Table 5 Differential Energy Cost Per Square Foot (over Previous Standard) – New Orleans
Table 6 Differential Energy Cost Per Square Foot (over Previous Standard) – Jackson
Energy cost reductions range from a high of 66 cents per square foot in retail buildings in Jackson going from Standard 90-75 to Standard 90-2001, to a low of 9 cents per square foot in school buildings in New Orleans going from Standard 90.1-2001 to Standard 90.1-2004. These energy cost savings will be balanced against the first costs associated with achieving those savings in the next section.
13
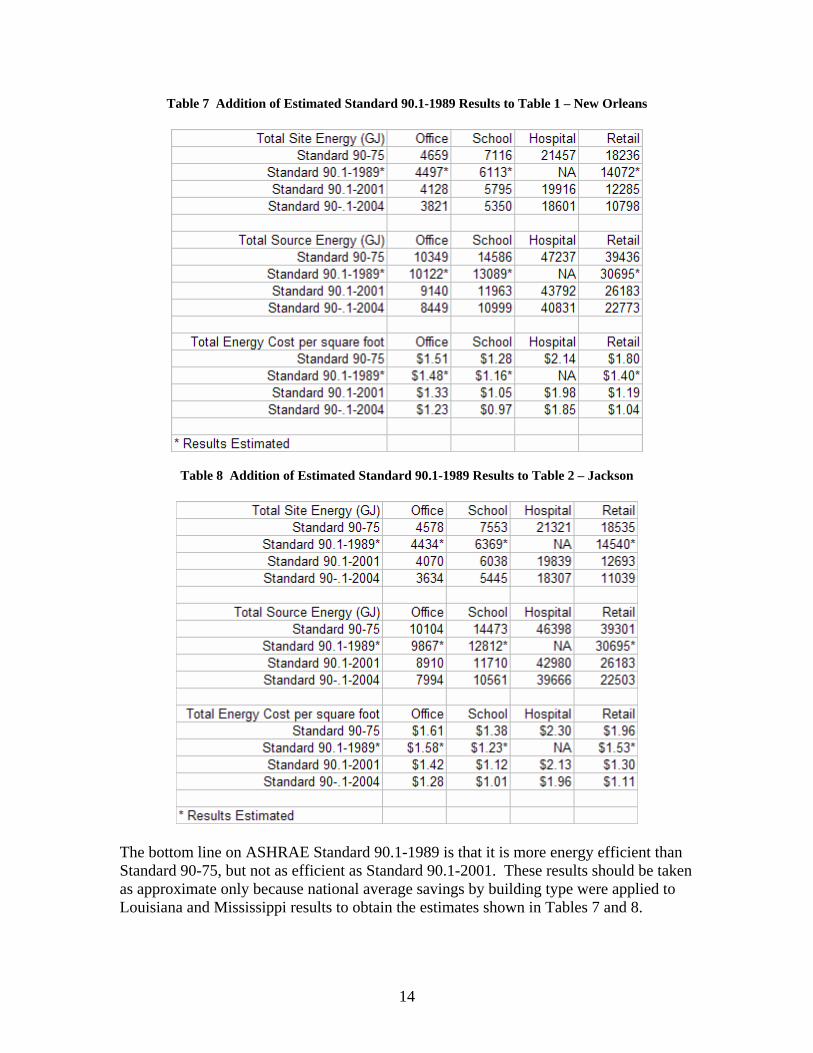
Discussion of ASHRAE Standard 90.1-1989 Baseline Footnote 2 in this report discusses the rationale for looking at a Standard 90.1-1989 for Louisiana even though Standard 90.1-2001 is “on the books”. While the analysis done for this report did not do simulations related to ASHRAE Standard 90.1-1989, there is a large body of work comparing ASHRAE Standard 90.1-1989 with ASHRAE Standard 90.1-1999 available from DOE’s formal determination of energy savings. (DOE 2002). Because Standard 90.1-1999 is essentially identical to Standard 90.1-2001 in warm climates (see Boulin et al. 2003, for details), the link between Standards 90.1-1989 and 90.1-2001 can be established. Examination of the detailed results in this determination indicate that for the East South Central census region (which includes Mississippi), Standard 90.1-1999 is about 4% better in site energy, and 5% better in source and energy dollars, than Standard 90.1-1989. The corresponding numbers for the West South Central census region (which includes Louisiana) are 4.9%, 7.0%, and 7.1% for site, source, and energy dollars. All these numbers do vary by building type, but summary results by both building type and census region are not available in DOE’s determination spreadsheets. DOE’s determination also included assembly, food service, lodging, and warehouse buildings, and did not include hospitals, so a direct comparison is difficult. Looking just at the four building types, across the entire country, schools saved 5.2%, 8.6%, and 9.0% in site energy, source energy, and energy cost, respectively. The corresponding numbers for office were 8.2%, 9.7%, and 9.8%. The corresponding numbers for retail were 12.7%, 14.7%, and 14.9%. No simulation data was available for hospitals in DOE’s determination. Applying these national savings to specific building types in both New Orleans and Jackson, and using the results for the schools as a surrogate for the hospital, we see savings as shown in Tables 7 and 8. These tables are simply duplicates of Tables 1 and 2 with an extra row for Standard 90.1-1989 showing the estimated savings.
14
Table 7 Addition of Estimated Standard 90.1-1989 Results to Table 1 – New Orleans
Table 8 Addition of Estimated Standard 90.1-1989 Results to Table 2 – Jackson
The bottom line on ASHRAE Standard 90.1-1989 is that it is more energy efficient than Standard 90-75, but not as efficient as Standard 90.1-2001. These results should be taken as approximate only because national average savings by building type were applied to Louisiana and Mississippi results to obtain the estimates shown in Tables 7 and 8.
15
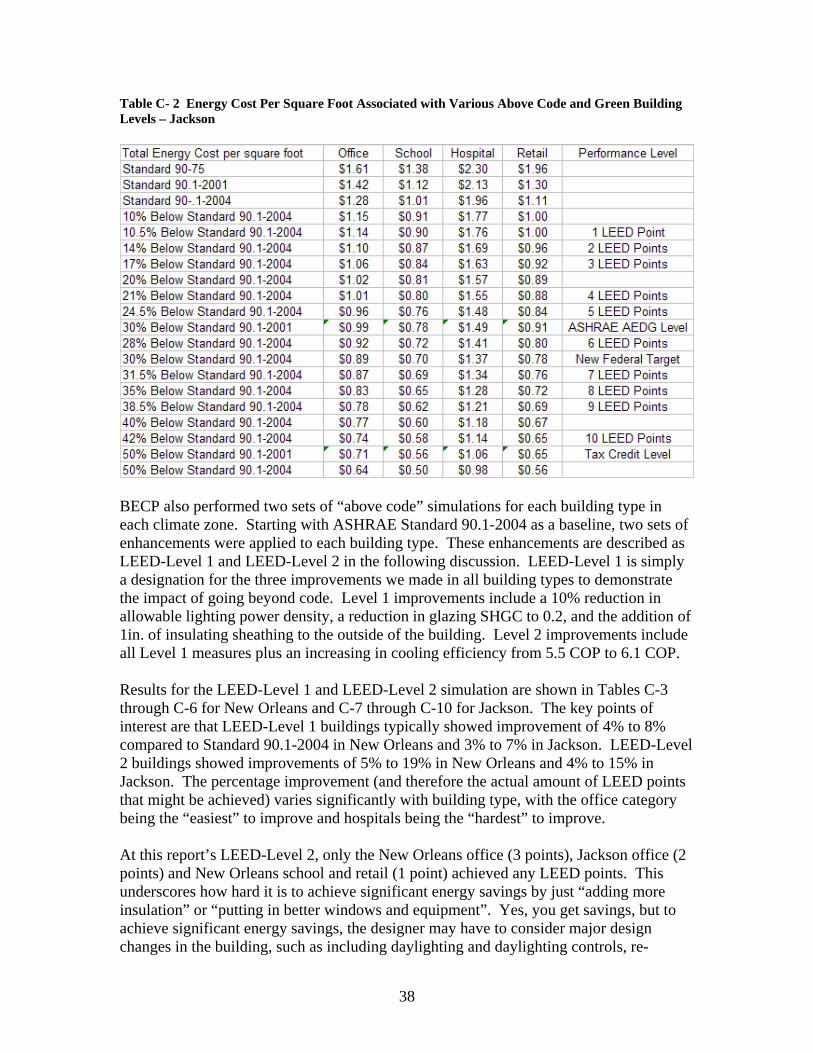
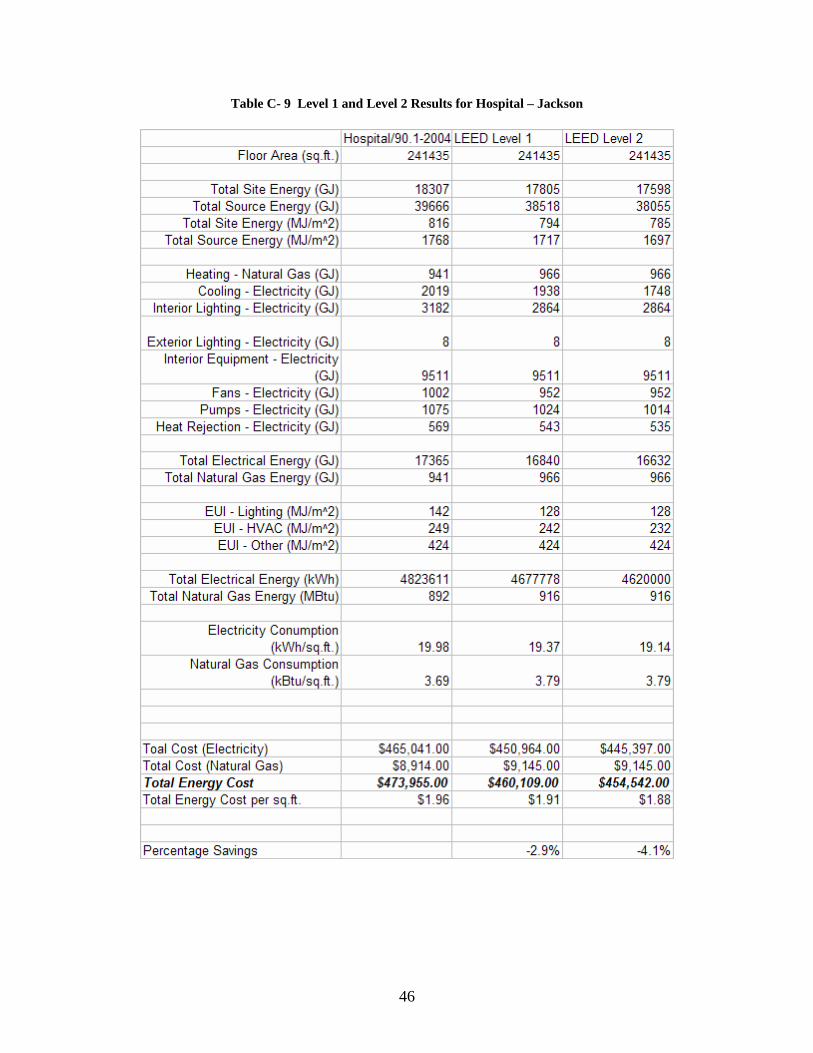
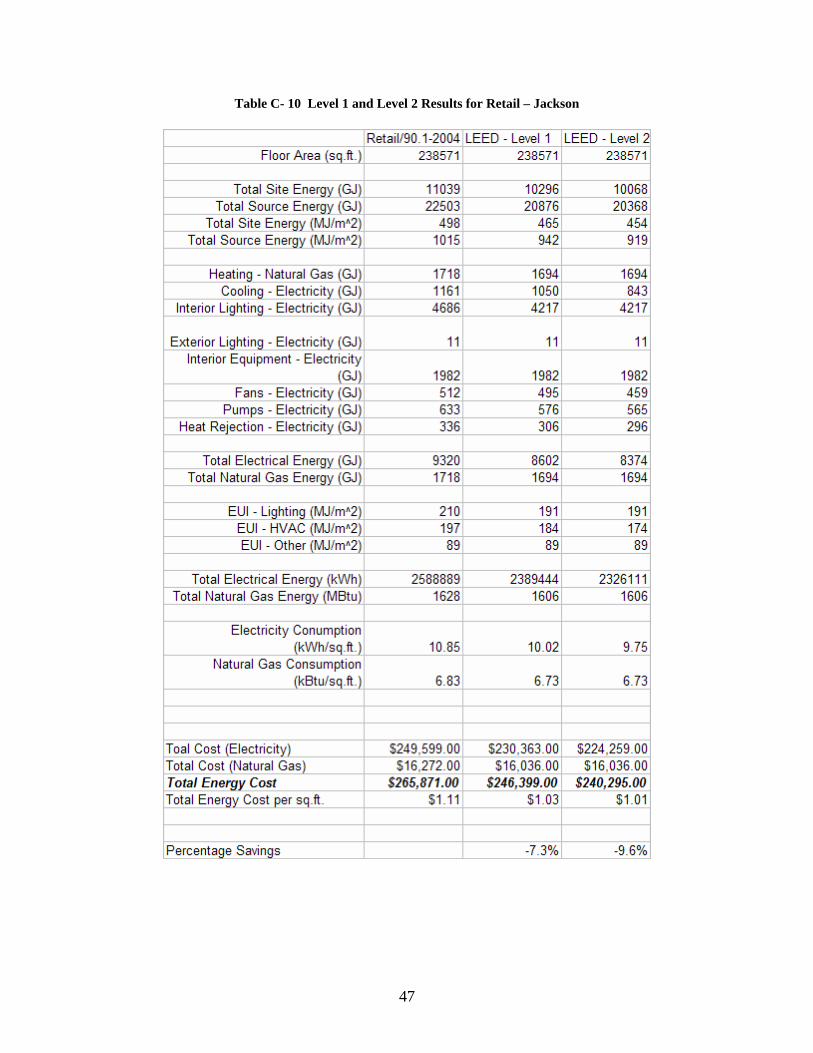
Evaluation of “Above Code” and Green Standards As part of this analysis, the results for the four prototypical buildings were manipulated in a spreadsheet to determine the energy impacts of achieving various levels of “above code” or “green” performance. The results of this manipulation are discussed in Appendix C. Summary data from Appendix C is discussed below. The energy cost per square foot of all building types in both climate locations that would be necessary to achieve various “above code” or “green” performance levels was calculated. These results are shown in Tables C-1 for New Orleans and C-2 for Jackson. Two sets of “above code” simulations for each building type in each climate zone were also performed. Starting with ASHRAE Standard 90.1-2004 as a baseline, we implemented two sets of enhancements to each building type. These enhancements are described as LEED-Level 1 and LEED-Level 2 in the following discussion. LEED-Level 1 is simply a designation for the three improvements made in all building types to demonstrate the impact of going beyond code. Level 1 improvements include a 10% reduction in allowable lighting power density, a reduction in glazing SHGC to 0.2, and the addition of 1in. of insulating sheathing to the outside of the building. Level 2 improvements include all Level 1 measures plus an increase in cooling efficiency from 5.5 COP to 6.1 COP. Results for the LEED-Level 1 and LEED-Level 2 simulation are shown in Tables C-3 through C-6 for New Orleans and C-7 through C-10 for Jackson. The key points of interest are that LEED-Level 1 buildings typically showed improvement of 4% to 8% in New Orleans and 3% to 7% in Jackson. LEED-Level 2 buildings showed improvements of 5% to 19% in New Orleans and 4% to 15% in Jackson. The percentage improvement (and therefore the actual amount of LEED points that might be achieved) varies significantly with building type, with the office category being the “easiest” to improve and hospitals being the “hardest” to improve.
16
Cost Effectiveness of New Energy Standards While the newer standards save energy and associated cost, saving energy and energy dollars implies doing something to a building design that would not have been required under an older standard. For this analysis, the two areas where building parameters were changed were the envelope and lighting systems. The changes in going from one version of the Standard to the next are discussed below.
Standard 90-75 to Standard 90.1-2001 Examination of Table A-1 (New Orleans) and Table A-2 (Jackson) indicate the following differences:
Roof U-factor All building types – 0.1 to 0.063 (R-9 to R-15) Wall U-factor All building types – 0.132 to 0.124 (R-11 to R-13) Window U-factor All building types (except school) – 0.7 to 1.12
(double pane to single pane) School- constant at 1.12 (single pane) Window SHGC School- 0.61 to 0.25 (clear to tinted) Hospital and retail – 0.51 to 0.25 (clear to tinted) Office - 0.24 to 0.25 (essentially constant) Lighting power Office – 1.9 to 1.3 watts per square foot School – 2.0 to 1.5 watts per square foot Hospital – 2.0 to 1.6 watts per square foot Retail – 3.3 to 1.9 watts per square foot
Standard 90.1-2001 to Standard 90.1-2004 Examination of Table A-1 (New Orleans) and Table A-2 (Jackson) indicate the following differences: Roof U-factor All building types – constant
Wall U-factor All building types – constant Window U-factor All building types – 1.12 to 0.57
(single pane to double pane) Window SHGC All building types - constant Lighting power Office – 1.3 to 1.0 watts per square foot School – 1.5 to 1.2 watts per square foot Hospital – 1.6 to 1.2 watts per square foot Retail – 1.9 to 1.5 watts per square foot The differences fall into two areas: interior lighting and building envelope. Interior lighting costs and cost effectiveness are described in Appendix D. Building envelope costs and cost effectiveness are described in Appendix E. While determining the costs of simple building changes would seem almost trivial, nothing about first cost data tends to be easy. Consideration of retail versus wholesale
17
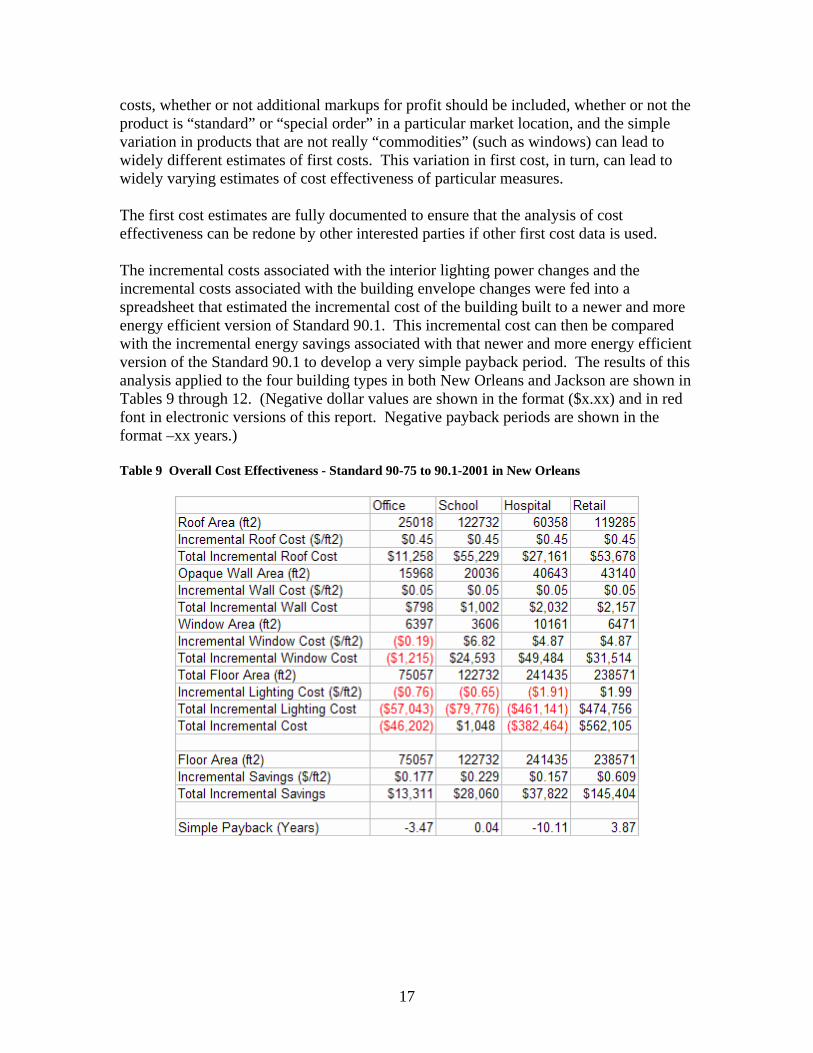
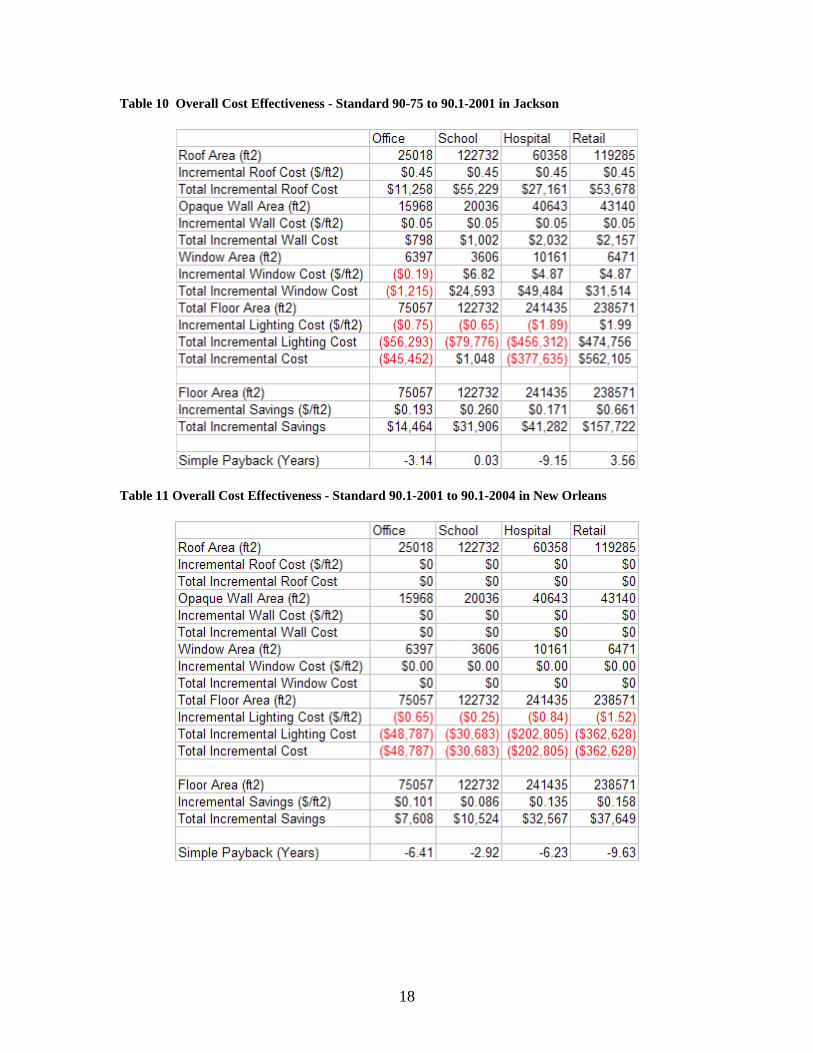
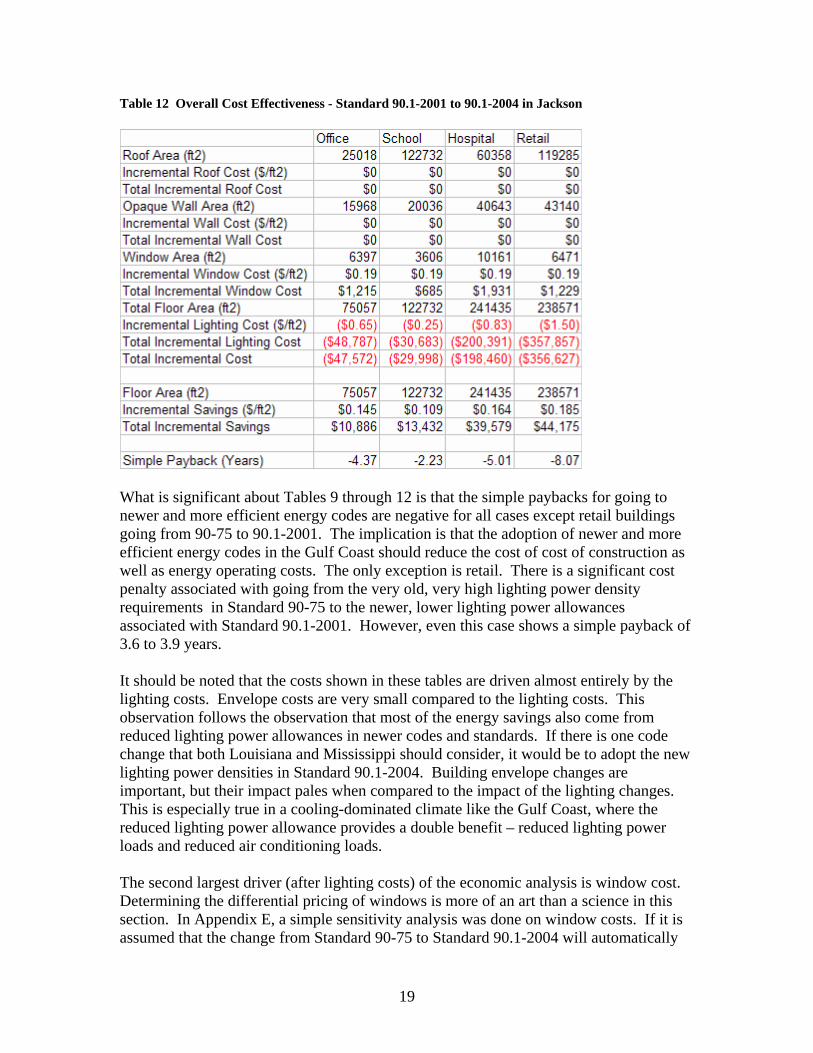
costs, whether or not additional markups for profit should be included, whether or not the product is “standard” or “special order” in a particular market location, and the simple variation in products that are not really “commodities” (such as windows) can lead to widely different estimates of first costs. This variation in first cost, in turn, can lead to widely varying estimates of cost effectiveness of particular measures. The first cost estimates are fully documented to ensure that the analysis of cost effectiveness can be redone by other interested parties if other first cost data is used. The incremental costs associated with the interior lighting power changes and the incremental costs associated with the building envelope changes were fed into a spreadsheet that estimated the incremental cost of the building built to a newer and more energy efficient version of Standard 90.1. This incremental cost can then be compared with the incremental energy savings associated with that newer and more energy efficient version of the Standard 90.1 to develop a very simple payback period. The results of this analysis applied to the four building types in both New Orleans and Jackson are shown in Tables 9 through 12. (Negative dollar values are shown in the format ($x.xx) and in red font in electronic versions of this report. Negative payback periods are shown in the format –xx years.) Table 9 Overall Cost Effectiveness - Standard 90-75 to 90.1-2001 in New Orleans
18
Table 10 Overall Cost Effectiveness - Standard 90-75 to 90.1-2001 in Jackson
Table 11 Overall Cost Effectiveness - Standard 90.1-2001 to 90.1-2004 in New Orleans
19
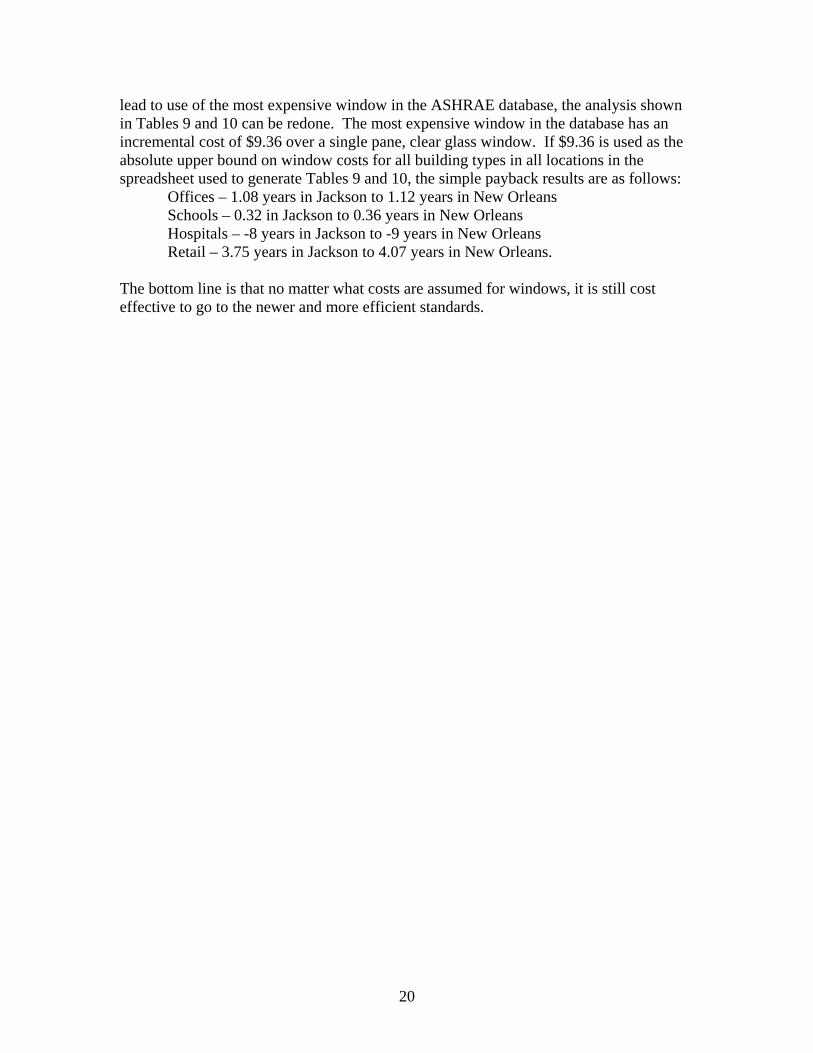
Table 12 Overall Cost Effectiveness - Standard 90.1-2001 to 90.1-2004 in Jackson
What is significant about Tables 9 through 12 is that the simple paybacks for going to newer and more efficient energy codes are negative for all cases except retail buildings going from 90-75 to 90.1-2001. The implication is that the adoption of newer and more efficient energy codes in the Gulf Coast should reduce the cost of cost of construction as well as energy operating costs. The only exception is retail. There is a significant cost penalty associated with going from the very old, very high lighting power density requirements in Standard 90-75 to the newer, lower lighting power allowances associated with Standard 90.1-2001. However, even this case shows a simple payback of 3.6 to 3.9 years. It should be noted that the costs shown in these tables are driven almost entirely by the lighting costs. Envelope costs are very small compared to the lighting costs. This observation follows the observation that most of the energy savings also come from reduced lighting power allowances in newer codes and standards. If there is one code change that both Louisiana and Mississippi should consider, it would be to adopt the new lighting power densities in Standard 90.1-2004. Building envelope changes are important, but their impact pales when compared to the impact of the lighting changes. This is especially true in a cooling-dominated climate like the Gulf Coast, where the reduced lighting power allowance provides a double benefit – reduced lighting power loads and reduced air conditioning loads. The second largest driver (after lighting costs) of the economic analysis is window cost. Determining the differential pricing of windows is more of an art than a science in this section. In Appendix E, a simple sensitivity analysis was done on window costs. If it is assumed that the change from Standard 90-75 to Standard 90.1-2004 will automatically
20
lead to use of the most expensive window in the ASHRAE database, the analysis shown in Tables 9 and 10 can be redone. The most expensive window in the database has an incremental cost of $9.36 over a single pane, clear glass window. If $9.36 is used as the absolute upper bound on window costs for all building types in all locations in the spreadsheet used to generate Tables 9 and 10, the simple payback results are as follows: Offices – 1.08 years in Jackson to 1.12 years in New Orleans Schools – 0.32 in Jackson to 0.36 years in New Orleans Hospitals – -8 years in Jackson to -9 years in New Orleans Retail – 3.75 years in Jackson to 4.07 years in New Orleans. The bottom line is that no matter what costs are assumed for windows, it is still cost effective to go to the newer and more efficient standards.
21
References A.D. Little 1975. Energy Conservation in New Building Design – An Impact Assessment of ASHRAE Standard 90-75. Arthur D. Little, Inc. Conservation Paper 43B. Federal Energy Administration, Washington DC. ASHRAE. 1975. Energy Conservation in New Building Design. American Society of Heating, Refrigerating and Air-Conditioning Engineers, New York. ASHRAE . 1989. Energy Efficient Design of New Buildings Except Low-Rise Residential Buildings. ANSI/ASHRAE/IESNA Standard 90.1-1989. American National Standards Institute/ American Society of Heating, Refrigerating and Air-Conditioning Engineers/Illuminating Engineering Society of North America, Atlanta, Georgia. ASHRAE. 1999. Energy Standard for Buildings Except Low-Rise Residential Buildings. ANSI/ASHRAE/IESNA Standard 90.1-1999. American National Standards Institute/ American Society of Heating, Refrigerating and Air-Conditioning Engineers/Illuminating Engineering Society of North America, Atlanta, Georgia ASHRAE. 2001. Energy Standard for Buildings Except Low-Rise Residential Buildings. ANSI/ASHRAE/IESNA Standard 90.1-2001. American National Standards Institute/ American Society of Heating, Refrigerating and Air-Conditioning Engineers/Illuminating Engineering Society of North America, Atlanta, Georgia ASHRAE. 2004a. Energy Standard for Buildings Except Low-Rise Residential Buildings. ANSI/ASHRAE/IESNA Standard 90.1-2004. American National Standards Institute/ American Society of Heating, Refrigerating and Air-Conditioning Engineers/Illuminating Engineering Society of North America, Atlanta, Georgia ASHRAE. 2004b. Advanced Energy Design Guide for Small Office Buildings. American Society of Heating, Refrigerating and Air-Conditioning Engineers, Atlanta Georgia. ASHRAE. 2006a. ASHRAE Envelope Optimization Program. 901EnvOpt_2006VBA(6-21-2006).xls. See hidden worksheets “2007 Opaque Constr” and “Fenestration Data”. Available from Mark Halverson at [email protected] or from members of the ASHRAE Standing Standards Project Committee (SSPC) 90.1 Envelope subcommittee. . ASHRAE. 2006b. Advanced Energy Design Guide for Small Retail Buildings. American Society of Heating, Refrigerating and Air-Conditioning Engineers, Atlanta Georgia. Boulin, J. M. Halverson, and B. Hunn. 2003. Standard 90.1-2001. Presented at the 2003 DOE National Workshop on State Building Energy Codes. Available at http://www.energycodes.gov/news/2003_workshop/pdfs/Standard%2090.1_2001.pdf.
22
DOE. 2002. “Building Energy Standards Program – Determination regarding Energy Efficiency Improvements” in the Energy Standard for Buildings Except Low-Rise Residential Buildings, ASHRAE/IESNA Standard 90.1-1999. Federal Register, July 15, 2002. Also at http://www.energycodes.gov/implement/determinations_com.stm. DOE. 2006. EnergyPlus website. http://www.eere.energy.gov/buildings/energyplus/. Energy Information Administration (EIA). 1999. Commercial Building Energy Consumption and Expenditures Survey 1999 (CBECS 99). U.S. Department of Energy, Washington D.C. EIA 2005. 2003 Commercial Buildings Energy Consumption Survey (CBECS). Energy Information Administration, Department of Energy, Washington, DC. Available at http://www.eia.doe.gov/emeu/cbecs/cbecs2003/ Illuminating Engineering Society of North America. 2000. IESNA Lighting Handbook 9th edition. Illuminating Engineering Society of North America, New York. R.S. Means. 2005. RS Means Electrical Cost Data 28th Annual Edition 2005. R.S. Means, Kingston, Massachusetts. USGBC. 2005. LEED-NC Version 2.2. Available at https://www.usgbc.org/ShowFile.aspx?DocumentID=1095. US Green Building Council, Washington, DC. W.W. Grainger. 2004. Grainger 2004-2005 Catalog No. 395. W.W. Grainger, Lake Forest, Illinois.
23
APPENDIX A
Simulation Modeling
24
APPENDIX A. Simulation Modeling Table A-1 below lists the modeled parameters for New Orleans by building type. Table A-2 below lists the modeled parameters for Jackson.
Table A- 1 Modeling Parameters for New Orleans Louisiana by Building Type
25
Table A- 2 Modeling Parameters for Jackson MS Building Prototypes
26
APPENDIX B
Simulation Results
27
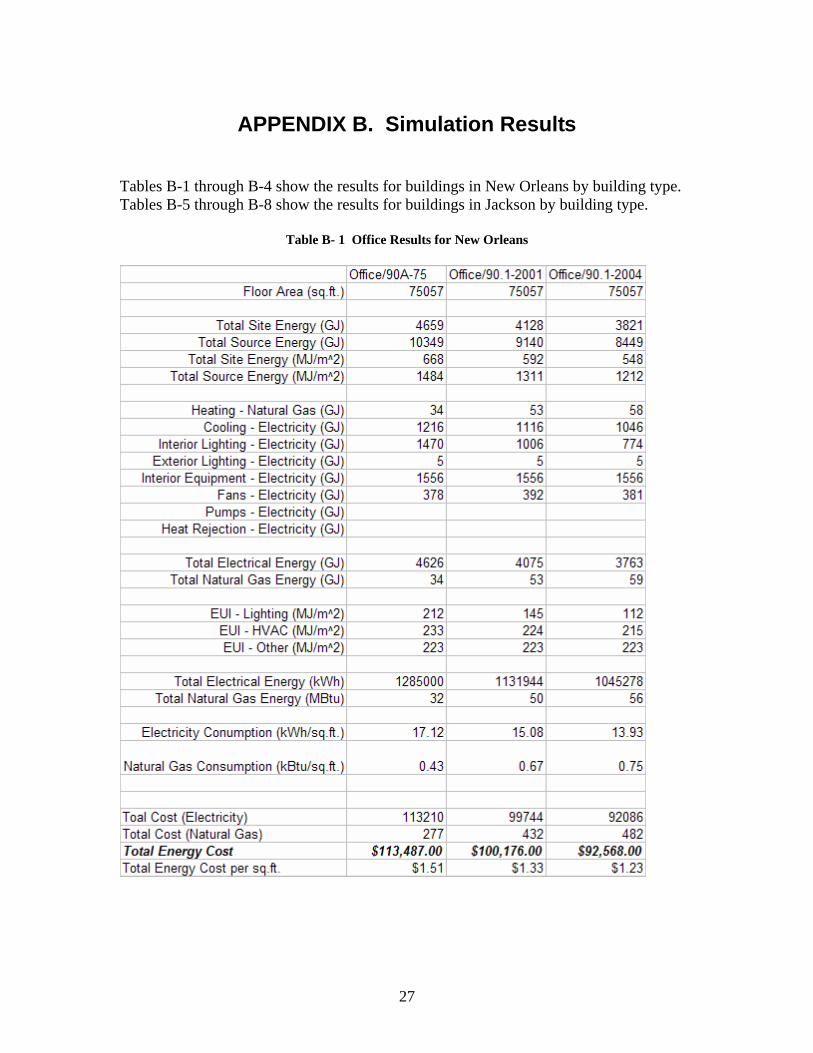
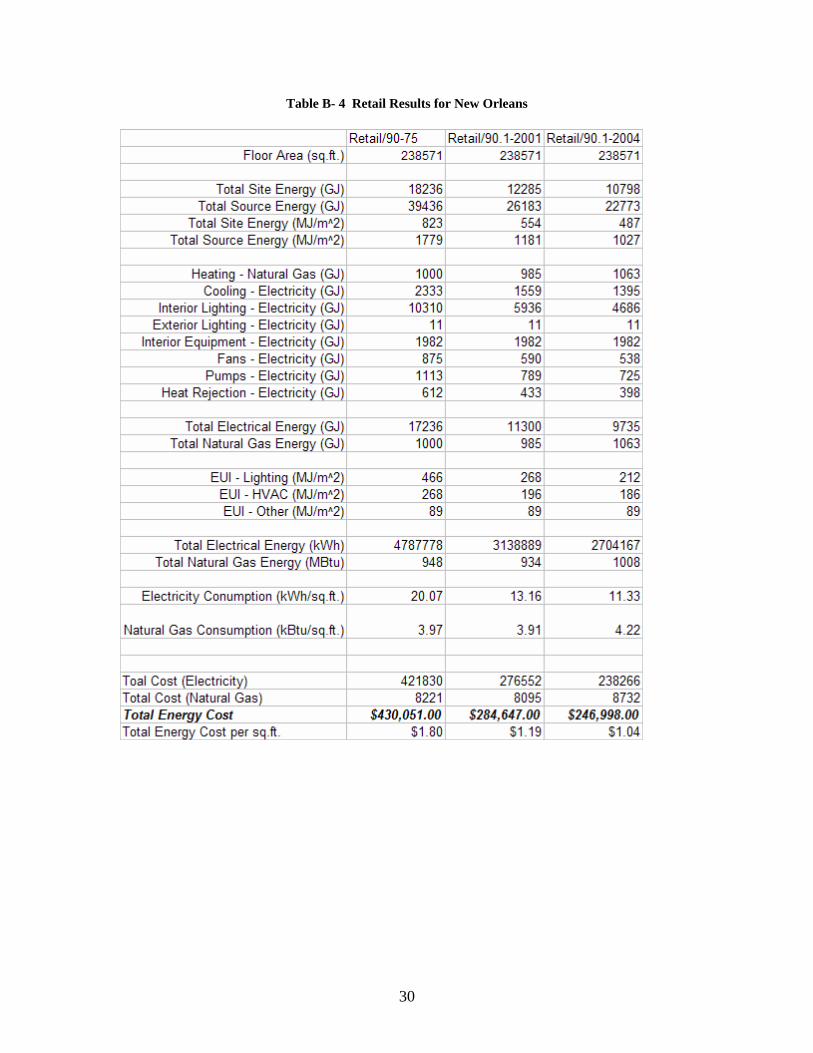
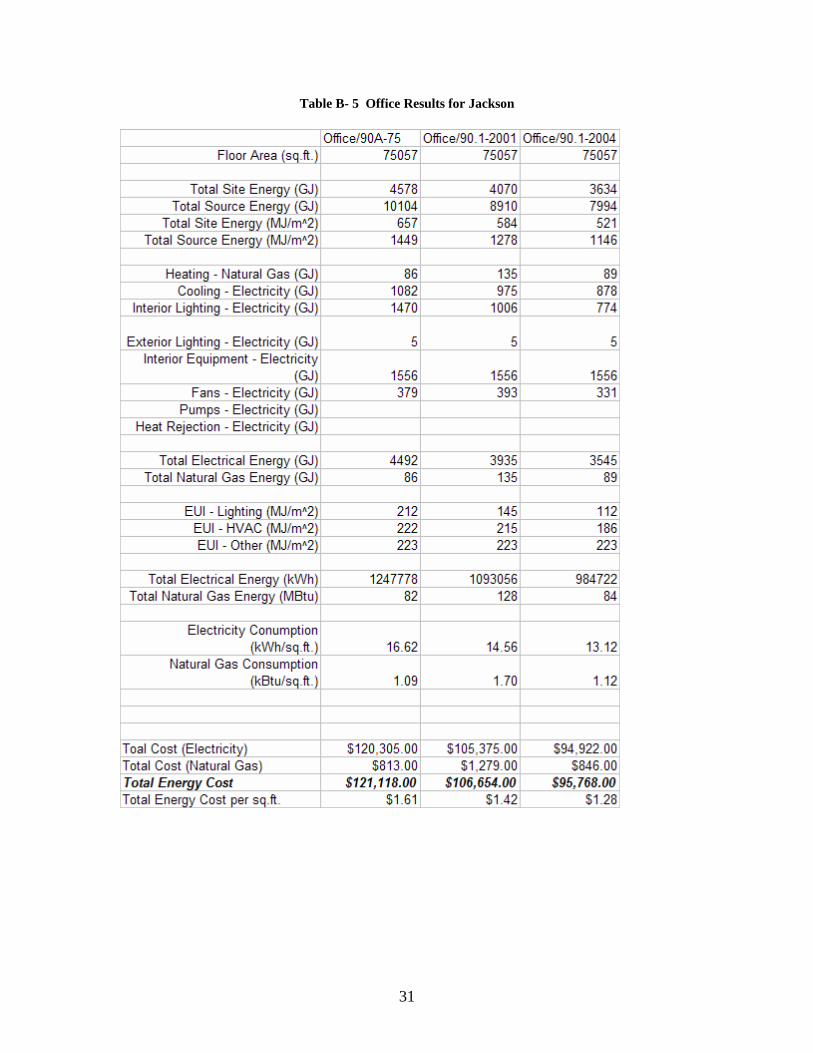
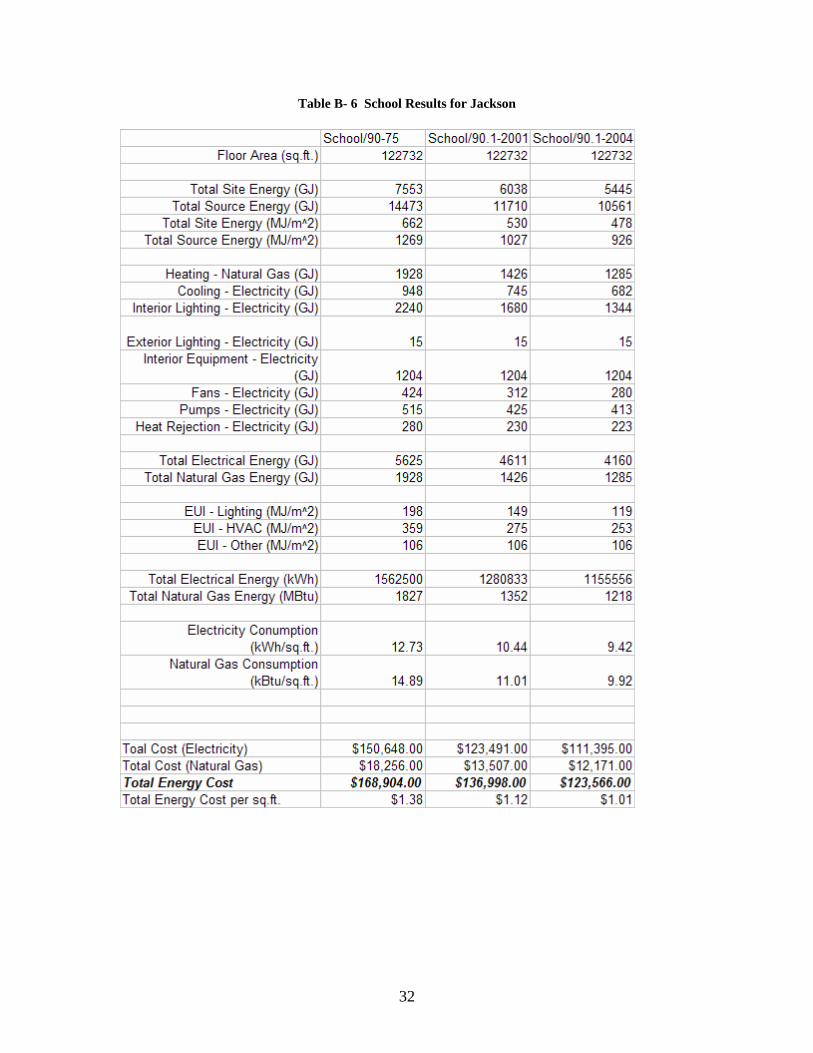
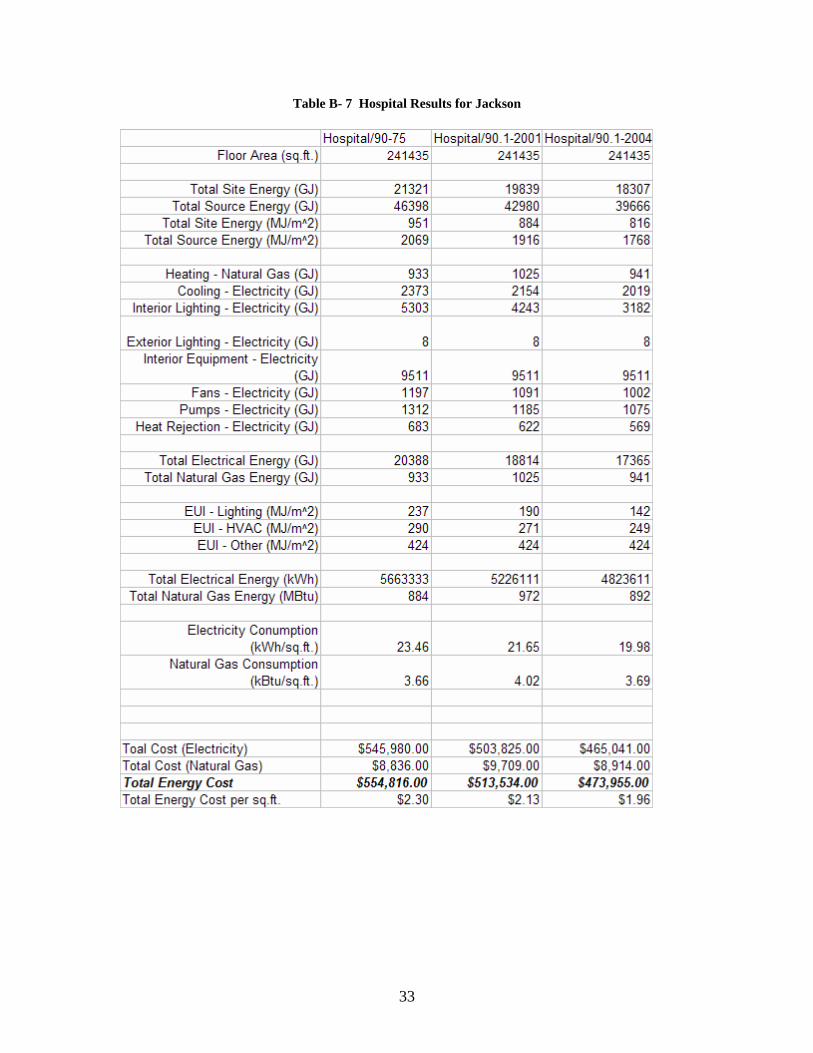
APPENDIX B. Simulation Results Tables B-1 through B-4 show the results for buildings in New Orleans by building type. Tables B-5 through B-8 show the results for buildings in Jackson by building type.
Table B- 1 Office Results for New Orleans
28
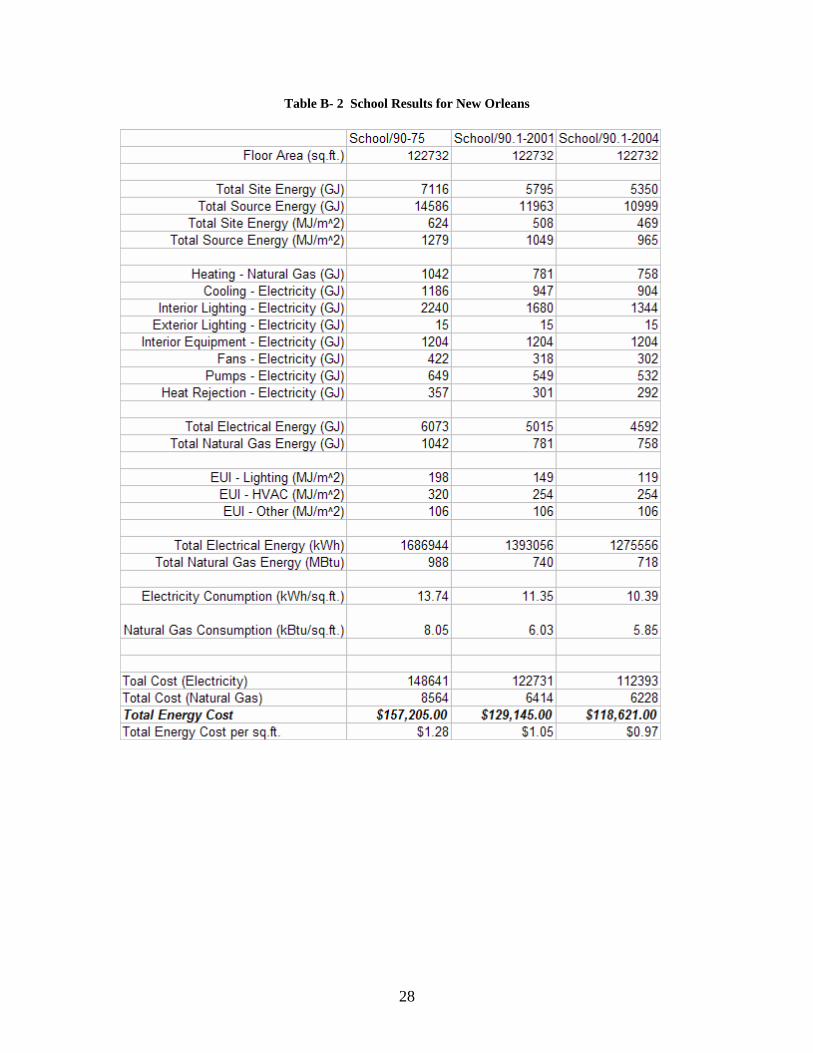
Table B- 2 School Results for New Orleans
29
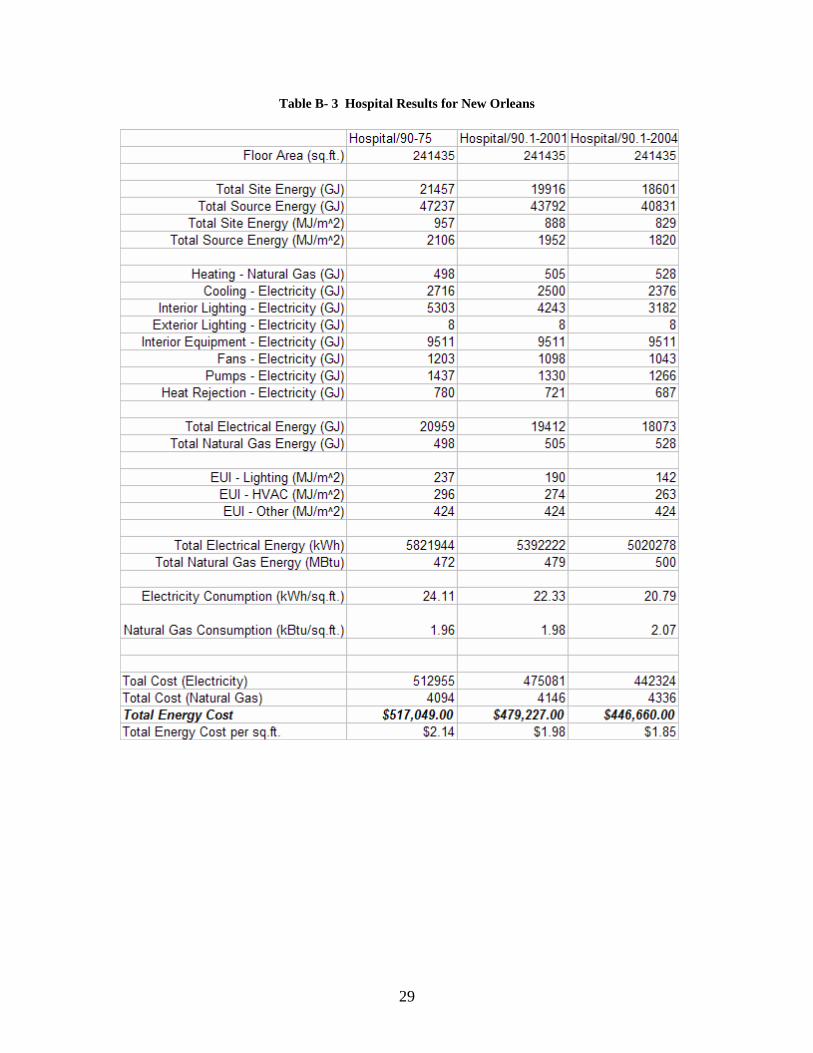
Table B- 3 Hospital Results for New Orleans
30
Table B- 4 Retail Results for New Orleans
31
Table B- 5 Office Results for Jackson
32
Table B- 6 School Results for Jackson
33
Table B- 7 Hospital Results for Jackson
34
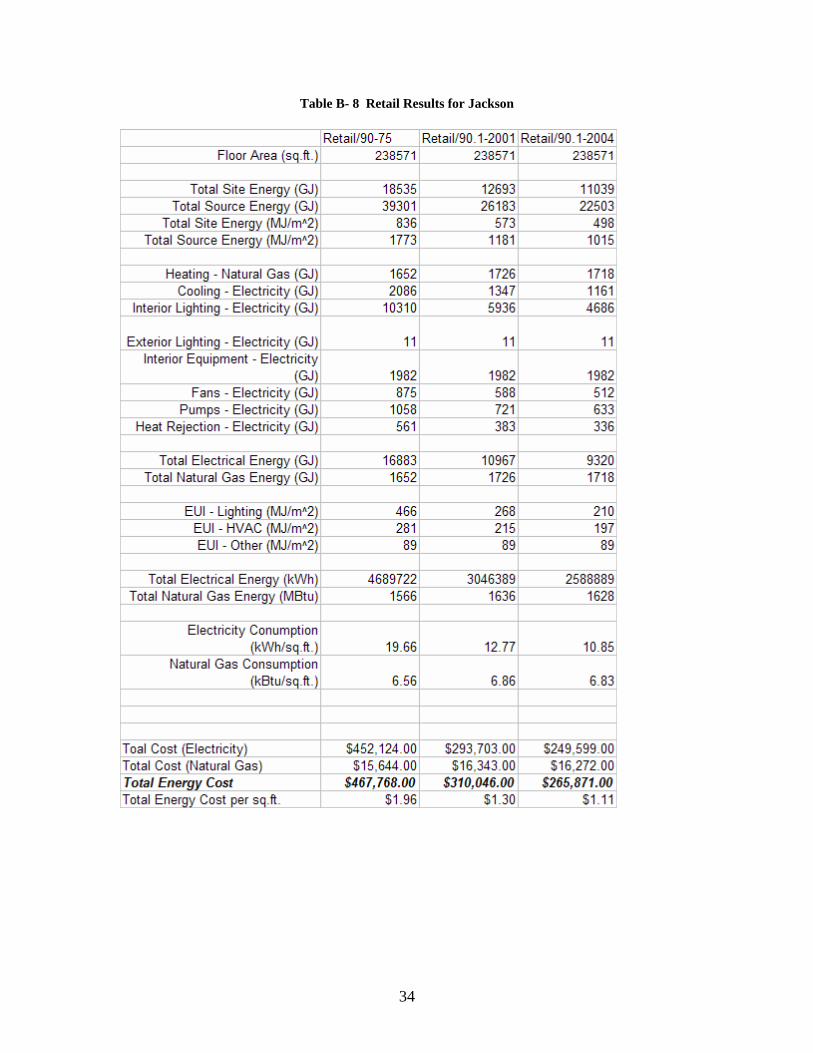
Table B- 8 Retail Results for Jackson
35
APPENDIX C
Evaluation of “Above Code” and Green Building Programs
36
APPENDIX C. Evaluation of “Above Code” and Green Building Programs
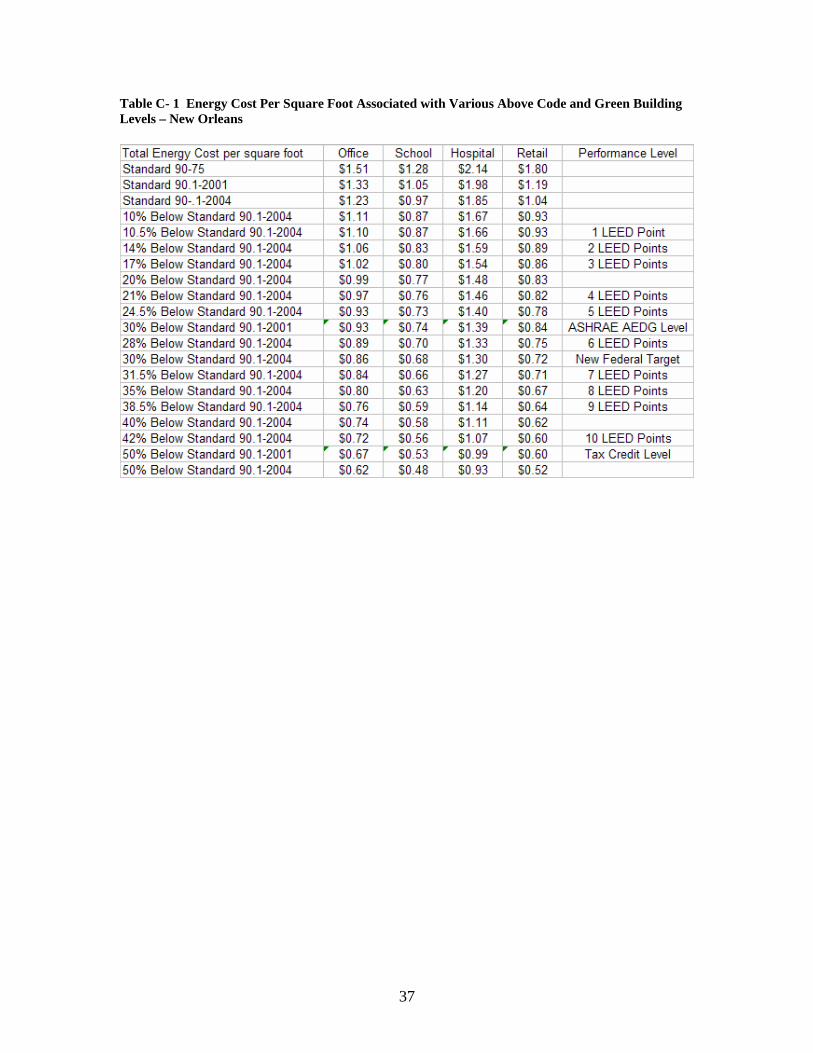
As part of this analysis, the results for the four prototypical buildings were manipulated in a spreadsheet to determine the energy impacts of achieving various levels of “above code” or “green” performance. The results of this manipulation are shown in Tables C-1 and C-2, for New Orleans and Jacksonville, respectively. Because all “above code” or “green” programs typically rely on a variant of ASHRAE’s Energy Cost Budget method or ASHRAE’s Performance Rating Method to determine savings beyond that in an ASHRAE standard, the results of this manipulation were applied only to the annual energy cost per square foot numbers reported in Tables 1 and 2. Somewhat fortuitously, the prototypical buildings used in this study were based on ASHRAE’s Performance Rating Method assumptions and therefore are quite appropriate for use in this type of analysis. Each performance level is identified and shown with the corresponding reduction in energy use for the appropriate standard. For example, 1 LEED energy point is accrued if the proposed building achieves 10.5% energy cost savings below that of ASHRAE Standard 90.1-2004. The Federal whole building tax credit level in the Energy Policy Act of 2005 is 50% below ASHRAE Standard 90.1-2001. (Note that all “above code” and “green building” programs have additional requirements besides improved energy efficiency. This study only looked at what the energy cost impact of achieving those levels would be. )
37
Table C- 1 Energy Cost Per Square Foot Associated with Various Above Code and Green Building Levels – New Orleans
38
Table C- 2 Energy Cost Per Square Foot Associated with Various Above Code and Green Building Levels – Jackson
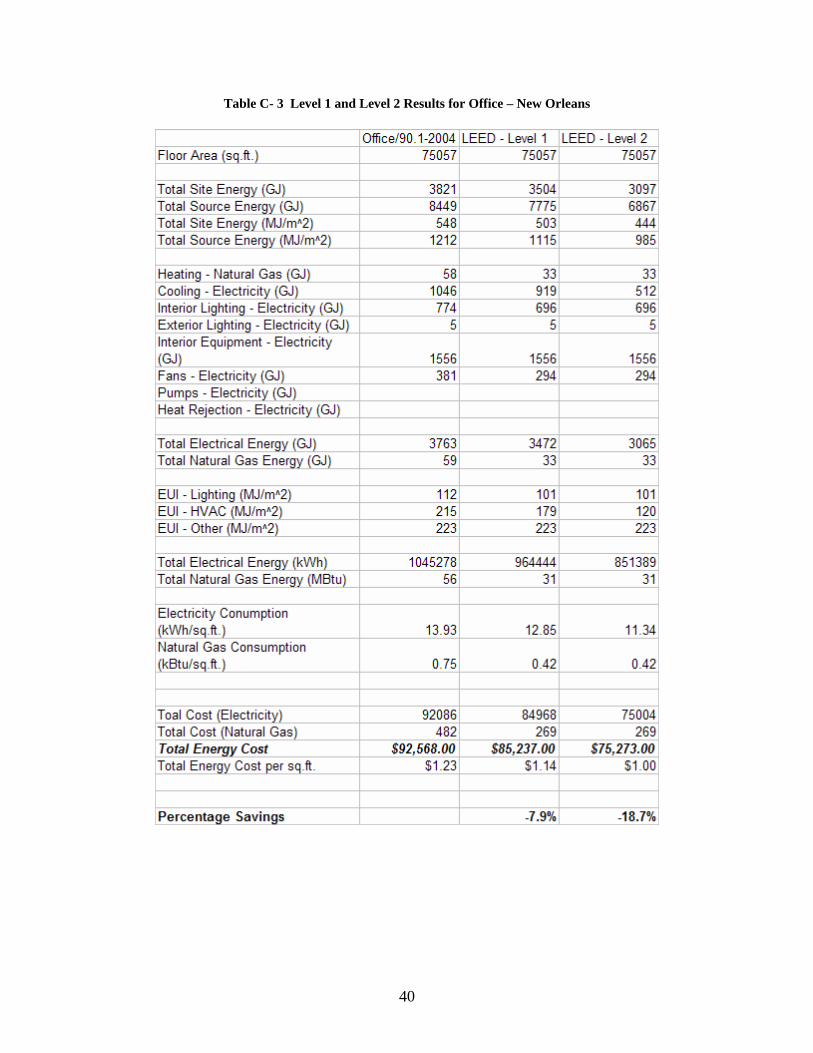
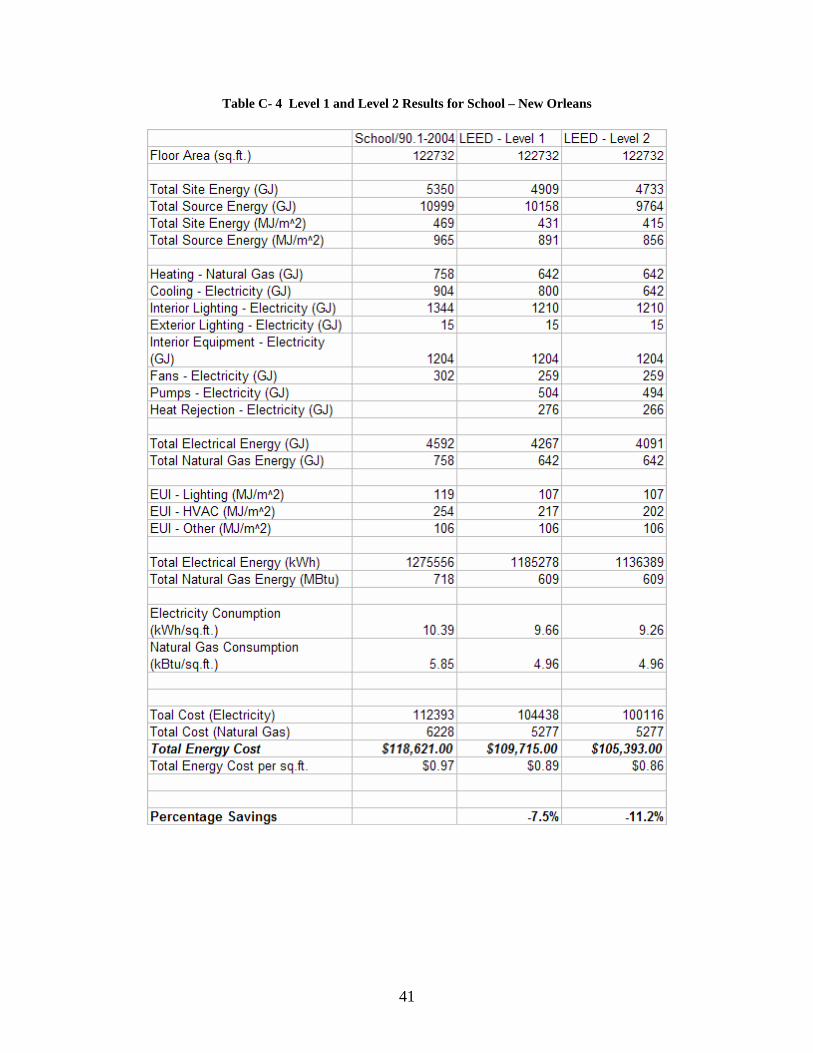
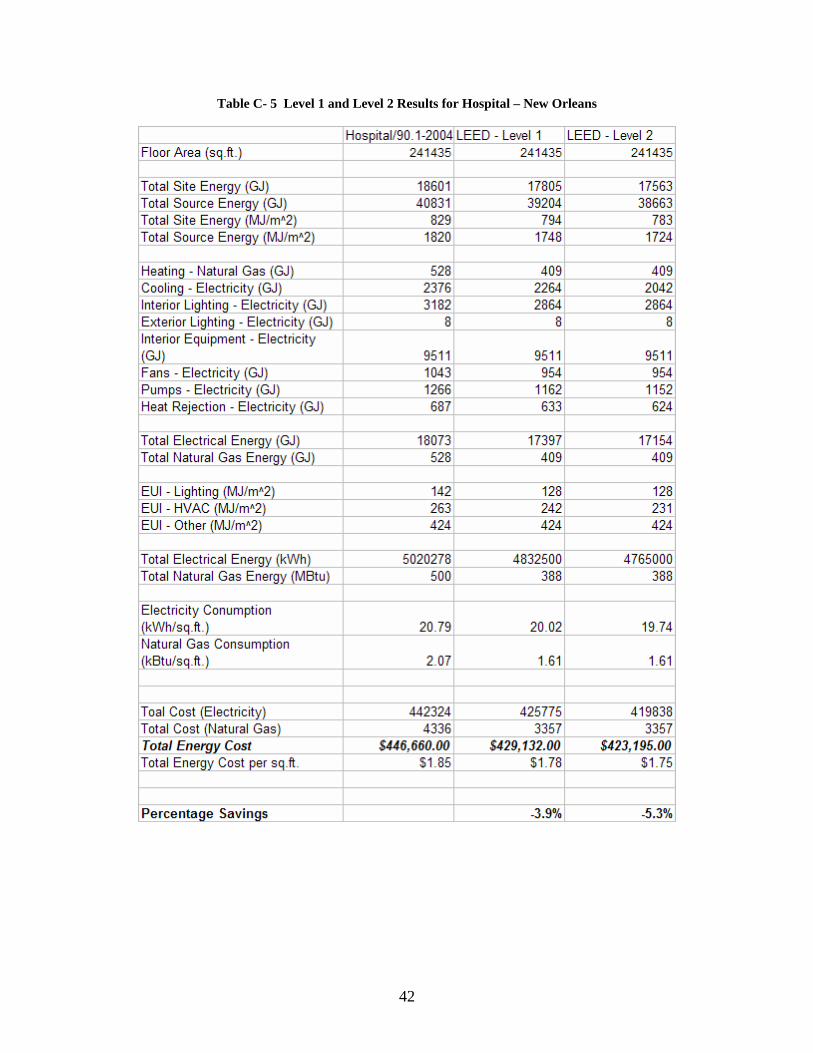
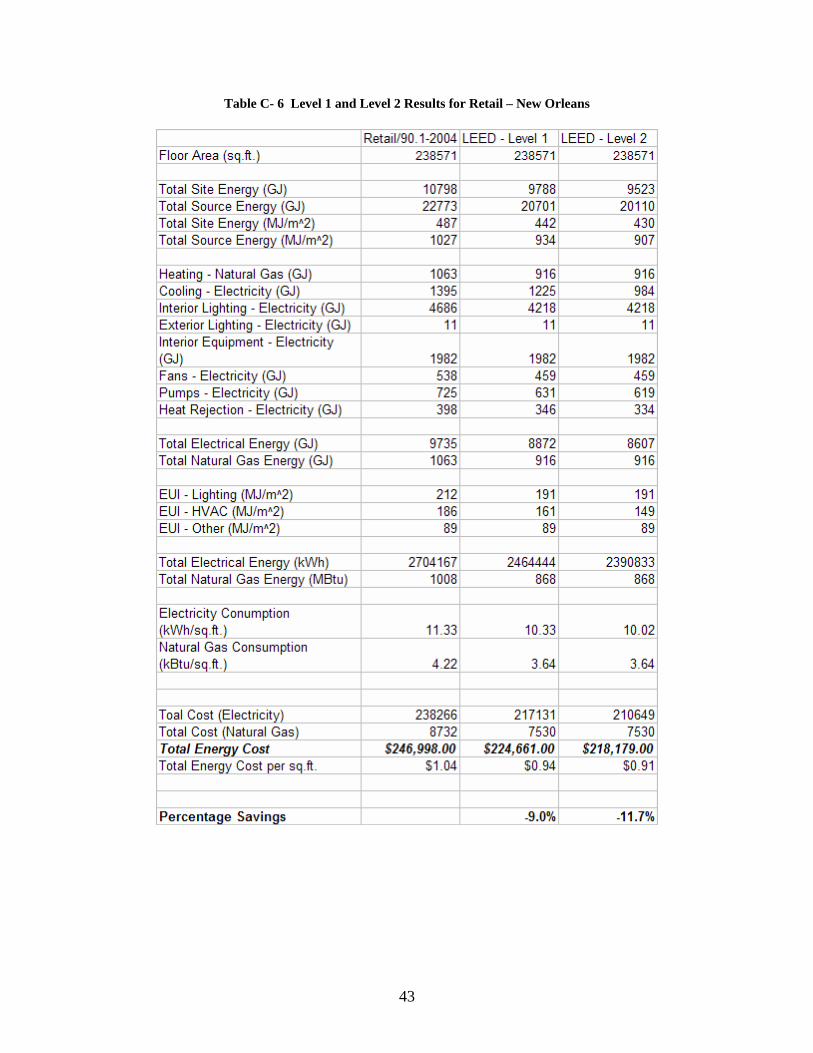
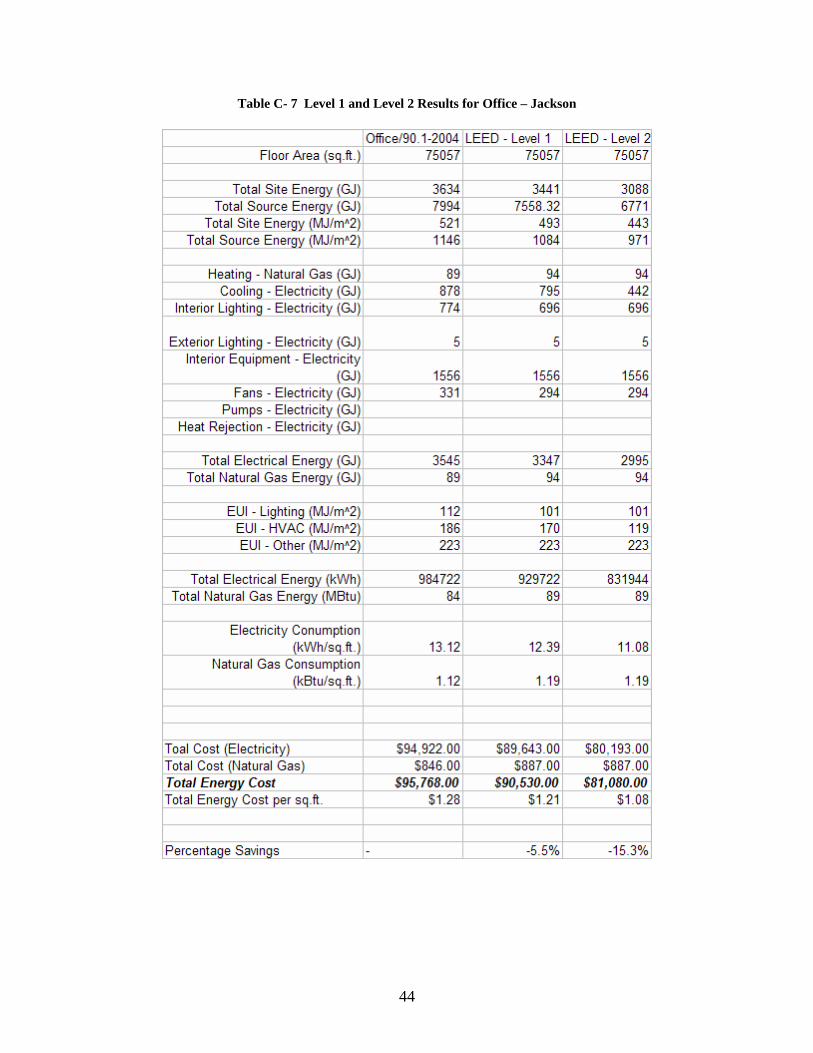
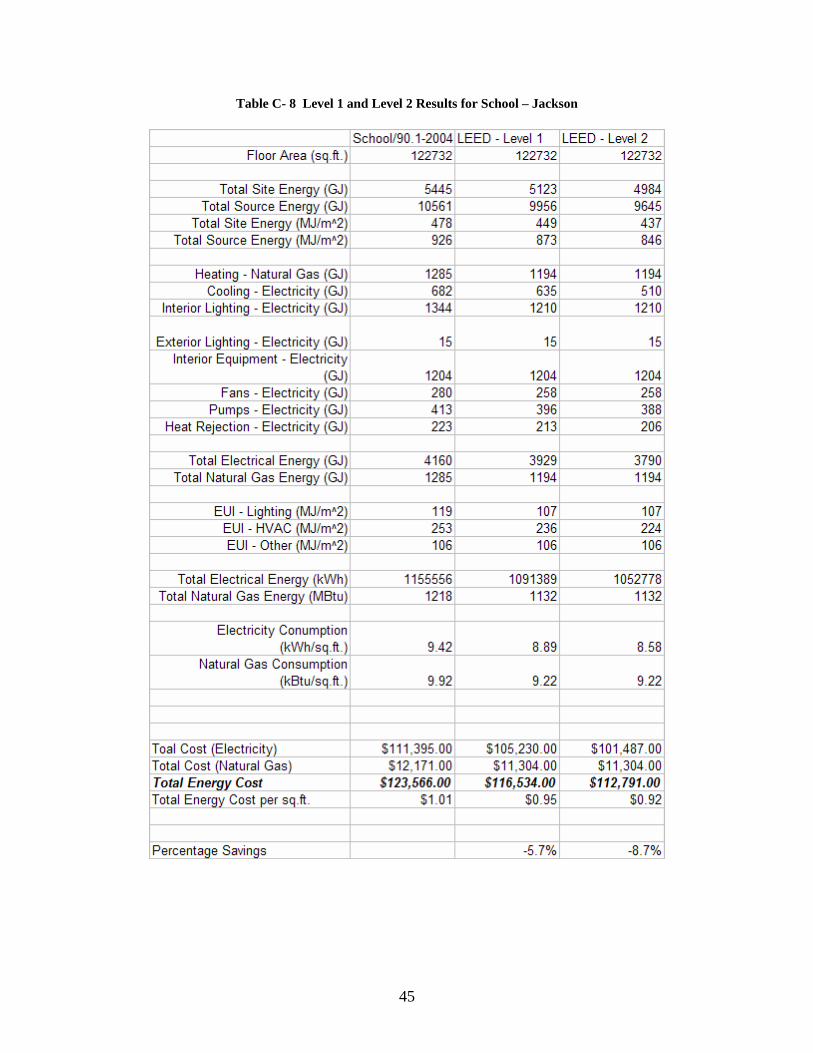
BECP also performed two sets of “above code” simulations for each building type in each climate zone. Starting with ASHRAE Standard 90.1-2004 as a baseline, two sets of enhancements were applied to each building type. These enhancements are described as LEED-Level 1 and LEED-Level 2 in the following discussion. LEED-Level 1 is simply a designation for the three improvements we made in all building types to demonstrate the impact of going beyond code. Level 1 improvements include a 10% reduction in allowable lighting power density, a reduction in glazing SHGC to 0.2, and the addition of 1in. of insulating sheathing to the outside of the building. Level 2 improvements include all Level 1 measures plus an increasing in cooling efficiency from 5.5 COP to 6.1 COP. Results for the LEED-Level 1 and LEED-Level 2 simulation are shown in Tables C-3 through C-6 for New Orleans and C-7 through C-10 for Jackson. The key points of interest are that LEED-Level 1 buildings typically showed improvement of 4% to 8% compared to Standard 90.1-2004 in New Orleans and 3% to 7% in Jackson. LEED-Level 2 buildings showed improvements of 5% to 19% in New Orleans and 4% to 15% in Jackson. The percentage improvement (and therefore the actual amount of LEED points that might be achieved) varies significantly with building type, with the office category being the “easiest” to improve and hospitals being the “hardest” to improve. At this report’s LEED-Level 2, only the New Orleans office (3 points), Jackson office (2 points) and New Orleans school and retail (1 point) achieved any LEED points. This underscores how hard it is to achieve significant energy savings by just “adding more insulation” or “putting in better windows and equipment”. Yes, you get savings, but to achieve significant energy savings, the designer may have to consider major design changes in the building, such as including daylighting and daylighting controls, re-
39
orientation of the building and/or its windows, or changing the shape of the building. None of these options were investigated for this report, but all of these options, plus many more, would need to be examined by a design team. For small office and retail buildings, the ASHRAE Advanced Energy Design Guides (ASHRAE 2004b and ASHRAE 2006b) do provide suggestions for how to achieve additional savings in these building types. No economic analysis is performed on the “above code” and green building performance levels. The main reason for this is that these are whole building targets and the designer can choose to meet them anyway possible. How these levels might be achieved will vary from building to building, location to location, and designer to designer.
40
Table C- 3 Level 1 and Level 2 Results for Office – New Orleans
41
Table C- 4 Level 1 and Level 2 Results for School – New Orleans
42
Table C- 5 Level 1 and Level 2 Results for Hospital – New Orleans
43
Table C- 6 Level 1 and Level 2 Results for Retail – New Orleans
44
Table C- 7 Level 1 and Level 2 Results for Office – Jackson
45
Table C- 8 Level 1 and Level 2 Results for School – Jackson
46
Table C- 9 Level 1 and Level 2 Results for Hospital – Jackson
47
Table C- 10 Level 1 and Level 2 Results for Retail – Jackson
48
APPENDIX D
Evaluation of Lighting Cost Effectiveness
49
APPENDIX D. Evaluation of Lighting Cost Effectiveness The adoption of a new energy code will provide the legislative and administrative basis for improved energy efficiency in buildings. The amount of lighting energy saved in buildings and the long term cost effectiveness of the code’s application will depend on several factors including: • The mix of buildings in the state • Local or regional construction costs • Differences in lighting requirements in the code • Energy cost variances over the life of the energy-using equipment • The operating characteristics of each building.
This analysis is looking at a state-wide effect from the adoption of stricter energy codes and therefore cannot reasonably be done at a detailed building level. Instead, this analysis compares the expected overall cost effectiveness of stricter lighting requirements across an expected mix of buildings within a state or region. As energy codes have been revised, the lighting power densities (LPD) limits within them have generally been reduced. This is primarily the effect of improved lighting technology and revised understanding by the Illuminating Engineering Society of North America (IESNA) of the actual light levels needed for various task activities. The resultant reduction in LPD tends to decrease the need for the lighting equipment that contributes to the LPD, which in turn reduces initial building lighting costs and generally leads to improved cost effectiveness of building lighting. For this analysis, three different code changes are explored that represent the expected changes in Louisiana and Mississippi: ASHRAE 90-75 to ASHRAE/IESNA 90.1-2001 ASHRAE/IES 90.1-1989 to ASHRAE/IESNA 90.1-2001 ASHRAE/IESNA 90.1-2001 to ASHRAE/IESNA 90.1-2004 It is important to note that this kind of code-to-code analysis is a point-to-point comparison, where a fixed level of real world activity is assumed. It is understood that buildings are not built precisely to code levels, and that actual percentage of compliance above and below codes will vary among individual buildings and building types. However, without specific knowledge of this real world activity for all buildings in existence and in the future (post-code adoption), it is not possible to analyze actual effects of code adoption. However, it is possible to compare code levels and determine the potential effect of changes from one code requirement level to another. This is the comparison and effectiveness assessment provided by this analysis. Analysis Method The basis for this analysis is the set of models that are used to derive the LPD values in the different versions of Standard 90.1. The basic models are mathematical
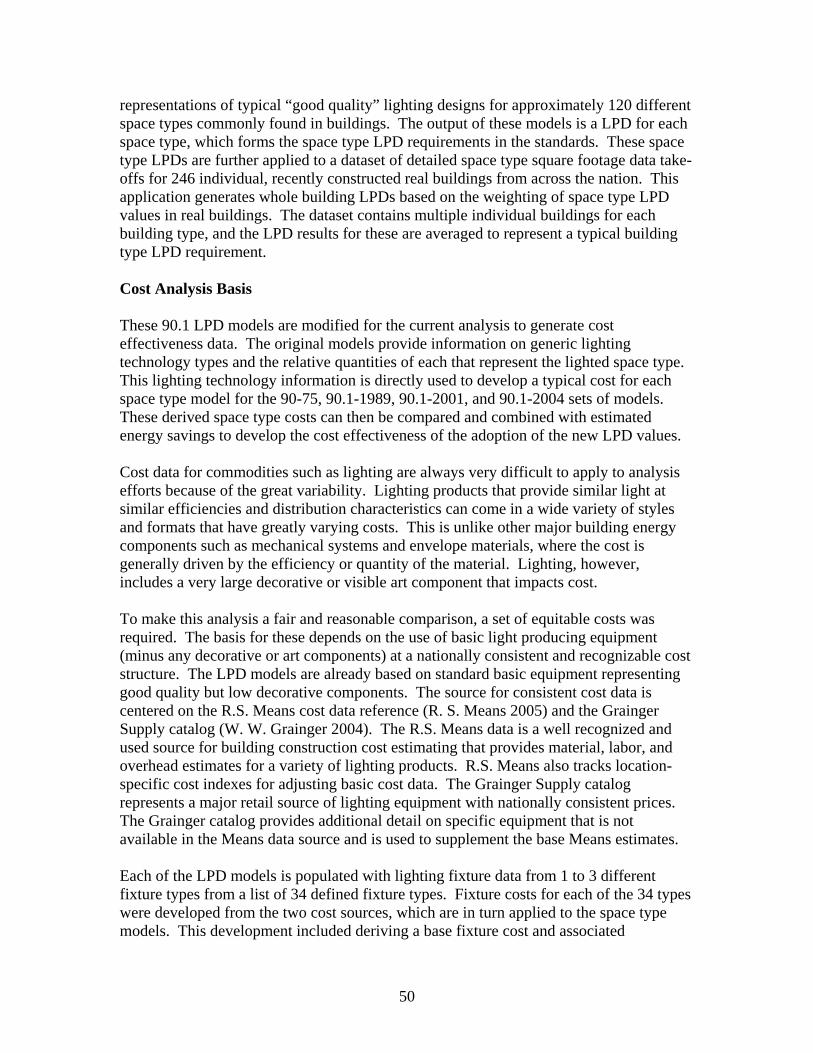
50
representations of typical “good quality” lighting designs for approximately 120 different space types commonly found in buildings. The output of these models is a LPD for each space type, which forms the space type LPD requirements in the standards. These space type LPDs are further applied to a dataset of detailed space type square footage data take-offs for 246 individual, recently constructed real buildings from across the nation. This application generates whole building LPDs based on the weighting of space type LPD values in real buildings. The dataset contains multiple individual buildings for each building type, and the LPD results for these are averaged to represent a typical building type LPD requirement. Cost Analysis Basis These 90.1 LPD models are modified for the current analysis to generate cost effectiveness data. The original models provide information on generic lighting technology types and the relative quantities of each that represent the lighted space type. This lighting technology information is directly used to develop a typical cost for each space type model for the 90-75, 90.1-1989, 90.1-2001, and 90.1-2004 sets of models. These derived space type costs can then be compared and combined with estimated energy savings to develop the cost effectiveness of the adoption of the new LPD values. Cost data for commodities such as lighting are always very difficult to apply to analysis efforts because of the great variability. Lighting products that provide similar light at similar efficiencies and distribution characteristics can come in a wide variety of styles and formats that have greatly varying costs. This is unlike other major building energy components such as mechanical systems and envelope materials, where the cost is generally driven by the efficiency or quantity of the material. Lighting, however, includes a very large decorative or visible art component that impacts cost. To make this analysis a fair and reasonable comparison, a set of equitable costs was required. The basis for these depends on the use of basic light producing equipment (minus any decorative or art components) at a nationally consistent and recognizable cost structure. The LPD models are already based on standard basic equipment representing good quality but low decorative components. The source for consistent cost data is centered on the R.S. Means cost data reference (R. S. Means 2005) and the Grainger Supply catalog (W. W. Grainger 2004). The R.S. Means data is a well recognized and used source for building construction cost estimating that provides material, labor, and overhead estimates for a variety of lighting products. R.S. Means also tracks location-specific cost indexes for adjusting basic cost data. The Grainger Supply catalog represents a major retail source of lighting equipment with nationally consistent prices. The Grainger catalog provides additional detail on specific equipment that is not available in the Means data source and is used to supplement the base Means estimates. Each of the LPD models is populated with lighting fixture data from 1 to 3 different fixture types from a list of 34 defined fixture types. Fixture costs for each of the 34 types were developed from the two cost sources, which are in turn applied to the space type models. This development included deriving a base fixture cost and associated
51
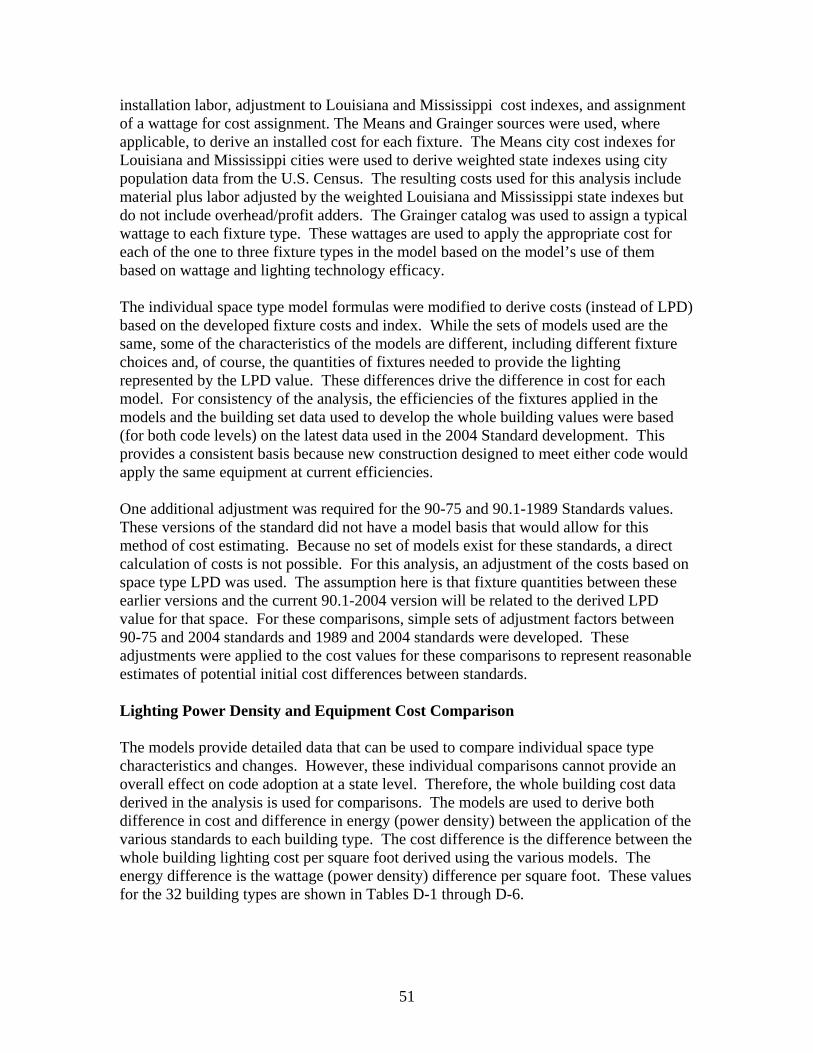
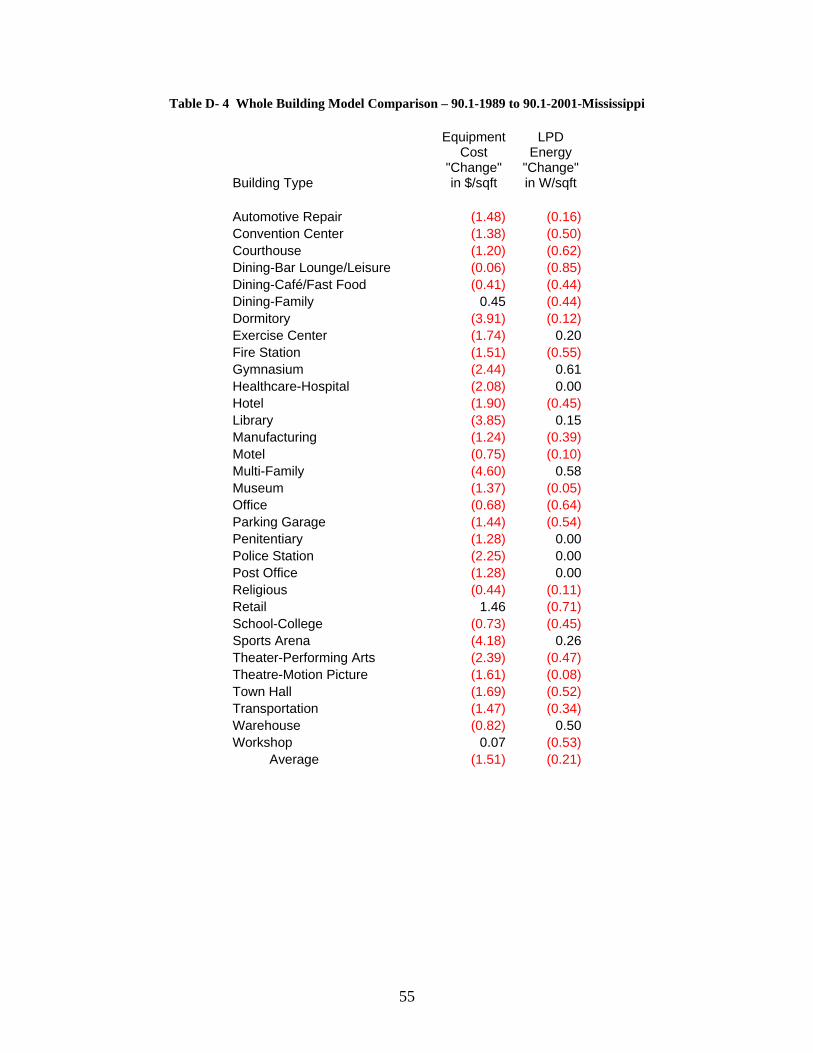
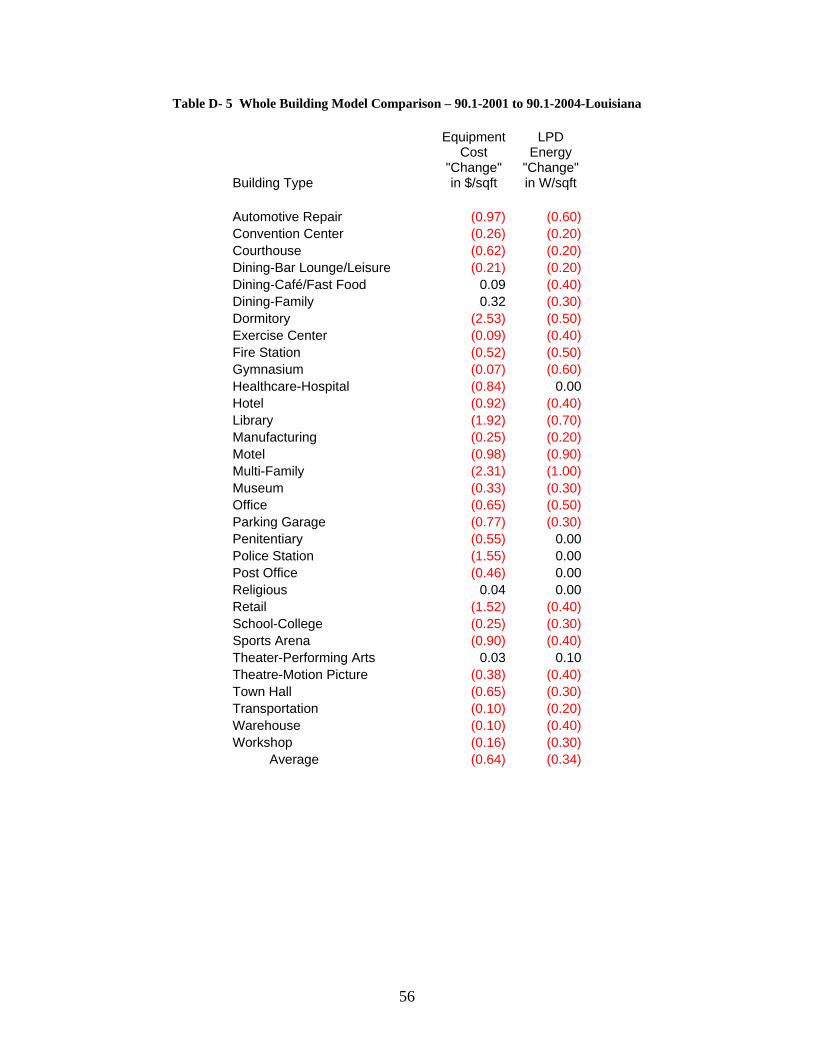
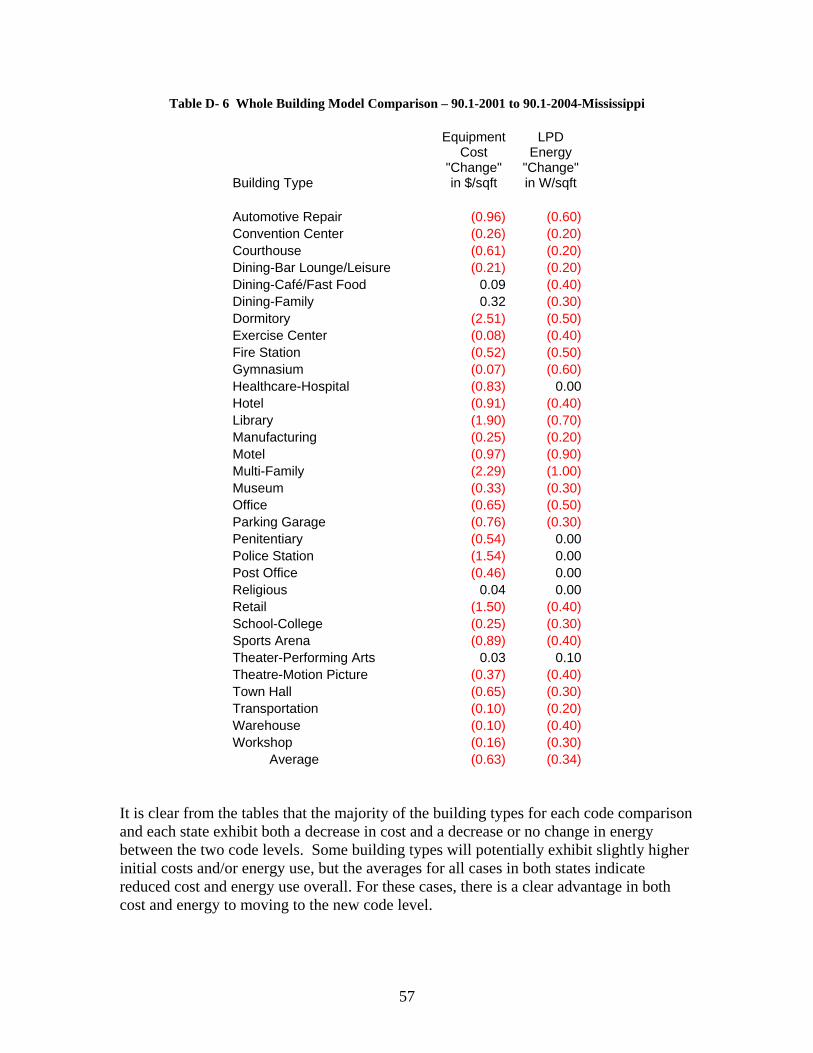
installation labor, adjustment to Louisiana and Mississippi cost indexes, and assignment of a wattage for cost assignment. The Means and Grainger sources were used, where applicable, to derive an installed cost for each fixture. The Means city cost indexes for Louisiana and Mississippi cities were used to derive weighted state indexes using city population data from the U.S. Census. The resulting costs used for this analysis include material plus labor adjusted by the weighted Louisiana and Mississippi state indexes but do not include overhead/profit adders. The Grainger catalog was used to assign a typical wattage to each fixture type. These wattages are used to apply the appropriate cost for each of the one to three fixture types in the model based on the model’s use of them based on wattage and lighting technology efficacy. The individual space type model formulas were modified to derive costs (instead of LPD) based on the developed fixture costs and index. While the sets of models used are the same, some of the characteristics of the models are different, including different fixture choices and, of course, the quantities of fixtures needed to provide the lighting represented by the LPD value. These differences drive the difference in cost for each model. For consistency of the analysis, the efficiencies of the fixtures applied in the models and the building set data used to develop the whole building values were based (for both code levels) on the latest data used in the 2004 Standard development. This provides a consistent basis because new construction designed to meet either code would apply the same equipment at current efficiencies. One additional adjustment was required for the 90-75 and 90.1-1989 Standards values. These versions of the standard did not have a model basis that would allow for this method of cost estimating. Because no set of models exist for these standards, a direct calculation of costs is not possible. For this analysis, an adjustment of the costs based on space type LPD was used. The assumption here is that fixture quantities between these earlier versions and the current 90.1-2004 version will be related to the derived LPD value for that space. For these comparisons, simple sets of adjustment factors between 90-75 and 2004 standards and 1989 and 2004 standards were developed. These adjustments were applied to the cost values for these comparisons to represent reasonable estimates of potential initial cost differences between standards. Lighting Power Density and Equipment Cost Comparison The models provide detailed data that can be used to compare individual space type characteristics and changes. However, these individual comparisons cannot provide an overall effect on code adoption at a state level. Therefore, the whole building cost data derived in the analysis is used for comparisons. The models are used to derive both difference in cost and difference in energy (power density) between the application of the various standards to each building type. The cost difference is the difference between the whole building lighting cost per square foot derived using the various models. The energy difference is the wattage (power density) difference per square foot. These values for the 32 building types are shown in Tables D-1 through D-6.

52
Table D- 1 Whole Building Model Comparison – 90-75 to 90.1-2001-Louisiana
Building Type
Equipment Cost
"Change" in $/sqft
LPD Energy
"Change" in W/sqft
Automotive Repair 1.25 (2.17) Convention Center (2.34) (0.08) Courthouse (3.14) 0.10 Dining-Bar Lounge/Leisure (2.25) (0.14) Dining-Café/Fast Food (1.49) (0.23) Dining-Family (1.30) (0.26) Dormitory (3.91) (0.11) Exercise Center (1.87) 0.41 Fire Station (1.55) 0.03 Gymnasium (2.91) 0.80 Healthcare-Hospital (1.91) 0.00 Hotel (1.71) (0.40) Library (4.16) 0.36 Manufacturing (2.36) 0.01 Motel (0.74) (0.08) Multi-Family (4.86) 0.76 Museum (1.83) 0.27 Office (0.76) (0.44) Parking Garage (1.27) (0.61) Penitentiary (1.08) 0.00 Police Station (2.02) 0.00 Post Office (1.16) 0.00 Religious (0.50) 0.01 Retail 1.99 (1.41) School-College (0.65) (0.45) Sports Arena (4.31) 0.29 Theater-Performing Arts (3.43) (0.16) Theatre-Motion Picture (2.27) 0.31 Town Hall (2.10) (0.13) Transportation (0.80) (0.32) Warehouse (1.43) 0.42 Workshop 0.87 (0.81) Average (1.75) (0.13)
53
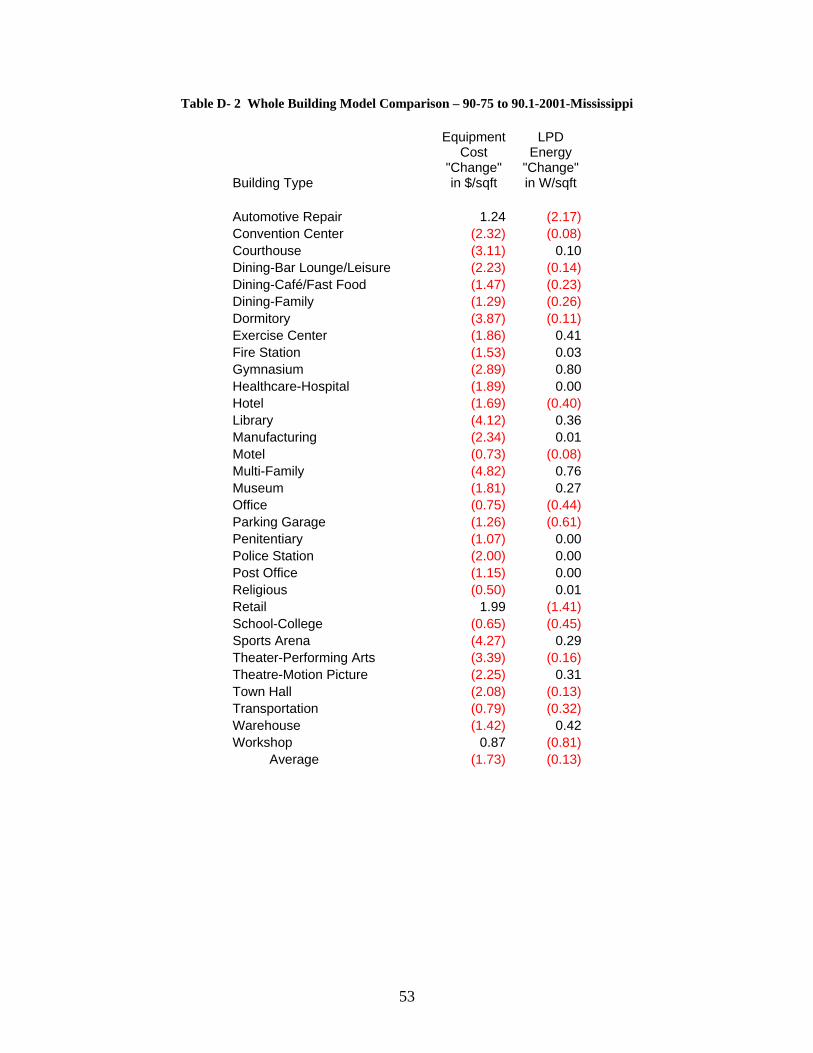
Table D- 2 Whole Building Model Comparison – 90-75 to 90.1-2001-Mississippi
Building Type
Equipment Cost
"Change" in $/sqft
LPD Energy
"Change" in W/sqft
Automotive Repair 1.24 (2.17) Convention Center (2.32) (0.08) Courthouse (3.11) 0.10 Dining-Bar Lounge/Leisure (2.23) (0.14) Dining-Café/Fast Food (1.47) (0.23) Dining-Family (1.29) (0.26) Dormitory (3.87) (0.11) Exercise Center (1.86) 0.41 Fire Station (1.53) 0.03 Gymnasium (2.89) 0.80 Healthcare-Hospital (1.89) 0.00 Hotel (1.69) (0.40) Library (4.12) 0.36 Manufacturing (2.34) 0.01 Motel (0.73) (0.08) Multi-Family (4.82) 0.76 Museum (1.81) 0.27 Office (0.75) (0.44) Parking Garage (1.26) (0.61) Penitentiary (1.07) 0.00 Police Station (2.00) 0.00 Post Office (1.15) 0.00 Religious (0.50) 0.01 Retail 1.99 (1.41) School-College (0.65) (0.45) Sports Arena (4.27) 0.29 Theater-Performing Arts (3.39) (0.16) Theatre-Motion Picture (2.25) 0.31 Town Hall (2.08) (0.13) Transportation (0.79) (0.32) Warehouse (1.42) 0.42 Workshop 0.87 (0.81) Average (1.73) (0.13)
54
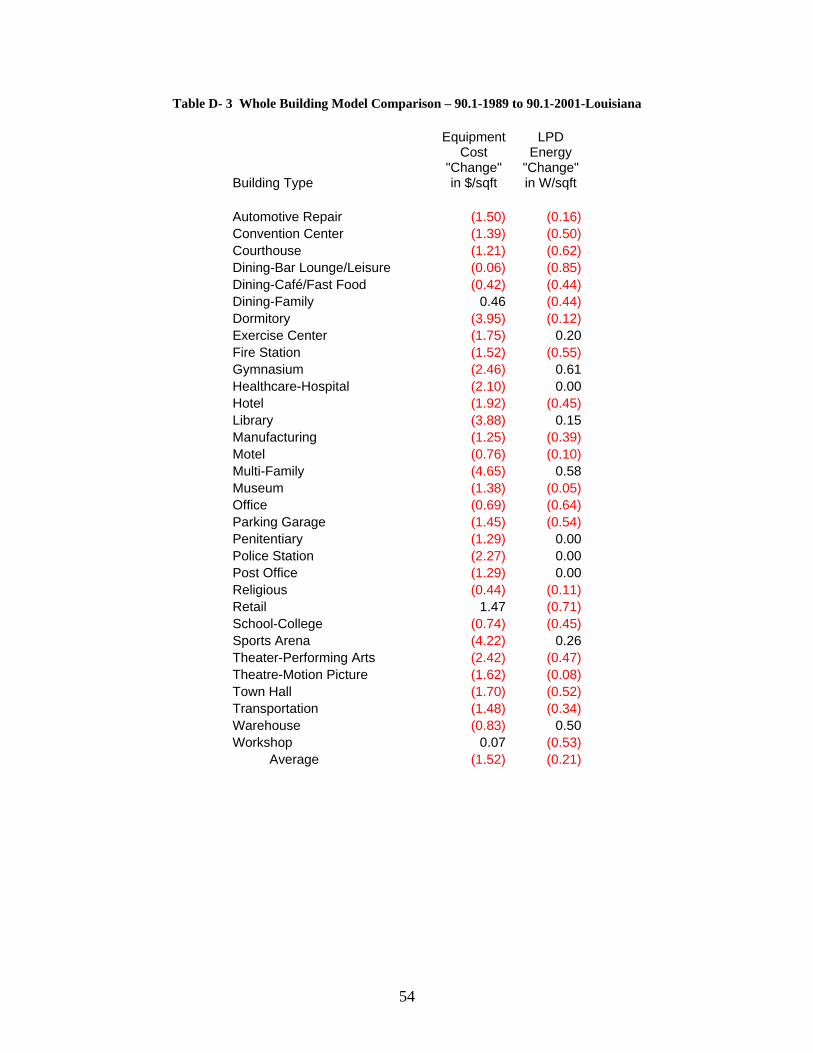
Table D- 3 Whole Building Model Comparison – 90.1-1989 to 90.1-2001-Louisiana
Building Type
Equipment Cost
"Change" in $/sqft
LPD Energy
"Change" in W/sqft
Automotive Repair (1.50) (0.16) Convention Center (1.39) (0.50) Courthouse (1.21) (0.62) Dining-Bar Lounge/Leisure (0.06) (0.85) Dining-Café/Fast Food (0.42) (0.44) Dining-Family 0.46 (0.44) Dormitory (3.95) (0.12) Exercise Center (1.75) 0.20 Fire Station (1.52) (0.55) Gymnasium (2.46) 0.61 Healthcare-Hospital (2.10) 0.00 Hotel (1.92) (0.45) Library (3.88) 0.15 Manufacturing (1.25) (0.39) Motel (0.76) (0.10) Multi-Family (4.65) 0.58 Museum (1.38) (0.05) Office (0.69) (0.64) Parking Garage (1.45) (0.54) Penitentiary (1.29) 0.00 Police Station (2.27) 0.00 Post Office (1.29) 0.00 Religious (0.44) (0.11) Retail 1.47 (0.71) School-College (0.74) (0.45) Sports Arena (4.22) 0.26 Theater-Performing Arts (2.42) (0.47) Theatre-Motion Picture (1.62) (0.08) Town Hall (1.70) (0.52) Transportation (1.48) (0.34) Warehouse (0.83) 0.50 Workshop 0.07 (0.53) Average (1.52) (0.21)
55
Table D- 4 Whole Building Model Comparison – 90.1-1989 to 90.1-2001-Mississippi
Building Type
Equipment Cost
"Change" in $/sqft
LPD Energy
"Change" in W/sqft
Automotive Repair (1.48) (0.16) Convention Center (1.38) (0.50) Courthouse (1.20) (0.62) Dining-Bar Lounge/Leisure (0.06) (0.85) Dining-Café/Fast Food (0.41) (0.44) Dining-Family 0.45 (0.44) Dormitory (3.91) (0.12) Exercise Center (1.74) 0.20 Fire Station (1.51) (0.55) Gymnasium (2.44) 0.61 Healthcare-Hospital (2.08) 0.00 Hotel (1.90) (0.45) Library (3.85) 0.15 Manufacturing (1.24) (0.39) Motel (0.75) (0.10) Multi-Family (4.60) 0.58 Museum (1.37) (0.05) Office (0.68) (0.64) Parking Garage (1.44) (0.54) Penitentiary (1.28) 0.00 Police Station (2.25) 0.00 Post Office (1.28) 0.00 Religious (0.44) (0.11) Retail 1.46 (0.71) School-College (0.73) (0.45) Sports Arena (4.18) 0.26 Theater-Performing Arts (2.39) (0.47) Theatre-Motion Picture (1.61) (0.08) Town Hall (1.69) (0.52) Transportation (1.47) (0.34) Warehouse (0.82) 0.50 Workshop 0.07 (0.53) Average (1.51) (0.21)
56
Table D- 5 Whole Building Model Comparison – 90.1-2001 to 90.1-2004-Louisiana
Building Type
Equipment Cost
"Change" in $/sqft
LPD Energy
"Change" in W/sqft
Automotive Repair (0.97) (0.60) Convention Center (0.26) (0.20) Courthouse (0.62) (0.20) Dining-Bar Lounge/Leisure (0.21) (0.20) Dining-Café/Fast Food 0.09 (0.40) Dining-Family 0.32 (0.30) Dormitory (2.53) (0.50) Exercise Center (0.09) (0.40) Fire Station (0.52) (0.50) Gymnasium (0.07) (0.60) Healthcare-Hospital (0.84) 0.00 Hotel (0.92) (0.40) Library (1.92) (0.70) Manufacturing (0.25) (0.20) Motel (0.98) (0.90) Multi-Family (2.31) (1.00) Museum (0.33) (0.30) Office (0.65) (0.50) Parking Garage (0.77) (0.30) Penitentiary (0.55) 0.00 Police Station (1.55) 0.00 Post Office (0.46) 0.00 Religious 0.04 0.00 Retail (1.52) (0.40) School-College (0.25) (0.30) Sports Arena (0.90) (0.40) Theater-Performing Arts 0.03 0.10 Theatre-Motion Picture (0.38) (0.40) Town Hall (0.65) (0.30) Transportation (0.10) (0.20) Warehouse (0.10) (0.40) Workshop (0.16) (0.30) Average (0.64) (0.34)
57
Table D- 6 Whole Building Model Comparison – 90.1-2001 to 90.1-2004-Mississippi
Building Type
Equipment Cost
"Change" in $/sqft
LPD Energy
"Change" in W/sqft
Automotive Repair (0.96) (0.60) Convention Center (0.26) (0.20) Courthouse (0.61) (0.20) Dining-Bar Lounge/Leisure (0.21) (0.20) Dining-Café/Fast Food 0.09 (0.40) Dining-Family 0.32 (0.30) Dormitory (2.51) (0.50) Exercise Center (0.08) (0.40) Fire Station (0.52) (0.50) Gymnasium (0.07) (0.60) Healthcare-Hospital (0.83) 0.00 Hotel (0.91) (0.40) Library (1.90) (0.70) Manufacturing (0.25) (0.20) Motel (0.97) (0.90) Multi-Family (2.29) (1.00) Museum (0.33) (0.30) Office (0.65) (0.50) Parking Garage (0.76) (0.30) Penitentiary (0.54) 0.00 Police Station (1.54) 0.00 Post Office (0.46) 0.00 Religious 0.04 0.00 Retail (1.50) (0.40) School-College (0.25) (0.30) Sports Arena (0.89) (0.40) Theater-Performing Arts 0.03 0.10 Theatre-Motion Picture (0.37) (0.40) Town Hall (0.65) (0.30) Transportation (0.10) (0.20) Warehouse (0.10) (0.40) Workshop (0.16) (0.30) Average (0.63) (0.34)
It is clear from the tables that the majority of the building types for each code comparison and each state exhibit both a decrease in cost and a decrease or no change in energy between the two code levels. Some building types will potentially exhibit slightly higher initial costs and/or energy use, but the averages for all cases in both states indicate reduced cost and energy use overall. For these cases, there is a clear advantage in both cost and energy to moving to the new code level.
58
Analysis Results Primary results from this comparison analysis are:
• The average effect of the cost change across all building types is an estimated decrease in lighting installation costs of $0.63 to $1.75 per square foot across the states based on a typical nationwide building mix.
• The average power density change across all building types is an estimated
decrease of 0.13 to 0.34 watts per square foot in lighting power density across the states based on a typical nationwide building mix.
These results make it clear that on a State level, adoption of the new lower LPD values found in the more advanced ASHRAE/IESNA 90.1 Standards are cost effective. It is important to note that while this analysis can do a reasonable job of comparing code levels, it is in no way a metric for actual practice, and, therefore, actual effects of the code. Builders have and will continue to design buildings (and lighting) based on client needs and desires, with energy code compliance, at best, a companion consideration. Therefore, it is probable that some (or many) buildings are already designed better than existing codes and may require minimal or no change to meet future codes. Additional Adoption Considerations There are three other lighting-related factors discussed below – exterior lighting power densities, lighting controls-occupancy sensors, and the relationship between compliance and additional lighting power allowances.
Exterior Lighting Power Densities One of the major additions to the 2004 version of the 90.1 Standard is a greatly expanded set of exterior lighting power density values. The previous standard (1999) only included specific power limits for four common exterior applications (building entrances and exits, canopies, and facades only) compared to 17 in the 2004 Standard (covering effectively all expected exterior applications). These values work in the same way as the interior LPDs in that they specify maximum power limits for specific exterior applications. The set of requirements includes tradable as well as non-tradable application LPDs. The tradable applications offer the same trade-off capability among applications as the interior LPDs. The non-tradable applications have specific power limits that must be used for the specific application and cannot be traded off to other applications. This expanded set of power limits should have a similar energy saving and cost reducing effect as the revised interior LPDs analyzed in this report. The result of this expanded set of values is that large exterior areas previously unrestrained by a power limit must now
59
comply with one. The actual energy savings will depend on the individual design application, but these requirements will have the effect of reducing exterior lighting energy use. The installation cost of exterior lighting will likely also be reduced because the power limits will cause designs to be re-evaluated with the likely result being fewer or smaller exterior fixtures.
Lighting Controls – Occupancy Sensors One important addition to the 2004 version of the 90.1 Standard is a limited requirement for occupancy sensors in most classrooms, conference/meeting rooms, and employee lunch and break rooms. The existing automatic shutoff control requirement for lighting (in both 1999 and 2004 versions) allows the use of occupancy sensors as one compliance option. Note that the language for this requirement in the 1999 version is decidedly unclear. [This language has been corrected in the 90.1–2001 and 2004 Standard.] This new requirement in the 2004 version makes the use of occupancy sensors mandatory for these spaces. The savings potential from occupancy sensor control has been studied, and the results indicate large but quite variable potential. It is generally impossible to evaluate actual savings potential given the multiple variables of the building stock and use characteristics for an entire state. However, some discussion of the effect of this requirement can be useful. Research finds that some building spaces are better candidates than others for these sensors both from a cost effectiveness and operational standpoint. For example, most of the study results show that “common” type spaces such as lunchrooms, conference rooms, restrooms, and/or photocopy rooms provide the best energy savings opportunities. Conversely, those studies show that some but not all individual offices can provide little savings. While the conditions are extremely variable, the study results show potential payback periods for occupancy sensors in the range of 0.7 to 7.8 years (depending on capacity of installed lighting) for “common” spaces and 4.0 to 9.1 years for office type Federal energy rates of around $0.08 per kWh (well below the rates of $0.081 per kWh used in this study for Louisiana and $0.0964 per kWh used for Mississippi.) Therefore, this new requirement for occupancy sensors in limited common space types will be a cost effective addition to energy code requirements for Louisiana and Mississippi .
Compliance and Additional Lighting Power Allowances In addition to the cost effectiveness considerations for new code adoption, other factors may merit consideration. It is clear that in many building types, lighting can be an important part of design, art, and commerce. It is also understood by code developers that the prominent art element of lighting (not found in envelope and mechanical energy concerns) creates potential problems with

60
meeting specific code levels. This “art element” is the driver behind the additional lighting power allowances provided in the 90.1 Standard. Because of the unfamiliarity of codes and application, some interested parties may not have a full understanding of the use of the additional allowances. Therefore, the adoption of more stringent codes such as 90.1-2004 could be eased within the lighting design community by emphasis and education placed on these allowances.
61
APPENDIX E
Evaluation of Envelope Cost Effectiveness
62
APPENDIX E. Evaluation of Envelope Cost Effectiveness
On the building envelope side, the changes are simply: R-9 to R-15 for continuous roof insulation – assumed to be foam sheathing R-11 to R-13 for wall insulation – assumed to be batts “Ok window” to “Good window” – discussed below. While determining the costs of simple building changes would seem almost trivial, nothing about first cost data tends to be easy. Consideration of retail versus wholesale costs, whether or not additional markups for profit should be included, whether or not the product is “standard” or “special order” in a particular market location, and the simple variation in products that are not really “commodities” (such as windows) can lead to widely different estimates of first costs. This variation in first cost, in turn, can lead to widely varying estimates of cost effectiveness of particular measures. The first cost estimates are fully documented to ensure that the analysis of cost effectiveness can be redone by other interested parties if other first cost data is used. Basis of Envelope First Costs The costs used in this report are taken from the ASHRAE Standard 90.1 Envelope Criteria Optimization Program. This program (a spreadsheet written in Visual Basic for Applications (VBA)) developed by Richard Liesen and Merle McBride of Owen Corning) was used in development of new criteria for ASHRAE Standard 90.1-2007. The cost data for this generator was updated by Joe Deringer of the Deringer Group, John Hogan of the City of Seattle, and Chris Mathis of MC2, based on data available to them. Because this report is comparing various ASHRAE standards and the data collected in this generator are used for updating those same standards, this data was used. This criteria generator is a spreadsheet named 901EnvOpt_2006VBA(6-21-2006).xls. The spreadsheet is available from the principle author of this report and is listed in the reference list as ASHRAE 2006a. Roof Insulation For roofs with insulation above deck, ASHRAE lists roofs of R-10 ci (continuous insulation) at $1.00 per square foot incremental cost (over no insulation) and R-15 ci at $1.35 per square foot (over no insulation). The incremental cost for R-7.6 ci was $0.83 per square foot. This indicates that cost differential between R-9 and R-15 insulation should be something slightly higher than $0.35 per foot, but less than $0.52 per square foot. Interpolating between R-7.6 and R-10 to figure out the value to use for R-9, the best estimate is $0.45 per square foot. The incremental cost of going from R-9 ci to R-15 ci is therefore $0.45 per square foot.
63
Wall Insulation For walls with steel framing, ASHRAE lists R-13 at $0.31 per square foot. This can be scaled down by 11/13 to provide a cost for R-11 batt insulation at $0.26 per square foot. The incremental cost of going from R-11 to R-13 is therefore $0.05 per square foot. Windows Windows are a special case for life cycle costing. Two parameters (U-factor and SHGC) play into the overall efficiency of the window. These parameters tend to be treated independently in energy codes and standards, although there are broad relationships between U-factor and SHGC that are considered when developing those codes and standards. For this report, more detailed examination of Tables A-1 and A-2 leads to the identification of the following transitions from one window to another:
Window Transition 1 A U-1.12, SHGC-0.59 window to U-1.12, SHGC-0.25 window A U-1.12, SHGC-0.61 window to U-1.12, SHGC-0.25 window Generically, these changes both represent a change from a single pane, metal frame, tinted glass to single pane, metal frame, heavily tinted glass
ASHRAE lists a number of glass types and their incremental costs over a clear, single pane, single strength, metal frame window. The two closest windows that appear to represent this transition are as follows:
ASHRAE thermally broken frame and green tint - U-1.15, SHGC-0.58 - incremental cost of $2.54 ASHRAE vinyl frame, green medium performance reflective - U-1.02, SHGC-0.37 - incremental cost of $9.36. (This is the single most expensive single pane window in the ASHRAE database.)
The estimated delta cost between these two windows is $6.82.
Window Transition 2 A U-0.7, SHGC-0.51 window to a U-1.12, SHGC-0.25 window A U-0.65, SHGC-0.52 window to U-1.12, SHGC-0.25 window Generically, these changes both represent a change from a double pane, wood vinyl frame, clear glass to single pane, metal frame, heavily tinted glass
ASHRAE lists a number of glass types and their incremental costs over a clear, single pane, single strength, metal frame window. The two closest windows that appear to represent this transition are as follows:
ASHRAE U-0.73, SHGC-0.51 - incremental cost of $4.49
64
ASHRAE vinyl frame, green medium performance reflective - U-1.02, SHGC-0.37 - incremental cost of $9.36. (This is the single most expensive single pane window in the ASHRAE database.)
The estimated delta cost between these two windows is $4.87.
Window Transition 3 A U-0.7, SHGC-0.24 window to a U-1.12, SHGC-0.25 window A U-0.65, SHGC-0.25 window to U-1.12, SHGC-0.25 window A U-0.57, SHGC-0.25 window to U-1.12, SHGC-0.25 window Generically, these changes all represent a change from a double pane, wood vinyl frame, heavily tinted glass to single pane, metal frame, heavily tinted glass
ASHRAE lists a number of glass types and their incremental costs over a clear, single pane, single strength, metal frame window. The two closest windows that appear to represent this transition are as follows:
ASHRAE metal frame, green medium performance peflective -std-clear super sputter low-E (e=0.05) – U-0.57, SHGC-0.25 – incremental cost of $9.17 ASHRAE vinyl frame, green medium performance reflective - U-1.02, SHGC-0.37- incremental cost of $9.36. (This is the single most expensive single pane window in the ASHRAE database.)
The estimated delta cost between these two windows is = $0.19. This is a very small cost difference because both these windows are fairly expensive. These transitions are reported in three clusters for the simple reason that typical sources of window cost data are not detailed enough to provide differentiation between a window that has a U-factor of 0.65 and one that has a U-factor of 0.7. Furthermore, there is quite a bit of variation within window categories. A window with a U-0.7 might be a double pane window in a fiberglass frame or a triple pane window in an aluminum frame. The generic descriptions listed above attempt to convey what type of windows are being addressed in these transitions, but the descriptions are necessarily vague. Further complicating factors is the fact that both Standard 90.1-2001 and 90.1-2004 offer envelope tradeoffs that would allow a user to substitute a somewhat lower U-factor for a somewhat higher SHGC, with the “somewhat” subject to limitations imposed by the building design and location. The bottom line on window costs is that they should be taken with a grain of salt. There are many windows that can be compliant with ASHRAE standards for particular building designs and the costs can vary significantly.