
Analysis of energy access and impact of modern energy ... · Web viewPollutants from these...
44
Analysis of energy access and impact of modern energy sources in unelectrified villages in Uttar Pradesh Philip Sandwell 1,2 *, Clementine Chambon 2,3,4 , Amit Saraogi 4 , Apolline Chabenat 5 , Marek Mazur 6 , Ned Ekins-Daukes 1,2 and Jenny Nelson 1,2 1. Department of Physics, Blackett Laboratory, Imperial College London, London SW7 2AZ, UK 2. Grantham Institute – Climate Change and the Environment, Imperial College London, London SW2 7AZ, UK 3. Department of Chemical Engineering, Imperial College London, London, SW7 2AZ, UK 4. Oorja: Empowering Rural Communities, 201 Diamond Arch, St John Baptist Road, Bandra(W), Mumbai 400050, India 5. Université Pierre et Marie Curie, Paris 75005, France 6. Ecole Centrale Paris, Grande Voie des Vignes, 922595 Châtenay- Malabry, France *Corresponding author ([email protected]) Table of Contents Analysis of energy access and impact of modern energy sources in unelectrified villages in Uttar Pradesh......1 Abstract................................................... 2 1. Introduction............................................ 2 2. Description of the study................................4 2.1 Survey procedure......................................4 2.2 Analysis of time-dependent data.......................6 3. Respondent demographics.................................7 3.1 Household size........................................7 3.2 Farmland ownership....................................9 3.3 Household income......................................9 3.4 Daily activities.....................................10 4. Energy for lighting....................................12 4.1 Lighting ownership...................................12 4.2 Lighting usage.......................................12 4.3 Effects of fixed lighting on kerosene use............14 4.4 Benefits of mitigating kerosene use..................15 5. Energy for cooking.....................................16 5.1 Stove ownership......................................16 5.2 Stove usage..........................................17
Transcript of Analysis of energy access and impact of modern energy ... · Web viewPollutants from these...

Analysis of energy access and impact of modern energy sources in unelectrified villages in Uttar Pradesh
Philip Sandwell1,2*, Clementine Chambon2,3,4, Amit Saraogi4, Apolline Chabenat5, Marek Mazur6, Ned Ekins-Daukes1,2 and Jenny Nelson1,2
1. Department of Physics, Blackett Laboratory, Imperial College London, London SW7 2AZ, UK
2. Grantham Institute – Climate Change and the Environment, Imperial College London, London SW2 7AZ, UK
3. Department of Chemical Engineering, Imperial College London, London, SW7 2AZ, UK4. Oorja: Empowering Rural Communities, 201 Diamond Arch, St John Baptist Road,
Bandra(W), Mumbai 400050, India5. Université Pierre et Marie Curie, Paris 75005, France6. Ecole Centrale Paris, Grande Voie des Vignes, 922595 Châtenay-Malabry, France*Corresponding author ([email protected])
Table of ContentsAnalysis of energy access and impact of modern energy sources in unelectrified villages in Uttar Pradesh.........................................................1
Abstract...................................................................................................................21. Introduction........................................................................................................22. Description of the study....................................................................................4
2.1 Survey procedure...........................................................................................42.2 Analysis of time-dependent data....................................................................6
3. Respondent demographics...............................................................................73.1 Household size...............................................................................................73.2 Farmland ownership.......................................................................................93.3 Household income..........................................................................................93.4 Daily activities...............................................................................................10
4. Energy for lighting...........................................................................................124.1 Lighting ownership.......................................................................................124.2 Lighting usage..............................................................................................124.3 Effects of fixed lighting on kerosene use......................................................144.4 Benefits of mitigating kerosene use.............................................................15
5. Energy for cooking...........................................................................................165.1 Stove ownership...........................................................................................165.2 Stove usage.................................................................................................175.3 Effects of owning gas stoves........................................................................195.4 Benefits of improved stove usage................................................................19
6. Access to modern energy...............................................................................216.1 Solar photovoltaics and batteries.................................................................216.2 Cell phone ownership...................................................................................216.3 Access to the electricity grid.........................................................................21
7. Village electricity demand...............................................................................227.1 Constructing an electricity demand profile...................................................227.2 Simulating the demand of a village..............................................................237.3 Monthly energy demand...............................................................................257.4 Seasonal influence and system efficacy......................................................26

8. Conclusions......................................................................................................28Acknowledgements..............................................................................................30Bibliography.........................................................................................................30
Abstract
Bringing access to modern energy sources to the poorest in society is a key goal of many policymakers, businesses and charities, but in order to be a success projects and schemes must be founded on accurate data. We undertook a survey of energy demand and usage patterns in households in unelectrified villages in Uttar Pradesh, India to assess access to and utilisation of energy sources for lighting and cooking. The times of usage were recorded and analysed and the effect on usage patterns of transitioning from traditional to modern energy sources is assessed. We quantify the cost and greenhouse gas emissions of current energy use in order to provide a benchmark of potential mitigation through the use of renewable energy technologies: a typical household with kerosene lamps only for lighting spends INR 3,243 and emits 381 kgCO2eq per year; households with modern cooking energy spend 17% more through increased usage, but emit 28% less greenhouse gases compared to those with traditional stoves only. Cell phone ownership was found to be 50% amongst adults. We use demographic and utilisation data to construct an hourly demand profile of basic electricity demand extrapolated to each month of the year, and present an example of aspirational demand assess the impact of desirable appliances. A Monte Carlo simulation is used to highlight the daily and seasonal variation in total energy and power demand. A hybrid system, with solar power and battery storage meeting daytime demand and higher-capacity diesel- or biomass-powered generation meeting the remainder during evening peaks and winter months, would satisfy demand most effectively.
1. Introduction
Access to modern energy sources is a vital step in achieving the United Nations Sustainable Development Goals, those of Sustainable Energy For All, and reducing greenhouse gas (GHG) emissions to mitigate climate change[1, 2]. Historically, India has been home to the largest population without access to electricity[3] and fuel sources such as kerosene for lighting and firewood for cooking are relied upon heavily amongst rural populations[4-7]. Whilst electrification programmes have had some successes in delivering electricity to the rural poor, they have not been without criticisms of their efficacy and with millions still without reliable access new paradigms must be considered[3, 7-12]. Amongst rural households in India the provision of electricity is considered the second most popular choice for government prioritisation after education, ranking at a similar level to access to clean water[13].
Incumbent energy technologies for lighting and cooking in rural India result in significant problems for their users. Kerosene lamps used throughout the developing world are costly, inefficient, offer poor quality lighting, present a
fire risk, produce indoor air pollution hazardous to human health and emit GHGs[7, 14-18]. Traditional stoves fueled by firewood, cattle dung, crop waste or other biomass sources are used to meet the cooking needs of hundreds of millions of Indians, particularly in remote areas[19, 20]. Pollutants from these stoves are known to cause bronchitis, heart disease, pulmonary tuberculosis and asthma[21, 22] but continue to be used despite the negative effects of their black carbon emissions being known to the people using them, who are almost exclusively women[6, 23, 24]. Furthermore, the drudgery of fuel collection for traditional stoves takes an average of one hour or more every day in India, whilst cooking times extend to an additional four[24, 25]. In spite of this, the uptake of improved cook stoves has been challenging owing to issues such as high initial cost, familiarity, awareness and utility[6, 11, 26, 27].
The factors affecting the transition from one energy technology to another range from national-level government policies to individual user preference[10] and often within a community, or even within a household, several different technologies will be in use[11, 27]. Despite this being the case, when considering the effects of introducing new technologies for lighting or cooking many studies assume a complete and permanent transition when suggesting the deployment of new technologies[28-30]. This may be the ultimate goal of many who wish to bring access to modern energy to rural communities, but the user acceptance of new technologies, amongst other technical, political and socioeconomic obstacles, should be taken into account when planning projects and drafting policies.
Successful transitions rely on the satisfaction of the end users. Key determinants include meeting the functional, economic, compatibility, convenience, social and epistemic values of users, amongst others, and through understanding these it is possible to provide long-term fulfillment[31]. Data used to inform decisions on meeting user demands is often based on national-level survey data of households and focuses in particular on income levels, which may not be the best indicator of the willingness and ability of users to use modern energy sources[11, 27]. The need for a detailed understanding of the situation of rural communities, in the context of energy access and in a way that can be utilised by researchers and policymakers, is clear[23, 27]: this is the goal of this study.
The survey used in this study provides a range of baseline socioeconomic and technical data relevant to those intending to study and improve the current energy access of rural communities in India. An emphasis was placed on the timing of daily activities and energy use. One benefit of this is to give a better understanding through a greater humanisation of the data as a reflection of the people whose needs are being surveyed. This was done also in appreciation of the time-dependent nature of many renewable energy sources that could be used to meet demand, in particular solar photovoltaics (PV) and wind power; well-designed systems rely heavily on understanding the time, as well as the amount, of electricity demand[28, 30, 32, 33].

The results of the survey are presented in the following sections. They are analysed with the aim of providing first-hand data and promoting a better understanding of a specific situation of interest to many policymakers, businesses and charitable organisations. Unless otherwise stated, the average presented for a given dataset is the mean value with standard error. Data from the survey is compared with state-level data of all of Uttar Pradesh[19] where appropriate, both to add context and also highlight the potential differences between using high level census data and specific field studies.
Section 2 of this work gives the background of the study and the region in which it was carried out. Section 3 describes the demographics of the respondents, including household sizes, land ownership, income and a breakdown of daily activities. Section 4 addresses the ownership of lighting devices, their total and times of usage, effects of owning modern lighting, and the benefits of mitigating kerosene use. Section 5 gives an analogous investigation for cooking using traditional and gas stoves. Section 6 summarises the current access to modern energy and simulates the demand of a village with access to electricity based on the survey data gathered, with conclusions drawn in Section 7.
2. Description of the study2.1 Survey procedure
The northern state of Uttar Pradesh is the most populous state in India[19]and features the largest unelectrified population in the country[3]. Within this state lies the district of Bahraich with a population of almost 3.5 million people; the vast majority of its rural inhabitants are primarily subsistence farmers with a low literacy rate of 40%[19]. The villages of rural Bahraich District rely heavily on traditional fuels such as kerosene for lighting and biomass for cooking, as summarised in Table 1 and shown in comparison to Uttar Pradesh and India.
Table 1: Primary sources of lighting and cooking fuel for households in Bahraich District (for rural areas only), Uttar Pradesh and India. Households in villages in Bahraich rely comparably more on kerosene lamps than electricity for their lighting needs, and traditional fuels such as firewood and biomass are used significantly more than the average for Uttar Pradesh and India. Data from Census of India (2011)[19].
Percentage of householdsPrimary fuel type Bahraich District Uttar Pradesh India
LightingElectricity 9.8 36.8 67.3Kerosene 89.1 61.9 31.4Solar 0.5 0.5 0.4Other oil 0.2 0.3 0.2Any other 0.2 0.3 0.2No lighting 0.1 0.2 0.5
CookingFirewood 72.8 47.7 49.0Crop residue 16.1 8.7 8.9Cow dung cake 3.7 23.1 8.0

Coal/lignite/charcoal 0.1 0.3 1.5Kerosene 0.4 0.7 2.9LPG/PNG 6.5 18.9 28.6Electricity 0.1 0.1 0.1Biogas 0.1 0.2 0.4Other - 0.1 0.5No cooking 0.2 0.2 0.3
Rural villages in Bahraich District without existing connections to grid infrastructure were chosen as the survey locations. Several villages were chosen by a local guide, who previously worked as a government administrator for the region, as reflective sample of unelectrified villages in the district. Upon arrival at a site, the village council suggested households for interview that would be representative of the situation of the community as a whole. The survey was originally written in English and professionally translated into Hindi, and the survey was undertaken in May 2015. Interviews were conducted in the household of the respondent in Hindi through the use of an interpreter, who relayed information to the relevant authors present to record in English. The details and purpose of the study were explained and written consent was collected from the respondents (or a family member on their behalf if the respondent was illiterate) and the respondent was free to choose not to answer any question.
Where possible, women were interviewed to give a more accurate representation of energy use in the household[23, 34, 35]. Interviews typically lasted 20 to 40 minutes and in total 51 households were surveyed, representing a total population of 553 people. Where relevant, questions pertaining to times daily activities or usage of energy sources were phrased to relate to the previous day, and questions about income and expenditure were directed to the most recent occurrence. This helped ensure a more accurate response specific to a day or event, rather than an estimate of general practice.
The sample surveyed reflects the situation of rural households without the opportunity to connect to an electricity grid, who remain reliant primarily on traditional sources of energy for lighting and cooking. Questions were generally closed and quantifiable, but with the option to elaborate if necessary. The survey was divided into several sections: the first addressed demographic information such as the number of family members in the household, their ages, occupations and levels of education, total income and expenditure, number of rooms, home and land ownership, size of land farmed and number of animals. The next section addressed the respondent’s daily activities, broken down by the hour of the day. Information about the ownership of various lighting and cooking devices was taken, in addition to other devices such as cell phones. The hours of the day that these were used were also recorded for each device. Finally, the cost of energy sources and the distance required to acquire them was obtained.
The majority of respondents were comfortable to answer all of the questions, and when an answer was not known, an estimate was given and recorded as such. Gender biases became apparent, for example men not knowing in detail

about cooking practices and women being unsure of expenditure on farming inputs, but in general responses were provided with confidence. Upon analysis unreliable data, for example significant differences between reported income and expenditure or a mismatch between device usage and corresponding fuel usage, was omitted from further examination to not skew the results. No question had more than 5% of responses omitted.
2.2 Analysis of time-dependent data
One of the foci of this study is to highlight energy usage as a time-dependent phenomenon: this allows an additional degree of information over an estimate of total daily usage and gives the opportunity to build temporal profiles of energy usage, and potential demand for service, by aggregating survey responses to build an average survey profile.
Consider an energy source or device (for example a lamp or stove) of type D present in a household h, which contains a number N D
h devices of this type each with an index i. At any time of the day t (segregated into 24 equal segments) each device Di
h is given the value 1 if it is in use or 0 if it is not, i.e.
Dih(t )={ 1 ,∧Device∈use
0 ,∧Device not∈use
In each household h, the total number of devices of type D in use at any time is N D
h (t )∈[0 ,i ]. For a sample of H households, we can define the total number of devices in use at any time N D
H (t) as
N DH (t )=∑
h
H
N Dh (t )=∑
h
H
∑i=0
N Dh
Dih( t)
which will be fraction of the total, given by
N DMax=∑
h
H
NDh
The total number of devices in use at any time, N DH (t ), is useful when
considering the total demand of a village or community and the requirements of infrastructure to meet those demands, for example with a minigrid system. Similarly the number of devices used by an average household, N D
H (t), is useful for considering the household allowance from an energy system. Furthermore when summed over a day it can be used to calculate the impact of energy sources on a household or per capita basis, such as in Sections 4.3, 4.4, 5.3 and 5.4 where the impact is considered annually. This total number of device-hours in an average household, T D
H , is given by
T DH= 1H∑
t=1
24
N DH (t )

The requirements of an arbitrary number of households can be considered by using the utilisation U D
H ( t ) of a type of device, the probability that it is in use, given by
U DH (t )=
N DH (t )NDMax ∈[0,1]
Examples of N DH (t) and U D
H (t ) constructed from survey data are given in Sections 4.2 and 5.2. Finally, by considering the time-dependent probability distribution U D
H (t ) it is possible to consider the total demand of a community of any size as a statistical function[36], for example in Section 6.5.
Owing to the large number of devices considered in this survey the mathematical standard error around each value of U D
H ( t ) is small (less than 5%), but appropriate caution should be taken when interpreting the values. In the case of lamps, for example, the error around day- and night-time values is likely to be very small as the times of usage are well known, but around dusk and dawn the utilisation may have a larger error as the exact time of switching the lamp on or off was not certain. The authors suggest an absolute error of 10% around U D
H (t ) be considered for twilight periods, representing 10% of respondents misattributing the times of device usage by ± 1 hour.
3. Respondent demographics3.1 Household size
Questions about the household, family members and land ownership were asked, not only to gather important demographic data, but also to serve as an introduction to the survey using questions the respondent was most comfortable to answer.
The size of the dwelling was quantified by its number of rooms. Dwellings could be made from any material, but were generally composed of brick (either fired or unfired), concrete, mud or wood. These were often roofed with thatch, brick or concrete and most had mud or cement floors. Figure 1a) shows a cumulative distribution function (CDF) of the number of rooms in a dwelling, and a comparison with all of Uttar Pradesh. With an average of 3.2 ± 0.3 rooms per dwelling those surveyed in Bahraich District were generally larger than the average for the state, possibly as a result a greater number of occupants and more available space in comparison to urban areas.
The occupancy of the household was considered to be the number of people who use the dwelling as their primary residence, and the average occupancy was found to be 10.8 ± 0.9 people per household. A CDF of total occupants per room of the household is shown in Figure 1b). The majority of households featured several married couples, and often their parents, living under one roof in addition to their children. Despite the dwelling size in Bahraich District being larger than the rest of Uttar Pradesh, the average number of household

occupants per room was found to be 4.2 ± 0.4, far greater than the state-wide average of 2.4 occupants per room which can be estimated from census data[19]. The number of occupants per room is loosely negatively correlated with the number of rooms in the dwelling. [19]
Figure 1: a) Cumulative distribution function of rooms in a dwelling, b) Cumulative distribution function of household occupants per room[19], c) Cumulative distribution function of area of farmland owned by each household (blue solid line). Data for Uttar Pradesh is shown as a comparison over the available range of data (black dashed line)[19, 37]. d) Monthly income per adult (INR 1510 ± 215) and per person (INR 860 ± 125). The red dot-dashed line represents the World Bank definition of poverty, $1.25 per day[38], whilst the black dashed line represents that of the Indian government for rural areas, INR 32 per day[39].
3.2 Farmland ownership
Almost all of the households surveyed rely on subsistence agriculture as their main occupation. Only 4% of respondents neither owned nor used farmland, with 91% both owning and farming their land. There are two growing seasons for the most common crops in the region: kharif (July – October) for rice and maize and rabi (October – March) for wheat. Cash crops such as vegetables and pulses are grown during inter-season periods.
The primary unit of area in the region is the bigha, with 6.2 bighas equal to one hectare by the local definition. Respondents were asked about the amount of land they farmed and a CDF of the responses are plotted in Figure 1c). The average size of farmland being used by households is reported to be 17.3 ± 3.4 bighas, which equates to 2.0 ± 0.4 per person in the household. Land holdings in Bahraich District are comparatively larger than those found elsewhere in Uttar Pradesh[37]. This is likely as a result of two factors: the

remoteness of the villages providing a greater area to farm for a smaller population, and households aggregating larger land holdings to support greater numbers of people.
In addition to crops, 91% of household also kept livestock as a source of labour or milk but rarely for meat, a reflection of the Hindu-majority religious makeup of the area. The most common were buffalo, cows and goats with a small number owning bulls and sheep. A breakdown of livestock ownership by animal type is shown in Table 2.
Table 2: Livestock ownership of households by animal species. With 79% of households owning one or more, buffalo were the most commonly owned species, followed by the cow.
Percentage of householdsNumber of animals owned Buffalo Cow Goat Bull Sheep
0 20.9 72.1 83.7 93.0 97.71 44.2 20.9 7.0 - -2 18.6 2.3 2.3 7.0 -3 7.0 4.7 2.3 - -4 4.7 - 2.3 - -5 - - 2.3 - -
More than 5 4.7 - - - 2.3
3.3 Household income
Respondents were asked to estimate their monthly household income. In the vast majority of cases the income was seasonal, a reflection of the main occupations as subsistence farmers or day labourers. Some respondents were less forthcoming with financial details, either from declining to answer or from not knowing their total income, and where possible and appropriate incomes were calculated based on agricultural yields that were given and market prices. Box plots of income per adult and per person (that is, including children) are shown in Figure 1d).
The average household monthly income was reported to be INR 7,900 ± 1670, with the average incomes per adult and per person being INR 1510 ± 215 and INR 860 ± 125 respectively. The international income poverty line of $1.90 per day used by World Bank gives a figure of 21.3% of the population of India as living in poverty[38]; the results of this work estimate that all but the very wealthiest of the surveyed respondents are living below this threshold. For the Indian Government figure of INR per day for rural areas[39], 66% of households are living below this definition of the poverty line. In comparison, the percentage of the rural population of Uttar Pradesh living below the poverty line is 30.4%[40].
Owing to the seasonal or unpredictable nature of their income, many respondents reported having no disposable income and experienced difficulties in saving money. In many cases, once expenditure on food,

healthcare and agricultural inputs had been taken into account, any remaining income would be spent on clothing, religious festivals or other nonessentials.
3.4 Daily activities
An understanding of the daily activities of rural communities can help inform meeting their everyday needs and requirements. To address this, the respondents were asked about the way in which they themselves spent the day prior to the interview and the times at which they had done each activity. The responses were divided into the following categories: sleeping, working (of any kind), cooking and eating, reading and studying, socialising, travelling, or any other activity. Figure 2 shows the proportion of respondents participating in each activity during each hour of the day; in the case that two or more activities were performed in an hour interval, that with the majority or plurality of time spent was recorded.
Figure 2: The daily activities of the respondents. Black dashed lines represent approximate times of sunrise and sunset. Basic activities such as sleeping, working, and food preparation and consumption fill almost 90% of the respondents’ time, with little remaining for other activities.
Around eight hours of the day is spent sleeping and a similar amount is spent working, either in farming activities or around the home. The next most common activity is cooking and eating, with the majority of the time devoted to the former which is time-consuming when performed on traditional biomass stoves (to be discussed further later). On average, respondents reported spending 4.5 hours per day on food preparation and consumption, not including time spent gathering fuel. Two distinct peaks in times spent cooking correspond to troughs in working times; this suggests a competition between the two activities, suggesting that if cooking times were decreased, more time could be dedicated to productive activities, or others.

Respondents reported less than 10% of their time was devoted solely to social activities, either amongst their family or friends, and even less time was spent reading or pursuing similar interests. Several respondents, however, mentioned their children studying for school and mentioned this as a priority for their wellbeing.
One of the major benefits of modern energy access as being freedom to choose when to do certain activities[31, 34]; not being limited to the hours of daylight to work and study or reduced cooking times, for example. Figure 2 clearly shows the reliance on daylight for productive work, and cooking times affecting the ability to do other activities. Addressing these would have a tangible impact on the lives of people in rural communities.
4. Energy for lighting4.1 Lighting ownership
Respondents were asked the types of lamps and number used in each household to assess the current lighting situation. These were divided into three main categories: kerosene lamps, which were almost exclusively wick lamps; fixed lights, which were defined to be any kind of electric light permanently affixed to wall or ceiling; and torches, handheld electric lamps powered by batteries. Solar lamps, integrated units consisting of a PV panel, battery and light, were considered but the ownership was found to be negligibly small, whilst households often owned candles but used them only rarely when other lighting sources were unavailable. Table 3 gives a summary of the number of lamps owned by each household.
Table 3: Ownership of lighting devices. Most households rely on kerosene as their main source of lighting.
Percentage of householdsNumber of lamps owned Kerosene Fixed Torch
0 13.7 80.4 35.31 13.7 2.0 33.32 21.6 7.8 19.63 17.6 2.0 7.84 15.7 - 2.05 7.8 2.0 2.0
More than 5 9.8 5.9 -
Over 80% of households rely on kerosene lamps primarily for their lighting needs. Households dependent on kerosene owned an average of 3.4 ± 0.3 kerosene lamps, the number of which loosely correlates with the number of rooms in a household (1.3 ± 0.1 lamps per room), reflecting the need for many lamps to light one room owing to their low luminosity[7, 17]. This could also be

caused by the running costs of the lamps, with household income influencing expenditure on kerosene and limiting the use of the lamps.
Fixed lights were commonly LED bulbs connected to a battery and PV panel. In households with fixed lights, there was found to be an average of 0.9 ± 0.1 lamps per room, suggesting that unlike in the case of kerosene lamps, one electric light was sufficiently bright to meet the needs of the user. Torches were rarely used for the lighting of rooms; instead they were used for travelling around the village at night or for tending to livestock as necessary. Of households with torches, most shared one or two between the family members.
4.2 Lighting usage
When sizing electricity systems the time of use is particularly important as this impacts the maximum load the system must accommodate, as well as the total demand required to be met. The time at which the respondents used each lamp was recorded and is plotted in Figure 3. Lighting use is quantified here in two ways: the first is the average number of lamps being used in a household at any given time; the second is the utilisation of lamps, defined to be the probability that it is being used at that time.
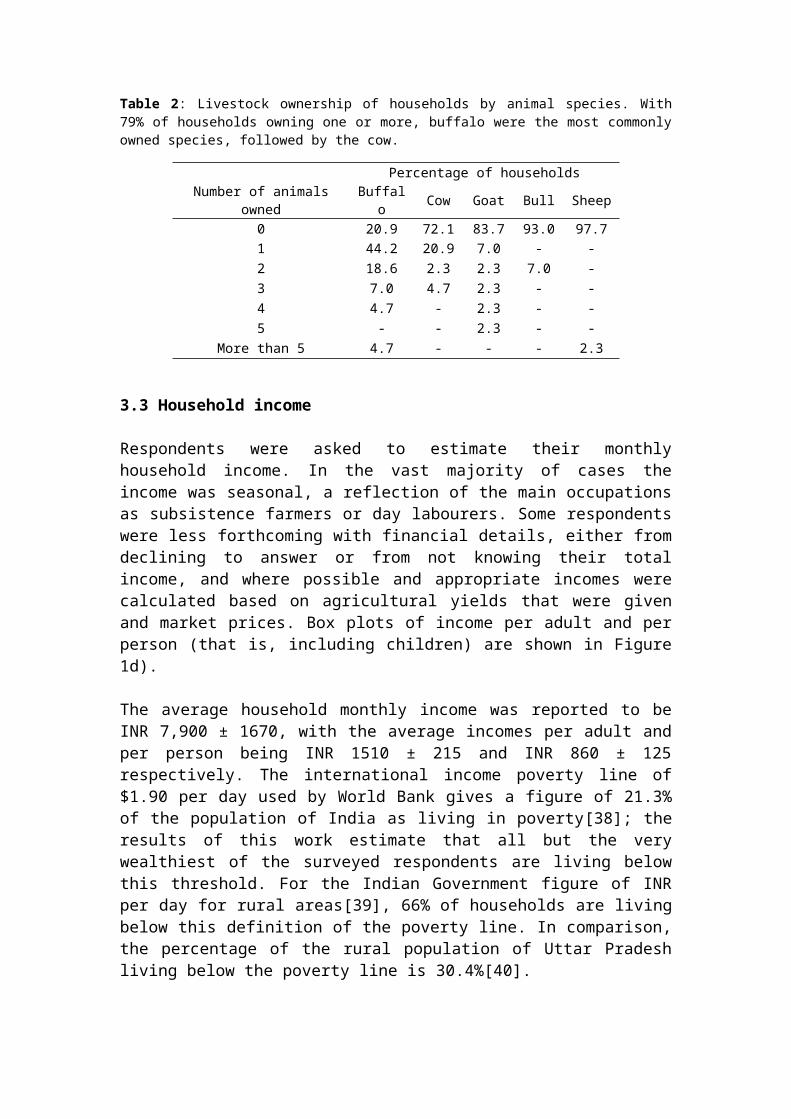
Figure 3: a) Number of lamps being used per household and b) utilisation of lamps over the day. Lighting needs peak during the evening and in the morning, with some lamps remaining on throughout the night. c) Boxplots of the number of hours per day that each type of lamp is used. Fixed lights are used significantly longer per day than kerosene lamps, likely as a result of the running costs of the latter.
Figure 3 highlights the need to know when lamps are being used. At the peak time of 19.00-20.00 almost every kerosene lamp is being utilised, but a sharp drop-off is seen before and after. Respondents stated a desire to keep at least one lamp lit in each room during hours of darkness when they were awake, and around one in four kerosene lamps remain in use during the night for either security, the comfort of children, or for cultural reasons.
Fixed lights feature less predominantly in Figure 3a) owing to fewer households owning them, but the difference in use between fixed and kerosene lights is clearer in Figure 3b). As with kerosene lamps, fixed lights see a peak of utilisation between 19.00-20.00, but this continues for longer and remains high until 23.00. Furthermore a greater proportion of lamps (39%) remain in use during the night, and a second peak is seen in the morning at 5.00; in total, the average utilisation of fixed lights is 30% greater than that of kerosene lamps. This is also shown in Figure 3c), with fixed lights being used for far longer per day on average compared to kerosene.
This could be a result of the lack of incentive to limit fixed light usage: unlike for kerosene, the running cost of fixed lights is close to zero and, assuming the battery of the system is large enough to accommodate it, therefore there is no penalty for using the lamps throughout the night. This would represent a transition in the way rural households use energy, and would have an impact on the sizing of off-grid energy systems.
Torch usage is independent of the lighting of rooms, but is still an important requirement for rural households. Small peaks are seen in the morning and evening as torches are used for travel around the village and to tend to livestock. Most torches are used for only a few hours, as shown in Figure 3c). The torches at present are powered by batteries and as a result would not draw power from a hypothetical off-grid electricity system, but could potentially use rechargeable batteries and hence have an impact on the overall demand profile. Furthermore, reliance upon torches could be reduced if an off-grid electricity system provided lighting for paths and community areas.
4.3 Effects of fixed lighting on kerosene use
With a subset of the sample using both fixed lights and kerosene it is possible to infer the effects of transitioning to modern forms of lighting. It is the goal of many organisations to replace kerosene lamps entirely in favour of electric lights, but despite having access to another form of lighting, kerosene usage was not significantly reduced in these households, as shown in Table 4.

Table 4: Kerosene usage in households with and without fixed lights. Whilst the average number of kerosene lamps is reduced for those with fixed lights, the total amount of kerosene used is not.
Household typeKerosene only With fixed lights
Kerosene lamps per household 3.4 ± 0.3 1.3 ± 0.4Average kerosene lamp usage (hours/day) 5.3 ± 0.5 7.3 ± 1.4
Total kerosene lamp usage (hours/day) 19.0 ± 2.6 19.3 ± 3.6
Despite having access to modern lighting, and a reduced ownership of kerosene lamps, households with fixed lights do not show a significant decrease in kerosene consumption; on the contrary, an increase is observed. As can be inferred from the larger error on the value, some households reduced their kerosene lamp usage to zero but others treated these lamps in the same way as their fixed lights, leaving them on for longer periods of time.
This could represent a division of attitude towards modern lighting. Some households see it as a way of reducing expenditure: once their lighting needs are met by electricity, they can save money by not purchasing kerosene. Others might see it another way: once the initial cost of buying an electric lighting has been met, leftover income can still be spent on kerosene even if it is not required to meet their basic needs, perhaps through habit. They subsequently treat all of their lighting in the same way and use kerosene lamps at the same time as the fixed lights, with little difference in fuel usage before and after the fixed lights were installed. This is an example of the rebound effect: the former case is a partial rebound, where the benefit of a new technology offsets the use of the incumbent and has a net positive effect; the latter, however, is a case of the new technology backfiring and failing to mitigate the negative aspects which it aims to replace[41]. This issue could be better addressed through improved education on the benefits of lighting, or better design and sizing if the fixed light system was not sufficient to meet the household needs.
4.4 Benefits of mitigating kerosene use
Many respondents were aware of the drawbacks of using kerosene lighting and expressed a desire to own electric lights owing to their increased brightness, convenience and modernity. Aside from the negative health effects of using kerosene lamps, tangible savings can be made both economically and environmentally by replacing them with cleaner alternatives. Respondents were asked how much kerosene they purchased per month and the price they paid for it. On average, households used 6.1 ± 0.8 litres of kerosene per month, and spent INR 211 ± 31. A local government subsidy is applied to the first two litres of kerosene bought, at a price of INR per litre, with a cost of around INR per litre thereafter.
By using the results of Mahapatra et al. (2009)[17] we assess the impact of using kerosene lighting. Demographic and usage data from this survey was combined with data from the previous study to calculate the cost and GHG emissions of an “average” household using only kerosene lamps for lighting, with the results summarised in Table 5. A kerosene lamp is assumed to have

a lifetime of five years and the discount rate used is 10%[17]. Reported prevailing prices are used in this analysis to reflect the current situation in Bahraich District; as varying subsidies throughout India distort the true cost of fuel, caution should be used in extrapolating the figures to other regions.
Table 5: The cost and GHG emissions associated with kerosene lamps for an average household from our sample with no other source of lighting. The cost of kerosene lighting for one household is INR 3,243 per year, with GHG emissions of 381.1 kgCO2eq. Comparative data from Mahapatra et al. (2009)[17]; a: Negligible during use, b: biomass input from renewable source i.e. not leading to deforestation.
Household informationOccupants 10.6Kerosene lamps 3.4Total lamp usage (hours/day) 19.0Monthly kerosene expenditure (INR) 211
Lamp informationEfficiency (ml/hour) 21.6 [17]Luminosity (k-lumens) 0.076 [17]Lifetime cost (INR/lamp) 4,769
Impact of kerosene lamps Cost (INR) GHG (kgCO2eq)Per lamp per day 2.5 0.3Per household per year 3,243 381.1Per capita per year 300.3 35.3Per hour of light 0.48 0.055 [17]Per k-lumen-hour 6.5 0.72
PV electricity (representative)[17]Per k-lumen-hour 1.5 - a
Biomass gasifier-based electricity (representative)[17]
Per k-lumen-hour 0.26 7x10⁻⁵ b
It is found that an average household relying on kerosene lamps alone for its lighting needs spends INR 3,243 per year, emitting 381.1 kgCO2eq in the process. At INR 6.5 per k-lumen-hour, the cost of useful energy for kerosene lamps is found to be over three times greater than other domestic lighting systems powered by solar PV or biogas[17].
The reliance upon kerosene is a difficult trap to escape: modern sources of lighting are cheaper and more effective but rely on an up-front cost [17] which many respondents stressed that they could not overcome owing to the lack of disposable income or ability to save. This highlights the need for accessible and effective financing schemes for rural communities, who have been found in a previous study to support replacing the existing government kerosene subsidy in favour of modern electricity for lighting: 51% of households would support the cost to contribute to subsidising microgrids instead, whilst 90% would support the subsidy going towards solar lanterns[13].
In Bahraich District, 490,215 households in rural areas rely on kerosene as their main source of lighting[19], with emissions potentially exceeding 186 thousand tonnes of CO2eq annually from lighting alone, a figure greater than the national emissions from all sources of at least ten different countries[42]. Using renewable energy technology could significantly lower this, but as the previous section showed there is also a need to reduce kerosene usage after

electric lighting has been installed. This could be met through more effective communication and education of the benefits of electric lighting in comparison to kerosene lamps, or through improving the design of home lighting systems to allow for cultural needs to be met.
5. Energy for cooking5.1 Stove ownership
Respondents were asked the number of cooking stoves they owned. These were divided into two types: traditional stoves powered by firewood, cattle dung or other available biomass, and more modern stoves powered by liquefied petroleum gas (LPG). For the former, no distinction was made between the types of traditional fuel used as respondents stated they would use whatever fuel was available, but stated a preference for firewood. Gas stoves were powered from a canister. A summary of stove ownership is given in Table 6.
Table 6: Ownership of cooking stoves. Most households rely on traditional biomass stoves for their cooking needs.
Percentage of householdsNumber of stoves owned Traditional Gas Total
0 3.9 58.8 -1 72.5 35.3 43.12 15.7 3.9 43.13 5.9 2.0 9.8
More than 3 2.0 - 3.9
Most households had either one or two stoves of either type on which to cook, and the majority relies on traditional biomass stoves to meet their needs for cooking. Respondents with both gas and traditional stoves expressed a preference for the former owing to its utility and efficiency. Those without expressed a desire to own a gas stove, but the need to cook traditional chapati bread on a traditional stove was highlighted several times, as was described previously by Rouse (2002)[23]. The same author also identified the desire of those cooking, almost exclusively women, to use two stoves at once to reduce cooking times, as meals generally consist of more than one dish. Despite this, a significant minority of households had access to only one stove.
5.2 Stove usage
Respondents were asked the times at which stoves were used and the results, in terms of both the average number in use and the utilisation, are plotted in Figure 4.
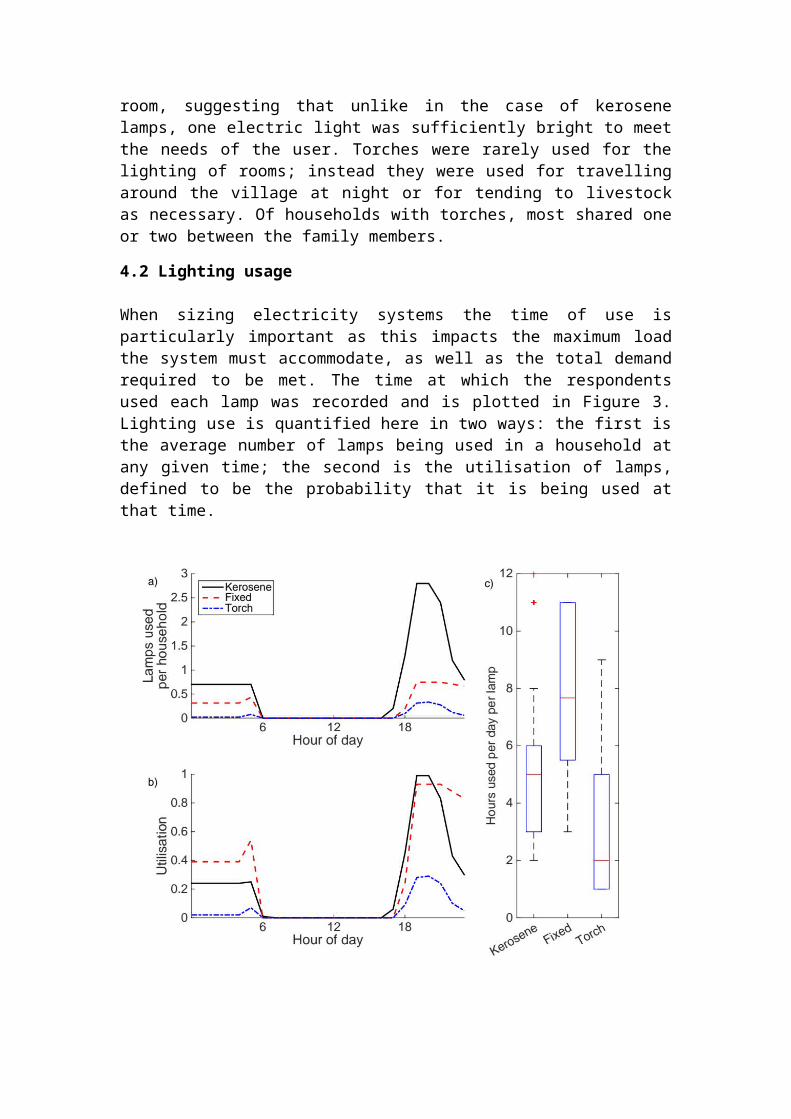
Figure 4: a) Number of stoves being used per household and b) utilisation of stoves over the day. Two distinct peaks represent the main cooking times during the morning and evening, with gas stoves being used less during the latter. c) Boxplots of the number of hours per day that each type of stove is used. Gas stoves are used for more hours per day (4.1 ± 0.6) than traditional stoves (3.5 ± 0.4), likely a reflection of respondents having a preference for the utility of gas.
The greater number of traditional stoves is reflected in the Figure 4a), with far more households relying on them for all or part of their cooking requirements. The efficiency of gas stoves over their traditional counterparts is highlighted in Figure 4b); gas stoves are utilised in the morning, when respondents are leaving for their work, and at later times when used in the evening. Many respondents cited gas stoves as giving them more freedom in when they chose to cook, especially in the morning. The use of traditional stoves was still very prevalent for cooking chapatis, as mentioned above, and also to save money on buying LPG fuel in favour of traditional fuels that could be collected for free.
Each gas stove was used for 4.1 ± 0.6 hours per day on average, compared with 3.5 ± 0.4 hours per day for traditional stoves. This is likely a result of households preferring to use gas stoves ahead of traditional stoves, with households owning both choosing to use gas as their primary cooking fuel. This is explored further in the following section.

5.3 Effects of owning gas stoves
Similarly to the assessment of modern lighting on kerosene use, the effect of owning gas stoves on the use of traditional stoves is also investigated. The differences in ownership and use are shown in Table 7. Households with access to gas stoves used them for over one hour per day longer than they used their traditional stoves. When comparing only the use of traditional stoves, access to gas reduced the use of traditional stoves by 21%.
Table 7: Stove ownership and usage in households with traditional stoves only, and those with gas stoves. In households with access to gas the use of traditional stoves is still prevalent.
Household typeTraditional stove only With gas stove(s)
Traditional GasNumber of stoves 1.5 ± 0.2 1.1 ± 0.1 1.2 ± 0.1
Total stove usage time (hours) 6.6 ± 1.3 3.6 ± 0.9 5.0 ± 0.8Average cooking time per stove (hours) 3.8 ± 0.4 3.0 ± 0.6 4.1 ± 0.6
Despite having access to gas for cooking, and using it preferentially, cooking with traditional stoves was still prevalent. Whilst some households reduced their traditional stove usage to zero, others would use gas stoves in conjunction, rather than in lieu, of traditional methods. This could be a result of wanting to use two cooking surfaces rather than one to make the task easier or faster, or another instance of the benefits of the newer technology not being sufficiently understood or valued in order to replace the older one. An additional factor could be that longer-burning nature of traditional fuels artificially inflates the recorded usage for this type of stove: after the stove is used any remaining fuel may be burned as it has already been invested during the current cooking session, rather than immediately extinguishing it.
5.4 Benefits of improved stove usage
In addition to the health benefits associated with using improved cookstoves, there are also economic and environmental incentives to users moving away from traditional fuels in favour of LPG. Table 8 shows a breakdown of two average households, one with access to traditional stoves only and the other with access to gas stoves. Costs are amortised over five years at a discount rate of 10%, with a maintenance cost of 5% per annum. For the purposes of this comparison, despite many respondents collecting their own firewood for free from the local area, a reported market price of INR 6 per kg is used to represent the cost of time and labour, mostly of women, which is often not accounted for[23]. As with kerosene, LPG is subject to varying subsidies and the market price of INR 30 per kg[43] is used in this analysis to represent the cost experienced by communities in Bahraich District. Caution should be used in extrapolating the figures for different levels of subsidy and fluctuating fuel prices.

Table 8: The cost and GHG emissions associated with traditional and gas stoves for an average household of 10.6 occupants. Houses with traditional fuels only have a lower expenditure than those with access to gas, but have greater GHG emissions.
Stove information Traditional GasInitial cost (INR) 25[4] 4800[44]Fuel cost (INR/kg) 6 30[43]Burn rate (kg/hour)[45] 1.4 0.15GHG emissions (kgCO2eq) [46] [47]
Per kg fuel 1.4 3.6Per hour of use 2.0 0.5
Household typeHousehold stove usage (hours/day) Traditional stove only With gas stove
Traditional 6.6 3.6Gas - 5.0
Cost (INR)Per hour of stove use 7.3 6.6Per household per day 48.3 56.6Per household per year 17,665 20,648Per capita per year 1,666 1,948
GHG (kgCO2eq)Per hour of stove use 2.0 0.9Per household per day 13.2 9.5Per household per year 4,812 3,460Per capita per year 454.0 326.5
Households with gas stoves spend 17% more on meeting their cooking needs than those with traditional fuels only, due to the increased stove usage of both kinds and in spite of the lower cost of gas stoves per hour of use. This is strongly dependent on the cost associated with fuel wood: for a traditional fuel cost of INR 8 per kg the two households reach parity, highlighting the need for accurate accountability of the true cost of collecting traditional fuels, even if they are not purchased. As with the comparison between kerosene and electric lights, the fact that a household has access to a stove with lower running costs does not necessarily lower their expenditure on fuels.
The amount of GHGs emitted during cooking on traditional stoves is four times greater than those for gas stoves. When considering all cooking, the GHG emissions per capita are 28% lower for households with gas stoves compared to only their traditional counterparts. Despite only a partial transition, there is a significant GHG mitigation potential that could be reached from households receiving greater access to gas stoves. In order to achieve this, financing methods need to be put in place to overcome the significant initial costs of purchasing a gas stove, which is greater than the average monthly adult income found in this study. Furthermore, advice should be given to users to encourage the reduction in use of traditional stoves as much as possible to save money, lower GHG emissions and reduce smoke-related illnesses.

6. Access to modern energy6.1 Solar photovoltaics and batteries
With no access to the grid, some households turned to PV panels and batteries for their electricity needs: 18% of households surveyed owned both, whilst an additional 6% had a PV panel only and 4% a battery only. These were used to power fixed lights, charge cell phones, or a combination of the two. Few households owned fans, and fewer still owned televisions.
The PV panels in use were generally of two sizes, with capacities of between around 75 W and 150 W, and were reported to cost between INR 2,500 and INR 12,500. The cost of a battery was given to be around INR 5,500, guaranteed for between three and five years, and serviced at a cost of INR per year. Those who had owned batteries for several years did not report any degradation significant enough to impact their daily usage of electricity, for example inadequate levels of charge for use of fixed lights during the night, but some highlighted voltage deficiencies which made using lights and fans simultaneously impossible.
6.2 Cell phone ownership
Cell phones were relied on extensively in Bahraich District both for communication and a source of information. Over 90% of households owned at least one cell phone, with an average of 0.5 ± 0.1 phones per adult, reflective of one being shared between a married couple. The distribution of cell phone ownership per household is shown in Table 9.
Table 9: Distribution of cell phone ownership amongst households. The average number of cell phones per household was 2.2 ± 0.2, with 0.5 ± 0.1 per adult.
Number of cell phones owned Percentage of households0 6.51 34.82 28.33 10.94 8.75 8.7
More than 5 2.2
Charging cell phones was stated as a high priority for respondents. Those with PV panels and batteries were able to charge them within their household, whilst others would rely on either friends or relatives with access to electricity or on charging stations at the local market. The majority of phones took between two and three hours to charge and required charging between two and three times per week. The local rate for a single charge was 5 INR.
6.3 Access to the electricity grid
Despite not having access to the electricity grid, some respondents had friends and relatives living elsewhere with an electricity connection. Opinions of the grid were mixed: whilst the modernity and convenience of grid access was admired, the fact that the grid was unreliable was seen as a major

drawback. Anecdotal reports of around eight hours of electricity per day were provided, but at random and with no warning of blackouts. A previous study found similar results, with 95% of households with a grid connection having less than three hours of electricity during the evening and the most frequently cited complaints being the duration and reliability of service[13]. Several respondents stated they were willing to pay higher electricity prices for a reliable service, even for fewer hours of access per day, which could represent a better overall value for money of the service. This could be an attractive and exploitable selling point for off-grid systems that could deliver power reliable electricity with a reduced constraint on cost.
7. Village electricity demand7.1 Constructing an electricity demand profile
A demand profile is a key requirement in sizing off-grid electricity systems correctly, particularly those that rely on renewable resources whose generation is dictated by the time of day and year. By using data gathered in this study, namely the daily activities of respondents, the utilization of fixed lights, and demographic household information, here we illustrate a method of constructing a demand profile to estimate the electrical load throughout the year in a theoretical village in Bahraich District. This can be used as a proxy for the actual load of a rural community as reliable field data of this kind is scarce.
Figure 3b) shows four distinct periods of fixed light usage: pre-dawn, when some lights are left on overnight; morning peak, when households wake up and use lights before the sun is up; daytime, when lights are not used; and evenings, when people are awake and usage peaks before sleeping. As described in Section 2.2, the utilisation of the lights can be interpreted as a probability that a light will be on which depends on the associated period of the day: early morning darkness, pre-sunrise twilight, daytime (between sunrise and sunset), post-sunset twilight, and evening darkness. By knowing the times of sunrise, sunset and twilight for the time of year when the surveys were completed, and hence the makeup of each hour period in terms of the external lighting conditions, the probability of a light being on given the lighting conditions was calculated. We assume that the morning peak is connected directly to the times of sunrise (that is, households wake up at a time dictated by sunrise as shown in Figure 2) and utilisation in the evening is dictated by sunset and when households go to sleep, which is assumed to be constant. From this the demand profiles for each month can be extrapolated based on sunrise and sunset times, building a complete lighting demand profile for the year.
A similar process was used to calculate the electricity demand from cell phone charging. The number of waking hours of a cell phone user was inferred from the data shown in Figure 2 and time of sunrise, with the time at which respondents wake up being well described by a normal distribution. The probability that a phone would begin to be charged in a given hour was

extrapolated from the probability that a user was awake, with a uniform distribution across all waking hours, with the total probability for each day summing to 2/7, representing the reported two charges necessary per week. From this, the probability of a phone being charged in a given hour of the day was taken to be the sum of the probability for that hour plus the two preceding hours, to take into account the required three hours of charging. In addition, three hours of standby charging were included at a reduced load to represent users leaving their phones connected to an electricity supply whilst fully charged, as a small load is still drawn despite a full battery. More than three hours of standby charging was included when the phone became fully charged overnight, but the user was asleep and not able to disconnect it.
7.2 Simulating the demand of a village
Data from the surveys was used as a basis to model a theoretical village using a Monte Carlo simulation using a method described by Boait et al. (2015)[36]. To assess the total electricity demand at a given time the number of lights in use and cell phones being charged must be known. This was calculated on an hourly basis using a random number generator governed by a binomial distribution: the month-specific demand profiles described in the previous section provided the probability of a device being on, and a total number of devices in the village was calculated using an average of 4.1 fixed lights and 2.2 cell phones per household derived from respondent data. To give an indication of the resulting power demand, fixed lights were assumed to be high-efficiency LEDs with a power of 3 W, with phone charging demanding 5 W when charging and drawing 1 W during standby. This forms a “basic” demand profile of the minimum requirements of a newly electrified village[48].
We also consider a profile of “aspirational” loads, formed of non-essential but desirable devices such as televisions, radios, fans and refrigerators, to compare the basic demand with the needs of a community with greater access to modern appliances. We assume average ownership and usage of devices in line with census statistics[19] and previous studies[32] and the use of high-efficiency devices to minimise overall electricity demand[49, 50]. Utilisation profiles for televisions and radios were assumed to be greatest in the evening when the lowest proportion of people reported to be working, with modest usage during the day. In summertime, fans were assumed to be used mainly during the daytime with a minority used throughout the night. Fridges were assumed to have a constant utilisation owing to their running cycle. Data used for both profiles is shown in Table 10, and Figure 5 shows the impact of seasonal and daily variance in device usage on the average cumulative household power demand.
The daily demand of a village of 100 households was simulated 10,000 times for each month of the year for both the basic demand and the additional aspirational demand.

Table 10: Data used for basic and aspirational village demand profiles. Data from this work is used to build the basic profile for lighting and phone charging. Ownership and usage of aspirational devices are inferred from Census of India[19] and Sen and Bhattacharyya (2014)[32]. Seasonal variation: *highest usage in winter, ** highest usage in summer.
Village demandAverage
ownership per household
Power rating (W)
Average daily usage per device (hours)
Average household energy demand (Wh/day)
BasicLED lights 4.1 3[49] 7.0-9.0* 86-111Cell phone (charging) 2.2 5 0.9 10
Cell phone (standby) 2.2 1 0.9 2
AspirationalTelevision 0.1[19] 10[50] 2[32] 2Radio 0.3[19] 5[32, 50] 3-4*[32] 9-12Fan 1.0[32] 10[32, 50] 0-9**[32] 0-135Refrigerator 0.05 45[49] 16-20**[32] 36-45
Figure 5: Average daily household power demand by device for a) June and b) December, c) The proportion of average energy demanded by basic and aspirational loads for June (total 289 Wh/day) and December (total 173 Wh/day).
7.3 Monthly energy demand
Boxplots of the total daily electricity demand for both profiles for each month are shown in Figure 6 a), with the cumulative probability of instantaneous power demanded is shown in Figure 6 b) and c), in addition to the capacity factor a generator at a given power output would obtain.

Figure 6: a) The daily electricity demand of the community for basic demand (blue, bottom) and additional aspirational demand (red, top) by month. For b) basic demand and c) additional aspirational demand in June (red) and December (blue): the cumulative probability of power being demanded (solid lines), also interpretable as the proportion of time a power source of a given size will meet demand; the capacity factor of a power source of a given size (dashed lines). NB: Different horizontal scales are used in b) and c) for clarity.
The basic daily electricity demand of the village shown in Figure 6 a) varies throughout the year, with the winter months experiencing higher demand from lighting owing to longer periods of darkness. This has a significant impact if the demand were to be met by a system powered by PV and battery storage: with the majority of the demand being required at night, a storage system optimised to meet demand in the summer (around 9.5 kWh per day) would be undersized by approximately 20% in meeting demand in the winter months (around 12 kWh per day). Furthermore, a larger PV array would be required to fill the batteries in the winter owing to reduced insolation.
The aspirational energy demand, however, is more suited to PV generation as the increased usage of fans and fridges in the summer months corresponds to when energy generation is greatest. This matching of supply and demand means that PV and battery storage systems would not need to be oversized when meeting the periods of highest usage, as is the case for the basic demand profile. Although the overall costs of an energy system would be greater, a result of providing a greater amount of electricity, the increased efficiency of meeting demand would result in a lower cost per unit of electricity.
7.4 Seasonal influence and system efficacy

The solid lines (red and blue representing June and December respectively) in Figure 6 b) show the cumulative probability of the power being demanded at a given time. Equivalently these represent the proportion of the time that a generator of a given power will be sufficient in meeting the electricity demand, without resulting in a brown- or blackout. For the basic profile, up to around 0.1 kW is sufficient to meet the demand of phone charging during daylight periods. At a power output of around 0.5 kW the overnight lighting needs can be met, followed by twilight periods at between 0.5 to 1.0 kW and the evening peak loads at up to 1.5 kW. The seasonal difference here is highlighted: a small supply of 0.25 kW, for example, would be sufficient for almost 60% of the time in June, when the days are longer, but only just above 40% in December. A 1 kW power supply is sufficient to meet demand 80% of the time in June and 70% of the time in December, and the seasonal difference decreases as the final fraction of demand is met.
When the aspirational demand is lowest in the winter months the CDF is superficially similar to the basic profile. When the additional demand in summer from fans and fridges is accounted for, however, the effect on the power requirements is that two regimes are present. With increasing power capacity from around 0.5 kW to 1 kW approximately 80% of demand is met relatively quickly, accounting for the majority of the daily period with the exception of the evening peak. After this, however, the gains in demand satisfaction are modest with additional supply capacity: doubling power supply to 2 kW results in an addition of only around 10% of demand met. The benefit of meeting the period of evening demand would need to be weighed against the cost of a more expensive system.
Whilst greater power supplied yields greater demand (and user) satisfaction, it results in a much lower capacity factor, defined to be the average proportion of power supplied as a fraction of its maximum. The dashed lines in Figure 6 b) and c) show that small power supplies can operate at almost 100% capacity as a small load is almost always demanded, even if there is additional unmet demand, whilst large power supplies have significantly lower capacity factors. This presents a problem for diesel generators, for example, which are recommended to operate at around 80% of their rated capacity for continuous usage and to reach 100% only in emergencies[51]. A generator capable of meeting the upper fractions of both basic and aspirational demand would often be operating at a significantly lower capacity factor, sometimes as low as 40%, with power wasted during times of low demand. For the aspirational demand a generator of around 1.4 kW, suitable for meeting 80% of demand in both June and December, would have capacity factors differing by around 15%, with increased power wastage in the winter months.
To circumvent this, several lower-capacity generators could be used to make the total power available more flexible. This would increase the efficiency of the system by increasing the capacity factor, at the expense of raising initial investment costs and increasing the complexity of the system. One option to overcome these issues would be to schedule the demand to make it more constant throughout periods of the day, for example limiting power supply to certain times. For the basic demand profile, phone charging being only

available during the day would be beneficial for PV-based systems as they would be less reliant on battery storage; if only available at night a generator could run at a more constant capacity factor and with power not being wasted during the day.
For the additional aspirational load, the greater daytime demand could be met by a larger PV array without significant impact on the requirements of battery storage. Limiting access to fans during the evening would reduce the potential storage requirement; this would also make the demand more constant throughout the day, increasing the capacity factor of a diesel or biomass generator and making its usage more efficient. Alternatively, additional demand could come in the form of machinery for commercial or agricultural industry for the benefit of the rural community. For optimum efficiency this demand would be scheduled during the daytime: this would match generation times from a PV system, and also provide a more constant load and greater capacity factor for diesel or biomass generation.
By combining the characteristics of several electricity options the needs of the simulated village could be met through the use of a hybrid system. A PV array could be used to generate electricity to meet demand during the daytime with energy stored in batteries to provide power in the evenings. This would be well matched to the aspirational profile, as demand is comparatively high during the daytime in summer time when power generation would be highest, and reduced in winter periods when generation would be lower. A combustion generator could be used as a backup to meet peak demand, to charge the batteries for use overnight or during the morning peak, or to provide additional power during times of low insolation, for example on cloudy days or during the winter months. This would allow the PV array, batteries and diesel or biomass generator to be of smaller capacities, reducing the need for oversizing the system and potentially reducing the cost and environmental impact of meeting greater demand[52]. The Government of Uttar Pradesh has identified the suitability of PV and biomass minigrids in bringing renewable energy to unelectrified regions and has implemented policy incentives, financial subsidies and infrastructure support[53], highlighting the opportunity to bring clean, modern sources of energy to rural households.
8. Conclusions
The responses given by this survey give a rare insight into how rural households in Uttar Pradesh use traditional and modern energy for lighting and cooking. This gives a baseline of socioeconomic and technical data against which progress can be measured, both in terms of quantifying the benefits of using modern sources of energy to meet the needs of households and also highlighting the issues that are met when introducing the transition.
The household survey data collected reflected the levels of rural poverty in Bahraich District. Respondents almost exclusively relied on subsistence farming for their livelihoods and two-thirds of households were found to be below the rural poverty line set by the Indian government. The lack of

disposable income and inability to save on a consistent basis makes it challenging to access modern energy sources owing to the high initial upfront cost or the prioritisation of other expenses. This is something that must be addressed through innovative and affordable financing methods to maximise potential benefits. Almost 90% of the respondents’ time was spent sleeping, preparing or eating food, and working, leaving little time for other activities. One of the factors responsible was limited access to modern sources of energy, for example being forced to rely on the hours of daylight to work or study because kerosene lighting was inadequate to meet their needs.
The majority of households rely on kerosene lamps to meet their lighting needs. Their prevalence meant that many more kerosene lamps were used by households, but those with access to electricity used fixed lights for longer, and were more likely to use them throughout the night for security or comfort. Households with access to both kerosene and fixed lights did not see a decrease in total kerosene usage on average: some households would significantly reduce their reliance on kerosene, to reduce expenditure or avoid unhealthy pollution; others exhibited a rebound effect and would use all of their lights at the same time, possibly because leftover income could still be spent on kerosene, or through habit or user preference.
A similar trend was seen in energy for cooking. Access to gas stoves was twice as common as access to fixed lights and users expressed a clear preference towards gas stoves, reducing the usage of their traditional counterparts by 21%. This did not, however, reduce the total amount of hours each stove was used per day as users would often operate both a gas and traditional stove to make their work easier or faster. Similarly to lighting, access to modern energy did not completely replace traditional sources of fuel. This could be tackled by better educating users of the benefits of making a complete transition, and also by understanding the needs of the users in order to make the transition to modern energy sources as attractive as possible.
Aside from the health risks associated with kerosene lamps use we find the total expenditure on kerosene lighting to be INR 3,243 per year, amounting to an average of 10% of individual households’ annual total income, with 381.1 kgCO2eq emitted. Both of these values are far higher than for lighting supplied by alternative, and especially renewable, electricity sources, despite providing a lower quality of light. Households with gas stoves spend 17% more on meeting their cooking needs, but at a 28% reduction in their GHG emissions. In spite of the benefits, more households could not take up modern energy technologies because of their far larger initial costs compared to the incumbents. If the transition to cheaper and superior energy sources is to be successful, the cost barrier must be sufficiently reduced in order to make them a viable option for those living on or below the poverty line.
We applied the demographic and utilisation data that we collected to construct two hourly demand profiles: a basic profile created from the results of the household surveys, and an aspirational profile constructed from the literature. These were extrapolated to each month of the year, in contrast to many

studies which are not seasonally variant nor use real usage data, and used in a Monte Carlo simulation. For meeting the needs of the theoretical village for lighting and cell phone charging only, the total daily demand varies significantly over the year and this would significantly impact the requirements of battery storage if this were to be met by a renewable energy source. This seasonal difference is also highlighted in the proportion of time a power supply is sufficient to meet demand, but to meet peak loads the supply necessary to satisfy these minimum requirements, in this case around 1.5 kW for a village of 100 households, is necessary regardless of the time of year. This comes at a cost of a significantly reduced capacity factor that would make the use of a single diesel- or biomass-powered generator of inflexible capacity unsuitable. For aspirational demands such as fans, televisions, radios and refrigerators, total daily electricity demand is highest in the summer months with increased power demand during the daytime, which is well-suited to PV generation. Limiting device usage to certain times of the day could make the necessary power supply less variant and therefore more suited to the usage of diesel or biomass generators. Combining several electricity sources such as PV, battery storage and high-capacity generation in a hybrid system could allow demand to be met effectively and efficiently throughout the day and at a superior level of reliability to the grid network, enabling a transition to modern energy.
Acknowledgements
The authors would like to thank Marilyn Khan and Shweta Garg for interpretation services. PS and CC would like to thank the Grantham Institute – Climate Change and the Environment and Imperial College London, respectively, for PhD scholarships. PS, CC, AS, AC and MM would like to acknowledge support from Climate-KIC for funding the fieldwork. JN would like to thank the Royal Society for a Wolfson Merit Award and EPSRC for the Supergen SuperSolar Hub grants EP/J017361/1. This work was supported by EPSRC through Imperial College London’s Impact Acceleration Account (EP/K503733/1).
Bibliography
1. 2014 Annual Report. 2014, Sustainable Energy For All.2. Alstone, P., D. Gershenson, and D.M. Kammen, Decentralized energy
systems for clean electricity access. Nature Climate Change, 2015. 5(4): p. 305-314.
3. Bhattacharyya, S.C., Energy access problem of the poor in India: Is rural electrification a remedy? Energy Policy, 2006. 34(18): p. 3387-3397.
4. Reddy, B.S. and P. Balachandra, Dynamics of technology shifts in the household sector-implications for clean development mechanism. Energy Policy, 2006. 34(16): p. 2586-2599.

5. Devi, R., et al., Energy consumption pattern of a decentralized community in northern Haryana. Renewable & Sustainable Energy Reviews, 2009. 13(1): p. 194-200.
6. Priyadarshini, K., A model for dissemination of improved biomass fuels and cooking devices through rural enterprises. Boiling Point, 2005. 0(50): p. 26-28.
7. Lvovsky, K., et al., Access of the Poor to Clean Household Fuels in India. 2003, UNDP,ESMAP.
8. Bhattacharyya, S.C., Energy access programmes and sustainable development: A critical review and analysis. Energy for Sustainable Development, 2012. 16(3): p. 260-271.
9. Bhattacharyya, S.C., Renewable energies and the poor: niche or nexus? Energy Policy, 2006. 34(6): p. 659-663.
10. Howells, M.I., et al., Calabashes for kilowatt-hours: Rural energy and market failure. Energy Policy, 2010. 38(6): p. 2729-2738.
11. Sehjpal, R., et al., Going beyond incomes: Dimensions of cooking energy transitions in rural India. Energy, 2014. 68: p. 470-477.
12. Pachauri, S., Household electricity access a trivia cntributr to CO2 emissions growth in India. Nature Climate Change, 2014. 4(12): p. 1073-1076.
13. Jain, A., et al., Access to Clean Cooking Energy and Electricity - Survey of States, A. Ghosh, H.H. Dholakia, and K. Chawla, Editors. 2015, Council on Energy, Environment and Water.
14. Mills, E., Environment - The specter of fuel-based lighting. Science, 2005. 308(5726): p. 1263-1264.
15. Mills, E., Light for Life: Identifying and Reducing the Health and Safety Impacts of Fuel-Based Lighting. 2014, United Nations Environment Programme.
16. Bacon, R., S. Bhattacharya, and M. Kajima, Expenditure of Low-Income Households on Energy. 2010, World Bank.
17. Mahapatra, S., H.N. Chanakya, and S. Dasappa, Evaluation of various energy devices for domestic lighting in India: Technology, economics and CO2 emissions. Energy for Sustainable Development, 2009. 13(4): p. 271-279.
18. Lam, N.L., et al., Household Light Makes Global Heat: High Black Carbon Emissions From Kerosene Wick Lamps. Environmental Science & Technology, 2012. 46(24): p. 13531-13538.
19. Census of India, M.o.H. Affairs and G.o. India, Editors. 2011.20. Shweta, S. and B. Usha, Scope of energy conservation and renewable
energy in villages in Eastern Uttar Pradesh, India: an energy security analysis. Boiling Point, 2009(57): p. 32-36.
21. Wilkinson, P., et al., Health and Climate Change 1 Public health benefits of strategies to reduce greenhouse-gas emissions: household energy. Lancet, 2009. 374(9705): p. 1917-1929.
22. Parikh, J.K., et al., Toll on human resources due to lack of energy, water, sanitation and their health impacts in Rural North India. Boiling Point, 2003(49): p. 24-26.
23. Rouse, J., Community participation in household energy programmes: a case study from India. Energy for Sustainable Development, 2002. 6(2): p. 28-36.

24. Malini, R., P. Rakesh, and P.B. Singh, Participatory approach for linking rural energy transitions and developmental needs in Uttar Pradesh, India. Boiling Point, 2003(49): p. 15-17.
25. Bloomfield, E., Gender and Livelihoods Impact of Clean Cookstoves in South Asia. 2015, Practical Action.
26. Preeti, M., Environmental implications of the energy ladder in rural India. Boiling Point, 1999(42): p. 3-5.
27. Doig, A., Improving the environment can lead to benefits in household energy. Boiling Point, 2010(42).
28. Agarwal, N., A. Kumar, and Varun, Optimization of grid independent hybrid PV-diesel-battery system for power generation in remote-villages of Uttar Pradesh, India. Energy for Sustainable Development, 2013. 17(3): p. 210-219.
29. Bhandari, B., et al., A novel off-grid hybrid power system comprised of solar photovoltaic, wind, and hydro energy sources. Applied Energy, 2014. 133: p. 236-242.
30. Lee, M., D. Soto, and V. Modi, Cost versus reliability sizing strategy for isolated photovoltaic micro-grids in the developing world. Renewable Energy, 2014. 69: p. 16-24.
31. Hirmer, S. and H. Cruickshank, The user-value of rural electrification: An analysis and adoption of existing models and theories. Renewable & Sustainable Energy Reviews, 2014. 34: p. 145-154.
32. Sen, R. and S.C. Bhattacharyya, Off-grid electricity generation with renewable energy technologies in India: An application of HOMER. Renewable Energy, 2014. 62: p. 388-398.
33. Kamalapur, G.D. and R.Y. Udaykumar, Rural electrification in India and feasibility of Photovoltaic Solar Home Systems. International Journal of Electrical Power & Energy Systems, 2011. 33(3): p. 594-599.
34. Reddy, B.S. and H.S.K. Nathan, Energy in the development strategy of Indian households-the missing half. Renewable & Sustainable Energy Reviews, 2013. 18: p. 203-210.
35. Hassan, M.K., et al., Rural households' preferences and attitudes towards biomass fuels - results from a comprehensive field survey in Bangladesh. Energy, Sustainability and Society, 2013. 3(21).
36. Boait, P., V. Advani, and R. Gammon, Estimation of demand diversity and daily demand profile for off-grid electrification in developing countries. Energy for Sustainable Development, 2015. 29: p. 135-141.
37. Agriculture Census 2010-11, M.o.A. Department of Agriculture and Co-operation, Government of India, Editor. 2011.
38. Poverty & Equity Data: India. [cited 2015 13 July]; Available from: http://povertydata.worldbank.org/poverty/country/IND.
39. Singh, M.K., New Poverty Line: Rs 32 in villages, Rs 47 in cities, in Times of India. 2014: Delhi.
40. Press Note on Poverty Estimates, 2011-12. 2013, Planning Commission, Press Information Bureau, Government of India.
41. Saunders, H.D., Fuel conserving (and using) production functions. Energy Economics, 2008. 30(5): p. 2184-2235.
42. CO2 emissions (kt), T.W. Bank, Editor. 2011.43. Indane Gas. 2015 [cited 2015 20 July]; Available from:
https://http://www.iocl.com/products/indanegas.aspx.

44. Jain, A., P. Choudhury, and K. Ganesan, Clean, Affordable and Sustainable Cooking Energy for India. 2015, Council on Energy, Environment and Water.
45. Venkataraman, C., et al., Residential biofuels in south Asia: Carbonaceous aerosol emissions and climate impacts. Science, 2005. 307(5714): p. 1454-1456.
46. Gregory, J. and J. Shinde, Household Greenhouse Gas Emissions from Two Rural Maharashtrian Villages. 2010, Watershed Organisation Trust.
47. Jarvie, J., Biomass Related to Cooking Stoves - Carbon Emissions, M. Corps, Editor. 2011.
48. Bhattacharyya, S.C., Mini-grid based electrification in Bangladesh: Technical configuration and business analysis. Renewable Energy, 2015. 75: p. 745-761.
49. Orlandi, I., N. Tyabji, and J. Chase, Off-Grid Solar Market Trends Report 2016. 2016, Bloomberg New Energy Finance and Lighting Global.
50. Phadke, A., et al., Powering a Home with Just 25 Watts of Solar PV: SuperEfficient Appliances Can Enable Expanded Off-Grid Energy Service Using Small Solar Power Systems. 2015, Ernest Orlando Lawrence Berkeley National Laboratory.
51. Factors Affecting Generator Output Rating. 2013 [cited 2016 7 January]; Available from: http://www.dieselserviceandsupply.com/Generator_Output_Rating.aspx.
52. Sandwell, P., et al., Off-grid solar photovoltaic systems for rural electrification and emissions mitigation in India. Solar Energy Materials and Solar Cells, 2016.
53. Mini Grid Policy Uttar Pradesh 2016, U.P.N.a.R.E.D. Agency, Editor. 2016.