Analysis of diversity and disparity - Indiana University …indiana.edu/~g404/Lectures/Lecture 19 -...
18
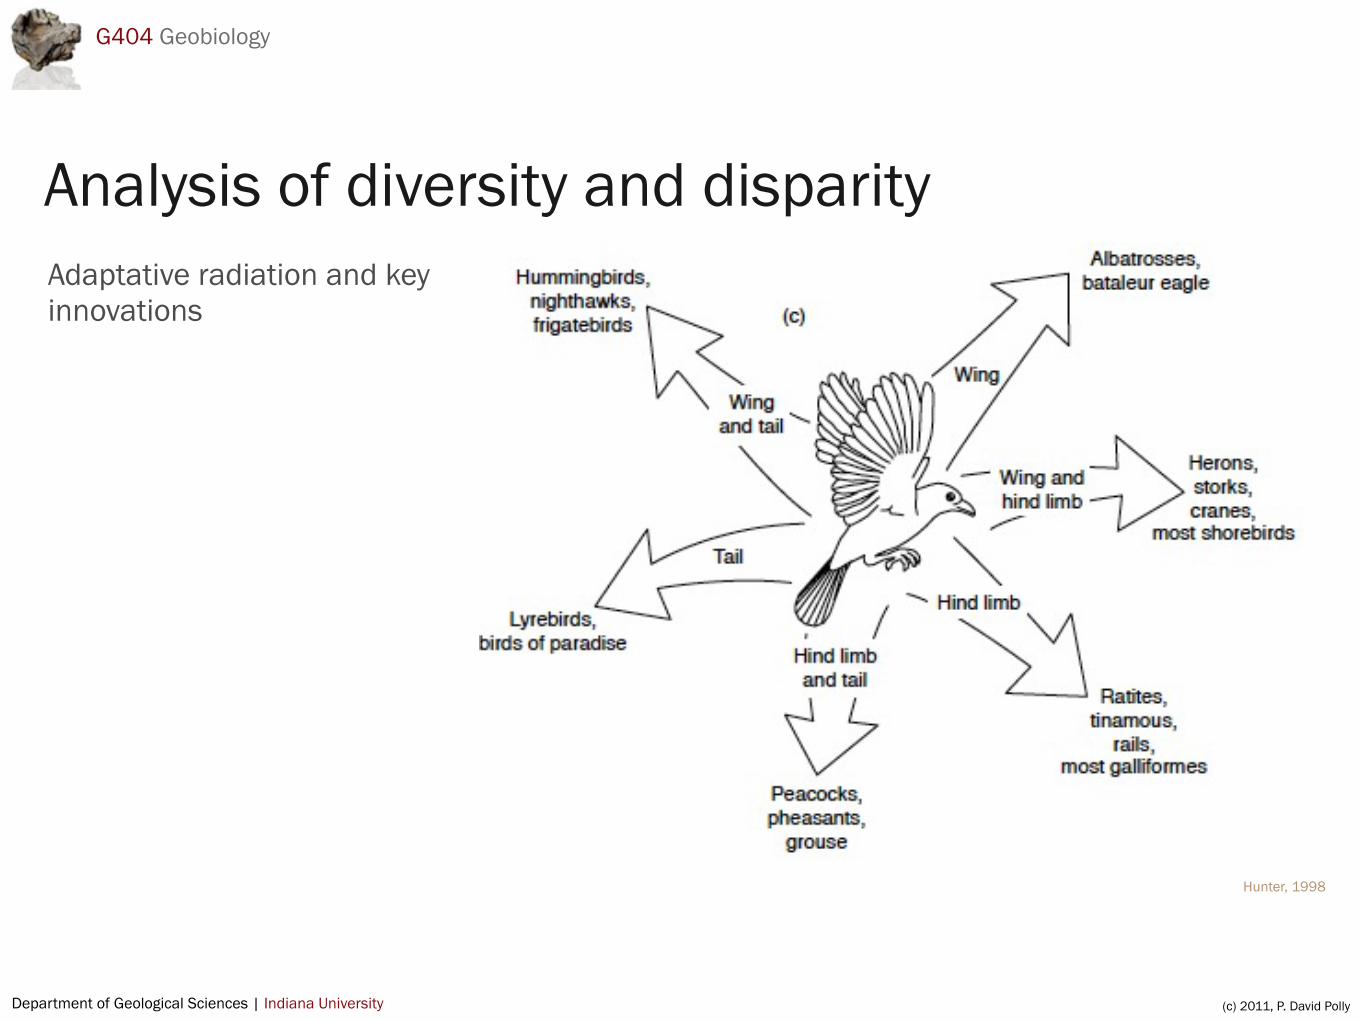
Department of Geological Sciences | Indiana University (c) 2011, P. David Polly G404 Geobiology Hunter, 1998 Adaptative radiation and key innovations Analysis of diversity and disparity
-
Upload
truongkhanh -
Category
Documents
-
view
216 -
download
0
Transcript of Analysis of diversity and disparity - Indiana University …indiana.edu/~g404/Lectures/Lecture 19 -...
Department of Geological Sciences | Indiana University (c) 2011, P. David Polly
G404 Geobiology
Hunter, 1998
Adaptative radiation and key innovations
Analysis of diversity and disparity

Department of Geological Sciences | Indiana University (c) 2011, P. David Polly
G404 Geobiology
Allison Bormet: Artiodactyls and ecomorphology
Blaire Hensley-Marschand: Hominins and mammals
“Take home” lab, no meeting

Department of Geological Sciences | Indiana University (c) 2011, P. David Polly
G404 Geobiology
Discussion on Thursday

Department of Geological Sciences | Indiana University (c) 2011, P. David Polly
G404 Geobiology
Schulter, 1996. American Naturalist, 148: S40-S64.
Adaptive radiation“A proliferation of species within a single clade accompanied by significant interspecific divergence in the kinds of resources exploited and in the morphological and physiological traits used to exploit those resources.” (Schluter, 1996)
Five components:
1. Monophyletic group2. increase in diversity (number of species
or lineages)3. increase in ecological differentiation
(resources such as food, substrate, etc.)4. increase in disparity (morphological
differences)5. by implication, relatively rapid increases
in these properties
Department of Geological Sciences | Indiana University (c) 2011, P. David Polly
G404 Geobiology
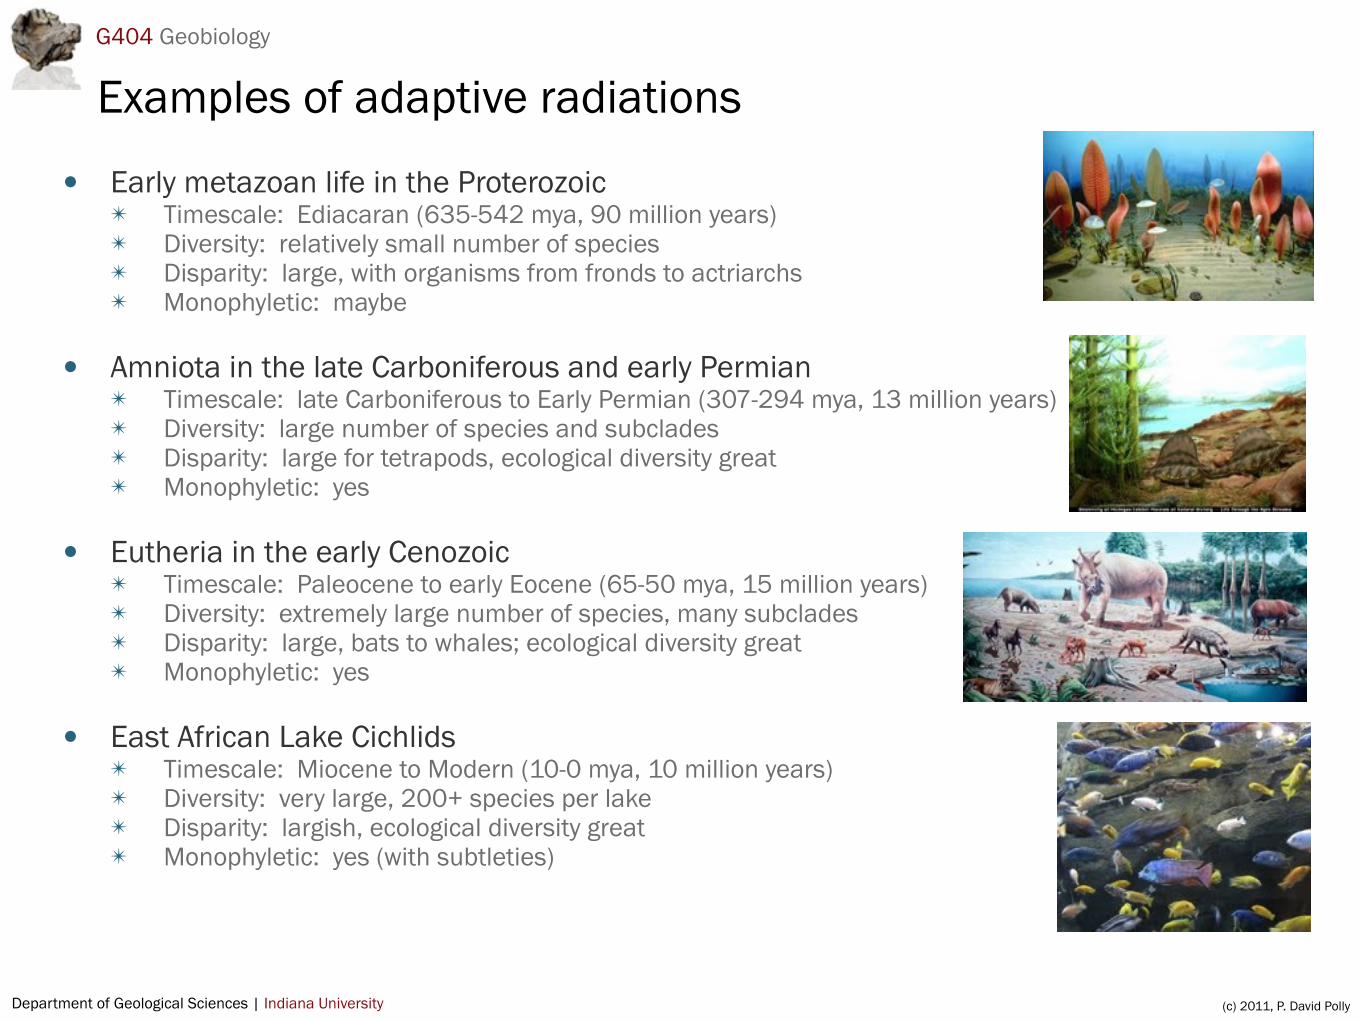
Examples of adaptive radiations
• Early metazoan life in the Proterozoic✴ Timescale: Ediacaran (635-542 mya, 90 million years)✴ Diversity: relatively small number of species✴ Disparity: large, with organisms from fronds to actriarchs✴ Monophyletic: maybe
• Amniota in the late Carboniferous and early Permian✴ Timescale: late Carboniferous to Early Permian (307-294 mya, 13 million years)✴ Diversity: large number of species and subclades✴ Disparity: large for tetrapods, ecological diversity great✴ Monophyletic: yes
• Eutheria in the early Cenozoic✴ Timescale: Paleocene to early Eocene (65-50 mya, 15 million years)✴ Diversity: extremely large number of species, many subclades✴ Disparity: large, bats to whales; ecological diversity great✴ Monophyletic: yes
• East African Lake Cichlids✴ Timescale: Miocene to Modern (10-0 mya, 10 million years)✴ Diversity: very large, 200+ species per lake✴ Disparity: largish, ecological diversity great✴ Monophyletic: yes (with subtleties)
Department of Geological Sciences | Indiana University (c) 2011, P. David Polly
G404 Geobiology
Key innovation
Key innovations are new features that facilitate adaptive radiations.
“Aspects of organismal phenotype important to the origin or subsequent success of a group.” (Hunter, 1998)
✴ May contribute to adaptive radiation✴ Differs from adaptive radiation in that key feature may evolve homoplastically and result
in diversification of more than one clade in parallel✴ Linked to diversity but not necessarily disparity✴ Trait must be a true adaptation, not an exaptation
Department of Geological Sciences | Indiana University (c) 2011, P. David Polly
G404 Geobiology
Hunter, 1998
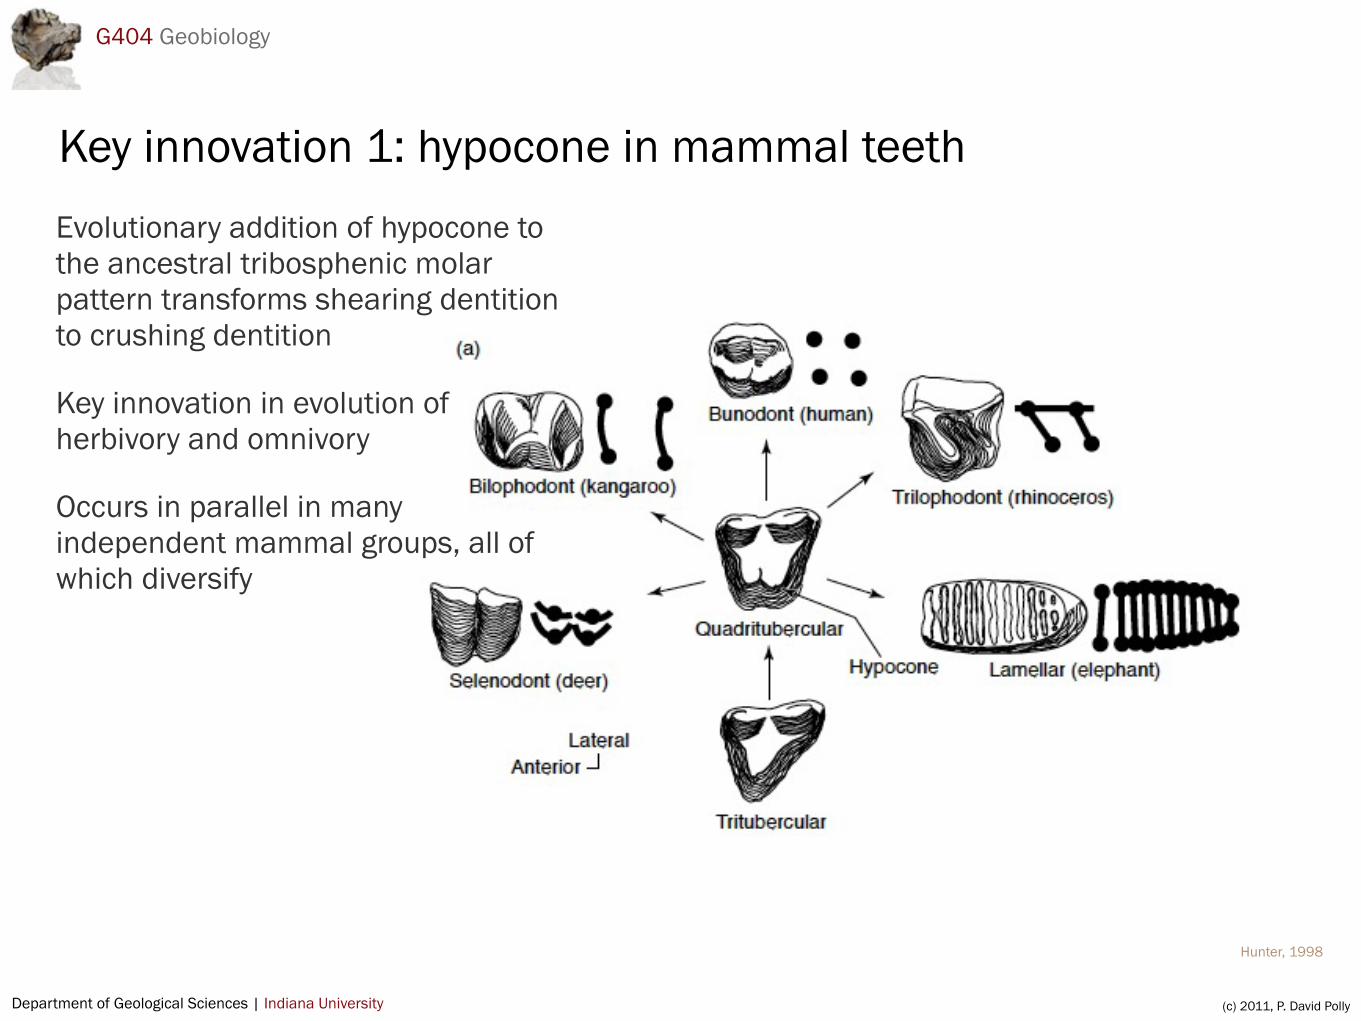
Key innovation 1: hypocone in mammal teethEvolutionary addition of hypocone to the ancestral tribosphenic molar pattern transforms shearing dentition to crushing dentition
Key innovation in evolution of herbivory and omnivory
Occurs in parallel in many independent mammal groups, all of which diversify

Department of Geological Sciences | Indiana University (c) 2011, P. David Polly
G404 Geobiology
Hunter, 1998
Association between hypocone and mammalian diversityTribosphenic and partial hypocone taxa maintain constant diversity
Hypocone taxa radiate with large diversity

Department of Geological Sciences | Indiana University (c) 2011, P. David Polly
G404 Geobiology
Hunter, 1998
Key innovation : locomotor changes in birdsTransformation of one locomotor system in basal theropods to three in aves allows diversification into many types of forms
Hindlimbs + tail in theropods (coordinated)
Hindlimbs versus forelimbs versus tails in birds (semi-independent)
Department of Geological Sciences | Indiana University (c) 2011, P. David Polly
G404 Geobiology
A B C
Character change(exaptation)
Character change(adaptation)
Function change
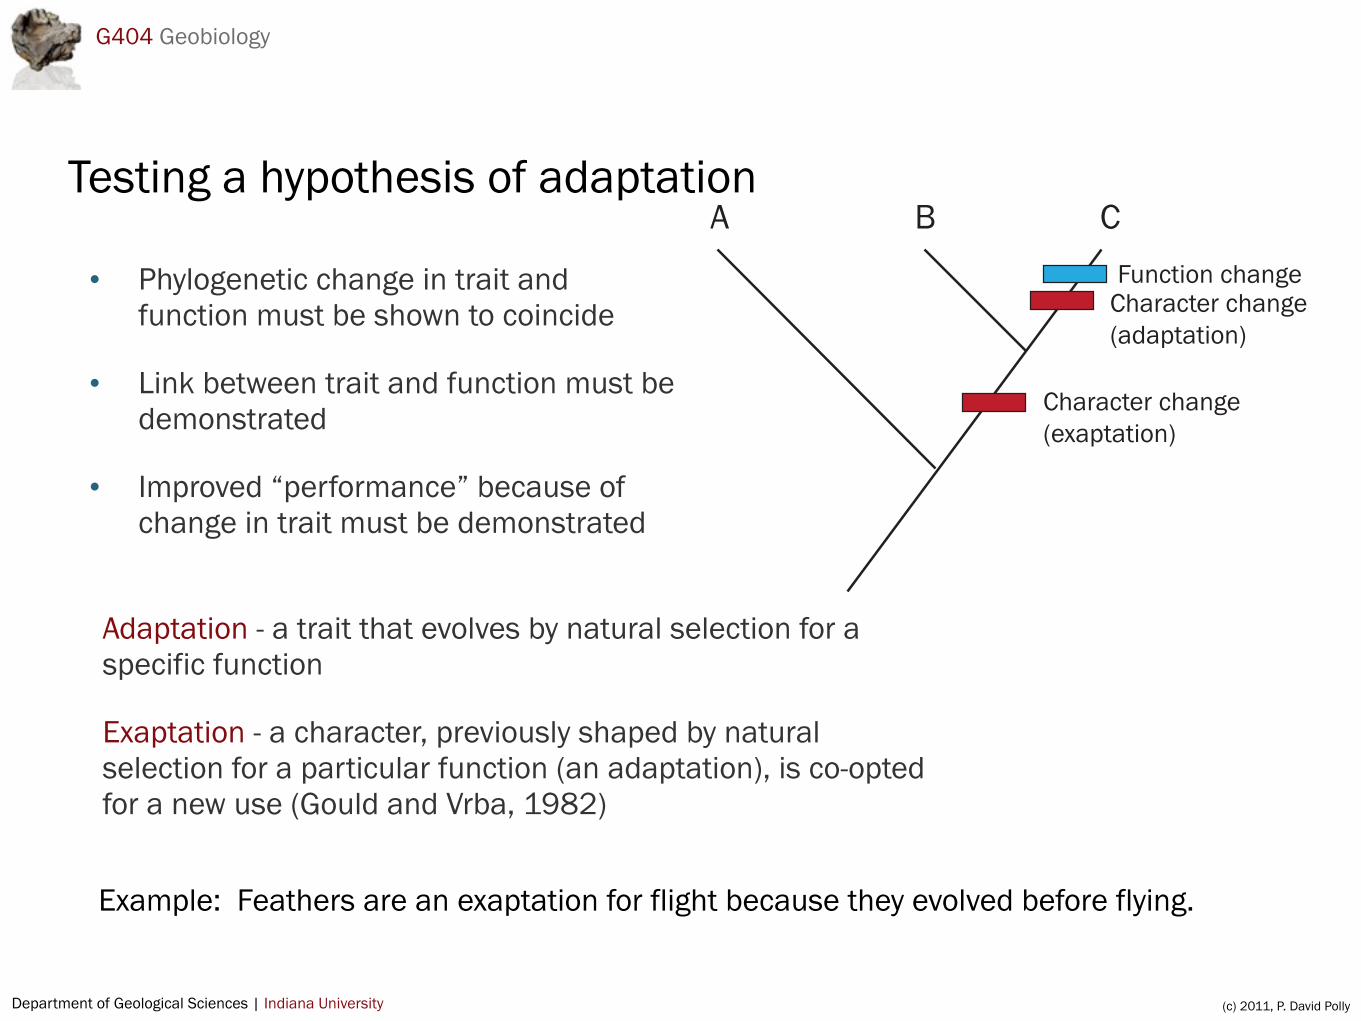
Testing a hypothesis of adaptation
• Phylogenetic change in trait and function must be shown to coincide
• Link between trait and function must be demonstrated
• Improved “performance” because of change in trait must be demonstrated
Adaptation - a trait that evolves by natural selection for a specific function
Exaptation - a character, previously shaped by natural selection for a particular function (an adaptation), is co-opted for a new use (Gould and Vrba, 1982)
Example: Feathers are an exaptation for flight because they evolved before flying.

Department of Geological Sciences | Indiana University (c) 2011, P. David Polly
G404 Geobiology
Diversity and disparity
DiversityDiversity is the number of taxa living at one time, and changes to that number. Extinction lowers diversity, radiation raises diversity.
DisparityDisparity is the difference among taxa, roughly equal to the degree to which contemporary taxa are specialized for different things or specialized for the same thing.
The two are not necessarily correlated. Many species (high diversity) could have only a few specializations (low disparity); few species (low diversity) could have remarkably different specializations (high disparity).
Department of Geological Sciences | Indiana University (c) 2011, P. David Polly
G404 Geobiology
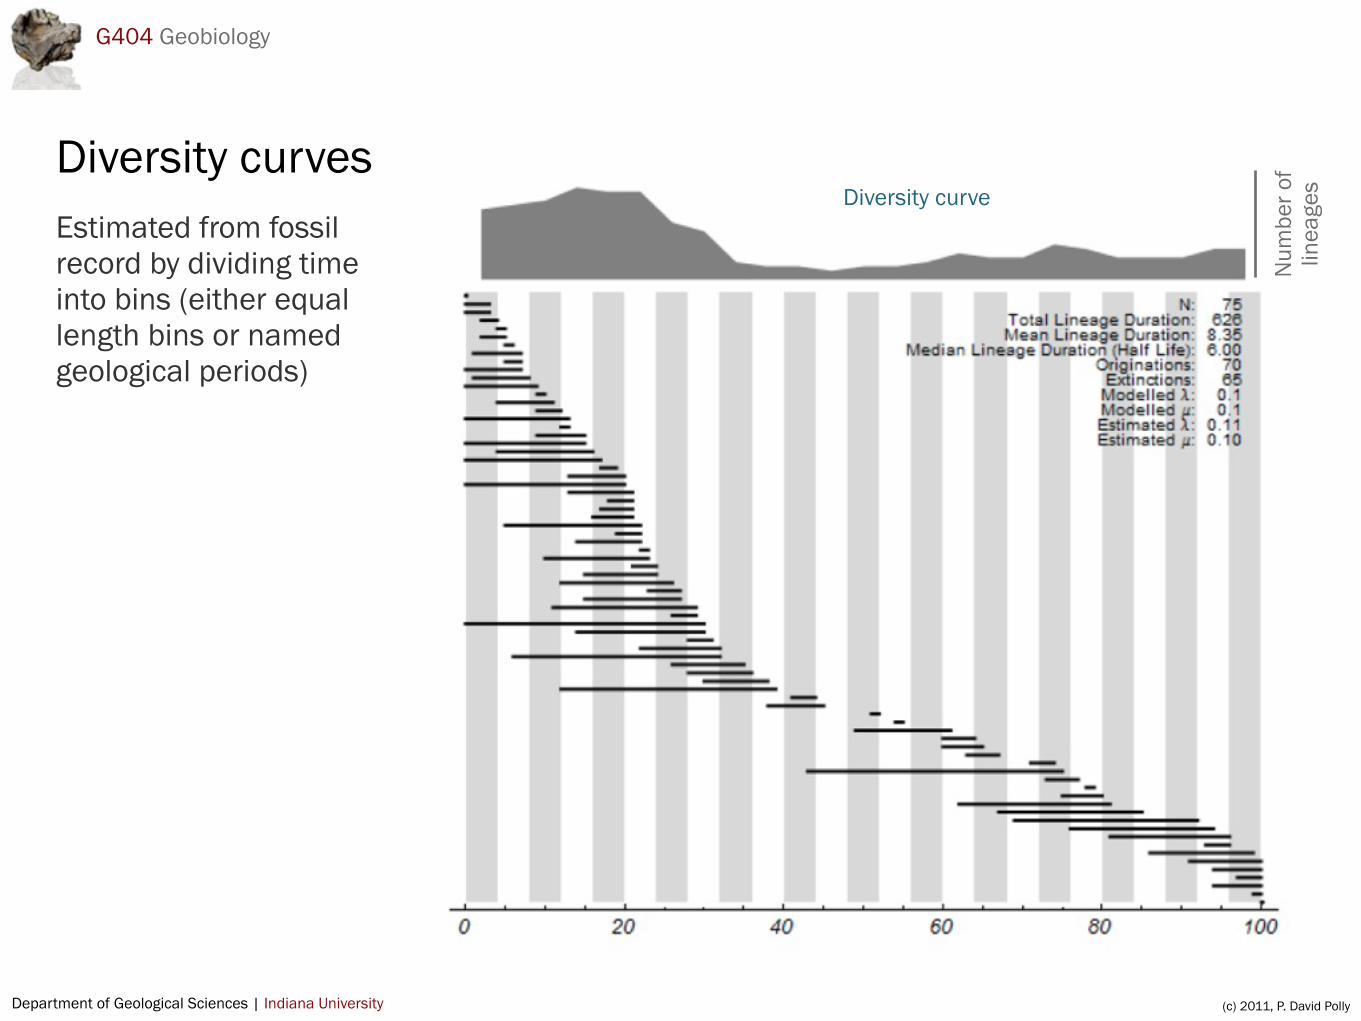
Diversity curvesEstimated from fossil record by dividing time into bins (either equal length bins or named geological periods)
Diversity curve
Num
ber o
f lin
eage
s
Department of Geological Sciences | Indiana University (c) 2011, P. David Polly
G404 Geobiology
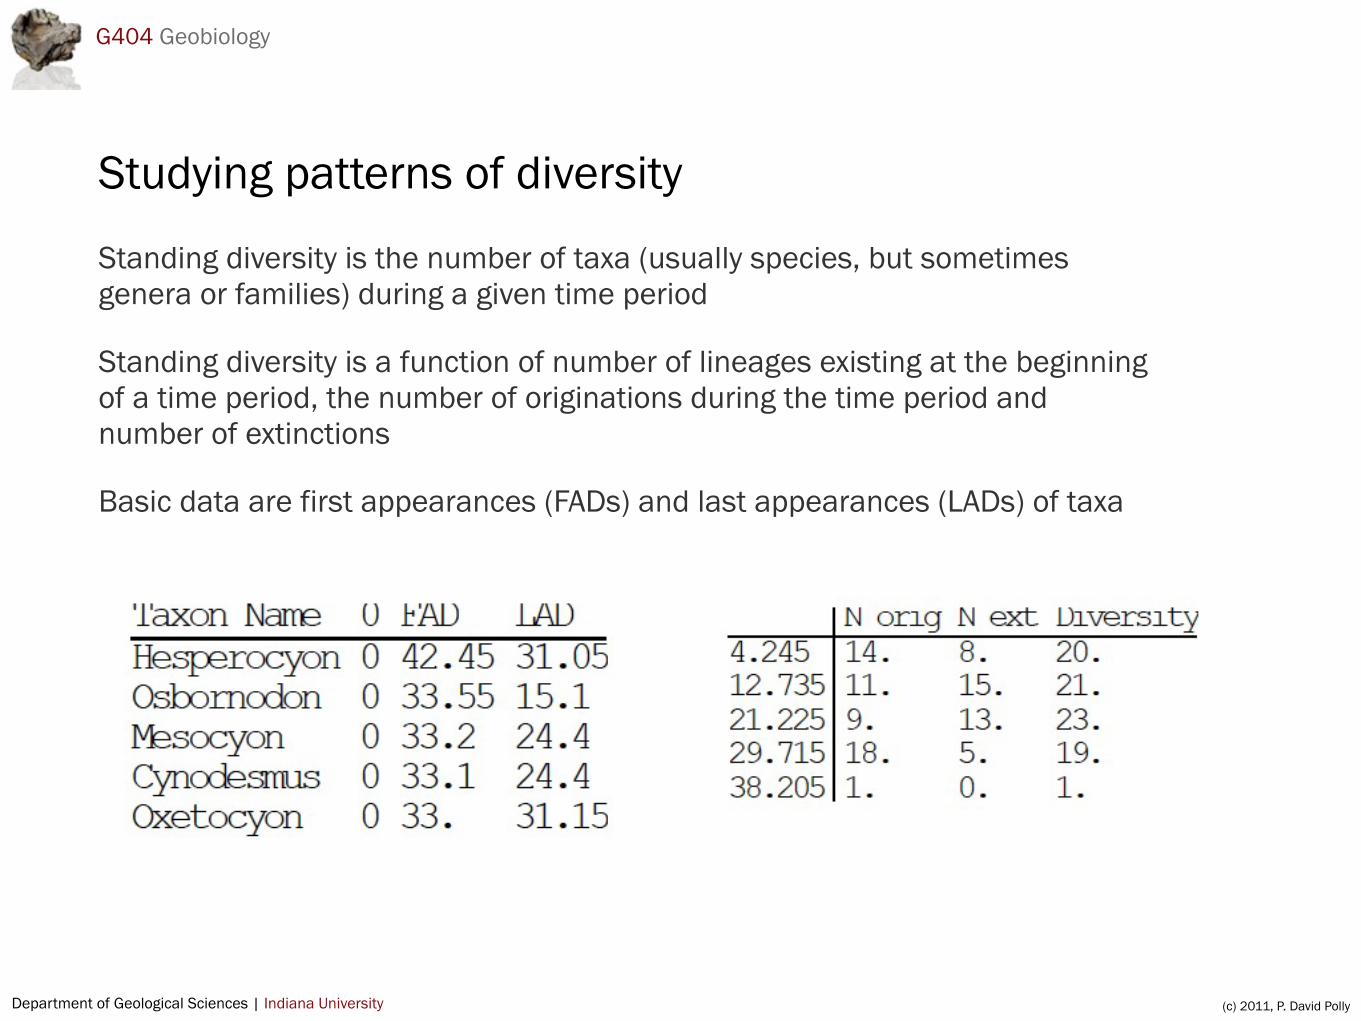
Studying patterns of diversity
Standing diversity is the number of taxa (usually species, but sometimes genera or families) during a given time period
Standing diversity is a function of number of lineages existing at the beginning of a time period, the number of originations during the time period and number of extinctions
Basic data are first appearances (FADs) and last appearances (LADs) of taxa
Department of Geological Sciences | Indiana University (c) 2011, P. David Polly
G404 Geobiology
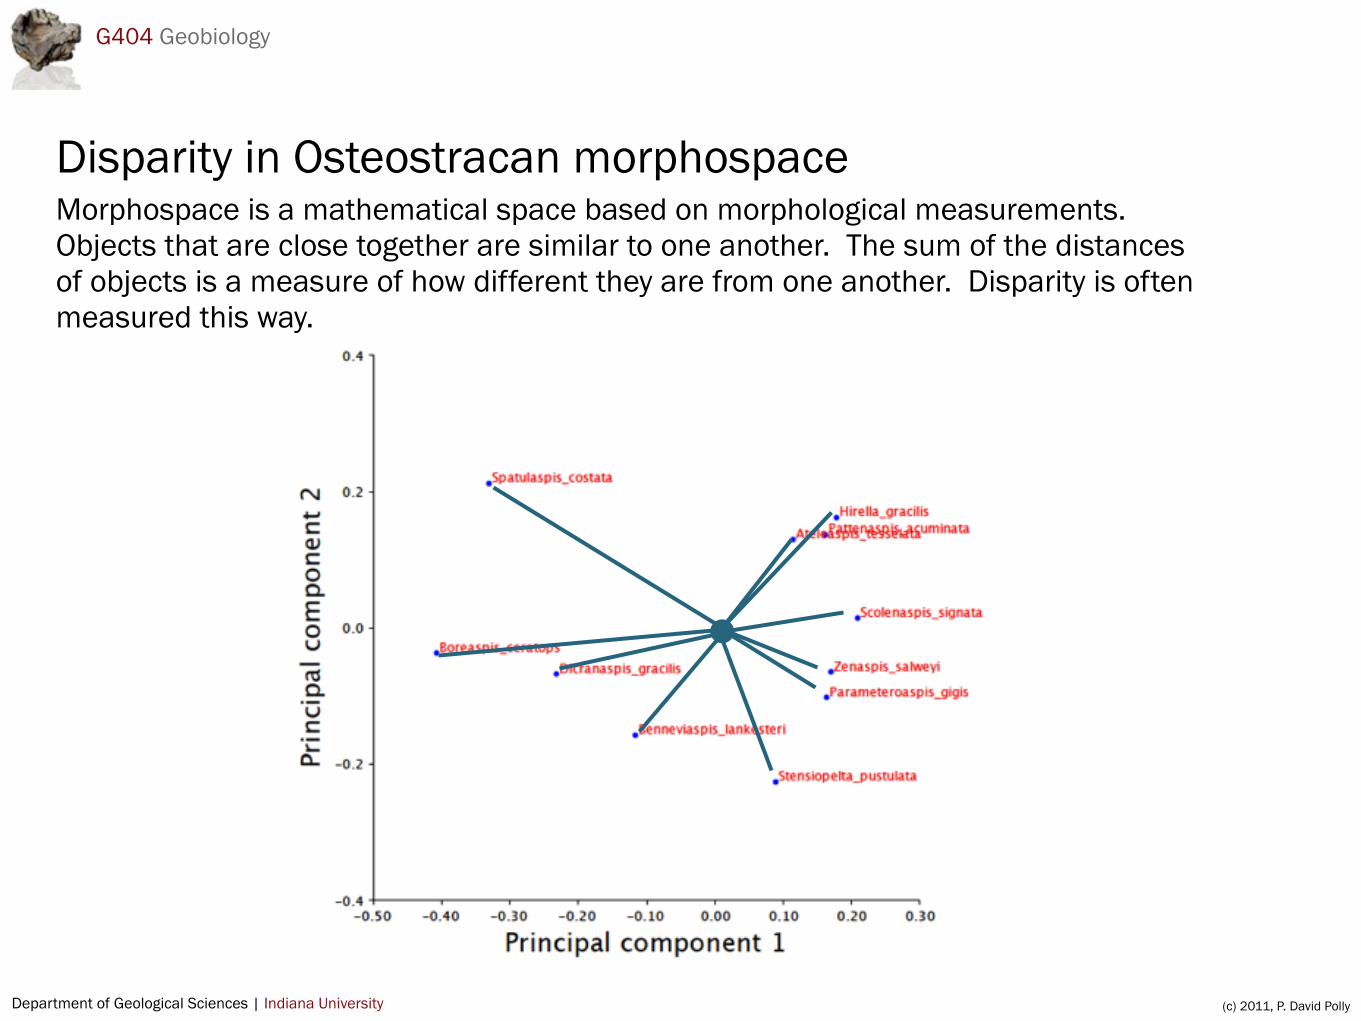
Disparity in Osteostracan morphospaceMorphospace is a mathematical space based on morphological measurements. Objects that are close together are similar to one another. The sum of the distances of objects is a measure of how different they are from one another. Disparity is often measured this way.

Department of Geological Sciences | Indiana University (c) 2011, P. David Polly
G404 Geobiology
Measuring disparity
Disparity is the average spread of taxa in morphospace
Can be measured from meristic characters or continuous characters
Distance between taxa is calculated and a morphospace produced using principal coordinates analysis (PCO) or principal components analysis (PCA)
PCO for meristic characters: distance = number of different character states
Taxon 1 0011001Taxon 2 0010110
Distance = 4 (four characters differ in state)
PCA for continuous characters: distance = Euclidean distance summed across traits
Taxon 1 0.5 1.0Taxon 2 0.7 1.2
Distance = sqrt( (0.5-0.7)2 + (1.0-1.2)2 ) = 0.4
Department of Geological Sciences | Indiana University (c) 2011, P. David Polly
G404 Geobiology
Photo credit
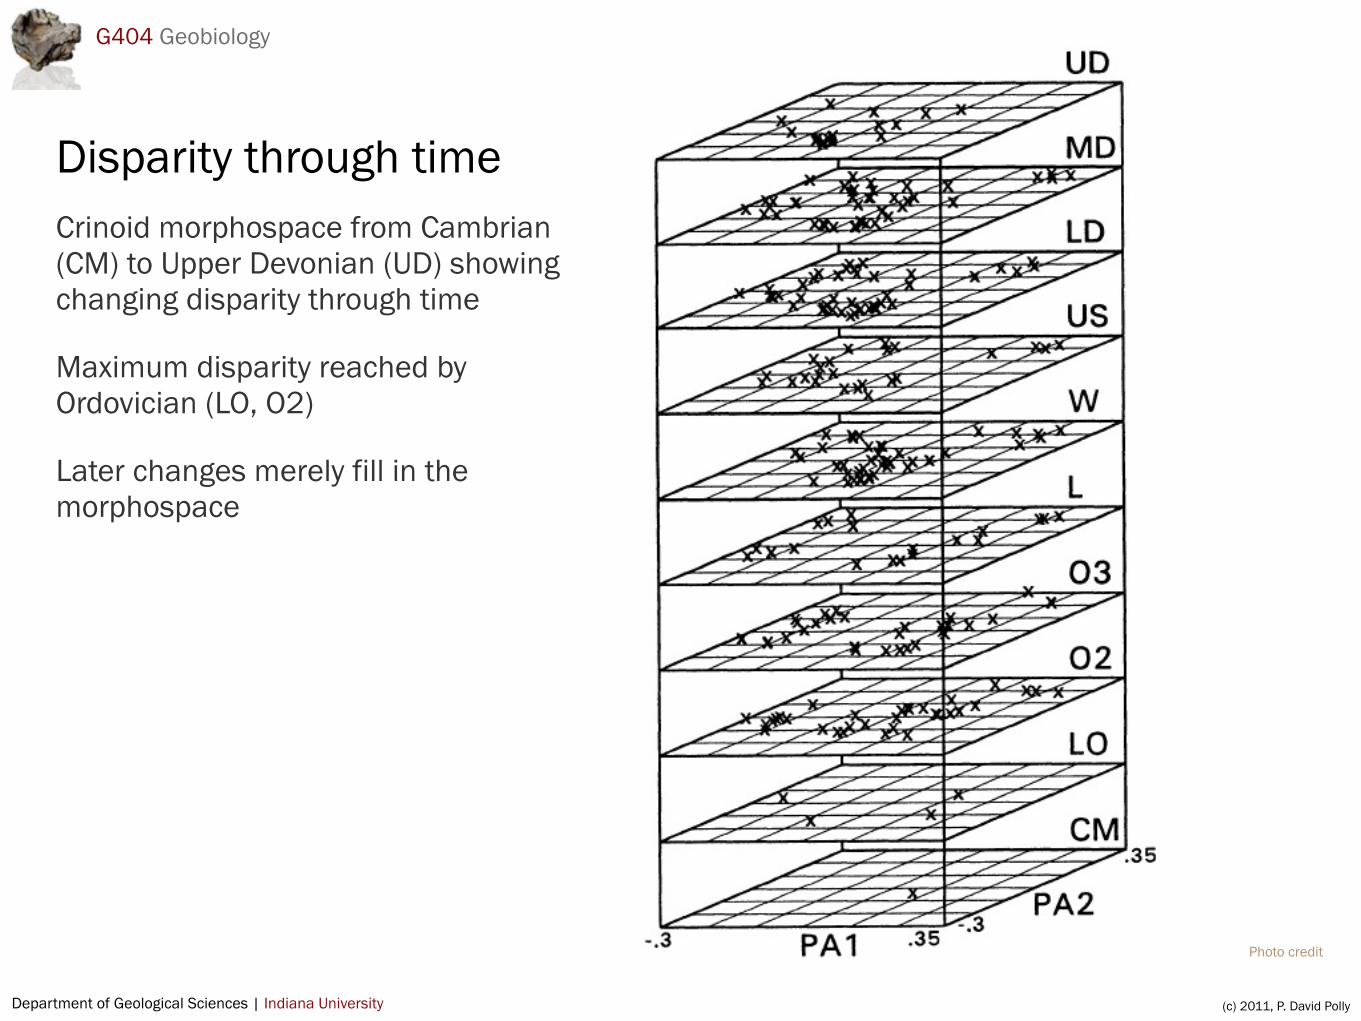
Disparity through timeCrinoid morphospace from Cambrian (CM) to Upper Devonian (UD) showing changing disparity through time
Maximum disparity reached by Ordovician (LO, O2)
Later changes merely fill in the morphospace

Department of Geological Sciences | Indiana University (c) 2011, P. David Polly
G404 Geobiology
(Tom Holtz, based on original by Matt Wedel, UC Museum of Paleontology website)

Department of Geological Sciences | Indiana University (c) 2011, P. David Polly
G404 Geobiology
Scientific papers for further readingAdams, D. C., C. M. Berns, K. H. Kozak, and J. J. Wiens. 2009. Are rates of species diversification correlated with rates of morphological evolution? Proceedings of the Royal Society B, 276: 2729-2738.
Gould, S. J. and R. C. Lewontin, 1979. The spandrels of San Marco and the Panglossian paradigm: a critique of the adaptationist programme. Proceedings of the Royal Society B, 205: 581-598.
Hunter, J. P. 1998. Key innovations and the ecology of macroevolution. Trends in Evolution and Ecology, 13: 31-36.
Schluter, D. 1996. Ecological causes of adaptive radiation. American Naturalist, 148: S40-S64.