Analysis Of Disc Brake Squeal Using The Finite Element Method
286
Page i Analysis Of Disc Brake Squeal Using The Finite Element Method by Zaidi Bin Mohd Ripin A thesis submitted in accordance with the requirements for the degree of Doctor of Philosophy Department of Mechanical Engineering University of Leeds Leeds, United Kingdom September 1995 The candidate confirms that the work submitted is his own and that appropriate credit has been given where reference has been made to the work of others
Transcript of Analysis Of Disc Brake Squeal Using The Finite Element Method

Page i
Analysis Of Disc Brake Squeal Using The Finite Element Method
by
Zaidi Bin Mohd Ripin
A thesis submitted in accordance with the requirements for the degree of
Doctor of Philosophy
Department o f Mechanical Engineering
University o f Leeds
Leeds, United Kingdom
September 1995
The candidate confirms that the work submitted is his own and that appropriate credit has been given where reference has been made to the work o f others

Page ii
A bstract
The problem o f disc brake squeal has been examined by developing a finite element
model o f the coupled pad-disc system , conducting complex eigenvalue analysis and
associating unstable modes with potential squeal problem areas. A key issue in this
process is the representation o f the contact pressure distribution at the frictional
interface between the disc and the pad. Non-linear contact analysis using the finite
element model o f the pad revealed that contact is only partial at the pad-disc interface
and that the contact pressure distribution depends on the friction coefficient, Young’s
modulus o f the friction material and the way the applied pressure is distributed on the
pad backplate. A new method is proposed in which interface contact stiffness is related
to brake line pressure using a statistical approach based on the measured surface
properties o f the interface. Complex eigenvalue analysis o f the coupled pad-disc
system has shown that unstable modes exist within different ranges o f contact stiffness
thereby providing an explanation o f the effect o f varying line pressure on squeal. The
two most unstable modes from the analysis show good correlation with experimental
squeal results. The coupled model is then used for parametric studies the results o f
which indicate that high coefficient o f friction and uniform contact pressure
distribution increase instability whilst a trailing edge biased pressure distribution and a
high support stiffness at the pad backplate reduce it. Limiting the disc symmetry by
introducing equispaced slots was shown to be effective in reducing instabilities
involving diametral modes o f the disc with the same order o f symmetry only Other
modes were stabilised by increasing the rigidity o f the pad. The overall results suggest
that either the pad or the disc can be mainly responsible for the instability depending
on the mode thus unifying the different approaches to disc brake squeal and enabling
the most appropriate component to be targeted for squeal abatement purposes.

Page iii
Table of contents
A b s tra c t .............................................................................................................................................. ii
Table of con ten ts ........................................................................................................................... iii
List of F igures ..............................................................................................................................vii
List of T ab les ..................................................................................................................................xii
A cknow ledgem ents .................................................................................................................... xiii
Declaration of O rig ina lity ........................................................................................................xiv
G eneral Layout and Presentation xv
C h a p te r O ne - In troduction
1.1 Background................................................................................................................................ 1
1.2 Present W ork..............................................................................................................................3
1.3 Thesis Organisation...................................................................................................................4
C h a p te r Two - L i te ra tu re Review
2 1 Introduction...............................................................................................................................6
2.2 Definitions..................................................................................................................................7
2.3 Squeal Models........................................................................................................................... 8
2.3 1 Early w ork............................................................................................................................... 8
2.3.2 Variable friction model.........................................................................................................9
2.3.3 Sprag-slip model..................................................................................................................14
2.3.4 Pin-on-disc models..............................................................................................................16
2.3.4.1 Friction induced self-excited oscillations................................................................... 16
2.3.4.2 Geometrically constrained instability.......................................................................... 21
2.3.5 Lumped parameter models............................................................................................... 23
2.3.6 Analysis o f squeal using the finite element method.................................................... 26
2.3.7 Other theoretical w ork .......................................................................................................31
2.4 Experimental W ork.................................................................................................................31
2 .4 .1 General experimentation techniques.............................................................................. 31
2.4.2 Experiments to determine the effect o f component dynamics on squeal.............. 32
2.4.3 Experiments on the effect o f contact stiffness on squeal...........................................33
2.4.4 Experiments on the effect o f separation o f doublet modes.......................................33
2.4.5 Experiments using double-pulsed laser holography................................................... 34

Tabic o f contents iv
2.5 Discussion..................................................................................................................................36
2.6 Conclusions.............................................................................................................................. 39
Chapter Three - Methodology O f Present Study
3.1 Introduction - The Need for A New Approach ............................................................41
3 .2 Selection o f Experimental Results for Validation 43
3.3 Operation o f a Fist-Type Sliding Calliper......................................................................... 44
3.4 Pressure Representation........................................................................................................47
3.5 Interface Element.................................................................................................................... 50
3.5.1 Variable friction force with variable normal force......................................................50
3.5.2 Follower friction force effect............................................................................................57
3.5.3 Comparison with Hulten friction element..................................................................... 59
3.6 Component Interaction.......................................................................................................... 62
3.7 Stability Analysis......................................................................................................................63
3.8 Complex Eigenvalues Analysis Using The Finite Element Method...........................65
3 .9 Method of Analysis.................................................................................................................74
3 10 Summary..................................................................................................................................75
Chapter Four - Modal Analysis of the Disc and Pad
4.1 Introduction.............................................................................................................................. 76
4.2 General Method o f Analysis.................................................................................................77
4.2.1 Limitations in the analysis..................................................................................................77
4.2.2 General substructuring theory.......................................................................................... 78
4.2.3 Substructuring applied to eigenvalue problem 80
4.2 .4 Selection of master degrees o f freedom 81
4.3 Eigenvalue Analysis o f the Disc.......................................................................................... 82
4.3.1 Disc model definition......................................................................................................... 82
4.3.2 Results.................................................................................................................................... 92
4.4 Eigenvalue Analysis o f the Pad 94
4.4.1 Pad model definition........................................................................................................... 94
4.4.2 Results.................................................................................................................................... 99
4.5 Comparison with Experiments.......................................................................................... 101
4.5.1 The experimental results for the free-free disc.......................................................... 1°2

Tabic o f contents v
4.5.2 The experimental results for the free-free pad.......................................................... 107
4.6 Discussion............................................................................................................................... 110
4.7 Summary..................................................................................................................................113
Chapter Five - Contact Pressure Analysis Of The Brake Pad
5.1 Introduction.......................................................................................................................... 114
5.2 Method of Analysis.............................................................................................................115
5.2.3 Finite element models..................................................................................................... 116
5.4 Results..................................................................................................................................... 1 '7
5.4.1 Effect o f circumferential friction...................................................................................117
5.4.2 Effect o f magnitude o f pressure.................................................................................... 122
5 .4.3 Effect o f abutment constraint......................................................................................... 125
5 .4.4 Effect o f friction material modulus............................................................................... 127
5.5 Discussion............................................................................................................................... 130
Chapter Six - Contact Stiffness Determination
6 .1 Introduction............................................................................................................................133
6.2 Method for Interface Contact Stiffness Determination.............................................. 134
6.2.1 Stress-strain relationship method..................................................................................134
6.2.2 Experimental method.......................................................................................................135
6.2.3 Random process approach.............................................................................................. 137
6.2.3.1 Theory o f random process approach........................................................................ 138
6.3.Comparison o f the Three Methods..................................................................................146
6.4 Contact Stiffness Determination by The Random Process Approach................... 147
6.4.1..Measurement o f surface roughness o f the disc and the pad.................................. 148
6.4.2 Calculation o f autocorrelation function.......................................................................148
6.4.3 Results from the autocorrelation function o f the disc and pad sufaces.............. 150
6.4.4 Results o f the contact stiffness calculation.................................................................153
6.4.4.1 Effect o f friction material properties on contact stiffness................................... 156
6 .4.4.2 Effect o f disc material on contact stiffness.............................................................157
6 4 4.3 Effect o f disc rms roughness on contact stiffness.................................................158
6 .4.4 .4 Effect o f brake pad surface roughness on contact stiffness 159
6.4.5 Example o f nodal contact stiffness calculation......................................................... 160

Tabic o f contents vi
6.5 Discussion............................................................................................................................... 161
C h a p te r Seven - Stability Analysis of the Coupled Pad-Disc System
7.1 Introduction............................................................................................................................164
7.2 Methodology......................................................................................................................... 165
7.2.1 Interpretation o f complex eigenvalues........................................................................167
7.3 R esu lts .................................................................................................................................... 170
7.3.1 Effect o f contact stiffness , Kc.......................................................................................170
7.3.2 Effect o f support stiffness , K s.......................................................................................176
7 3 .3 Mode shapes.......................................................................................................................181
7.3 .4 Variation o f phase angle with contact stiffness......................................................... 186
7 4 Discussion............................................................................................................................... 1<)()
7.4.1 Low pressure range squeal.............................................................................................192
7.4.2 High pressure range squeal.............................................................................................197
C h ap te r Eight - P aram etric Studies O f The Coupled Pad-Disc System
8.1 Introduction........................................................................................................................... 202
8.2 Methodology......................................................................................................................... 203
8.3 Effect o f Friction Coefficient.............................................................................................203
8.4 Effect o f Abutment Stiffness.............................................................................................. 207
8.5 Effect o f Contact Stiffness Distribution......................................................................... 210
8.6 Effect o f Pad Flexibility.......................................................................................................215
8.7 Effect o f Different Disc Material......................................................................................217
8 8 Effect o f Disc Symmetry.................................................................................................... 223
8.9 Discussion............................................................................................................................... 232
C h a p te r Nine - Conclusions and Recom mendations
9 .1 Conclusions............................................................................................................................236
9.2 Recommendations for Future W ork............................................................................... 240
References.................................................................................................................................... 241
A ppendix I - Programme Listing for Contact Stiffness Calculation in C++.............. 250
A ppendix II - Input Data For Stability Analysis Using The
ANSYS Revision 5.0A Finite Element Analysis Package 256

Page vii
List of Figures
Figure 2.1 Sliding block on plane........................................................................................9
Figure 2.2a Block on sliding plane...................................................................................... 11
Figure 2.2b Kinetic friction coefficient as a linear function of sliding speed............ 1 1
Figure 2.3 Block on sliding plane.......................................................................................13
Figure 2.4 Sprag-slip model................................................................................................ 15
Figure 2.5 Slider model for analysis o f dynamic coefficient o f friction................... 18
Figure 2.6 Eight degrees o f freedom lumped parameter model o f a disc brake
system...................................................................................................................24
Figure 3.1 Exploded view o f the caliper assembly........................................................ 45
Figure 3.2 Schematic diagram o f the operation o f the sliding caliper disc brake..46
Figure 3.3 The brake pad and the abutment arrangement...........................................47
Figure 3 .4 Representation o f contact pressure effect using distributed contact
stiffness................................................................................................................50
Figure 3.5 Interaction o f two masses with friction effect included...........................51
Figure 3.6 A pad model coupled to the disc with friction elements......................... 51
Figure 3 .7 The effect o f normal displacement to the variable normal force...........53
Figure 3 .8 Simplified model o f the coupled pad-disc system and the forces acting
on the interface with friction.......................................................................... 55
Figure 3.9 Non-conservative follower forces on deformable surfaces.....................57
Figure 3.10 Follower friction force as applied to the two nodes on
the same surface.................................................................................................59
Figure 3.11 Friction counter-coupled model.................................................................... 60
Figure 3.12 Idealised pad model used by Hulten and the associated nodal
relationship with friction effect included..................................................... 61
Figure 3 .13 Discretization of the domain by 3 nodes triangular elements.................66
Figure 3 .14 Three dimensional body...................................................................................67
Figure 3.15 Schematic diagram o f a body with distributed mass
showing velocity components........................................................................71
Figure 4 .1 The cross-section dimension o f the disc.......................................................83
Figure 4.2 Angular definition in the modelling o f the disc.......................................... 83

List o f Figures viii
Figure 4.3
Figure 4.4
Figure 4.5
Figure 4.6
Figures 4.7(a)
Figure 4.8
Figure 4.9
Figure 4 .10(a)
Figure 4.11
Figure 4.12
Figure 4.13
Figure 5.1
Figure 5.2
Figure 5.3
Figure 5.4
Figure 5.5 (a)-
Figure 5.6 (a) ■
Figure 5.7
Figure 5.8
Figure 5.9
Figure 5.10 (a)
Figure 5 .11
The frequencies for the diametral modes o f the disc for various angular
definition o f the disc model and experimental results............................. 86
The effect o f the angular definition o f the disc model
on the wavefront size..................................................................................... 87
The finite element model o f (a) full disc with 3D solid elements
and (b) simplified disc using shell elements.............................................. 87
Results for full and simplified disc model compared to experiments . .88
- (g) 2nd - 8th diametral disc mode shapes........................................ 89 - 91
Schematic diagram o f the pad........................................................................95
Finite element model o f the pad..................................................................... 95
- (i) Pad mode shapes and equal displacment plot...........................96 - 99
Reconstructed hologram showing modes o f vibration of the disc......106
Reconstructed hologram showing modes o f vibration o f the pad......108
Comparison o f experimental and finite element
natural frequencies o f the pad.......................................................................112
Gap element and the normal force-deflection relationship................... 116
Actual position o f the paw and piston relative to the pad.....................117
Idealised point forces acting on the pad finite element model............. 117
Position o f the interface nodes on the pad friction surface.................. 119
(b) Nodal reaction force at the pad interface
under piston applied pressure.......................................................................120
- (b) Nodal reaction force at the pad interface
under paw applied pressure......................................................................... 121
The displacement o f the pad under piston applied pressure
and relative sliding......................................................................................... 122
Specific reaction force distribution for different
magnitudes o f line pressure (piston applied pressure)...........................124
Nodal reaction force at the pad interface
under piston applied pressure.......................................................................126
- (d) Contact force distribution for friction material modulus o f
1500 MPa, 4000 MPa, 8000 MPa and 10000 MPa respectively. 128-129
Standard deviation o f the contact force distribution for different

List o f Figures__________ ix
friction material Y oung’s modulus values.................................................130
Figure 6 .1 Deformation o f pad under normal load......................................................134
Figure 6.2 Schematic diagram for computing unknown support stiffness............135
Figure 6.3 Simplified model illustrating the experimental approach.......................137
Figure 6.4 Contact between a smooth surface and a rough surface.......................138
Figure 6.5 Idealised rough surface with each peak having
a spherical top with radius B differing only in height............................. 138
Figure 6.6 Variation o f dimensionless load (P/c) with dimensionless mean
plane separation according to equation 6.21............................................142
Figure 6.7 Variation o f the ratio F3/2 (h)/ F i/2(h) with
dimensionless mean plane separation......................................................... 142
Figure 6.8 Autocorrelation function of the disc surface roughness profile..........151
Figure 6.9 Decay constant o f the specific autocorrelation function o f the disc. .151
Figure 6 .10 Autocorrelation function o f the pad surface............................................. 152
Figure 6 .1 1 Decay constant o f specific autocorrelation function o f the p a d ......... 152
Figure 6 .12 Calculated contact stiffness for the pad-disc interface...........................155
Figure 6.13 Effect o f friction material modulus on the contact stiffness................156
Figure 6.14 Effect o f disc modulus on contact stiffness.............................................. 158
Figure 6.15 Effect o f disc surface rms roughness on contact stiffness.....................159
Figure 7.1 Active forces acting at the sliding interface and the schematic diagram
o f the coupled pad-disc system.................................................................... 166
Figure 7.2 The finite element model o f the coupled pad-disc system.................... 166
Figure 7.3 Compex eigenvalue and its conjugate on the s-plane............................. 169
Figure 7.4 (a) -(c) Argand diagram for complex conjugate eigenvector pair.............. 169
Figure 7.5 Eigenvalue plot for contact stiffness o f 100 M N/m................................171
Figure 7.6(a) Eigenvalue plot for contact stiffness o f 150 M N/m ................................172
(b) Eigenvalue plot for contact stiffness o f 200 M N/m................................172
Figure 7.7 The evolution o f the frequency and the real part
o f the unstable modes - baseline condition (Ks=24 M N/m)................178
Figure 7.8 The evolution o f the frequency and the real part
o f the unstable modes - baseline condition (Ks=2.4 MN/m) 179
Figure 7.9 The evolution o f the frequency and the real part

List o f Figures x
of the unstable modes - baseline condition (Ks=240 M N/m)............. 180
Figure 7.10 Mode shape for unstable mode A ............................................................... 183
Figure 7.11 Mode shape for unstable mode B............................................................... 183
Figure 7.12 Mode shape for unstable mode C ............................................................... 184
Figure 7.13 Mode shape for unstable mode D ............................................................... 184
Figure 7.14 Mode shape for unstable mode E ............................................................... 185
Figure 7.15 Mode shape for unstable mode F ............................................................... 185
Figure 7.16 The real part o f the eigenvalue and the phase difference between
normal displacement o f the outboard and inboard pad nodes and the
disc node for mode C .................................................................................... 188
Figure 7.17 The line pressure-frequency for both experimental
and analytical squeal modes......................................................................... 191
Figure 7.18 Reconstructed holographic image for low pressure squeal mode....... 195
Figure 7.19a Equal displacement contours on the disc for unstable mode C ...........195
Figure 7 .19b Equal displacement contours on the outboard pad
for unstable mode C .......................................................................................196
Figure 7 .19c Equal displacement contours on the inboard pad
for unstable mode C .......................................................................................196
Figure 7.20 Reconstructed holographic image for high pressure squeal mode......198
Figure 7.21a Equal displacement contours on the disc for unstable mode F...........198
Figure 7.21b Equal displacement contours on the outboard pad
for unstable mode F .......................................................................................199
Figure 7.21b Equal displacement contours on the inboard pad
for unstable mode F.......................................................................................199
Figure 8 .1 Unstable mode A .............................................................................................205
Figure 8.2 Unstable mode B .............................................................................................205
Figure 8.3 Unstable mode C .............................................................................................206
Figure 8.4 The overall unstable modes.......................................................................... 206
Figure 8.5 Unstable modes for abutment stiffness o f 2.4 kN/m.............................. 208
Figure 8.6 Unstable modes for abutment stiffness o f 2400 MN/m 209
Figure 8.7 Unstable modes for uniform contact stiffness distribution 213
Figure 8.8 Unstable modes for trailing edge biased stiffness distribution............. 214

List o f Figures _____________________________ ^
Figure 8.9 Unstable modes for inflexible pads.............................................................215
Figure 8 . 10 Unstable modes for Aluminum metal matrix composite disc.............. 220
Figure 8 .11 Unstable modes for a disc with very high Young’s modulus.............. 221
Figure 8 .12 Unstable modes for an inflexible disc........................................................ 222
Figure 8.13 Effect o f number o f slots on the frequency differenceof the disc
diametral modes.............................................................................................. 226
Figure 8 .14 The finite element model o f the slotted disc
showing the slots positions.......................................................................... 226
Figure 8 .15 Displacement contour plot o f the lower sixth diametral mode for a six
slot disc.............................................................................................................. 227
Figure 8 .16 Displacement contour plot o f the upper sixth diametral mode for a six
slot disc.............................................................................................................. 227
Figure 8.17 Unstable modes evolution for zero angle o f relative rotation............. 230
Figure 8 .18a Variation o f maximum real part o f modes M and N with
relative angle o f rotation............................................................................... 231
Figure 8 .18b Variation o f maximum real part o f modes M and N with
relative angle o f rotation............................................................................... 231

Page xii
List of Tables
Table 4.1 Comparison between full model and simplified model o f the disc......83
Table 4.2 Frequencies o f the first eight diametral modes for the free-free disc . 105
Table 4.3 The experimental mode shapes and natural frequencies o f the
brake pad............................................................................................................110
Table 5.1 Maximum reaction force and standard deviation for
different abutment arrangements.................................................................125
Table 6 .1 Results from the roughness measurement o f the disc and pad............153
Table 6.2 Material data and results from calculation................................................153
Table 6.3 Material properties for the disc................................................................... 157
Table 6.4 Calculated parameters for different pad surface rms values.................160
Table 7.1 The components o f the eigenvector and phase angle o f the selected
normal displacements for different values o f contact stiffness............ 187
Table 8 .1 Free-free modes for the Al- MMC disc......................................................218
Table 8.2 Free-free modes for disc with E=8000 G Pa............................................. 218
Table 8.3 Free-free modes for disc with E= 120x10 GPa 218
Table 8.4 Frequencies o f the free-free diametral modes for a slotted disc..........224

Page xiii
Acknowledgements
I would like to express my sincere thanks to my two supervisors , Professor D A.
Crolla and Dr. D C. Barton for their valuable guidance, support, encouragement and
training given throughout this research work. I would also like to acknowledge the
support from Dr P C Brooks for the time spent for teaching me ABAQUS and
supporting ANSYS. I would also like to express my gratitude to the Government of
Malaysia for the funding.
An acknowledgement is due to Mr R M. Martin, the Chief Technician and Mr. D
Readman for their great sense o f humour and timely help. 1 would also like to thanks
everyone in the Brake Group for the beneficial discussion.
I should like to show my deepest appreciation to my family for their endless help
and encouragement given over such a long period o f time especially my parent who has
tried their best in providing me with the best education. A special appreciation to my
beloved wife Norshamshida for all the care and understanding throughout these long and
hard years and to my two daughters, Aminah and Maryam - all o f whom has made life in
this foreign country bearable.
Finally to everyone I knew, whose names are too many to be listed, thanks for
the memory.

Page xiv
Declaration o f Originality
The problem of disc brake squeal has been examined by developing a finite element
model o f the coupled pad-disc system , conducting complex eigenvalue analysis and
associating unstable modes with potential squeal problem areas. A key issue in this
process is the representation o f the contact pressure distribution at the frictional
interface between the disc and the pad. Non-linear contact analysis using the finite
element model o f the pad revealed that contact is only partial at the pad-disc interface
and that the contact pressure distribution depends on the friction coefficient. Young’s
modulus o f the friction material and the way the applied pressure is distributed on the
pad backplate. A new method is proposed in which interface contact stiffness is related
to brake line pressure using a statistical approach based on the measured surface
properties o f the interface. Complex eigenvalue analysis o f the coupled pad-disc
system has shown that unstable modes exist within different ranges o f contact stiffness
thereby providing an explanation o f the effect o f varying line pressure on squeal. The
two most unstable modes from the analysis show good correlation with experimental
squeal results. This therefore provides some explanation towards the reason why
squeal tends to occur under low pressure actuation. This area o f disc brake squeal
modelling will add to the present body o f knowledge on squeal and the parameters
affecting it.

Page xv
General Layout and Presentation
The thesis is presented in accordance with the regulations o f the University of
Leeds. All symbols and nomenclature, where possible, are in accordance with general
and consistent usage and are fully defined at their first appearance. Equations, figures
and tables are identified by the chapter number in which they occur and by a second
number denoting the order in which they appear in the chapter. Figures and tables are
bound into the thesis near the appropriate text. References cited in the work are listed at
the end o f the thesis and are numbered according to the order they appear in each
chapter. Pages are numbered consecutively throughout the thesis including figures and
tables.

CHAPTER ONE
INTRODUCTION
Page 1
1.1 Background
The problem o f brake noise is in general related to comfort and refinement rather
than to safety or performance. Increased refinement in other parts o f the car such as
suspension, passenger compartment acoustics and transmission has turned attention to
noise emanating from the brake. Legislation relating to noise level however is limited to
continuous noise sources and therefore does not cover the intermittent nature o f brake
noise. Nevertheless the ideal solution in the form o f a silent brake would help to bring
about a better environment and reduce noise level particularly in places where stopping
frequently occurs - the ubiquitous noise from bus brakes for example.
The vibration problem o f a disc brake can in general be divided into two
categories. The first is judder which is felt rather than heard as it occurs typically at
frequency below 100 Hz. The second is noise which occurs as a result o f self-excited
oscillation or dynamic instability. This second type o f noise is generally described as

Chapter One - Introduction 2
‘squeal’ or ‘squeak’ or ‘moan’ [1], Squeal is commonly associated with noise involving
transverse modes o f the disc which in general exists at above 1 kHz.
In economic terms the general problem of persistent brake noise may lead to high
warranty costs and disc brake noise contributed to the majority o f the brake faults in a
recent survey [1], In another study disc brake squeal tends to occur more frequently in
European cars [2], The most recent survey carried out by a consumer magazine ‘Which’
[3] where over 100 different brands o f cars were tested indicated that squeal still exists
as a potential fault for consumers to watch out for when buying used cars. The report
also confirms that the major o f brake noise problems can be found in continental cars.
As the market for mass produced cars becomes ever more competitive, profit
margins reduce resulting in manufacturers venturing into the luxury car market in which
the margin is higher This market requires much higher levels o f refinement . However
one o f the best selling luxury cars is still facing a disc brake squeal problem even though
research into the problem has been going on for quite sometime [4],
For the above reasons there is every impetus to reduce disc brake squeal . In
particular research into understanding and modelling disc brake squeal may prevent
costly post-production modifications. Mathematical modelling o f the squeal problem has
indeed been identified as one o f the major means by which understanding and solution o f
the problem could be further advanced [1], A recent article by Smales [5] recognised the
fact that it is uneconomic in terms o f cost and time to fix problems which occur at the
prototype stage rather than to design ‘right first time’ . Further fixes are usually
developed retrospectively by empirical processes which are again expensive in terms o f
manpower and the manufacturer’s reputation. Thus Smales proposed the use o f
predictive modelling based on the finite element method rather than the alternative
lumped parameter approach which is difficult to apply to actual brake design since it is
unable to model flexural effects.
The advent o f powerful digital computers facilitates the application o f the finite
element method in modelling the disc brake squeal problem as exemplified by Liles [6 ]
who employed the MSC Nastran finite element software and used the real part o f the
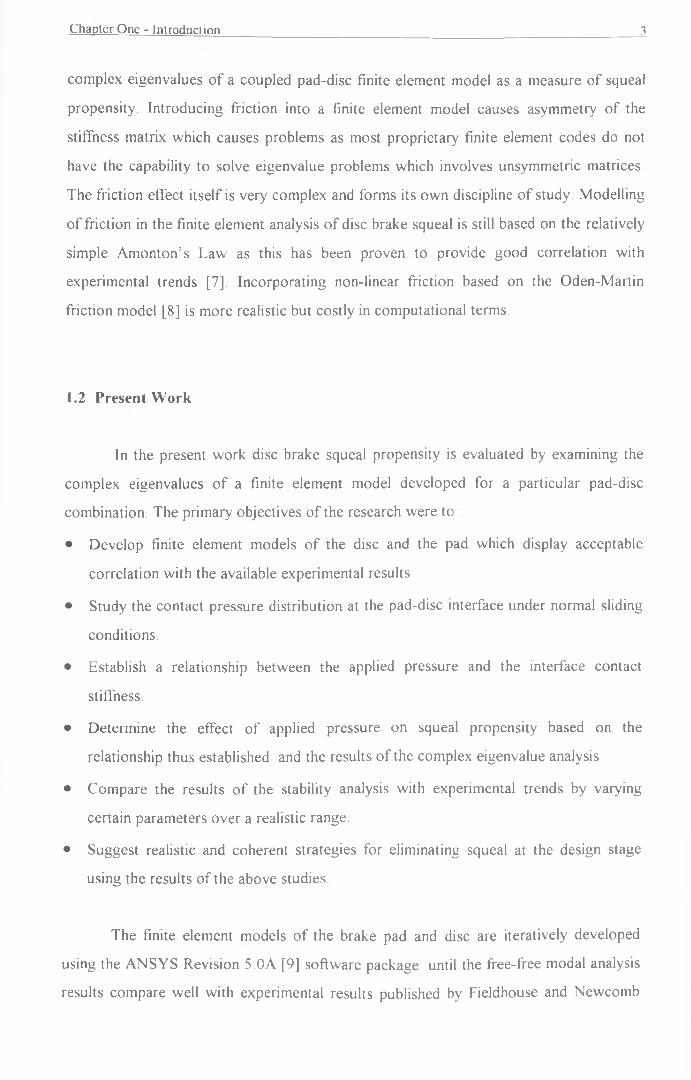
Chapter One - Introduction 3
complex eigenvalues o f a coupled pad-disc finite element model as a measure o f squeal
propensity. Introducing friction into a finite element model causes asymmetry o f the
stiffness matrix which causes problems as most proprietary finite element codes do not
have the capability to solve eigenvalue problems which involves unsymmetric matrices.
The friction effect itself is very complex and forms its own discipline o f study. Modelling
o f friction in the finite element analysis o f disc brake squeal is still based on the relatively
simple Amonton’s Law as this has been proven to provide good correlation with
experimental trends [7], Incorporating non-linear friction based on the Oden-Martin
friction model [8] is more realistic but costly in computational terms.
1.2 Present Work
In the present work disc brake squeal propensity is evaluated by examining the
complex eigenvalues o f a finite element model developed for a particular pad-disc
combination. The primary objectives o f the research were to :
• Develop finite element models o f the disc and the pad which display acceptable
correlation with the available experimental results.
• Study the contact pressure distribution at the pad-disc interface under normal sliding
conditions.
• Establish a relationship between the applied pressure and the interface contact
stiffness.
• Determine the effect o f applied pressure on squeal propensity based on the
relationship thus established and the results o f the complex eigenvalue analysis.
• Compare the results o f the stability analysis with experimental trends by varying
certain parameters over a realistic range.
• Suggest realistic and coherent strategies for eliminating squeal at the design stage
using the results o f the above studies.
The finite element models o f the brake pad and disc are iteratively developed
using the ANSYS Revision 5.0A [9] software package until the free-free modal analysis
results compare well with experimental results published by Fieldhouse and Newcomb

Chapter One - Introduction 4
[10] The finite element model o f the pad is then used for contact pressure analysis using
the ABAQUS [11] package as it is more suitable for the non-linear contact analysis
required. The resulting contact pressure distribution is next linked to the distribution o f
interface contact stiffness using a random process approach which takes account o f the
material and surface roughness properties at the interface.
The disc and pad finite element models are then coupled with the contact stiffness
distribution at the interface based on the predicted contact pressure distribution under
steady state sliding conditions. Contacts between the pad and external bodies such as the
piston and abutments are approximated with stiff springs. With the inclusion o f friction at
the sliding interface, the stiffness matrix becomes unsymmetric which results in complex
eigenvalues, the positive real part o f which is used as a measure o f squeal propensity.
Parameters relating to the brake system are varied in order to determine the overall effect
o f pressure on squeal propensity and also to determine methods by which the parameters
responsible for squeal can be isolated. The trends from this parameter study are
compared with other published work.
1.3 Thesis Organisation
This thesis is divided into eight further chapters as follows
Chapter Two comprises a literature review on the subject o f brake noise in
general and disc brake squeal in particular.
Chapter Three discusses the methodology o f disc brake squeal modelling and
provides the overall framework o f the present analysis.
Chapter Four concentrates on the free-free modal analysis o f the two major
components o f the disc brake system (the pad and the disc) with the results compared
with reconstructed experimental holographic images from experiments.

Chapter One - Introduction 5
Chapter Five discusses analysis o f the contact pressure distribution between the
pad and the disc using the finite element method and the parameters affecting it.
Chapter Six covers the random process approach used to link the applied
pressure to contact stiffness via the surface material and roughness properties.
Chapter Seven discusses the stability analysis o f the coupled pad-disc system
using complex eigenvalues and concentrating on the effect o f applied pressure on squeal
propensity.
Chapter Eight reports the parametric studies o f the coupled pad-disc system to
determine the extent to which each parameter investigated affects the system squeal
propensity.
Chapter Nine summarises the results and conclusions o f the present work.
Recommendations for further work are also presented in this chapter.

Page 6
CHAPTER TWO
LITERATURE REVIEW
2.1 Introduction
Brake noise has been a problem since the introduction o f friction brakes. In
motor vehicle applications , the increase o f passenger comfort resulting from systematic
studies on the transmission , the handling and suspension systems and the acoustics of
the passenger compartment has brought the brake noise problem to the fore due to the
risks o f increased warranty costs and reduced product marketability as discussed in
Chapter One.
In the present c h a p te r , a series o f studies on disc brake noise are discussed , in
particular the understanding o f disc brake squeal mechanisms using various mathematical
models from relatively simple one degree-of-freedom models to multi degree-of-freedom
models. Some o f the work is based on the simple strut on disc apparatus in order to
make the system more amenable to analysis and to explain the more general problem of
friction excited vibration. Past work on the full disc brake system which provides more

Chapter 2 Literature Review 7
insight into realistic situations is also discussed. This in total provides an overall picture
o f disc brake squeal mechanisms and the underlying explanations.
2.2 Definitions
The noise emanating from a disc brake covers the whole range o f audible
frequency and different mechanisms and components may be responsible for each type o f
noise. Although the present study is aimed at disc brake squeal, it is important to see
squeal as a sub-problem o f the wider more general brake noise problem. Therefore brief
definitions o f the various types o f disc brake noise based on the work o f Lang and
Smales [12] are listed below
a) Judder - very low frequency non-resonant vibration caused by disc rubbing
path non-uniformity resulting from circumferential thickness variation.
b) Groan - semi-resonant vibration with frequency typically less than 100Hz.
May involve rigid body rotational modes o f the caliper and local suspension
parts.
c) Hum - frequency typically in range o f 200Hz - 400Hz with rigid body motions
as for groan.
d) Squeal - Vibration involving transverse disc modes. If the squeal mode
frequency is lower than the first bending mode frequency o f the pad , it is
considered as low frequency squeal. Higher frequency modes are sometimes
referred to as squeak.
e) Squelch - amplitude modulated version o f squeak.
f) Wire brush - periodic and at squeak frequency but with random amplitude
modulation.
Squeal is sometimes defined as any brake noise o f over 1 kHz frequency. This is
generally true as usually the transverse disc modes begin at about 1 kHz. In the present
work squeal is considered as defined in (d).

Chapter 2 Literature Review 8
2.3 Squeal Models
2.3.1 Early work
The problem o f brake squeal was studied as early as 1935 when Lamarque [13]
collected the experience o f manufacturers and operators on the causes and prevention of
squeal in drum brakes. A catalogue o f preventive methods were listed , including the
clamping o f steel bands lined with woven asbestos around the drum periphery
supposedly to damp the vibration o f the drum.
Fosberry and Holubecki [14] began a systematic attempt to understand the
nature o f brake squeal in 1955 and started with the idea o f squeal as a result o f
oscillation caused by increasing friction coefficient with decreasing speed. The
hypothesis was tested by roughening the surface o f a brake lining artificially treated with
graphite and mineral oil to alter the friction-velocity characteristics. The results did not
show any clear relationship between the friction-velocity characteristics and squeal.
Measurements using short linings, however, showed an increase in brake torque at the
near stop conditions for a squealing brake. Due to the unavailability at that time o f
friction material with static friction coefficient equal to or less than the kinetic friction
coefficient, they suggested improved damping o f either the drum or shoes as one way to
remedy squeal.
The suggestion above resulted in the subsequent work reported in 1957 [15]
where friction dampers attached to the drum proved to be effective in reducing squeal on
buses.The extension o f this work to brake shoes followed [16] even though the friction
damper on the shoe was found to be effective only for low frequency squeal occuring at
less than 3 kHz. The work also began to classify general brake noise into the various
frequency classifications o f ju d d e r , hum ,squeal and wire brush. At this time discussion
had already begun on the energy input into the system due to the friction-velocity
characteristic o f the lining. In 1961 , Fosberry and Holubecki suggested that disc brake
squeal was also caused by either static friction that was higher than the kinetic friction or
kinetic friction which increased with decreasing speed [17], The disc brake squeal
Chapter 2 Literature Review 9
frequency was found to be the same as the frequency o f the disc in the clamped
condition and a "fix" in the form o f dished laminations between the pad backplate and
the caliper piston was proposed as a means to alleviate squeal. However, there was no
explanation as to how the fix actually worked.
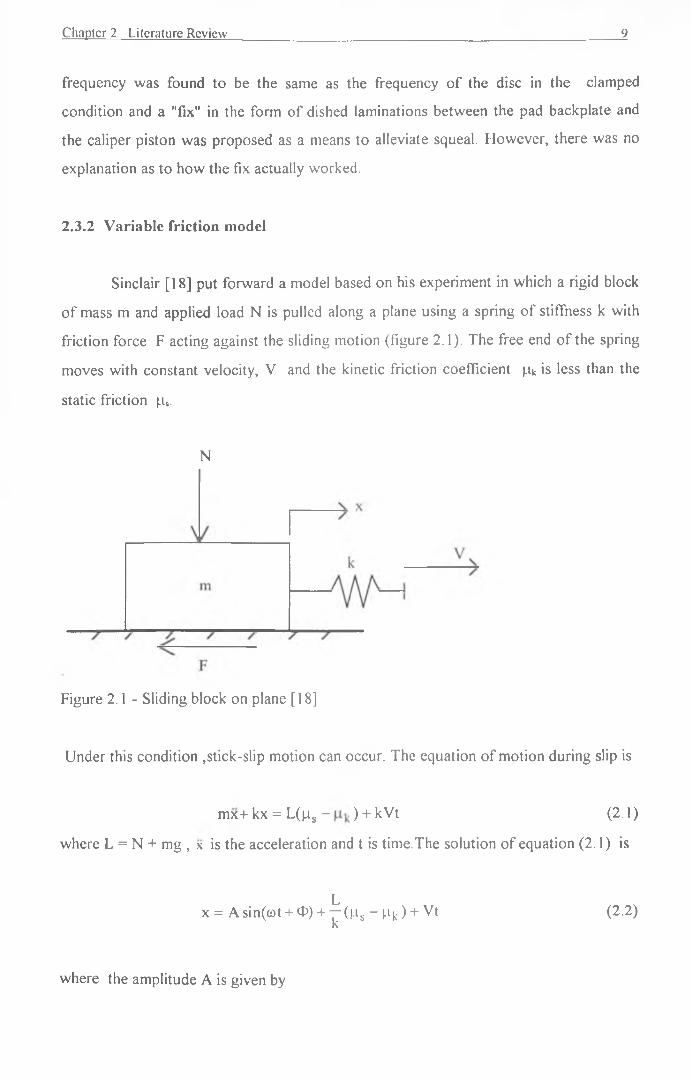
2.3.2 Variable friction model
Sinclair [18] put forward a model based on his experiment in which a rigid block
o f mass m and applied load N is pulled along a plane using a spring o f stiffness k with
friction force F acting against the sliding motion (figure 2.1). The free end o f the spring
moves with constant velocity, V and the kinetic friction coefficient (.ik is less than the
static friction (j.s.
N
Figure 2.1 - Sliding block on plane [ 18]
Under this condition ,stick-slip motion can occur. The equation o f motion during slip is
mx+ kx = L(|.is - ) + kVt (2.1)
where L = N + mg , x is the acceleration and t is time.The solution o f equation (2.1) is
Lx = Asin(cot + 0 ) + —(|AS - |- ik ) + Vt (2 .2 )
k
where the amplitude A is given by

Chapter 2 Literature Review 10
A = (^-(^is -Hk)2 + \ ) V2 ( 2 3 )K Q)
and the natural frequency co and the phase angle O are given by
c o = J I and ta n O = ^ ( | i , - } i k) (2.4)V m kV
From equation (2.3) the amplitude o f oscillation increases with the difference between
the static and kinetic friction , the applied velocity and the normal force. Considering the
special case when the static and kinetic friction coefficients are equal , this would result
in steady oscillation without sticking which in practice will disappear due to damping.
From equation (2.4) the natural frequency o f the system is shown not to be influenced by
the friction coefficient, however, the associated phase angle is very much affected by the
difference between the static and kinetic friction coefficient. The experimental
observation showed that stick-slip motion only occurred when the applied velocity was
reduced to a few hundredths o f a meter per second and the response changed to uniform
sliding as the velocity was increased. Wetting the surface resulted in a decrease o f
kinetic friction coefficient causing the amplitude to increase as predicted by equation
(2.3). From this model , Sinclair concluded that the tangential oscillatory motion o f the
brake lining was caused primarily by ns > |ik and that decrease o f nk with speed is
the reason for brake squeal. The model proposed, however, predicted squeal amplitude
increasing with the rubbing speed as shown in equation (2.3), which is generally not
true for squeal.
Measurement o f the coefficient o f friction and velocity characteristics o f lining
materials was carried out by Basford and Twiss [19], They found cyclic vibrations o f
the apparent friction with the amplitude and frequency o f the oscillations dependant on
the mass and stiffness o f the sample and mounting system. From this they suggested a
squeal model as shown in figure 2 .2a.

Chapter 2 Literature Review
> V
Figure 2.2a - Block on sliding plane [19]
Kinetic friction coefficient
Figure 2.2b - Kinetic friction coefficient as a linear function o f sliding speed
Figure 2.2a shows an elastic block o f mass m is rigidly held with load L acting
normal to the sliding plane moving at a constant sliding speed o f V and held against a
moving surface with the friction force causing shear and displacing the block friction
face by x, measured positive in the direction o f sliding. The thickness o f the friction
block is given by h. In the model the kinetic friction is assumed to decrease linearly with
the rubbing speed,
Mk = H s - a ( v - * ) (2.5)

Chapter 2 Literature Review 12
where a is the gradient o f the friction-relative velocity curve as shown in figure 2 .2b.
The equation o f motion o f the friction surface is ;
nix - HfcLx + G — = L(|is - aV )..... (2-6)h
where m=block mass per contact area
G=elastic shear modulus
L=normal load
Equation (2.6) is derived by assuming that shear angle due to the displacement o f the
pad surface x can be approximated (at small angle) using the elastic shear modulus o f the
friction material.
The solution o f this equation when neglecting the particular integral is
x = Aexp[(aLht / 2m)sin((4Gm / h - a 2 L2 ) 0'5 — + B)]2 m
t(2.7)
where A and B are integration constants. From equation (2.7) , squeal occurs when x
increases with time indicating oscillations with growing amplitude. This happens when
the exponential term is positive i.e. the coefficient a is positive. Therefore from equation
(2.5) the kinetic friction coefficient must decrease with increasing relative velocity in
order to produce instability.
Equation (2.7) was then used by Bassford and Twiss [19] to determine an
expression for the probability o f noise from a lining as below :
P =aL ^
^ J 6XP1 2 a 2cod - 47nn
4Gm \l/2^- a L (2.10)
where c - constant
cod - drum natural frequency

Chapter 2 Literature Review 13
ct- width o f frequency band which induces drum resonance
Experiments using four linings partially verified the above equation with the squeal
occurrence increasing with the noise probability p and the elastic shear modulus G. The
model developed by Basford and Twiss has a definite advantage over the Sinclair model
because it takes into account the slope o f the friction coefficient-velocity curve and
therefore allows for different noise behaviour for similar values o f static friction.
Wagenfiihrer [20] introduced a very similar model to Sinclair but which allowed
a non-linear variation o f the friction coefficient-velocity curve. In this model (figure 2.3)
, a block is loaded against a sliding plane and restrained by a spring and damper.
Figure 2.3 Block on sliding plane [20]
Oscillations o f the block were considered to be stick-slip due to m-s > M-k - The expression
for kinetic friction was found from experiment to be :
(2.11)
where d and nh are constants for a given friction material. The equation o f motion for
the system is

Chapter 2 Literature Review 14
mx + cx + kx = ±L He “ »-lh l + d ( V - x ) +Mh
(2.12)
the (+) sign being for V>X and the (-) sign for V < x . The analysis showed that
increasing the damping stabilised the system. The condition for continuous oscillation is
fulfilled when the total energy o f the system increases with time (i.e. dE/dt > 0 ). This
condition then reduces to
____Ld(n, Hh)____ (2 g) (l + dV)( l + d ( V - y ) ) _______________________________________ '
where V; is the initial velocity o f the block. The above expression shows that large
differences between the static and kinetic friction coefficient , large normal loads and
low sliding speeds will all enhance squeal.
2.3.3 Sprag-slip model
Up to this point in time , all squeal models proposed were single degree o f
freedom blocks with a common instability mechanism o f decreasing friction coefficient
with increasing sliding speed and with squeal favouring a large normal load.
The introduction o f the sprag-slip model by Spurr [21] gave brake squeal an
added instability mechanism. The model is shown in figure 2.4.

Chapter 2 Literature Review 15
O'
■> v
O"
Figure 2.4_- Sprag-slip model [21]
OP is a rigid strut pivoted at O and loaded at P against a sliding surface AB The friction
force for a rigid pivot O is:
F = ^kL(1 - nk tanO)
(2.14)
Thus the friction force will approach infinity as cotG approaches n k . At the sprag angle
0 = arccot(}.ijc) , further motion is impossible.
For the motion to continue , the pivot at O is elastically displaced to O' causing
an increase o f the angle 0 to 0'. This will cause the friction force F to fall thus
allowing the strut to return to its initial position due to its elasticity. The motion then
repeats itself and as long as the sliding motion is available to energised the system the
strut OP will continue to oscillate. With this model variation o f friction coefficient with
sliding speed is unnecessary for instability. Various experimental evidence was used by
Spur to support this theory ; in relation to disc brake squeal , a contact area forward o f
the piston support (pivot) was achieved by grinding a double taper on the pad and
squeal was achieved when the imaginary line joining the contact area and the pivot was
at the sprag angle. The great advantage o f Spur's model is that it is relatively easy to
understand.

Chapter 2 Literature Review 16
2.3.4 Pin-on-disc models
2.3.4.1 Friction induced self-excited oscillations.
In this section the focus is on friction induced self excited vibration which has
been mostly studied using pin-on-disc experiments. The models derived therefrom form
much o f the basis o f the present understanding o f disc brake squeal. In general friction
induced vibrations can be divided into two major categories
a) stick-slip vibration where the displacement versus time curve is o f a saw tooth form
b) quasi-harmonic vibration where the displacement versus time curve is o f sinusoidal
form.
The idea o f friction as uniform and steady throughout any vibratory process was
shown to be untrue by Lienkewicz [22], He demonstrated the effect o f vibration in
reducing the static friction coefficient and damping out stick-slip motion. Lo and
Brockeley [23] showed the need to take into account the vibration effect during the
measurement o f kinetic friction coefficient since an averaging technique does not
indicate the true friction coefficient. For the quasi-harmonic friction induced vibration ,
they used a model similar to Sinclair [18], The phase-plane analysis indicated a stable
limit cycle and adequate damping was shown to eliminate the vibration.
A study by Aronov et. al. [24] showed both low and high frequency friction
induced vibration depended upon the system rigidity. There is a critical normal load
when self excited oscillations occur. A higher system rigidity would require higher
critical normal load. The oscillation frequency also increases with the system rigidity.
Low frequency oscillations occur only in the friction direction while high frequency
oscillations occur due to the coupling between the frictional and normal degrees o f
freedom.
Soom and Kim [25] proposed a very useful concept o f variable friction
coefficient. They began with the argument that normal vibrations could be excited either

Chapter 2 Literature Review 17
by external oscillatory forces or by surface roughness including waviness o f the surface.
They measured the frequency domain transfer function between the frictional (output)
and normal (input) forces and found good coherence around the contact resonance. The
instantaneous coefficient o f friction with time could then be written as
(215>FN (t) N + fN(t)
where ]I is the average value o f the friction coefficient and ]I(t) is the fluctuating
component. Also jl= (.iK where | iK is the kinetic coefficient o f friction. The instantaneous
oscillatory friction coefficient could then be defined as
fF (0 l-l(0m , ) = w o = M k + w o ^ ( 2 1 6 )
If n(t) is proportional to and in phase with fN (t) , the dynamic coefficient o f friction
j.iD will be higher than the averaged kinetic coefficient o f friction (,iK.
Continuing the same work , Soom and Kim [26] analyzed a slider model as
shown in figure 2.5. The contact stiffness ks was calculated from Hertzian theory The
equation o f motion in the y-direction could be written as
my + c s ( y - y ie) + k s( y - y ic) = o (2 1 ? )
In the case o f the weight loaded condition ,
fN (t) = - m y (2.18)

Chapter 2 Literature Review 18
y
Figure 2.5 - Slider model for analysis o f dynamic coefficient o f friction [26],
In this case the dynamic coefficient o f friction was found to be approximately 1.4 times
higher than the steady kinetic coefficient o f friction and independent o f average load
(weight loaded only) , sliding speed and surface roughness. The normal and frictional
forces were found to be in phase and the amplitude ratio was found to be independent o f
frequency.
In their experimental work Dweib and D'Souza [27] found 4 distinctive regions
o f friction behaviour as the normal load was increased , namely :
1. Linear region - |.iK constan t, F linear with N
2. Non-linear region - F non-linear with N , tangential natural frequency
dominant
3. Transient region - irregular and brief self-excited oscillations
4. Self-excited region - periodic self-excited vibrations , amplitudes are much
h igher , average value o f friction force F remains constant.

Chapter 2 Literature Review 19
In the self-excited region , the slider vibrates in the various directions (lateral ,
normal and rotating) at the same fundamental frequency which is close to its torsional
natural frequency. Dweib and D'Souza estimated the contact stiffness o f the non-
Hertzian contact experimentally by deducting the no-contact natural frequency from the
in-contact natural frequency , the difference between which was assumed to come from
the added stiffness from the contact. In subsequent work [28] they analyzed the effect o f
various parameters on the critical normal load for instability. In general , higher normal
or torsional stiffness required higher critical normal load which indicated coupling o f
normal and torsional modes as the cause o f instability. Therefore separation o f these
modes would increase the stability o f the system.
A series o f studies on frictional noise was carried out by Yokoi and Nakai using
a rod pressing on the circumferential face o f a steel disc. In the first study [29] , the
noise generated came from bending vibration o f the rod only because o f the relatively
thick disc used. Scanning electron micrography showed that , in the case o f ordinary
rubbing noise , the surface o f the rod is relatively rough and as it wears and squeal
occurs the surface becomes smooth. Measurements o f the friction coefficient-velocity
curve o f the pair showed a shallow trough and squeal noise could even be generated
with friction coefficient increasing with velocity. This was explained using an
instantaneous value o f friction coefficient (.i, dependant on the relative sliding speed v r
which in turn has a relationship o f the form vr = v -u* , where v is the tangential speed
o f the disk circumferential face and u* is the instantaneous velocity o f the rod tip. The
instantaneous friction coefficient versus relative sliding speed curve was shown to form
a loop the negative gradient part o f which would cause squeal to occur.
A subsequent study [30] used a longer rod to produce higher modes o f squeal
noise. Higher squeal modes were shown to be generated when the real area o f contact
between the disk and the rod is relatively large with the axial vibration o f the rod
increasing with the noise and the fundamental bending mode being damped out.

Chapter 2 Literature Review 20
The effect o f surface roughness was studied in a further paper [31] which
showed that sound pressure level increased with roughness to the power o f 0.8. The
effect o f angle o f inclination was studied in [32] and the frequency o f the noise generated
was found to increase with the angle for positive angle i.e. the rod inclined towards the
direction o f rotation. For negative angles , an unstable condition develops resulting in
chatter as digging-in occurs.
Tworzydlo et al [33] analysed the friction induced dynamic instability o f a pin-
disc system.This included a very comprehensive study o f dynamic friction which is
shown to be a function o f the properties o f the interface and the dynamic characteristics
o f the system. The friction coefficient was calculated on the basis o f the Oden-Martin
model [8 ] which took into account the normal approach indentation (and thus the
stiffness ) and its time derivative ( damping ) and the approaching phase o f the normal
motion. Obviously the approach used here is non-linear. A matter o f interest was the
squeal problem which was categorized under the group o f instabilities where the
dynamic characteristics are important. Using a model o f the pin-disc system , the stability
o f the system was determined by transient analysis and by linearized equations o f
motion reduced to the form o f an eigenvalue problem. The eigenvalue analysis showed
coalescence o f rotational and translational modes o f the pin when moving into the self
excited region and divergence into two separate modes when the system stabilizes which
occured with increase in normal load. Higher friction coefficient would initiate instability
at a lower normal load. There were also other unstable modes for the different
components (pin and block) which occurred independently and at different frequencies.
The transient analysis o f [33] showed that sufficiently large disturbances can
cause self-excited oscillation o f the system , which may initially be shown to be stable
from a linearized eigenvalue analysis.The transient analysis o f the non-linear equations o f
motion o f the system also indicated an apparent drop in the kinetic friction (predicted
from the angular displacement) after the self-excited oscillations reached a certain
amplitude. Tworzydlo et al listed two important mechanisms which limit the unstable
growth o f the oscillation in the self-excited zone :
Chapter 2 Literature Review 11
a) micro stick-slip motion o f the pin which tends to alter the rotational frequency
o f the slider
b) normal jump o f the slider which tends to alter the normal frequency.
The system was also shown to be sensitive to the angle o f inclination , instability
favouring the digging-in position (an acute angle measured from the direction o f sliding
plane).
Swayze and Akay [34] studied a two degree o f freedom pin on a slider using
phase-plane analysis. The results showed that an increase in friction coefficient would
move the equilibrium point further away from the origin until , at a critical value o f
friction coefficient , the origin o f the phase plane is no longer the equilibrium point.
Higher torsional stiffness and damping increases the stability o f the system. Interestingly
the analysis demonstrated how the critical friction coefficient could be obtained from
the moment equilibrium condition , and that it is inversely proportional to the aspect
ratio o f the pin.
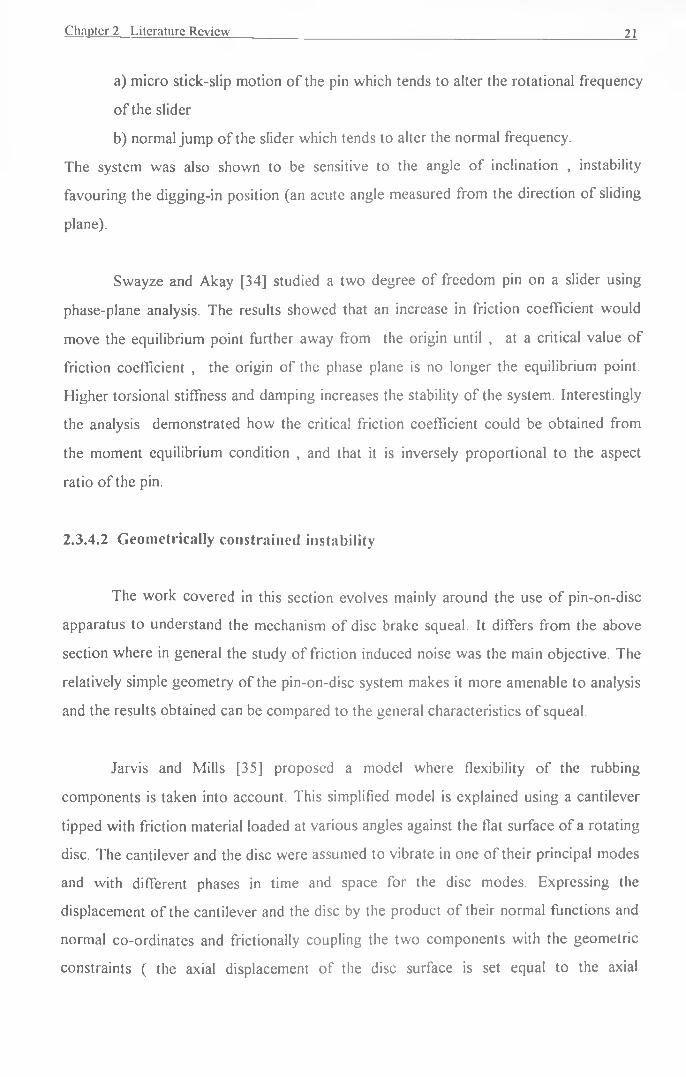
2.3.4.2 Geometrically constrained instability
The work covered in this section evolves mainly around the use o f pin-on-disc
apparatus to understand the mechanism o f disc brake squeal. It differs from the above
section where in general the study o f friction induced noise was the main objective. The
relatively simple geometry o f the pin-on-disc system makes it more amenable to analysis
and the results obtained can be compared to the general characteristics o f squeal.
Jarvis and Mills [35] proposed a model where flexibility o f the rubbing
components is taken into account. This simplified model is explained using a cantilever
tipped with friction material loaded at various angles against the flat surface o f a rotating
disc. The cantilever and the disc were assumed to vibrate in one o f their principal modes
and with different phases in time and space for the disc modes. Expressing the
displacement o f the cantilever and the disc by the product o f their normal functions and
normal co-ordinates and frictionally coupling the two components with the geometric
constraints ( the axial displacement o f the disc surface is set equal to the axial

Chapter 2 Literature Review 22
displacement o f the cantilever ) , the Langrange's equations o f the system could then be
derived , the solution o f which indicated the system stability.Overall stability o f the
system was found to be dependant on the damping , geometric configurations (length o f
cantilever and slope angle) and friction coefficient. The authors predicted a stability
radius for a given configuration but the experimental agreement was poor. Later Hales
[24] showed how the agreement could be improved by taking account o f the radii o f
both the cantilever tip and the area o f contact in the analysis. The Jarvis and Mills model
showed how instability can arise from the geometry o f the coupling o f the rubbing
surfaces and showed how instability could be avoided by the use o f favourable
configurations.
Earles and Soar [37] began a series o f experiments with the pin-on-disc
apparatus. They observed during squeal that the pin support beam always oscillated in a
torsional mode. The fundamental frequency o f the squeal did not coincide with the
natural frequencies o f the components but varied with radius o f contact and angle o f
inclination o f the pin. They rejected the variation o f friction coefficient with velocity as
the cause o f squeal because squeal was found to be independent o f speed. They
therefore deduced that the kinematic-constraint instabilities were the principal cause o f
squeal.
Further work by [38] on the same apparatus was done by limiting the analysis to
linear equations while the system was considered to be continuous. The model predicted
squeal frequencies for the system in good agreement with experiment. Different modes
o f the pin were found to excite different modes o f the disc with the translational mode o f
the pin exciting the second diametral mode o f the disc and the rotational mode exciting
the third diametral mode.
The complexity o f the analysis increased in the subsequent work by Earles and
Lee [39] where the degees o f freedom o f the model were increased to three
(translational x and y , rotational). Deriving the equations o f motion o f the system
resulted in a set o f equations o f the form o f ap 2 + b(3 + d = 0 , from which instability
could be predicted. Again the predicted region o f instability correlated well with

Chapter 2 Literature Review 23
experiment , with the different shape o f the region attributed to the higher experimental
friction coefficient o f 0.6 compared to the coefficient o f 0.4 that was modelled. It is
interesting to note that this work predicted a narrow range o f preferred stiffness o f the
beam and disc for squeal to occur.
The work continued with the added complexity o f a double pin and disc system
[40], Each pin had two degrees o f freedom (translation and rotation ) with a single
degree o f freedom for the disc. The equations o f motion derived were used to obtain the
characteristic equations and the Routh-Hurwitz criterion was applied to determine the
stable boundary. The predicted envelope agreed well with experiment. The primary
parameters found to affect the system stability were friction coefficient, disc stiffness and
pin support torsional stiffness. The complex relationship between the system parameters
was cited as the reason for the fugitive nature o f brake squeal.
The above series o f experiments by Earles et al using the pin-on-disc system did
not reveal any new mechanism for disc brake squeal. The approach confirmed the earlier
work o f Spurr [21] on the sprag-slip model and kinematically constrained instability with
the pin required to be at an angle o f O < 0 < t a n _ l (.i to produce squeal (a necessary but
not sufficient condition). Nevertheless the difficulties o f translating these results to actual
disc brake squeal remained due to the dissimilar geometry.
2.3.5 Lumped parameter models
Departing from the pin-on-disc model , North [41] produced a lumped parameter
model which more closely resembled a disc brake assembly , in this case a single piston
swinging caliper design. The model consisted o f two pads clamping a disc supported by
a caliper ( see figure 2.6 ). Each component has translational and rotational degrees o f
freedom which are connected by springs and dampers.

Chapter 2 Literature Review 24
Figure 2.6 - Eight degrees o f freedom lumped parameter model o f a disc brake system
[41]
This approach is based on the assumption that for a pad which is relatively short
compared with the nodal spacings o f the diametral modes o f the disc, the centre o f mass
o f the pad is subjected to lateral movement with the disc cosine mode and rotation with
the disc sine mode , the disc presumably having two modes o f the same order with
different amplitude and phase as assumed by Jarvis and Mills in their geometrically
coupled model [35], The eight coupled equations o f motion were then arranged in
matrix form , the problem being essentially an eigenvalue problem , the solutions o f
which may come in the form o f complex conjugates , with the positive real part
indicating system instability and the imaginary part the system frequency. The instability
mechanism o f this model is explained by the convergence o f two different modes to form
one common mode due to favourable parameters - similar to a binary flutter instability.
The model predicted increase in squeal propensity with increasing friction coefficient.
The pad thickness and the magnitude o f the normal force however were found to have
no effect on the system stability. The model was able to give good agreement with

Chapter 2 Literature Review 25
experiment because o f the wide range o f parameter values used , for example the pad
stiffness was assumed to lie anywhere between zero and a maximum value. The fugitive
nature o f disc brake squeal was explained by the model requiring certain values o f
stiffness and effective pad length to allow proper interaction between the lateral and
rotational modes. This model however contradicts the observation that squeal occurs
over a range o f applied hydraulic pressure ( typically 40 - 60 psi) in that the model was
insensitive to normal load.
Millner [42] used the same approach as North to produce a lumped parameter
model o f a fixed caliper assembly with the action o f the two pads simplified by
considering a single pad acting on the disc. The pad abutted rigidly against the caliper.
The equations o f motion o f the assembly were then reduced to an eigenvalue problem
and the squeal propensity o f the system is again based on the positive real parts o f the
roots. The general trend from the study is the same as [41] but with the additional
observations that squeal favours leading edge contact o f the piston with respect to the
pad and also that the friction material modulus could affect the system stability since the
system becomes stable for a modulus greater than 350 MPa. The instability also occurs
over a very narrow range o f caliper mass and stiffness. The model is insensitive to
normal load and backplate-caliper friction and this has been considered as unrealistic as
the modulus o f the friction material apparently varies with the brake actuating pressure.
The effect o f temperature on squeal behaviour was argued on the basis that thermal
distortion shifted the centre o f pressure. Compared to North's work , Millner's model
added piston-backplate contact point as one o f the variables.
Increases in model complexity to allow closer approximation to real disc brake
systems led to the lumped parameter model o f Murakami et al [7], Modeling a pin-slider
fist type caliper and backed by extensive experimental data , they produced a lumped
parameter model to explain the effect o f parametric changes on squeal. Again the
positive real parts o f the roots o f the eigenvalues were used as a squeal propensity
measure. The model showed increased squeal propensity with increase in friction
coefficient and friction-coefficient velocity gradient and that positioning o f the piston-
pad contact towards the leading edge o f the pad is more amenable to squeal than trailing

Chapter 2 Literature Review 26
edge contact. Various other geometric parameters were studied in order to determine
least squeal conditions and the analytical findings agreed well with experiment. This
demonstrated the effectiveness o f lumped parameter models in disc brake squeal
analysis. The work also showed that squeal is more likely to happen when the natural
frequencies o f the components are about the same. The model explained squeal as an
unstable condition which occurs when the friction force available to the system excites
the component modes resulting in coupled vibrations o f the system which under
favourable conditions may become unstable. Therefore this interpretation comes under
the category o f geometrically induced instability with the friction coefficient - velocity
negative gradient merely assisting in destabilizing the system.
Brooks et al [43] uses eigenvalue sensitivity analysis to study the effect o f
changing various parameters on their 12 degrees o f freedom model o f a fixed caliper ,
four opposed piston disc brake system. The eigenvector plots o f the analysis clearly
illustrate how the phase angles between the translational and rotational modes o f the disc
and pads develop from a stable to unstable condition , i.e. changing from 0 to 90
degrees. This highlighted the coupling o f translational and rotational modes as the
mechanism by which energy is fed to the system - a binary flutter mechanism. The
authors suggested that maximum separation o f the frequency o f each mode (thereby
preventing them from converging) would provide minimisation o f squeal in a real
system.
2.3.6 Analysis of squeal using the finite element method
With the advent o f powerful digital computers , more complicated models can
now be analyzed taking account o f the flexibility o f the components , in particular using
the finite element method. Berndt and Schweiger [44] analysed the disc brake squeal o f
rail vehicle installations. They used the finite element method in a substructure analysis
o f the components to derive the modal matrix in terms o f generalised co-ordinates which
were then coupled by both the normal and friction forces at the interface. The normal
coupling forces N and the friction coupling forces F were represented as below , where
the superscript ( 1,2 ) represents the different components and the subscripts n and t

Chapter 2 Literature Review 27
represent tangential and normal direction o f motion and superscript 1 and 2 represents
the two components:
N = c ( 'X n- 2X n) + N 0 (2.19)
F = |aNsign (V0 - 1X t + 2 X t ) (2.20)
where c is the coupling stiffness
X„ normal displacement o f the component
Xt tangential displacement o f the component
N 0 steady state normal force
Vo steady state sliding velocity
X t tangential velocity o f the component
In real case where the sliding velocity VQ is high , the sign would always be positive.
Berndt and Schweiger used a time varying friction coefficient to introduce a self
excitation mechanism into the system which could be represented as
H = P + H(t + T) (2.21)
where T is the period.
The coupled second order equations o f motion which included Rayleigh damping were
then reduced to first order systems o f the form :
y + A (t)y = 0 (2.22)
The solution o f which would result in complex eigenvalues in the form :
y = C ( t ) a k exp(r|k t) (2.23)

Chapter 2 Literature Review 28
where T]k = X k +jcok and j = V^T
The solution could therefore be written as
y = C ( t ) a k exp(^.k t){cos(cok t) + jsin(cok t)} (2.24)
The maximum value o f was used as a stability measure for each parameter
investigated. The analysis showed that the system could be stabilized with 3% damping
ratio applied to all modes whilst with selective damping ( 3% applied to the selected
mode , 1% to all other modes) only one mode was found to be stable. The coupling
stiffness c has very strong effect on system stability with the real part increasing with the
stiffness. The instability also increases with increasing coefficient o f friction , with 0.2 as
a critical coefficient. The analysis o f Berndt and Schweitzer was the first to include the
flexible modes o f the various components in disc brake squeal analysis.
Liles [6 ] showed how automotive disc brake squeal could be predicted by
complex eigenvalue analysis with the positive real part o f the eigenvalue used as a squeal
propensity measure. He began by constructing a finite element model o f each component
and refining the models until good correlation existed with measured modal frequencies.
A modal model was then created for each component with the interaction location
determined through an iterative procedure until similar frequency response functions to
experiment was achieved. Finally the frictional coupling terms were added at the pad-
disc interface. These frictional coupling terms form part o f the stiffness matrix which
now has o ff diagonal terms and is no longer symmetric. Thus the necessary but not
sufficient condition for complex eigenvalues to exist was met. For each parameter
studied , the spread o f eigenvalues was obtained on the s-plane in which the real part o f
the eigenvalues is represented by the abscissa and the imaginary part represented by the
ordinate. The standard deviation o f the real parts from the spread was then used as a
squeal propensity measure. Using this model , sensitivity studies were carried out for the
disc brake system including the effect o f coefficient o f friction , pad geometry , caliper
stiffness and structural damping. The results indicated an increase o f instability with

Chapter 2 Literature Review 29
increasing friction coefficient and lining length and that instability could be reduced by
improved damping.
Ghesquire [45] analyzed disc-pad systems considering the static full contact
condition and studied the evolution o f the disc and pad modes when contact stiffness
changes. For low contact stiffness the system was found to be relatively stable with the
rigid body modes o f the pads far lower than the third diametral mode o f the disc. When
the translational frequency o f the pads are in the region o f the disc third diametral mode ,
the system is coupled and the frequency rises rapidly with the increase in contact
stiffness until it exceeds the pad translational frequency. The system then remains stable
until the frequency approaches the pad rotational frequency then coupling again occurs
causing a further rapid increase in the system frequency. The effect o f friction is to make
possible the coupling o f the symmetry and anti-symmetric modes. Modes in close
proximity could be made to converge to one unstable mode with the introduction o f
friction but this alone was shown to be insufficient to initiate instability.
In the work that followed [46] , Ghesquire examined a pad-disc system taking
into account the static contact area and the contact between the pad and the support
(ca l iper) boundary. By varying a param ete r , the normal contact stiffness for example ,
the evolution o f the system modes could be tracked ; this showed convergence o f 2
separate and initially stable modes to one unstable mode which is essentially a binary
flutter instability. The caliper-pad contact stiffness was found to affect stability only for
high stiffness values. The work o f Ghesquire demonstrates the need to include all the
modes within the frequency range o f the instability for the analysis o f disc brake squeal
and that modal proximity alone is not enough to initiate squeal.
Lee [47] studied disc brake noise using component modal matrices and coupling
them with a friction interface formulation which links a normal direction degree o f
freedom to the corresponding lateral degree o f freedom. He measured brake noise and
showed that regardless o f the noise frequency , the rising portion o f the amplitude
envelope could be fitted very well by an exponential curve , thus proving that a

Chapter 2 Literature Review 30
mathematical expression for the amplitude o f brake squeal could be written in the form
o f a pair o f exponential functions o f complex conjugate order:
x = Ae( a ± i p ) t (2.25)
The above equation could be the general solution o f a set o f undamped equations o f
motion , [/w]{ir} + [£]{*} = 0. For example by using the Hilbert transformation a
measurement o f single squeal noise amplitude revealed the rising amplitude in the form
x = A oem = 2 .3 x l0 '8e917t. The method was used to analyze moan , a low frequency disc
brake noise using a single pin on a flexible disc to model the phenomenon ; the brake
noise was shown to be dependant on both caliper length and friction coefficient.
Mottershead and Chan [48] analyzed the effect o f disc symmetry on disc flutter
instability. The analysis used finite elements o f the disc only which deform under
frictional follower loads acting as surface tractions which are active only in the direction
opposing the rotation o f the disc. The equations were arranged to form a friction matrix
which was then added to the stiffness matrix and the ensuing eigenvalue problem solve.
For flutter modes , the eigenvalues occur in complex conjugate pairs with the mode
shapes o f the real and imaginary modes differing in phase by 90 degrees , referred to as
sine and cosine modes. These modes are capable o f supporting flutter instability as they
are already in a state o f coalesce and require a small but finite load to be applied to drive
the instability. Therefore the doublet modes are considered to be susceptible to squeal.
The numerical results showed that singlet modes are unaffected by the brake pressure
and show no tendency to become unstable. Thus the symmetry o f the disc is considered
the primary mechanism o f flutter instability and the frictional mechanism considered as
only secondary based on this approach.
Hulten [49] used an interface friction relationship which he termed the counter
coupled friction model where the motion in the x-direction causes changes in the normal
force acting in the y-direction. The reverse action applies for the corresponding normal
motion in the y-direction. The friction element formulation with this nodal relationship
was then used to evaluate the eigenvalues for a brake shoe model and a brake pad model

Chapter 2 Literature Review 31
on a rigid plane. The solution indicated instability with a non-synchronous motion for the
brake shoe and also for the brake pad. Thus Hulten concluded that the brake shoe or pad
acted as a motor to generate squeal.
2.3.7 Other theoretical work
Nishiwaki [50] derived a generalised theory o f brake noise to explain low
frequency groan and also high frequency squeal problems. The kinetic and potential
energy terms o f each component were calculated and , using Lagrange's equation , the
kinetic energy per cycle o f the coupled system was determined. Increase o f kinetic
energy o f the system over a cycle indicates instability. The integration o f kinetic energy
over the cycle excludes symmetric terms (i.e. the component stiffness and mass matrices)
thus leaving the anti-symmetric term o f the friction matrix. The system equations o f
motion were also used to determine the eigenvalues the positive real parts o f which
indicate instability. The approach indicated that all the brake problems considered , i.e
drum and disc brake squeal and groan , are essentially instability problems which can be
analyzed by determining the complex eigenvalues.
2.4 Experimental Work
2.4.1 General experimental techniques
Apart from experiments carried out in conjunction with modeling work ,
experiments have also been conducted primarily in order to quantify the nature o f squeal
and the various operating conditions affecting it.
Bracken and Sakioka [51] proposed a list o f methods to overcome the subjective
nature o f disc brake squeal evaluation. This included a period o f bedding-in o f the
brake system (whereby the intially high rate o f wear is allowed for) and the measurement
o f the frequency spectrum and the rotor surface temperature for discrete increments in
brake pressure.

Chapter 2 Literature Review 32
Tarter [52] used the same burn-in technique as [41] and added a temperature-
pressure matrix for the average sound pressure level as a method to determine the
preferred temperature and pressure for squeal to occur. His experiments with the brake
pad central area milled to reduce the pad stiffness showed a lowering o f the squeal
frequencies and , for different friction materials , different squeal frequencies were
found. His work on radially slotted rotors indicated a stable condition , with no audible
squeal detected. The test procedures were then updated to include accelerated
conditioning o f the brake studied [53],
2.4.2 Experiments to determine the effect of component dynamics on squeal
Lewis and Shah [54] used an experimental method to isolate the source and
mechanism o f disc brake squeal. Their measurements indicated the fifth diametral mode
o f disc vibration and the outboard pad deflected in-phase with the disc for a squeal
frequency o f 7250 Hz. Frequency measurement o f the disc brake system under static
condititons showed the natural frequency o f the assembled system to be 6500 Hz which
is near to the squealing frequency. Removing the disc and clamping the brake assembly
to a work table , the frequency measurement was repeated , the results o f which showed
that the subsystem o f the pad and caliper alone had a resonance near the squeal
frequency , with the system resonance at higher frequency becoming more pronounced
with increase in line pressure. Free-free modal analysis showed the first bending mode o f
the pad to be at 6250 Hz and the 5th diametral mode o f the disc to be at 6500 Hz. From
the measured dynamics o f the system the authors deduced that , at appropriate line
pressure , localized resonances o f the pads coincide with the localized resonance o f the
disc to form the global system resonance o f squeal. They also proved that altering the
natural frequency o f the pad by adding mass eliminated squeal. Added a constrained
layer o f damping material to the brake pad backplate in order to damp out the bending
motion o f the pad proved to be successful in suppressing squeal.
Chapter 2 Literature Review 33
Hoffman [55] reported the development o f a new constrained layer damping
material and laid down the requirements for the constrained layer damping to be
effective within the operating temperature and vibration frequency range o f a squealing
disc brake.
2.4.3 Experiments on the effect of contact stiffness on squeal
Hany et al [56] analyzed squeal noise with the squeal generated relatively
continuously using a glass disc apparatus which allowed direct observation o f the whole
assembly. They found that roughening o f the glass disc surface is a necessary condition
for squeal. The effect o f normal load was found to be :
a) to increase the sound pressure level within the 30-100N range
b) to increase squeal frequency within the above range (e.g. 9024 Hz at 30N and
9216 Hz at 90N) w hils t, above this range o f load , higher modes were excited.
High rigidity in the normal direction o f the disc obtained by higher modulus
friction material or increased contact radius was shown to reduce the sound pressure
level. It was observed that during squeal the friction force increased compared to the no
squeal condition and this was attributed to the simultaneous increase in tangential and
normal contact stiffness.
Working on the above assumption that the increase o f tangential and normal
contact stiffness is the cause o f squeal , Hany [57] used this effect to analytically design
out longitudinal vibration that lead to squeal. The normal and tangential contact stiffness
arising from the contact o f asperities at the pad-disc interface were modelled as massless
springs. The Routh-Hurwitz criterion was then used to derive the characteristic
equations to determine the stable boundary. The numerical results indicated several
parameters which tended to reduce squeal namely short , thick and wide pads , a more
rigid caliper , higher Young's modulus and loss factor o f the friction material.
Nevertheless the longitudinal vibration predicted by the model remained dependant on
the slope o f the friction coefficient - velocity relationship.
Chapter 2 Literature Review 34
2.4.4 Experiments on the effect of separation of doublet modes
Nishiiwaki et al [58] studied the effect o f mass added to the disc in order to
separate the doublet modes o f the disc. The initially stationary mode would then rotate
thus changing the excitation area continously throughout the rotation with the effect o f
preventing squeal. However when the effect o f added stiffness from the pad-disc contact
area was taken into account , high brake pressure with consequently high contact
stiffness reduced the mode separation effect. Further mode separation (by increasing the
added mass) was found to be an effective way o f overcoming the added stiffness effect.
Experimental work evidently showed the effectiveness o f this approach in reducing the
squeal propensity.
Lang et al [59] used doublet mode decoupling by added mass to achieve stability
o f a drum brake and studied the effect o f added stiffness when a practical mass was
added to the drum. Their study showed the cyclic decoupling effect when the mass
rotated with the drum producing cyclic squeal. Added stiffness along the drum periphery
was found to be effective in separating the doublet modes with the arc length having
great influence on the separation ; a longer arc length was more effective for separation
o f the lower modes.
This method o f removing the symmetry o f the rotor and separating the doublet
modes was used by Kim [60] in his analytical work to eliminate squeal from a S-cam
drum brake installation. Added mass located at the drum peripheral was shown to
enhance the decoupling effect o f the doublet modes and concentrated added mass was
more effective than distributed mass. The trends from his analysis matched well with
experiment.
2.4.5 Experiments using double-pulsed laser holographic
Imaging techniques using holography allows the equal displacement line o f the
flexing surface o f the vibrating body to be captured. Double pulsed laser interferometry
allows the visualisation o f the vibration pattern by generating onto it a system o f

Chapter 2 Literature Review 35
interference fringes which are loci o f equal displacement occuring between the first and
second pulses with the timing between the pulses controlled to match the frequency o f
the body by sensing the maximum amplitude o f the cycle.
Felske and Happe [61] used this technique to analyze general vibration o f
automotive interest - the ch as is , gearbox and also disc brake squeal. The study o f disc
brake squeal in particular revealed the pad to be vibrating with a mode shape similar to
the first bending free-free mode when squeal occured at 6.5 kHz with low pressure
application. At higher pressures , the mode shape changed to the fixed-free first bending
mode. In subsequent work Felske, Hoppe and Matthai [62] specifically studied disc
brake squeal. The study showed that squeal ( for a different brake type ) was strongest
at 2.5kHz , when the squealing frequency coincided with the caliper resonance
frequency. For the short pad used in the study , this was attributed to the contact areas
between the caliper and the nodes o f the vibrating backplate. The mode shapes o f the
pad included bending and also twisting with anti-nodes at every corner o f the pad. For
the long brake pad studied , the anti-nodes o f the disc reinforced the vibration with the
displacement o f the paws considered reactionary. Measurement o f the sound pressure
level emitted during squeal was compared to that o f the disc when excited artificially.
This showed that the higher sound pressure level came from the squealing brake system
rather than from the artificially excited disc , indicating that the major part o f the noise
came from the caliper. They suggested the following remedial actions based mainly on
reduction o f the amplitude o f the coupled vibrations:
a) increased damping to limit amplitude during resonance
b) increased stiffness o f the pad
c) caliper paws to coincide with the antinodes o f the pad
d) increased stiffness o f the caliper
e) mismatching the natural frequencies o f the components.
The work proceeded to analyse drum brake squeal [63] in which the squeal was
hypothesised to be initiated at the lining interface causing a bending-twisting vibration o f
the shoe which was transmitted to the drum and the backplate. Similar remedial actions

Chapter 2 Literature Review 36
as listed above were suggested , for example stiffening o f the flange o f the backplate to
reduce the amplitude o f the anti-node vibration.
Fieldhouse and Newcomb [10] used the holographic interferometry technique to
study the effect o f the abutment on disc brake squeal. They produced a clear
reconstructed holographic image o f the free-free vibration o f the disc and the pad and
also o f the squealing brake assembly. For combined trailing and leading edge abutments
the mode shape o f the disc and the outboard pad were transformed from the sixth
diametral and bending modes respectively at low pressure to the sixth diametral and
twisting mode respectively at a higher pressure range , with a quiet zone inbetween the
two pressure ranges. For a trailing edge abutment , the system was relatively quiet and
squeal obtained only with difficulty ; and the disc mode was o f high-order (eighth
diametral mode) at pressures in the range o f 0.14-0.27 MPa and o f low order mode (the
third diametral mode) at pressures in the range o f 0.20 - 0.41 MPa. Higher pressures
tended to quieten the system. The leading edge abutment was shown to be the most
unstable , with a relatively wide range o f pressure (0.14 - 0.8 MPa) and o f temperature
(20 - 114 degrees Celsius) for which squeal was recorded. The mode shape o f the disc
was o f the fifth diametral mode with the anti-node position under the pad shifted to the
node position at a pressure above 0.68 MPa. The overall results demonstrated the
importance o f the line pressure and abutment configuration in disc brake squeal.
Fieldhouse and Newcomb [64] extended their analysis to study the disc mode
shape waveform and the effect o f piston-pad contact position on disc brake squeal. From
the holographic image , they discovered that the disc waveform moves not only relative
to the disc but also relative to ground and the variation in amplitude indicated the
possibility o f an additional waveform o f a similar order displaced in space and time -
similar to a complex wave o f real and imaginary parts. The effect o f piston-pad contact
position was studied by inserting a wire in various positions between the piston and pad
with the resulting squeal favouring a leading edge position up to a certain distance
beyond which the effective sound pressure level was reduced.

Chapter 2 Literature Review 37
2.5 Discussion
Progress in the understanding o f disc brake squeal mechanisms has been assisted
in recent years by the increased complexity o f the experimental and computational
techniques available.
Early work [14,15,16,17,18,19,20] suggested disc brake squeal was an instability
problem primarily caused by the friction coefficient increasing as the sliding velocity
decreases. The difference between each model was o f a geometrical nature and either
inclusion or exclusion o f damping. Later longitudinal instability o f a brake pad was also
demonstrated to be caused by the same effect [57], With this understanding , remedial
action has been centred around increasing the damping o f components to reduce the
resonant amplitude.
Kinematic instability [21,28,32,35,37,38,39,40] due to the geometric disposition
o f the rubbing component provided new insight into the squeal problem. With this
mechanism , instability may occur with an invariant coefficient o f friction above a critical
value when a suitable geometry configuration is achieved. This is analytically
demonstrated by mapping the stability boundary either using the Routh-Hurwitz
criterion or by solving the characteristics equation and assessing the real part o f the
complex eigenvalues obtained. Upto this point the models considered were o f pin -on-
disc type only , differing only in the degrees o f freedom considered and the complexity.
Lumped parameter modelling [10,41,42,43] has allowed closer approximation o f
the true brake system. The friction effect has been modelled as a function o f variable
normal force i.e. proportional to the displacement between the pad and the disc. This
approach however is limited to one particular frequency o f squeal and only rigid body
modes o f pad translation and rotation can be considered ; this in particular is valid for
short brake pads. However the approach is less valied for long brake pads (which is the
trend for modern disc brake design) since flexible modes o f the pad cannot be included
in the model. Moreover the disc squeal modes need to be predetermined to allow
accurate representation o f the equivalent ground stiffness o f the disc ; this works well for
LEEDS UNIVERSITY LIBRARY

Chapter 2 Literature Review 38
exisiting brake designs but remains indeterminate for new brake systems at the design
stage.
With the finite element method [6,44,45,46,47,48,49] the flexible modes o f the
brake components can modelled but the complexity increases as more components and
modes are considered. The friction effect included is still similar to that used in lumped
parameter modelling where the friction force is a function o f normal force which itself is
proportional to the normal displacement between the pad and the disc. This
representation has been successfully used in eigenvalue sensitivity analysis [46], The
advantage o f the finite element method lies on the fact that geometrical representation o f
the components is not lost in the analysis.
Study o f the disc brake components in isolation indicated two different
mechanisms o f disc brake squeal. Firstly study o f the disc [58,59,60] has shown that it is
the symmetry o f the rotor that is responsible for squeal. A symmetric rotor produces
doublet modes , the term used to describe two modes o f the same order occurring at the
same frequency but with phase difference. Doublet modes which have a phase difference
o f 90 degrees are very susceptible to squeal. Similarly the disc doublet modes can be
regarded as stationary [58] thus being continuously excited at the contact area. This
approach advocates the separation o f the doublet modes in order to achieve stability ;
this can be achieved by adding mass but is only partially successful in overcoming the
effect o f increased pressure or added stiffness. Analysis o f the pad alone [40] has shown
that , above a critical coefficient o f friction , the pad could be excited producing
asynchronous motion hammering the disc to produce squeal. This approach advocates
that a stable pad should not create squeal. Experimental evidence is available to support
both ideas.
The representation o f friction in the models studied can be categorized into two
major types. The first is the relatively complex representation based on the Oden-Martin
model [8] which accounts for the normal approach indentation (the displacement), its
time derivative (the velocity o f the contact) and the approach phase. This is a very
realistic representation as shown in the two degree o f freedom model by Tworzydlo et al

Chapter 2 Literature Review 39
[33], The main disadvantage o f this approach is the high cost o f computation which
prohibites its use in multi degree o f freedom models. The second approach gives a
variable friction force proportional to the variable normal force which is represented as a
function o f relative displacement between the pad and the disc. This approach has been
used in numerous models [6,41,42,43,44,45,46,47,48,49]and has proven successful in
producing complex eigenvalues the real parts o f which are used as an index for squeal
propensity.
Experimental evidence using holographic interferometry [9,61,62,63,64]
suggests that flexible modes o f the pad are involved in squeal and that changes in
abutment type and pressure application points do affect squeal considerably.
From the papers studied , there are various steps that can be taken to overcome
squeal with different techniques to suit different stages o f production. Some methods are
very suitable at the design stage. Although no universal solution has yet been found ;
some o f the remedies for squeal are listed below:
1) Prevention o f global resonance o f the disc brake system by mismatching the
natural frequencies o f the components.
2) Limiting the amplitude during resonance by either
a) increased damping o f the brake components , usually the pad by
constrained layer damping at the backplate
b) increased stiffness o f the pad support - this can occur naturally when
high pressure is applied to the system
c) suppressing the anti-nodes o f the pad by appropriate location o f the
paw.
3) Separation o f the doublet modes o f the rotor by added mass or by
unsymmetric stiffness o f the disc by means o f slotted rotor.
4) The use o f a shorter brake pad.
5) Reduced friction by using a friction material with low coefficient o f friction.
There are other techniques at the post-production stage in particular where, by
measuring component frequencies and comparing them with squeal frequencies , the
Chapter 2 Literature Review 40
individual components responsible for the squeal can be identified and the natural
frequencies altered.
2.6 Conclusions
From the literature review o f the previous experimental and theoretical work on
disc brake squeal , the following conclusions can be drawn :
(a) Increasing friction coefficient with decreasing velocity is one o f the
mechanisms whereby friction energy is fed into the disc brake system causing the
amplitude o f the motion to increase with time when instabilities are present leading to
squeal.
(b) Dynamic instability resulting in squeal o f the disc brake system can arise from
favourable dynamic and geometric conditions , even when the coefficient o f friction does
not vary with the sliding velocity. Thus (a) is not a necessary condition for squeal to
occur.
(c) The friction force can be modelled as a function o f variable normal force. The
variable normal force is proportional to the relative displacement between the disc and
the pad and also proportional to the contact stiffness.
(d) The real part o f the complex eigenvalues can be used as an index for squeal
propensity.
e) The finite element method is a very suitable technique to investigate disc brake
squeal since multiple flexible modes o f the contributing components can readily be
modelled.
f) The important operating parameters o f applied pressure or temperature have
not yet been considered in the squeal models reviewed.

Page 41
C H A P T E R T H R E E
METHODOLOGY OF PRESENT STUDY
3.1 Introduction - The Need for A New Approach
Previous models o f squeal as discussed above range from relatively simple
lumped-parameter models to geometrically representative finite element models. Squeal
in general does not occur throughout the full operating range o f pressure and
temperature but favours low pressure and low brake temperature applications. Sakioka
and Bracken [51] identified the favoured combination o f pressure and temperature for
brake squeal by comparative display o f the squeal sound pressure level over the
pressure-temperature matrix. Experiments by Fieldhouse and Newcomb [64] also
showed that pressure is an important factor in squeal.
None o f the models reviewed so far have considered the effect o f the pressure
applied on the brake pad, squeal being represented as an instability resulting only from
favourable dynamic parameters ( mass ,damping and stiffness ) or geometric parameters

Chapter Three - M ethodology o f present study 42
( point o f force application ). The pressure distribution and contact area between the
disc and the pad is influenced not only by the Young's modulus o f the friction material
and the position o f the piston force application to the brake pad backplate but also the
friction coefficient at the interface o f the sliding pair as shown by Harding [65] in
which different points o f application o f piston force will produce different contact
pressure distributions. Again this will cause a shift o f the centre o f pressure and based
on the sprag-slip model a favourable sprag angle may occur resulting in disc brake
squeal. Experimental evidence by Fieldhouse & Newcomb [64] suggested that, upto a
certain distance o f the point o f application o f the pressure forward o f the piston centre
line, the disc brake can readily be made to squeal and that stability can be achieved by
moving the centre o f pressure toward the rear o f the piston centre-line.
Alteration o f the backplate thickness will not only change the natural frequencies
o f the pad but also the contact pressure distribution [66]. Therefore a favourable contact
pressure distribution can be achieved by proper matching o f friction material modulus
and backplate thickness. Even though Ghesquire [46] does consider the actual area o f
contact under static pressure in his model , the measurements with ink paper were done
without any sliding friction, thus giving a symmetric pressure distribution During
sliding, friction has been shown to shift the centre o f the interface contact reaction
force toward the leading edge [67], depending on the modulus o f the friction material
and its coefficient o f friction. This will influence the sprag angle and therefore the
overall stability o f the disc brake system Mismatching the free-free natural frequencies
o f the components has been suggested as a means o f avoiding squeal [7,54] but this is
not entirely satisfactory as the boundary conditions in the real contact situations differ
markedly. Therefore a stability analysis which considers the pressure distribution and
magnitude o f the coupled system would provide a more detailed explanation o f the
contribution o f each effect to squeal.
Another parameter which has not been considered in previous models is the
surface condition o f the friction face. Experiments by Sherif [56] showed that a glazed
surface is a necessary condition for squeal to occur and experiments with pin-on disc
apparatus by Yokoi & Nakai [29] showed that a worn and relatively smooth pin surface

Chapter Three - Methodology of present study 43
would m ake the system readily squeal. The surface condition therefore is another factor
governing squeal and the continuously changing surface condition may explain the
fugitive nature o f squeal.
In short , by including the effect o f interfacial pressure on disc brake squeal , a
more sophisticated model which considers in particular the magnitude o f pressure
applied and contact pressure distribution and the surface properties o f the friction
interface could be achieved , thus bringing the representation o f squeal nearer to the true
physical situation. This model would hopefully provide some explanation as to why
squeal is pressure dependent and why it tends to occur under low actuation pressure
situation. H ow ever any such model must be carefully validated against experiment
before it can be used with confidence to predict the effect o f parameter changes.
3.2 Selection of Experimental Results for Validation
Experiments concerning the pressure effect on squeal o f a fist-type slider caliper
disc brake system have been carried out by Fieldhouse and Newcomb [10], The
holographic interferometry technique was used to determine the mode shapes o f the
squealing disc brake system and the effect o f varying line pressure was studied. The
same technique was also used for free-free natural frequency analysis o f the two most
important components o f the disc brake system : the pad and the disc. In the free-free
analysis , piezo-electric crystals were mounted on the surface o f the disc and also on the
pad to provide the excitation forces needed for the analysis. Double-pulsed laser
holography was used to capture an image o f the deformed pad or disc (the mode shape)
presented in the form o f a reconstructed holographic image. This in turn provided
excellent data for the present finite element analysis , w here validation o f the free-free
natural frequency analysis is essential for the subsequent stability analysis to be
successful.Therefore the published w ork o f Fieldhouse and Newcom b [10] allows
correlation between the experimental data and the finite element analysis in respect o f :
1) free-free modal analysis o f the disc and the brake pad
2) stability o f the coupled disc brake system.

Chapter Three - Methodology' of present study 44
3.3 Operation of A Fist-Type Sliding Caliper
In order to analyse the effect o f pressure on squeal , a brake system similar
to the one used in the experiments by Fieldhouse and Newcom b [10] was selected
The fist-type sliding caliper system has three major components , the disc , the caliper
assembly and tw o pads. The caliper assembly as shown in figure 3.1 consists o f the
caliper carrier bracket (B) and the caliper (H) itself which houses the piston (G). The
caliper (H) is able to slide on the tw o guide bolts (A) o f the fixed caliper bracket
allowing m ovement in the wheel axis direction with respect to the disc. There are two
corresponding pin holes on the caliper with tw o rubber bushes , lightly oiled to allow the
whole caliper to slide on the tw o guide bolts. The caliper carrier bracket is bolted to the
car suspension.
The operation o f this disc brake system begins with the driver applying pressure
to the brake pedal , thereby increasing the hydraulic line pressure and causing the piston
push the inner pad against the disc. W hen the inner pad comes into contact with the disc,
the reaction force from the disc will cause the caliper to slide along the tw o guide bolts
in the direction B as shown in figure 3.2. The fist (or paw) will now press on the
backplate o f the outer pad to move it into contact with the disc. Therefore both pads are
now in contact with the disc , resisting the disc rotation by the friction force generated at
the pad-disc interfaces. The abutments at ends o f the caliper bracket would provide the
reaction force necessary to prevent the pad from rotating with the disc as shown in
figure 3.3. There is a clearance between the pad backplate and the abutment slot on the
caliper bracket which therefore can only sustain compression forces ( as tension will
p roduce a no contact condition ) except when shims are used to fill in the gaps as in the
experiments o f Fieldhouse and Newcomb. The contact areas at each abutment area are
shown shaded in figure 3.3.

Chapter Three - Methodology o f present study
A Guide bolts
B Caliper carrier bracket
C Caliper retaining clip
D Disc pads
E Dust excluding seal
F Piston seal
G Piston
H Caliper
Figure 3.1 Exploded view o f the caliper assembly [68]

Chapter Three - Methodology of present study 46
Figure 3.2- Schematic diagram o f the operation o f the sliding caliper disc brake.

Leading edge abutment Trailing edge abutment
Chapter Three - Methodology of present study_______________________________ _________________47
Figure 3.3 - The brake pad and the abutment arrangement, (dotted lines showing relative
position o f the piston on the pad backplate)
3.4 Pressure Representation
In previous analyses o f disc brake squeal , the components involved are usually
assumed to be in full contact and the contact stiffness is represented as massless stiff
springs. The contact would often be modelled as a single-point contact as in lumped
param eter models [7,41,42,43] whilst in finite element models the contact is represented
as stiff springs connecting the disc face nodes with the adjacent pad nodes with equal
stiffness at all the connected nodes. Previous work on brake contact pressure analysis
has shown that the contact pressure distribution at the pad-disc interface is not uniform
with the normal pressure maximum at about the centre o f pressure application on the
brake pad backplate [65,66,69] and that full contact over the pad area could only be
achieved with the most compliant friction material [66], M odern friction materials are

Chapter Three - Methodology o f present study' 48
often o f the semi-metallic type with good thermal conductivity and wear properties but
relatively high modulus. This latter must result in only partial contact.
Therefore for more realistic modelling o f the interface contact , two conditions
must be established. W here there is no contact , there should be no coupling between
the sliding faces but w here contact is established , the surfaces should be connected with
a contact stiffness k c . M ost lumped parameter models quote a constant figure o f k c
based on the compliance o f the friction material given as below :
k e = t/(AE ) (3.1)
where t=thickness o f friction material
A= contact area
E = Young's modulus o f friction material
Alternatively , if the compliance o f the friction material is modelled separately as
in the finite element m ethod the contact stiffness k c could be made a measure o f the
coupling strength o f the interface. Stiff joints with high values o f k c would indicate
strong coupling o f the com ponents since unit relative displacement o f the interface node
would generate high reaction forces. Similarly low values o f k c would indicate weak
coupling o f the com ponents as unit relative displacement would generate relatively low
reaction forces. It is assumed at this point that contact stiffness could be made a
function o f the normal force applied , with the general effect o f increase in normal force
being to increase the contact stiffness. The effect o f the brake pad pressed against the
disc could be modelled in a similar fashion to a beam on elastic foundation with the
contact stiffness taken as the foundation modulus. In o ther words, the contact pressure
o f the pad-disc interface can be represented as massless springs with the contact
stiffness k t distributed along the interface as shown in figure 3.4.
As the reaction force at each node is different , a different contact stiffness is
specified for each spring connecting a node pair. Thus, the contact stiffness at each node
pair k ( is a function o f the reaction force at that node pair F; (figure 3.4).

Chapter Three - Methodology of present study 49
Force equilibrium dictates that :
i=n
F = total force = ^ F i (3.2a
w here n is the num ber o f nodes in contacti = n
and for springs in parallel K = total contact stiffness k (3.2b
where K=f(F) and k , = — KF
(3.3)
Therefore the effect o f pressure is implicit in the system equations o f motion by means
o f the stiffness representation.
In order to estimate the correct contact reaction force distribution at the pad-disc
interface , a static contact pressure analysis is required prior to the dynamic stability
analysis o f the coupled system. N ode pairs which have zero reaction force predicted
from the contact pressure analysis will have no contact stiffness in the stability analysis
whilst o ther node pairs will have contact stiffness in direct proportion to the predicted
reaction force.

Chapter Three - Methodology of present study 50
applied pressure
V___ '»___y
Node Nos.pad
1 2 3 4 5
total contact stiffness , K
slide plane o f the disc surface
F2F3 F4
a) Pad interface nodal reaction force (showing relative magnitude)
k2k3
kl/ k
k 4
/ N k 5
/IS16
b) Contact stiffness o f pad-disc interface nodes ( proportional to the reaction force
at each node)
Figure 3 .4 - Representation o f contact pressure effect using distributed contact stiffness.
3.5 Interface Element
3.5.1 Variable friction force with variable normal force
The contact stiffness derived from the interface contact pressure analysis is to be used in
the friction element which defines the interaction between adjacent nodes including the
effect o f friction. This friction element must be able to model :
i) the steady state friction force acting at the interface o f the components

Chapter Three - Methodology of present study 51
ii)the steady state reaction force acting in the normal direction
iii)the varying part o f the normal force which is to be proportional to the
stiffness o f the element and the relative displacement o f the adjacent nodes
iv)the varying part o f the friction force which is to be related to the varying
normal force according to Amonton's law ( F=(^N).
Such an interface is represented graphically in figure 3 .5.
/ / / / /
contact s tiffness , k
zA \
■>
/ / / / /
Figure 3.5 - Interaction o f tw o masses with friction effect included
seal
hydraulic pressure
piston
pad hark platp
friction material
disc
support s tiffness , k (A
abutment__\
\
abutment s tiffness , k
pad
a) Schematic pad on disc system
f l ex i Die c
friction element with stiffness , k
isc
b) Equivalent model with interface element
Figure 3 .6- A pad model coupled to the disc face with friction elements

Chapter Three - Methodology of present study 52
From figure 3.5 ,
The steady state normal force on mass 1 = N ,
The steady state friction force acting on mass 1 , F, = (iN,
Variable normal force acting on mass 1 due to the relative displacement :
AN, = k c( z2 - zi ) (3.4)
Variable friction force due to variable normal force on mass 1 :
A N ,= n AN, = |.i k c( z2 - Z] ) (3.5)
For the disc brake system studied , sliding is uni-directional and the total normal
force is assumed constant acting normal to the slide plane (figure 3.6). The interface
nodes only 'see' the effect o f the gross friction force acting against the direction o f
relative motion.
Assume that node 1 represents one o f the nodes on the disc face and node 2 is
the adjacent node on the brake pad friction face as shown in figure 3.7. W hen perturbed,
nodes 1 and 2 move relative to each other causing a variable normal force on node 2
which is a function o f the relative displacement between the tw o nodes and the contact
stiffness (i.e. d N , = kc (y, - y 2) ). In the case where both nodes move further apart:
as shown in figure 3.7(ii). This would reduce the total effective normal force acting on
node 2 (i.e. total effective normal force = steady state normal force + variable normal
force)
A N , = kc [ ( -y ,) - ( + y , ) ] = -ve (3.6)
N cfr2= N 2 +(- d N 2) (3.7)
This in effect superimposes the variable normal force on to the steady state normal
force.

Chapter Three - Methodology of present study 53
%
1
i) equilibrium
A N = 0
ii) nodes stretched
A N= negative
iii) nodes compressed
A N = positive
Figure 3 .7- The effect o f normal displacement to the variable normal force.
W hen the nodes m ove closer together as in figure 3.7(iii), the displacement o f node 1
from the equilibrium position would be y, (+ve) and node 2 would be y 2 (-ve) and
therefore :
d N , = kc[ (+ y ,) - ( - y 2) ] - +ve (3.8)
N eff2 = N 2+ (+ d N 2) (3 9)
which increases the effective normal force.
The varying part o f the friction force is related to the normal force as below
( F2 + d F , ) = p( N 2 + d N 2) (3.10)
and since F2 = p N 2
dF2 = p d N , ( 3 1 1 )
From the above equation the dynamically varying friction force dF, is proportional to
the dynamically varying normal force d N 2. For node 1 a similar relation is obtained by

Chapter Three - Methodology of present studv 54
taking into consideration the direction o f the forces. This effect would be realised in the
model as alternately reducing and increasing the effective normal force as the
displacement varies harmonically about the mean value and as a consequence the
effective friction force would also vary in a similar manner. This provides the necessary
mechanism for energy to be fed into the vibrating system , creating self-excited
oscillations and making the system potentially unstable.
The equation o f motion representing the interaction o f nodes 1 and 2 can
therefore be used as the basis o f the interface element in a stability analysis. In order to
make the friction element compatible with the finite element software used , in this case
A N SY S Revision 5.0A [9] developed by the Swanson Analysis System Incorporation ,
the direct input method using the M A T R IX 27 element is most suitable. The M ATRIX
27 element allows direct input in matrix form o f the relationship between tw o nodes
using any one o f the node variables - d isp lacem ent, velocity or acceleration; in this case
the displacement is chosen as the variable. From the equations o f motion o f the two
nodes , the M A T R IX 27 element is written in matrix form as follows.
Referring to figure 3 .5 :
at node 1 (pad friction face) Fxl = (.i kc(y, - y 2) (3.12a)
and Fy] = kc (y, - y , ) (3.12b)
at node 2 (disc friction face) Fx2 = - Fxl and Fy2 = -Fy] (3.13)
Thus arranging the nodal stiffness relationship in matrix form :
~o ~ ^ k c 0 H k c x i " F * i "
0 k c 0 - k c Yi Fy!
0 ~ H k c 0 - H k c x 2 Fx2
0 - k c 0 k c . 3 2 - F y 2 _

Chapter Three - Methodology of present study 55
or [ Kf]{ii} = {F} (3.15)
w here k ;-H
- p k c 0 (ikc
k c 0 - k c
- | a k c 0 - [ x k c
0- k c
(3.16)
In the above element interface friction matrix , only 2 degrees o f freedom for each node
are considered whilst in the M A TR IX 27 element all six degrees o f freedom for each
node must be included ( 3 translational and 3 rotational freedoms). How ever since
friction is assumed to act in the circumferential direction only the full matrix is sparse.
In order to apply the above approach to the disc-pad interface, some minor
modifications are necessary. The coupled pad-disc system can be represented as in
figure 3.6 w here k c is the interface contact stiffness coupling the mating surfaces o f the
disc and the outboard and inboard pads. The normal and friction forces arising from
small displacement o f the com ponents as shown in figure 3.6 can be written as follows.
For the d isc-outboard pad :
N orm al force on the disc, Fzl = - k c ( z 1 - z 2)
N orm al force on the outboard pad, Fz2 = k c (z, - z , )
Friction force on the disc = Fyl= n F zl= -)_ikc ( z 2 -z, )
Friction force on the outboard pad = Fy2 = |liFz2 = M.kc(z, - z 2)
OUTBOARD PAD
T %
___ J ; F-DISC d ire c t io n o f -----
r o t a t i o n
-F vyl*
INBOARD PAD
Figure 3.8 - Simplified model o f the coupled pad-disc system and the forces active on
the interface with friction.

Chapter Three - Methodology of present study 56
For the disc-inboard pad :
Norm al force on the disc, Fzl, = - k c(z, - z 3)
Norm al force on the outboard pad, Fz, = k c (z, - z 3)
Friction force on the disc = F ,,= -|aFz]1 = |.tkc ( z 3 - z ,)
Friction force on the outboard pad = Fy3 = -(.t Fz3 = -jakc (z, - z 3)
In the above equations, the negative sign applied to the friction force on the disc-inboard
pad cluster is due to the friction force Fv acting in the negative y-direction relative to
the positive normal and friction force direction as applied to the disc-outboard pad
cluster. The above equations can be arranged in matrix form as follows.
For the outboard pad-disc cluster:
1 1O - ^ k c 0
1—o
1
F z l 0 - k c 0 k c Z 1
Fy2 0 M - k c 0 ~ V K y 2
f z 2 _ 0 k c 0
_ .!
1
z 2
= [ K f ]{u} (3.17)
For the inboard pad -disc cluster:
____
___i
1o 0
1
1 " 1
Fzl. 0 - K 0 k c z,.
Fy, 0 0 Hkc y 3
1 0 k c 0 Io1
_ Z 3
The above interface stiffness matrices are ready for direct input in order to couple the
finite element model o f the pad and disc at the interface nodes. This is explained in more
detail in section 3.8.

Chapter Three - Methodology of present study 57
3.5.2 Follower friction force effect
Another effect o f friction on a deformable surface is the frictional follower force model
proposed by M ottershead and Chan [48] which can be explained as follows. Consider a
small area dA on the contact surface as shown in figure 3.9.
£ ^ f , d A
undeformed surface dA - dx dy
x
Figure 3.9 - Non-conservative follower forces on deformable surface
Using a local rectangular axis system with x,y in the tangent plane and z normal outward
the general friction force could be written in vector form as :
fdA = ( i f + j f ) d A (3.19)
Assuming that the surface is flexible in the transverse direction but stiff in the friction
plane and that as it undergoes a small rotation
Q = i D + j Q y (3.20)
a simultaneous displacement occurs

Chapter Three - Methodology of present study 58
(3.21)
This effect is followed by the surface tractions f , a non-conservative friction force acting
upon the deformed surface and is given by :
w here i,j and k represent unit vectors in the x,y and z direction respectively. When
applied to the disc and pad interface , the friction force is acting in the tangential
direction only and the force terms acting in the radial direction is zero (fx = 0). Thus
equation (3.22) is reduced to
Equation (3.23) indicates that there will be an increase in follower force acting on the
surface dA as the surface transverse deformation increases. In order to allow
equation (3.23) to be included in the program me using the ANSYS Finite Element
software , it needs to be reduced to a form o f constraint equations between the nodes.
This is achieved by further reducing the equation (3.23) to represent tw o adjacent nodes
on the surface o f the disc or the pad at the interface. The tw o nodes on the same surface,
(nodes 1 and 2) are separated by distance d and are acted upon by a friction force F. As
the surface deforms one o f the nodes will be displaced relative to the other as shown in
figure 3 10.
( Q x f )dA = ( Q xfy - Q yfx ) kdA (3.22)
( Q x f ) d A = Q xfykdA (3.23)

Chapter Three - Methodology of present study 59
d
Figure 3 10 Follower friction force effect as applied to tw o nodes on the same surface
Therefore the increase in the force acting in the z-direction due to the deformation o f the
surface between node 1 and node 2 can be approximated for small angles as
fz = F s in Q « F(z2 - z l ) / d (3.24)
where z l and z2 are the nodal displacement in z-direction. Equation (3.24) is the
constraint equation used to represent follower forces effect in the stability analysis. The
m agnitude o f the friction force F is determined from the contact pressure analysis.
Equation (3.24) shows that the nodal follower friction force is related to the normal
displacement o f the node and this has been included in the variable normal force friction
model described above. In order to use the follower friction force model for analysis o f
disc-pad interaction, friction force o f equal magnitude but o f opposite direction is
applied with the interface nodes constrained to move together in the direction normal to
sliding.
3.5.3 Comparison with the Hulten friction element
In the w ork o f Hulten [49] , the friction element for a drum brake pad was presented as
a counter-coupled motion as shown in figure 3.11.
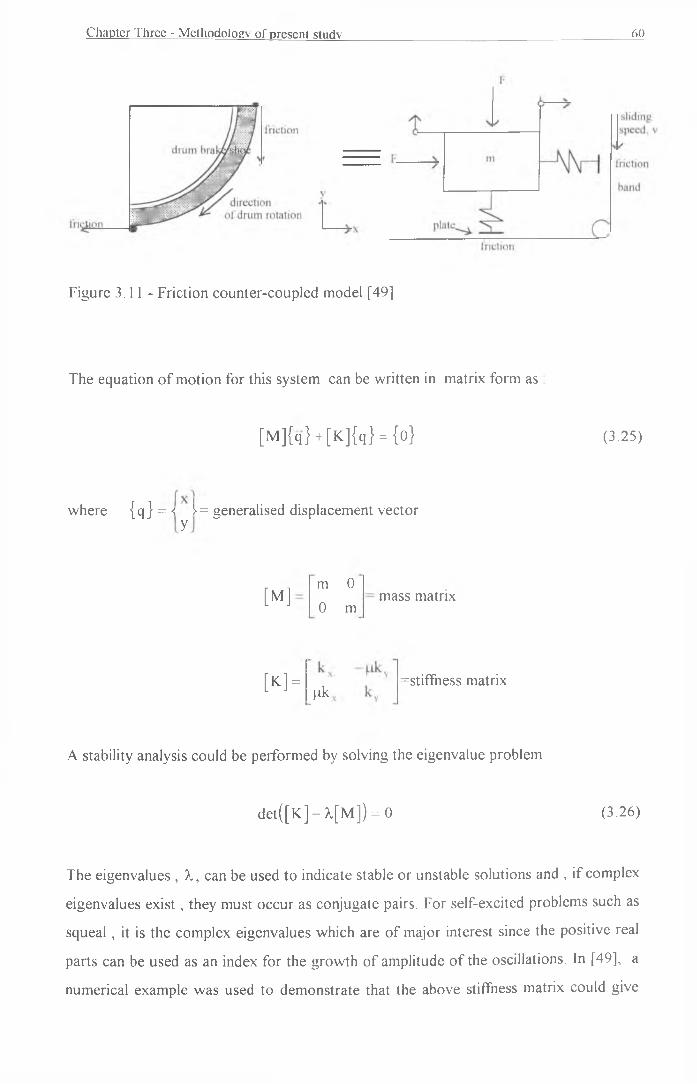
Chapter Three - Methodology of present study 60
Figure 3 .1 1 - Friction counter-coupled model [49]
The equation o f motion for this system can be written in matrix form as
[M ]{ q } + [K ]{ q } = {0} (3.25)
w here {q } = •< 1= generalised displacement vectory
[M ]m 0
0 mmass matrix
[K] =jik
=stiffness matrix
A stability analysis could be performed by solving the eigenvalue problem
d e t ( [ K ] -A .[M ] ) = 0 (3.26)
The eigenvalues , X, can be used to indicate stable or unstable solutions and , if complex
eigenvalues e x i s t , they must occur as conjugate pairs. For self-excited problems such as
squeal , it is the complex eigenvalues which are o f major interest since the positive real
parts can be used as an index for the grow th o f amplitude o f the oscillations. In [49], a
numerical example was used to dem onstrate that the above stiffness matrix could give

Chapter Three - Methodology o f present study 61
rise to instability. However, there is a basic assumption that Hulten made in which the
friction force acting on the lower plate must act in the opposite direction to the friction
band motion which made the stiffness matrix not representative o f the drum brake
system modelled. I f on the other hand the physical similarity in the friction force
direction is maintained (that the friction force acting on the plate must always act in the
direction o f motion o f the friction band) then the friction terms ( | ik x,( jky ) will have the
same sign in the stiffness matrix which will result in a symmetric matrix and instability
will not occur since the eigenvalues will not be complex. How ever Hulten then used his
approach to define the nodal relationship between a disc brake pad and an infinitely stiff
ro to r represented as a frictional stiffness matrix. For each node representing the
interface , 3 degrees o f freedom were considered , clearly illustrated in figure 3 .12.
p i v o t p o i n t
BRAKE PADn e u t r a L
l i n e
(R-r)
interface-/ / / / / / / / / / /
< — ------------d i s c r o t a t i o n
Figure 3.12 - Idealised pad model used by Hulten and the associated nodal relationship
with friction effect included.
For the one node shown , x , y and 9 are the degrees o f freedom considered in the
derivation o f what Hulten termed a ' friction stiffness' matrix. Lk is the mean
surrounding length where Lk = IlL lLJ. x h e (R-r) term is used to represent the distance
o f the interface to the neutral plane for bending o f the brake pad , thus the derived
stiffness friction matrix is as below :

Chapter Three - Methodology of present study 62
r~o01
y
I"T
j 1
-n 0 0 X = Fx
ii 9 1 r o O
| O 0 1 Tl
CD 1
(3.27)
w here Fy is the normal force , Fx is the friction force and F0 is the friction moment
created by the friction force multiplying the distance (R-r) and compensated by the unit
length L 0. The resultant friction matrix is then added to the global stiffness matrix to
form an unsymmetric global stiffness matrix. In the numerical example o f a disc brake
pad , 50 elements were used and the results indicated instability. The problem with this
approach is that the distance (R-r) must be non-zero to produce instability and that the
degree o f instability increases with this distance - physically it means that a thicker pad is
m ore unstable than a thin pad which is not borne out in practice. Furthermore this led to
the conclusion by Hulten that stability could be achieved if the distance between the
neutral plane o f the brake pad and the interface could be made which is unrealistic.
With the friction element proposed for the present study in section 3.5.1 above
this problem is overcom e and the distance from the neutral plane is no longer a
necessary param eter in the formulation o f the interface element.
3.6 Component Interaction
It is p roposed in the present study to limit the component interaction to only the
pad and disc. Interaction o f the pads with the caliper via the piston and the paw is
considered as passive with the interface modelled using stiff springs. Previous studies
[6,7,43] show that the effect o f caliper stiffness on disc brake squeal propensity is not as
strong as the o ther parameters o f friction coefficient , damping and pad length.
Furtherm ore , the fist pin-slider type caliper is not a rigid assembly but several sub-
assemblies o f different materials ; for example the piston seal and the pin bushes are
m ade o f rubber thus introducing considerable flexibility to the assembly.The assumption
that the contribution o f the caliper to the system stability is small is not applicable to disc
brake groan analysis where the noise is at a low frequency o f less than 200 Hz and

Chapter Three - Methodology o f present study 63
involves the caliper body motion ; the caliper assembly must be included in analysis o f
such noise. The approach where only the pads and disc are considered has been used
successfully in squeal analysis by Ghesquire [46], Therefore the same approach is also
adopted in the present study
The action o f the piston and the paw on the inner and outer pads respectively is
represented by stiff springs. For the disc , constraints are applied to represent the top hat
portion near to the centre o f the disc to the wheel hub.
3.7 Stability Analysis
There are several m ethods which could be used for the assessment o f the stability
o f the disc brake system studied , namely :
a) the Routh-Hurwitz criterion
b) a transient solution o f the equations o f motion
c) by complex eigenvalues.
The w ork o f Kuo [70] can be used to explain the concept o f the Routh-Hurwitz
criterion as a m ethod for determining the right-hand or left-hand side location o f zeros
o f polynomials with constant real coefficient on the s-plane without actually solving the
equation. Consider the characteristics equations o f a linear time-invariant system o f the
form
F(s) = a 0sn + a , s n_1 + a 2s"~2 + ...........+ an_,s + a n = 0 (3.28)
w here all the coefficients are real numbers. The necessary but not sufficient conditions
for the roots o f this equation to have positive real parts are :
i) all o f the coefficients o f the polynomial have the same sign
ii) none o f the coefficients vanishes (i.e zero).

Chapter Three - Methodology of present study 64
F or these conditions to be met , the polynomial o f Hurwitz's determinants must all be
positive which can be checked using Routh tabulation The Routh-Hurwitz criterion
indicates the absolute stability o f the system but does not give the relative stability. The
advantage is that it does not require the solution o f the characteristic equation
Transient solution o f the equations o f motion o f the system would indicate the
presence o f an initially increasing amplitude or overshoot for a stable system as well as a
true instability but does not indicate which mode is responsible. M oreover for high
frequency vibrations such as squeal, the analysis may proved to be very computationally
costly as the time steps need to be sufficiently small
For a damped system where the damping matrix is included in the equation o f
motion o f the system , the eigenvalue problem [8] which can be stated in the form
below :
w here [K] , [C] and [M] are the stiffness ,damping and mass matrices correspondingly
which may be symmetric or unsymmetric and {<!>} is the i-th eigenvector
corresponding to i-th eigenvalue X, . Solution o f the above equation gives the complex
eigenvalues A., in the form:
(3.29)
Xj = o , ± j ( o
where
The dynamic response o f a particular m ode is

Chapter Three - Methodology o f present study 65
, , ( C . ± j(0 . ) t{ u , } = {O, }e 1 1 (3.30)
where t is time.
For i-th eigenvalue , the system is stable if a , is negative and unstable if a , is
positive.
Complex eigenvalue analysis can predict all the modes o f the system with the real
part o f the eigenvalue indicating the stability o f the m ode and the imaginary part the
frequency. This would allow correlation with experimental squeal results and the
unstable m odes could be made the focus o f the attempt to eliminate squeal. In detail ,
the results when displayed on the complex plane (also known as the s-plane) clearly
indicate the relative stability o f m odes and the root locus diagram may be used to track
the progressive instability o f the m ode concerned.
Even when damping is ignored , the eigenvalue o f a system may still be complex
as the inclusion o f a friction matrix causes the stiffness matrix which is comprised o f
real terms to be unsymmetric thus fulfilling one o f the necessary condition for a system
to have complex eigenvalues [71],
The advantages o f complex eigenvalue analysis over the other methods o f
identifying instability are obvious , with the strength lying mainly in the ability to clearly
identify the unstable m odes responsible for squeal. Therefore the method o f complex
eigenvalue analysis was adopted for the present study.
3.8 Complex Eigenvalues Analysis Using The Finite Element Method
The theory o f the finite element method in general is discussed in this section and
in particular with respect to eigenvalue problems based mainly on two references
[72,73], The finite element method can be broken into several major steps :

Chapter Three - Methodology o f present study 66
1) Transformation o f the boundary value problem into a more general and simpler form
for finite element approximation.
2) Discretization o f the domain and functions in the weak form. This in practice entails
the breakdow n o f the region into a finite number o f small elements. The coordinates o f
each nodal point o f the elements will define its geometry. The element connectivity o f a
finite element is the sequence consisting o f its node numbers. A typical example o f this is
shown in figure 3 .8 .The shape functions N ( or the element characteristic matrix) also
need to be defined.
1
rT) Element number
n N ode number
7
Figure 3 .13 Discretization o f the domain Q by 3 nodes triangular elements [73]
3) Derivation o f the stiffness and mass matrix. The stiffness matrix can be obtained by
various approach ( Galerkin , potential energy) but as the potential energy approach is
physically more representative it is used here.
Figure 3.14 shows a three dimensional body occupying a volume V and having a surface
S. The points on the body is located by x,y,z coordinates. The boundary is constrained
in some region w here displacement is specified. On some part o f the body traction force
T is applied. Under the force the body deforms in which the deformation o f a point is
given by the three com ponents o f its displacement :
u = [ u ,v ,w ]* (3.31)

Chapter Three - Methodology o f present study 67
Figure 3 .1 4 -
The distributed force per unit volume vector f is given by
f = [ f x , f y ,fz ] ' (3 32)
The surface traction T may be given by its component values at points on the surface
T = [Tx,Ty ,Tz]T (3.33)
A load P acting at point i is represented by its three com ponents
P = [Px , Py ,PZ]T (3.34)
The stresses acting on the elemental volume dV can be represented by six independant
com ponents as follows:
u=0
Three dimensional body [73]

Chapter Three - Methodology of present study 68
a = | a x ,CTv ,CTz , i vz, x xz, x xv| T (3.35)
w here a x , a y , a z are normal stresses and z y/, ,1^ , t xy are shear stresses.
The strain is represented in a vector form
8=[Ex , s y , s z ,Yyz,Yxz,Yxy]1 (3.36)
The general expression for the potential energy IT o f a continuum o f a volume V o f
solid material (figure 3.9) is given by
n - - jCTT8dV - j u TfdV - J uTTdS - X l'i‘ p. (3 37>2 V V S i
where the terms are as defined above and the last term Pi represents a force acting at
point i (in this case the point i is assumed to be a node) and u is the displacement at that
point. For a volume in which the area is constant (dV=Adx) and after discretization the
expression for potential energy becomes
n = X J a Ts A d x - Z j u ' f A d x - X j u ' T d x - X Q . P , (3.38)e e e e e e 1
or simplified as
n = Z ^ e - l j u Tf A d x - X | u TT d x - X Q lPl (3.39)e e e e e i
w here U e is the element strain energy given by

Chapter Three - Methodology o f present study 69
Using Hooke 's Law ct = Ee and by substituting e = Bq
a = EBq (3.41a)
w here B = element strain displacement matrix and q = displacement vector and the
subscript e indicates element. For one-dimensional element with linear shape function
the matrix B is given by
BX t - X2 1
■[-. l] (3.41b)
Thus U c = — J"q 1 B 1 E B q Adx (3.42)
or1
U e = — q 1 J[B‘ E B A d x ] q (3.43)
For a one-dimensional element with linear shape function , the natural or intrinsic
coordinate system denoted by and -1< < 1 can be used for the transformation
dx = *2 . X' d^ or dx = dE, (3.44)
where the subscript denotes the node number and le is the element length. The element
strain energy is now written as
u e = i q-1 J
(3.45)
since the B matrix is constant and E e is the Y o u n g ’s modulus o f the element.
Substituting B from equation (3.35a and 3.35b) and noting that J"d£, = 2 results in

Chapter Three - Methodology o f present study 70
q (3.46)
which is o f the form (3.47)
w here the element stiffness matrix ke is given by
(3.48)
The expression in equation 3 .42 gives the element stiffness matrix for a one-dimensional
element with a linear shape function. In general the element stiffness matrix is given :
The element stiffness matrices can then be assembled to form the global stiffness matrix
and q = [ Q 2, Q J T for element 2 where Q , is the displacement for node i) where the
elements o f each k L' are placed in the appropriate locations in the larger K matrix and
the overlapping terms are then summed.
Similarly, using the individual terms in equation (3.39) , the element body force
f e , the element traction force term T 1" and the point loads P can be evaluated.
Therefore the potential energy can be written using matrix notation in the form
(3.49)e
K by preserving the element connectivity ( for example q - [ Q , ,Q : ] for element 1
n = X q V q - I q 1 f e - £ q 1T 0 - £ P, Q (3.50)e o e
or n = - Q TK Q - Q TF (3.51)

Chapter Three - Methodology o f present study 71
w here after assembly K denotes and F denotes ^ ( f c + T L) + Pe e
The mass matrix can be derived from the kinetic energy term. For a solid body
with distributed mass , the kinetic energy T is given by
T = —| u 1 lipdVV
(3.52)
where p is the density , u is the velocity vector at point x with components u , v and w
as shown in figure 3.15.
z
A
Figure 3.15 Schematic diagram o f a body with distributed showing the velocity
com ponents [72],
In the finite element m ethod , the displacement o f each element is described in terms o f
the nodal displacement q and shape function N. Therefore
u = N q (3 53)
The velocity vector is then given by u = Nq

Chapter Three - Met hodology of present study 72
Substituting this into equation (3 .5 2 ) , the element kinetic energy is given by
Tc = q [ J * p N TN dV]q (3.54)
or m le = [ j p N TN dV ] (3.55)
m L is also known as the element mass matrix. Summing over all elements :
T = Z T e = S T q Tm eq = - Q TM Q (3 56)e e
w here M is the global mass matrix and Q is the global displacement matrix.
4) Statement o f the Eigenvalue Problem. After obtaining the global stiffness and mass
matrices K and M respectively , the Langrangian approach can be used to determine the
Langrangian term L :
L = T - If (3.57)
or L = - Q t M Q - - Q K Q - Q ' F (3 58)2
and by using Hamilton's Principle
d_dt
d id L
o q t^ = 0 (3.59)
Thus M Q + K Q = F (3.60)
For steady-state conditions starting from equilibrium , Q = U sin cot
and by rearranging equation 3.60 for F = 0 ,

Chapter Three - Methodology o f present study 73
or alternatively
K U = © M U
K U = >. M U (3-61)
which is a statement o f the generalized eigenvalue problem where X is the eigenvalue
and U the eigenvector. In the above approach damping was neglected. How ever the
friction force equation as stated in equations (3.17) and (3.18) is as reproduced below
for each interface node pair :
"o - mk 0 mk y i fv 1
0 - k 0 k zl fzl
0 mk 0 - mk y 2 fy20 k 0 - k _ z2 _ f z 2 j
(3.17)
or k f ]{ u } = {f} (3.18)
By summation over the elements K f = and Ff - '
Therefore K f Q = Ff (3.62)
The eigenvalue problem can then be rewritten to include the friction force acting at the
interface nodes by substituting for F :
M Q + K Q = K , Q
By bringing the right hand side to the left hand side
M Q + ( K - K , ) Q = 0
(3 63)
(3.64)
The effect is to make the global stiffness matrix unsymmetric because o f the inherently
unsymmetric friction matrix. According to Wilkinson [71] for eigenvalues problem if A
and B ( read K and M ) are real symmetric matrices but neither is positive definite then

Chapter Three - Methodology o f present study 74
the eigenvalues o f AB need not be real and the same applies to the roots o f det(A- XB)
=0. In the present case the mass matrix M is symmetric but the stiffness matrix
( K - K f ) is unsymmetric. Therefore the eigenvalues may be complex.
3.9 Method of analysis
As the pressure effect is represented in the form o f a varying contact stiffness
distribution and the pad - caliper interaction represented by stiff springs , the proposed
analysis o f disc brake squeal using the finite element method can be broken down into
the following steps :
1) Conduct free-free modal analysis o f finite element models o f the pad and the disc to
determine the natural frequencies and the corresponding mode shapes and correlate
these with the experimental results o f Fieldhouse and New com b [10]
2) Carry out a static contact analysis using the finite element model o f the pad as
derived in step (1) under the applied loading from either the piston and the paw to
estimate the contact pressure distribution for both the inboard pad (piston applied
pressure) and outboard pad (paw applied pressure) with the effect o f circumferential
friction effect and abutment arrangement taken into consideration.
3) Determine the contact stiffness for each node pair at the pad-disc interface from the
predicted reaction forces and the calculated contact stiffness- reaction force relationship
4) Carry out eigenvalue analysis o f the coupled pad-disc system with the boundary
conditions applied as stiff springs. As the inclusion o f friction causes the stiffness matrix
to becom e unsymmetric , the analyses will predict complex eigenvalues, the positive real
parts o f which would indicate the squeal propensity and the imaginary parts would
indicate the frequency. The corresponding eigenvectors indicate the mode shape o f the
unstable modes.
Steps 2 - 4 above are repeated for different pressure magnitudes.

Chapter Three - Methodology o f present study 75
3.10 Summary
The need for a new approach to analyse the effect o f contact pressure on disc
brake squeal has been discussed. The novelty o f the w ork lies in the fact that this effect
has never been modelled before despite the experimental and operational evidence that
squeal generally occurs at low applied pressures only. To understand this effect a new
modelling approach is proposed whereby the pressure distribution and also the surface
properties o f the interface including the effect o f friction is included in a stability
analysis o f the coupled disc-pad system.
It is argued that the coupling stiffness at each node should vary with the
m agnitude o f the reaction force at that p a i r , providing some form o f preloading to the
system and that the friction effect should also be included in the node pair interaction.
Since it is known that the reaction force distribution at the pad-disc interface is not
uniform this approach will take this non-uniformity into account.The passive
interaction between the pad and the caliper is modelled by the penalty formulation
whereby approximate stiffness are used to model the boundary conditions. The effect o f
the interface friction on the system stiffness is derived from first principles and using the
finite element method the resulting stiffness matrix when the interface friction element is
included becomes unsymmetric. This when taken into the eigenvalue problem may result
in complex eigenvalues. Stability analysis is carried out using complex eigenvalue
analysis with the real part o f the eigenvalue used as a measure o f the squeal propensity
and the imaginary part as the squeal frequency o f the system studied A disc brake
system has been selected which has been studied thoroughly using double pulsed laser
holography , thus providing the necessary experimental results for comparison.

C H A P T E R F O U R
MODAL ANALYSIS OF THE DISC AND PAD
4.1 Introduction
A major step in the proposed analysis o f disc brake squeal using the finite element
m ethod as discussed in C hapter Three is the development and validation o f finite element
m odels o f the major components , namely the disc and the pad. The models would then be
coupled for stability analysis with the friction effect included at the interface.
In the present chapter all the w ork related to modal analysis o f the components is
discussed. This includes the development o f the models , the results from the eigenvalue
analysis for the free-free condition and comparison with the experimental results o f
Fieldhouse and Newcom b [10], The chapter also describes substructuring , a technique by
which the number o f degrees o f freedom o f a finite element model can be reduced
significantly resulting in a reduced wavefront for the problem.

Chapter Four - Modal analysis of the disc and brake pad 77
4.2 General Method of Analysis
Finite element models o f the disc and the pad are developed and modal analysis
carried using the modal analysis option in the AN SY S Rev. 5.0A software [8] The natural
frequencies and mode shapes obtained are compared with the experimental results o f
Fieldhouse and N ew com b [10], The finite element model are then refined until acceptable
difference levels are achieved betw een prediction and experiment. In this analysis, damping
is neglected as in general structure analysis damping only affects the natural frequencies by
1-2% in most cases [75],
4.2.1 Limitations in the analysis
There are several limitations in the present analysis as discussed below :
1) The usual practice in the dynamic analysis o f a system which consists o f several
com ponents is to carry out the analysis o f the com ponents independently and finally to
couple them together. This m ethod implies the use o f constraints equations to connect the
nodes which are in contact and is adequate for passive node interactions ( no friction effect
involved ). H ow ever , the use o f a friction matrix to define the nodal interactions at the pad-
disc interface as proposed in Chapter Three does not permit the use o f constraint equations.
M oreover the interface nodes o f the disc and pads must have similar radial and
circumferential co-ordinates if possible in o rder to closely preserve the contact condition.
2) The present finite element software used (ANSYS Rev. 5.0A Educational Version) has a
maximum wavefront o f 400, which limits the number o f active degrees o f freedom in the
model and therefore also the degree o f refinement o f the model to get good correlation with
the experiment. A simplified model with many o f the degrees o f freedom removed would
help in reducing the wavefront and would also reduce the CPU time needed to solve the
problem. In order to achieve this a technique known as substructuring is used and for the
free-free natural frequency analysis the Reduced Householder [8] method is employed as it
readily utilises the active degrees o f freedom specified for the eigenvalue problem.

Chapter Four - Modal analysis o f the disc and brake pad 78
4.2.2 General substructuring theory
Substructuring analysis uses the technique o f matrix reduction in order to reduce the
number o f active degrees o f freedom [8], The matrix reduction technique was first
presented by Guyan [75], As the technique is widely used in the present study ,the theory
o f substructuring [8] will be discussed in some detail here.
In static problems where the inertia is ignored , the finite element equation is
reduced to :
[K] {u } = {F } (4.1)
w here [K] element stiffness matrix
{u } vector representing the total degrees o f freedom
{F} force vector
The problem can be reduced by selecting active degrees o f freedom , which are also known
as masters degrees o f freedom and are denoted here by subscript m, whilst the remaining
degrees o f freedom are considered as slave degrees o f freedom , denoted by subscript s. The
stiffness matrix can be partitioned into submatrices according to master and slave degrees o f
freedom as below :
Tf^mml I Kms I L IK sm] |K SS| {us } J L {Fs }
(4.2)
It is usual to arrange that {Fs }=0 i.e. external forces are applied at master degrees o f
freedom only.
Expanding equation (4.2) :

Chapter Four - Modal analysis o f the disc and brake pad
[ K m m K u m} + IK m s K u s} = { Fm}
[ K sm]{um } + [K ss]{us} = {Fs}
Solving for the slave degrees o f freedom in equation (4.4):
{ u s} = [K ss]-1{Fss} - [ K ss]-1 [K sm]{um}
Finally substituting equation (4.5) into equation (4.3):
I ^ m s l l ^ s s l | K sm] l ( u m } _ {Fm} I^ins 11KssJ {Fs}
or [K ]{ u } = {F}
where [ K] = [K mm] - [ K ms][K ss] ' [ K sm]
and {u} = {um}
and {F} = [Fm] - [ K ms][K ss] - , {Fs }
The same method can be extended to dynamic analysis :
[ M ]{u}+ [C ]{u} + [K]{u} = {F}
or in the sub structured form :
[M ] { U } + [ C ] { a } + [K]{u} = {F}
(4.3)
(4.4)
(4.5)
(4.6)
(4.7)
(4.8)
(4.9)
(4.10)
____ 79

Chapter Four - Modal analysis o f the disc and brake pad 80
where , by using Guyan's reduction technique [75] for mass reduction :
[M ] = [M m m] - [ K m s][K ss ] - 1[M sm ] - [ M m s][K ss ] - 1[K sm ] + [K m s][K ss] - 1[M ss][K ssr 1[K sm ]
(4.11)
The same approach can be used to derive the reduced damping matrix by simply
substituting the mass terms with the damping terms in (4.11).
The terms derived for the reduced mass , damping , stiffness and force matrices are
also known as the superelement coefficients , since in the finite element method the
technique o f reducing a component matrix is akin to forming a superelement with its own
mass,damping and stiffness matrices. The reduced stiffness matrix is said to be complete
since as shown in equation (4.7) all the elements o f the original stiffness matrice contribute.
In the case o f the reduced mass matrix , combinations o f stiffness and mass elements appear
As a result the completeness in the eigenvalue-eigenvector problem is said to be closely but
not exactly preserved [75],
4.2.3 Substructuring applied to eigenvalue problems
The eigenvalue problem in the reduced condition can be stated as follows:
( [ K ] - co2 [M ]){u} = {0} (4.12)
Thus the reduced eigenvalue problem is o f order (p) instead o f initial order (p+q) where p is
the number o f m aster degrees o f freedom and q the num ber o f slave degrees o f freedom.
The eigenvalues to2 obtained from the above equation are used to recover the global
displacement vector or m ode shape :

Chapter Four - Modal analysis o f the disc and brake pad 81
[Kmm] |Kms]
J K sml [Kss]_
where in this case the master degrees o f freedom vector { u m }is known from equation
It is clear from equation (4.12) that the problem size can be greatly reduced by using the
substructuring technique.
4.2.4 Selection of master degrees of freedom
As explained in the preceding sections , the substructuring technique requires the
freedom selected are important as they define the dynamics o f the reduced model ; this is
usually achieved by selecting degrees o f freedom which have a large ratio o f mass to
stiffness [8], In the pad-disc stability stability, the nodal degrees o f freedom which define the
nodal interaction at the interface need to be preserved. This entails the following
considerations :
a) All degrees o f freedom in the z-direction (normal to the disc rubbing surface) at
the pad-disc interface need to be retained as they are used in the friction matrix.
b) All degrees o f freedom defining the interaction between the pad and the external
environment (the piston pressure face, the paw pressure face and the abutments) need to be
retained.
c)All degrees o f freedom in the z-direction on the disc (normal to the disc rubbing
surface) need to be retained in o rder to adequately capture the disc diametral modes. Any
(4.12). By solving (4.13) the slave degrees o f freedom vector {us} is recovered and the
global vector or mode shape is obtained as
(4.14)
selection o f m aster degrees o f freedom from the complete model defmation 1 he degrees o f

Chapter Four - Modal analysis of the disc and brake pad 82
asymmetry introduced in the definition o f the disc master degrees o f freedom might
introduce separation o f the doublet modes o f the disc ; this should be avoided at the model
definition stage.
d)The total number o f master degrees o f freedom must be less than the number
allowed within the limited 400 wavefront. This is equivalent to a limit o f about 3 10 master
degrees o f freedom.
4.3 Eigenvalue Analysis O f The Disc
4.3.1 Disc model definition
The brake analysed in the present w ork is similar to the one used in the experiments
reported by Fieldhouse and N ew com b [10], The disc is plain (i.e. unvented), made from
grey cast iron and mounted to the wheel hub by four bolts on the top hat section o f the disc.
The disc cross section geometry and dimensions are shown in figure 4.1
Various experimental w ork [7,10,58,60] has shown that only the diametral modes
o f the disc are involved in squeal. This fact allows for a simpler representation o f the disc
and for exclusion o f the rigid body modes from the stability analysis. In a diametral mode it
is the rubbing surface o f the disc (shown dark grey in figure 4.1) which deforms at a
particular squeal frequency ; this information has been used in the representation o f the disc
as a beam with tw o simultaneous modes (translational and rotational ) as in the work o f
N orth [41] and others [7,42,43], In the present eigenvalue analysis o f the free-free disc ,
only the rubbing surface and the portion connecting it to the top hat part are therefore
considered as shown by the dark grey shade in figure 4.1.

Chapter Four - Modal analysis of the disc and brake pad 8.3
CL5.14
8.64
R31 .5
8.15R68.0 7IV
R73.15
R78.5
R120
E d isc = 120 GPa
density = 7550 kg/m3
7 P T
48.10
M/_10.25
Figure 4.1 - The cross-section dimension o f disc (all dimensions in mm)
The element type used in the analysis is a 4 noded three dimensional shell element ,
known as STIF63 in the A N SY S nomenclature. The advantage o f using this element over
an 8 noded isoparametric brick is obvious in terms o f the relative amount o f computational
time involved as the 4-noded shell element has half the number o f degrees o f freedom. In
order to investigate the optimum num ber o f elements to be used in the definition o f the disc
model , a study w as carried out in which the number o f elements in the radial direction on
the disc rubbing surface was fixed at four (which gives a width/thickness aspect ratio o f
about 1.0) and the circumferential angular definition (figure 4.2) is varied between 20 and 6
degrees.
Q A n gu la r definition
Figure 4.2 - Angular definition in the modeling o f the disc

Chapter Four - Modal analysis of the disc and brake pad N4
The reduced Householder method is used in the eigenvalue as it readily takes into
account all the necessary master degrees o f freedom and it is therefore suitable for the
analysis o f the substructured component. The master o f degrees o f freedom include all the
degrees o f freedom in z-direction on the rubbing surfaces o f the disc. As the angular
definition is reduced , more elements are defined and the problem size therefore increases.
M odal analysis is then carried out for each model with the results as shown in figure 4.3.
In figure 4.3, the predicted frequencies o f the diametral modes o f each model are
plotted together with the corresponding experimental results. The detail mode shape o f the
diametral modes is described in section 4 .3 .2 .It can be seen from figure 4.3 that for modes
that are below the fifth diametral mode (marked 5D) the frequencies for all the models are
less than the experimental values whilst for modes above the fifth diametral mode the
frequencies for all model are greater than the experimental values It is also clear that as the
angular definition is decreased (i.e. m ore elements ) the difference between the experimental
values and finite element analysis results reduces. The least difference occurs for an angular
definition o f 6 degrees.
As mentioned above the wavefront limit also restricts the definition o f the model. As
the master degrees o f freedom selected has to include all the nodes on the disc rubbing
surface , the number o f master degrees o f freedom also increases with decreasing angular
definition. The effect o f angular definition on the maximum wavefront o f the eigenvalue
problem is shown in figure 4.4. It is clear that as the model becomes more detailed the
wavefront size increases. The model with an angular definition o f 6 degrees has a maximum
wavefront size o f 371 which is approaching the 400 wavefront limit o f the present software.
It was also decided to investigate whether a full three dimensional model o f the disc
using 8 noded isoparametric elements (i.e. 'brick elements’) would improve the correlation
further. Based on this the previous results the angular definition o f the full disc was set at 6
degrees but as there are abrupt dimensional changes at the connection between the disc

Chapter Four - Modal analysis o f the disc and brake pad 85
rubbing surface and the top hat extra elements have to be introduced. This resulted in the
need for 23 elements per segment whilst the total number o f elements for the model is 1380.
The full model o f the disc is shown in figure 4.5a. Modal analysis is carried out for this
model using full subspace m ethod where all the degrees o f freedom o f the disc are included.
In comparison the simplified disc model using shell elements is shown in figure 4.5b.
The results from modal analysis o f the full and simplified models are shown in figure
4.6 together with the experimental results. It is clear from the plot that the full model is in
better agreement with the experimental results than the simplified disc. For the full disc
model the maximum difference occurs at the eighth diametral mode with the model
frequency 253 H z ( 2 .38% ) higher than the experiment whilst the simplified disc model has
a frequency o f 11225 Hz which is 585 Hz (5 .50% ) higher than the experiment.
Although the full disc model provides better correlation than the simplified disc
model, there is a time penalty associated with using the full disc model. The details o f the
problem size for both the full disc and simplified disc models are listed in Table 4.1. From
the table the number o f elements o f the simplified model is 300 with 1800 degrees o f
freedom whilst the number o f elements for the full model is 1380 with total 25920 degrees
o f freedom. M ore importantly is the time needed to solve the problem. The C PU time for
the full model is 8124.5 seconds whilst for the simplified model it is 74.56 seconds. In real
time the solution took 5 hours 28 minutes for the full model and 201 seconds for the
simplified model. It is therefore obvious that while on one hand the full model gives better
correlation it takes much longer to solve; on the o ther the simplified model is very much
faster and has acceptable correlation. Therefore it is decided to adopt the simplified model
for the subsequent coupled analysis as it is sufficiently accurate with very much reduced
computational time.

Chapter Four - Modal analysis o f the disc and brake pad 86
Frequency (kHz)
Mode shape
Figure 4.3 - The frequencies for the diametral m odes o f the disc for various angular
definition o f the disc model and experimental results.

Chapter Four - Modal analysis o f the disc and brake pad
2 4 6 8 10 12 14 16 18 20
A n gu la r defin it ion (degrees)
Figure 4.4 - The effect o f the angular definition o f the disc model on the wavefront size
(a) (b)
Figure 4.5 - The finite element model o f (a) full disc with 3D solid elements and (b)
simplified disc using shell elements

Chapter Four - Modal analysis o f the disc and brake pad
F requency (kHz)
2D 3D 4D 5D 6D 7D 8D
Mode s h a p e
Experiment
Simplified FE
Full FE
Figure 4.6 - Results for full and simplified disc model compared to experiment

Table 4.1 - Comparison between full model and simplified model o f the disc
Chapter Four - Modal analysis o f the disc and brake pad______________________________ 89
Full model Simplified model
Angular definition (deg.) 6 6
Type o f element 8 noded isoparametric brick 4 noded shell
No. o f elements 1380 300
Total no. d.o.f. 25920 1800
M ethod used Full subspace Reduced Householder
C P U time (s) 8124.5 74.56
Real time (s) 19690 201
PLOT NO 1 DISPLACEMENT
RSY§^(j H 5 DMX =1 489DSCA=0 010859 XV =1 W =1
\ j
rr>odal analyse disc
Figure 4.7a - 2nd diametral disc mode shape and equal displacement plot at 1145Hz.

Figure 4.7b - 3rd diametral disc mode shape and equal displacement plot at 1961 Hz
Chapter Four - Modal analysis o f the disc and brake pad
PLOT n o 2 DISPLACEMEI> STEP =1FrIo1961 RSYS=0 OMX -1 508
DSCA=0 010452 XV =1 YV =1
modal analysis disc
Figure 4 .7d - 5th diametral disc m ode shape and equal displacement plot at 4659 Hz

Chapter Four - Modal analysis o f the disc and brake pad______________________________ _____________91
Figure 4.7e - 6th diametral disc m ode shape and equal displacement plot at 6518 Hz
Figure 4 .7 f - 7th diametral disc mode shape and equal displacement plot at 8708 Hz
Figure 4 .7g - 8th diametral disc m ode shape and equal displacement plot at 11225 Hz

Chapter Four - Modal analysis o f the disc and brake pad 92
4.3.2 Results
The eigenvalue analysis o f the simplified model o f the disc showed a total o f 7
diametral modes within the frequency range studied o f 1 000 - 14 000 Hz. The mode
shapes are presented in figures 4 .7a-4.7g in the form o f the displaced shape o f the disc and
also equal displacement contours in order to allow two important factors to be considered :
i) The results from the eigenvalue analysis using the finite element method in the
form o f equal displacement contours are compared with the experimental results in the form
o f fringe lines (which also indicate equal displacement contour).
ii) The reconstructed holographic images [10] show only the fringe lines and this
when associated with the equal displacement contour plot provides a method to visualise
the m ode shape by referring to the corresponding displaced shape plot.
From the analysis o f the simplified disc model the first mode occurs at a frequency
o f 1145 Hz. The equal displacement contour plot in figure 4.7a shows clearly the nodal
lines (marked E) and the anti-node positions (contour lines marked A or I). There are four
nodes and four anti-nodes around the circumference o f the disc which indicate that it is the
second diametral mode.
The second mode occurs at a frequency o f 1961 Hz and figure 4.7b shows clearly
six nodal lines (marked E) and six anti-node positions (lines marked A and I) which confirm
that it is the third diametral mode.
The third m ode occurs at a frequency o f 3137 Hz and from the contour plot in
figure 4.7c there are eight node lines (lines marked E) and eight anti-node position (lines
marked A and I) which indicate that it is the fourth diametral mode.
The fourth m ode occurs at a frequency o f 4659 Hz with the displaced shape in
figure 4.7d showing that it is the fifth diametral mode and the contour plot from figure 4.7d

Chapter Four - Modal analysis o f the disc and brake pad 93
therefore showing ten node lines (lines m arked E) and ten anti-node positions (lines marked
A and I).
The fifth mode occurs at a frequency o f 6518 Hz and from the contour plot in
figure 4.7e there are twelve node lines (lines marked E) and twelve anti-node position (lines
marked A and I) which indicate that it is the sixth diametral mode
The sixth mode as shown in figure 4 .7 f occurs at a frequency o f 8708 Hz with the
displaced shape plot showing seven peaks and seven troughs and the contour plot showing
fourteen node lines (lines marked E) and fourteen anti-nodes position (lines marked A and
I) which confirm that it is the seventh diametral mode.
The seventh mode occurs at a frequency o f 11 225 Hz. As shown in figure 4.7g, the
displaced shape o f the disc model shows eight troughs and eight peaks whilst the contour
plot shows a total o f sixteen nodal lines (lines marked E) and sixteen anti-node positions
(lines marked A and I) which confirm that is is the eighth diametral mode.
In general all the above diametral modes which occur at frequencies below 12 kHz
have equal spacing o f nodes and anti-nodes ; this is a distinctive characteristic o f a diametral
mode.

Chapter Four - Modal analysis o f the disc and brake pad 94
4.4 Eigenvalue Analysis O f The Pad
4.4.1 Pad model definition
The brake pad modelled has the same dimensions as to the one used in the
experiments by Fieldhouse and Newcom b [10], The outer periphery o f the brake pad
follows very closely the circumference o f the disc and covers a sector o f 60 degrees. This
reduces to 45 degrees at the inner periphery. The radial width o f the pad is 40 mm at the
backplate tapering to 36 mm at the friction face. The backplate is o f mild steel ( E=205 GPa
, density = 7750 kg/m 3 ) and 5 mm thickness and the friction material ( E = 8 GPa , density
= 2250 kg/nr’ )is 12.5 mm thick. At both ends o f the pad is a portion o f the backplate
known as the 'e a rs ’ where the pad is abutted to a machined groove in the caliper as shown
in Chapter Three. A schematic diagram o f the pad is shown in figure 4.8.
In order to take into account the thickness o f the backplate and also that o f the
friction material , 8 noded isoparametric brick elements are used in the analysis as shell
elements are not suitable for this relatively low aspect ratio (width/thickness) geometry.The
resulting finite element model o f the pad is shown in figure 4 .9
The element definition o f the pad has to follow closely that o f the disc at the friction
interface. This results in the pad model being defined using a cylindrical coordinate system
with an angular definition around the circumference o f 6 degrees as for the disc. This
constraint is confined to the friction interface only as other parts o f the pad can be defined
independantly without affecting the interface. M aster degrees o f freedom are selected to
take into account factors (a),(b) and (c) outlined in section 4.2.3.3. The reduced
H ouseholder method is again used to determine the eigenvalues and eigenvectors o f the
model in the frequency range o f 1 kHz - 14 kHz.

Chapter Four - Modal analysis o f the disc and brake pad 95
108
FRICTION MATERIAL 1 12.5
11 1 PAD BACKPLATE 1 11 1 " ~ n. |
141
Figure 4.8 -
Y
F IN IT E E L E M E N T M O D E L O F T H E P AD
Schematic diagram o f the pad (all dimensions in mm)P L O T N O 1 E L E M E N T S T Y P E NUM
X V =1 Y V =1
SJ «1IS T = 0 0 8 2 6 2 9
X F = 0 .0 8 5 1 8 8 Y F =0 .0 4 9 2 8 1 " ‘ ">8625
Figure 4.9 - Finite element model o f the pad

Chapter Four - Modal analysis o f the disc and brake pad 96
Figure 4 .10a - Pad m ode shape and equal displacement contour plot at 2608 Hz
DSCA=0 833E-03 XV =1DIST=0 07285 XF =0 085411% ‘ SSSSiifPRECISE HIDDEN
S U KI =7 628
Figure 4 . 10b - Pad m ode shape and equal displacement contour plot at 4625 Hz
f e rDSCA=0 001151 XV =1DIST=0 072446
pr e ”c is ^ h ?d d e n
PLOT NO 3 I NOPAL SOLUTION
FREO=5813UZRSYS=0 DMX =6 268 SMN --5 986 SMX =6 04 A -5 3 1 8
£
MODAL ANALYSIS OF PAD
Figure 4 .10c - Pad mode shape and equal displacement contour plot at 5813 Hz

Chapter Four - Modal analysis o f the disc and brake pad
MODAL ANALYSIS OF PAD
)AL?OLUnON
FREO=71«7UZRSYS=0 DMX -0 106 SMN =-3 311
N i l
Figure 4. lOd - Pad mode shape and equal displacement contour plot at 7147 Hz
MODAL ANALYSIS OF PAD
Figure 4. lOe - Pad mode shape and equal displacement contour plot at 9579 Hz
PLOT NO 6 NODAL SOLl/T
uzRSYS-Ci DMX ;9 434 SMN =-6 475
Figure 4 1 Of - Pad mode shape and equal displacement contour plot at 9992 Hz

Chapter Four - Modal analysis of the disc and brake pad
Figure 4 .10g - Pad m ode shape and equal displacement contour plot at 10723 Hz
Figure 4. lOh - Pad mode shape and equal displacement contour plot at 1 169j Hz
Figure 4. lOi - Pad m ode shape and equal displacement contour plot at 11765 Hz

Chapter Four - Modal analysis o f the disc and brake pad 99
4.4.2 Results
The eigenvalue analysis o f the above pad model predicted a total o f 9 modes within
the frequency range 1 000 Hz - 14 000 Hz studied. From the results , the first mode
occurring at a frequency o f 2608 Hz is o f the first bending type as clearly shown in the
displaced shape plot o f figure 4.10a. The figure also shows the mode shape in the form o f
equal displacement contours which indicate the minimum displacement occurring at the
centre line o f the pad i.e. this position is an anti-node. It can be seen that the contour lines
are more closely spaced at the ends o f the backplate indicating that the ears displace more
relative to o ther parts o f the brake pad (due to the lower stiffness in this region).This mode
shape is hereafter termed the first bending mode designated mode ( B 1).
The second mode occurring at a frequency o f 4625 Hz is also o f the bending type
as clearly shown in figure 4.10b. From the equal displacement contour plot, there are 3
nodes (shown as lines marked E with displacement contour value 0 .0 005 ) ; one o f the nodes
is situated at the pad centreline and the o ther two at either end o f the friction face o f the
pad (the part connecting the ears to the pad). This mode shape is termed the second bending
mode (B2) in the following discussion.
The third m ode occurring at a frequency o f 5813 Hz is not o f the bending type
shown in figures 4.10a-b. The mode shape shown in figure 4.10c could be more properly
described as a twisting mode. The equal displacement contour plot indicates two nodal line
running diagonally across the pad from the ears and curving to the pad centre. The fringe
lines lying diagonally on the ears are o f different orientation from those on the ears for the
bending modes which lie horizontally. This mode shape is termed the first twisting mode
(T l) .
The fourth m ode occurring at a frequency o f 7147 Hz is again o f the bending type
as shown in the mode shape plot o f figure 4.1 Od. The equal displacement contour plot
shows four nodal lines on the pad , beginning with the one lying nearest to the ear (marked

Chapter Four - Modal analysis o f the disc and brake pad 100
C) and and another one on the pad quarter line repeated on the other half o f the pad. There
is an anti-node line (marked E) at the centre o f the pad and other anti-nodes in between the
nodes and the ends o f the ears. This mode shape is termed the third bending mode (B3).
The fifth mode at a frequency o f 9579 Hz and shown in figure 4. IOe is o f a similar
twisting type to the one shown in figure 4.6c but o f a different order. There are three node
lines , one running across the central part o f the pad and one running across the lower
quarter o f each half o f the pad as shown in the equal displacement contour plot. This mode
shape is termed the second twisting mode (T2).
The sixth mode shown in figure 4.1 Of is also o f the twisting type and perhaps o f
similar order to the one discussed above but with the displacement o f the lower portion o f
the middle o f the pad more developed compared to figure 4.6e For the purpose o f the
discussion this mode shape is also termed the second twisting mode (T2b).
The seventh mode occurs at 10 723 Hz and cannot be clearly described as belonging
to the either bending or twisting type. As shown in figure 4.10g , the ears are undergoing
twisting motion with the equal displacement contour lines lying across the ear at both ends.
This mode shape is termed the twisting ears mode (TE) in the discussion.
The eighth mode occurs at 11 693 Hz and is o f the bending type as shown in the
displaced shape plot o f figure 4.1 Oh. The equal displacement contour plot shows three node
lines lying across the pad , one at the middle and one on either side, and there is also a node
line at each ear making a total o f 5 node lines on the pad This mode shape is termed the
fourth bending mode (B4) in the discussion.
The ninth mode occurs at a frequency o f 11 765 Hz and is o f the twisting type as
can be clearly seen in both the displaced shape and the equal displacement contour plots o f
figure 4. lOi which show similar trends to those o f figures 4.10c and 4. lOf. This mode shape

Chapter Four - Modal analysis o f the disc and brake pad 101
which is one order higher than the one shown in figure 4.1 Of is termed the third twisting
mode (T3).
To summarise , there are in general two major types o f modes which are either o f
the bending or twisting variety with the mode order increasing with the frequency ; there is
also one mode which does not fit neatly into either o f these two categories since it involves
a major movement o f the pad ears only.
4.5 Comparison With Experiments
The experiments on disc brake noise using holographic interferometry by Fieldhouse
and Newcomb [10] provide ample experiment evidence for comparison with the finite
element results. The plain disc and brake pad modelled in the analysis are very similar to
those used in the experiments therefore allowing for direct comparison. Due to the
importance o f understanding the reconstructed images , the basic mechanics o f the
holographic interferometry technique based on [61] are discussed here.
The interpretation o f the results from the reconstructed holographic images are
based on the fact that the minima o f the superimposed waves seen as dark fringes occur at
points where the d isplacem ent, d , satisfies the following equation:
d = (2n + l)A ,/(2 (cosa + cosP) (4.15)
where a is the angle o f incident o f the light wave from the normal plane to the object and P
is the angle o f reflection. If the light source could be made as perpendicular as possible to
the o b je c t, both angles would be sm all, thus
d = (2n + 1) A, / 4 (4.18)

Chapter Four - Modal analysis of the disc and brake pad 102
Therefore , the first minimum occurs at n=0 , d=X/4 the following minimum at n=l,d=3A74
and so on. Thus, two neighbouring fringes have a displacement difference o f half a
wavelength. The relative vibration velocity o f the points can be obtained by dividing the
displacement difference by the pulse separation time At. The relative velocity is therefore
proportional to the fringe density , the number o f interference fringes per unit length. A high
fringe density also indicates a node o f the displaced shape [61], These facts are used to
interprete and translate the reconstructed holographic images into a more meaningful mode
shape description.
4.5.1 The experimental results for the free-free disc
The reconstructed holographic images presented in [10] for the disc mode shapes
are reproduced here in figure 4.11. As the images are o f relatively difficult to understand the
significance o f the fringe lines o f the images are discussed in here withsome detail. The
region o f high fringe density (nodes) and low fringe density (anti-nodes) for the diametral
modes are distributed uniformly around the circumference o f the disc and can be identified
quite readily. There are other modes in addition to the diametral modes , amongst which are
the circumferential modes (with the fringe lines in concentric circles about the disc centre).
However as only the diametral modes are the only modes o f interests in squeal problems ,
these are fully discussed here whilst other mode types are ignored.
In figure 4.11 the natural frequencies and the corresponding mode shapes o f the disc in the
free-free condition are shown in the form o f reconstructed holographic images. The
experimental results show that the first mode occurs at a frequency o f 1100 Hz with the
disc undergoing deformation with one end o f the diametral up (maxima) and the opposite
end o f the diameter down (minima).This skew mode shape is not categorized as either
diametral or circumferential mode.

Chapter Four - Modal analysis o f the disc and brake nad 103
The second mode occurs at a frequency o f about 1400 Hz and shows part o f the
four nodal lines and and four anti-nodes position o f the second diametral mode. The top hat
portion o f the disc does not show any fringe lines which indicates an undeformed shape.
The third mode occurs at a frequency o f 2200 Hz. The fringe lines on the disc are in
the form o f several circular lines concentric about the disc centre. This is the first
circumferential mode o f the disc.
Following closely on the third mode is the fourth mode at 2280 Hz with the fringe
lines clearly showing six node lines and six anti-nodes positions around the circumference
which indicate that this is the third diametral mode.
The fifth mode is also a diametral mode occurring at 3400 Hz. The figure shows
eight node lines and eight anti-nodes position around the circumference which indicates the
fourth diametral mode.
The sixth mode occurs at a frequency o f 4800 Hz. The figure showed ten node lines
and ten anti-nodes positions around the circumference which indicates the fifth diametral
mode.
The seventh mode occurs at a frequency o f 6400 Hz. The fringe lines in the figure
show twelve node lines and twelve anti-nodes position along the circumference indicating
the sixth diametral mode.
The eighth mode occurs at a frequency o f 6800 Hz and does not belong to either the
circumferential or diametral mode groups. The ninth mode which also does not belong to
either the diametral or circumferential mode classifications occurs at a frequency o f 7400
Hz.

Chapter Four - Modal analysis o f the disc and brake pad 104
The tenth mode occurring at a frequency o f 8400 Hz is a diametral mode. The fringe
lines in the diagram show fourteen node lines and fourteen anti-nodes positions around the
circumference indicating the seventh diametral mode.
The eleventh mode occurring at a frequency o f 10 600 Hz is also a diametral mode.
The fringe lines in the diagram show sixteen node lines and sixteen anti-node positions
along the circumference indicating the eighth diametral mode.
The ninth diametral mode occurs at a frequency o f 12 960 Hz with the fringe lines in
the diagram clearly showing eighteen node lines and eighteen anti-node positions around the
circumference.
Between the eighth diametral mode (10 600 Hz) and the ninth diametral mode (12
960 Hz), there are four other modes which do not belong to either the circumferential or
diametral mode classifications and cannot be easily described These modes occur at
frequencies o f 12 000 Hz , 12 450 Hz , 12 500 Hz and 12 700 Hz respectively.
Except for the eighth and ninth diametral modes , the top hat portion o f the disc do
not show any significant fringe line density relative to the friction face o f the disc which
indicates this is a relatively stationary part o f the disc. This aspect o f the experimental
results supports the assumption that the top hat does not participate in the vibration at the
natural frequencies o f the diametral modes and therefore can be correctly omitted from the
analysis.
There is a total o f 16 elastic modes within the frequency range o f 0 -13 000 Hz
studied in the experiment and eight o f which belong to the diametral mode category and
only one mode to the circumferential mode category with the remaining seven modes
belonging to neither classification. As the diametral modes are the only modes which
participate during squeal, these are the most important and their frequencies are listed in
table 4.2.

Chapter Four - Modal analysis o f the disc and brake pad 105
Table 4.2- Frequencies o f the first eight diametral modes for the 'free-free' disc
Diametral Mode Frequency (Hz)
2nd 1400
3rd 2280
4th 3400
5th 4810
6th 6450
7th 8410
8th 10640

DIAM
ETRA
L M
ODE
OR
DER
Chapter Four - Modal analysis o f the disc and brake pad 106
FREQUENCY tkHi)
Figure 4.11 - Reconstructed holograms showing modes o f vibration o f the disc [10]

Chapter Four - Modal analysis o f the disc and brake pad 107
4.5.2 The experimental results for the free-free pad
In the experiments on the pad [10] , the piezo-electric crystal exciter was mounted
at 45 degrees to the pad longitudinal axis. This fact is important because if the exciter lies at
the node o f any mode o f the pad , then that particular mode cannot be excited. From figure
4.12 , the areas o f high and low fringe density can be used to deduce the positions o f the
nodes and antinodes present in the reconstructed images o f the pad.
From the experimental results in [10], it is apparent that there are other modes
present above 11 kHz but , as all the squeal modes in the experiments occured at a
frequency below 11 kHz, these higher frequency modes are not considered. Furthermore, as
the boundary condition for the supported condition o f the pad during squeal is stiffer than
for the free-free condition, the natural frequencies associated with the pad during squeal
must be higher than those occurring under free-free conditions. From inspection o f the
results published in [ 10], it is not easy to ascertain the position o f the nodes and antinodes
o f the torsion modes and the mode shapes are deduced from the experimenters' observation
that the torsion modes produce fringe lines running horizontally to the 'ears' o f the pad
rather than vertically as in the bending modes
The first mode occurs at a frequency o f 2692 Hz and is o f the first bending mode
type (B l). There is a clear anti-node at the centre o f the pad and two nodes equidistant
from the pad centreline with the fringe lines on the pad ears showing maximum
displacement. The fringe lines is indicate a similar trend to the finite element contour plot
shown in figure 4.10a.
The second mode occurring at a frequency o f 4231 Hz is o f the second bending
mode (B2) type and has a similar trend o f fringe lines to the finite element contour plot o f
figure 4 .10b. There is a clear node position at the centreline o f the pad and two anti-nodes
equidistant from this position which suggests a second bending type o f mode.

Chapter Four - Modal analysis o f the disc and brake pad___________________________________________108
RECONSTRUCTED HOLOGRAMS SHOWING MODES o f VIBRATION Of A TEVES PAD
« 1 5 D > *
I 2 3 4 5 6 7 8 9 « II I II 13 W IS 16 17FiitQ
IB 19 20bENCY (kHz',
Figure 4.12 - Reconstructed holographic images for the free-free pad [10]

Chapter Four - Modal analysis o f the disc and brake pad 109
The third mode occurs at 7154 Hz and has 3 anti-nodes positioned across the pad
friction surface suggesting the third bending mode (B3). Furthermore the fringe line trend is
similar to that shown in figure 4. lOd.
The fourth mode occurring at 7615 has a significant fringe density only at the ears o f
the pad. This suggests an almost flat pad and therefore a mode shape where only the ears
bend i.e. the bent ears mode (BE). The fringe lines o f this mode closely match the contour
plot shown in figure 4.10g.
The fifth mode occurs at 8770 Hz and the image shows clearly fringe lines lying
across the ears (parallel to the pad horizontal axis). Although the fringe formation across
the friction face is not easily described, it is noted that there is only one curved fringe across
this face and two small curved fringes at either end connected to the fringe lines on the
ears. This is similar to the second twisting mode (T2a) o f figure 4.1 Oe.
The description is similar for the subsequent mode occurring at 10595 Hz which has
tw o curved fringe lines across the friction face and one small curve fringe lines connected to
the fringe lines on both ears. This mode is described as also the second twisting mode but
labelled as mode T2b as it occur at higher frequency than the the second twisting mode
described above and is similar to the mode T2b shown in figure 4 lOf.
It should be noted that there was no indication o f the first torsion mode in the
reconstructed holographic images presented in [10], The first torsion mode would have a
node line running across the pad at approximately 45 degrees to the pad longitudinal axis.
As such a node line may coincide with the position o f the exciter crystals and as a mode
cannot readily be excited at its node this particular mode was probably missed.The
experimental results for the pad under free-free condition for frequencies less than 12 kHz
are summarised in table 4.3.

Chapter Four - Modal analysis o f the disc and brake pad 110
Table 4.3 - The experimental mode shapes and natural frequencies for the brake pad
Number o f nodes/antinodes M ode shape description Frequency (Hz)
Node=2,Antinode=l First bending 2692
Node=3,Antinode=2 Second bending 4231
Node=4,Antinode=3 Third bending 7154
2 nodes at both ends 'Bent ears' 7615
2nd twisting 8770
2nd twisting 9667
‘Twisted ears’ 11167
Node=5,Antinode=4 Fourth bending 11583
4.6 Discussion
The results obtained from the analysis and the experiments o f [10] are compared on
the basis o f similar mode shapes. For the disc, only the diametral modes as shown in figures
4.7a-g are considered as it is only these which are involved in squeal. All the diametral
mode shapes from the experiments are reproduced by the finite element model with close
agreement. The frequencies from the simplified finite element model also generally follow
closely those from the experiment as shown in figure 4.6. Relatively large discrepancies
occur at both ends o f the frequency range : at the lower end the maximum frequency
difference between the experimental and model results for the second diametral mode
(marked 2D) is 255 Hz (18.2 % ) whilst at the higher end for the eighth diametral mode
(marked 8D) the difference is 585 Hz (5.5%). In relative terms the errors are always less
than 10% except for the second and third diametral modes (18.2% and 13.9%
respectively). The experimental results o f Fieldhouse and Newcomb [10] indicate that the
second diametral mode is not involved with squeal and the third diametral mode is only
involved for a trailing edge abutment. Therefore results for the second and third diametral
mode are less important for the present analysis o f squeal. The best correlation occurs for

Chapter Four - Modal analysis o f the disc and brake pad 111
the fifth , sixth ,seventh and eighth diametral mode where the errors are less than 5%.
Therefore results involving these diametral modes can be treated with confidence and the
finite element model o f the disc is acceptable for the present purpose o f squeal analysis.
In the case o f the pad , frequencies for all the mode shapes which can be directly
compared such as the bending and twisting modes are included in the comparative plot o f
figure 4.13. It can be seen that there is one mode from the experiment which has not been
reproduced directly in the finite element analysis o f the pad i.e. the bent ears mode marked
BE in figure 4.13. Results from modal analysis o f the pad model using the reduced
Householder method is compared with the full subspace method. As discussed above the
reduced Householder method allows reduction o f the problem size with the selection o f
suitable masters whilst the full subspace method takes into account all degrees o f freedom in
the pad model.

Chapter Four - Modal analysis o f the disc and brake pad 112
Frequency (kHz)
Expt.
+ " Reduced
Subspace
Mode shape
Figure 4.13 Com parison o f experimental and finite element natural frequencies for the pad

Chapter Four - Modal analysis o f the disc and brake pad 113
Figure 4.13 shows that overall the pad finite element model achieves good
agreement with the experimental results especially at the lower end o f the frequency range.
Relatively large differences occur for the higher frequency twisting mode o f T2a for which
the frequency o f the reduced model is 529 Hz (5.90% ) higher than the experiment whilst the
full model gives a frequency o f 8389 Hz which is 561 Hz (6.27%) lower than the
experiment. All other modes gives relative differences o f less than 5%. These differences
can be attributed to the fact that the brake pad is a composite component made o f two
different materials and that in particular the friction material may have anisotropic material
properties which can only be approximated. Further refinement o f the pad model is limited
by the finite element definition o f the disc as the nodes on the pad friction surface need to
have the same (r,0) coordinates as the corresponding nodes o f the disc to allow coupling at
the later stage o f stability analysis. However the maximum error from the pad model is only
6% and the model is therefore considered acceptable for the present purposes.
4.7 Summary
A finite element model o f the simplified disc has been constructed and the results
from free-free natural frequency analysis indicate that the predicted diametral modes o f the
disc compare well with the experimental results with differences in frequency o f generally
less than 10% (with the exception o f the second and third diametral modes). The simplified
shell element model o f the disc (with an angular definition o f 6 degrees) and the master
degrees o f freedom chosen (which are in the z-direction only) are adequate for dynamic
analysis purposes. The pad finite element model also predicted mode shapes o f very close
similarity to the experimental results and the differences in frequency were less than 6%
with master degrees o f freedom chosen in the z-direction only (except for the abutment
nodes). This study has shown that both the disc and pad models as well as the master
degrees o f freedom selected are adequate for the subsequent stability analysis.

C H A P T E R FIVE
CONTACT PRESSURE ANALYSIS OF THE BRAKE PAD
Page 114
5.1 Introduction
The disc brake assembly used in this study consists o f three major components ,
the caliper , the disc and the pads. The caliper interacts with the inner pad via the
piston and with the outer pad via the paw. Both pads are prevented from
circumferential motion by the abutments which can operate either on the leading or
trailing edge o f the pad or on both. The contact at these external connections is
modelled as stiff springs thus avoiding the need to include a caliper model in the
stability analysis. The most active interactions occur between the pads and the disc and
the pad-disc interface is o f utmost importance because this is where the circumferential
friction force excites the transverse motion o f the disc and the pads. Therefore it is
necessary to determine the contact area and pressure distribution between the pads and
disc for various conditions in order to provide the information for calculation o f the
contact stiffness magnitude and distribution for the subsequent stability analysis.

Chapter Five - Contact Pressure Analysis of The Brake Pad 115
In this chapter , the distribution o f reaction force at the pad-disc interface under
the applied load from the brake line pressure is studied using the finite element method.
The study covers the effect o f friction coefficient , the abutment arrangement , the
form o f loading (piston or paw) and the friction material Y oung’s modulus.
5.2 Method of analysis
The finite element model o f the pad used in this study is similar to the one
derived for the natural frequency analysis reported in Chapter Four. However in order
to carry out the contact analysis efficiently the specialised non-linear finite element
package ABAQUS [10] was used for this stage o f the work. The most suitable method
o f representing the contact effect at the interface in ABAQUS is the so-called interface
gap element. This element models two surfaces which may maintain or lose physical
contact and may also slide relative to one another with the option o f specifying
tangential stiffness for the stick condition. During application o f the disc brake system,
sliding is continuous and therefore no tangential stiffness was specified. The element
has two degrees o f freedom at each node, these being the displacements in the normal
and tangential directions. A small initial gap is usually specified arbitrarily to provide
an initial condition when there is no contact. As the nodes move closer tow ards one
another the gap will become smaller until the displaced nodes touch at which point the
contact becomes effective and a reaction force occurs. The gap element and the force-
deflection relationship in the normal direction is shown in figure 5.1.
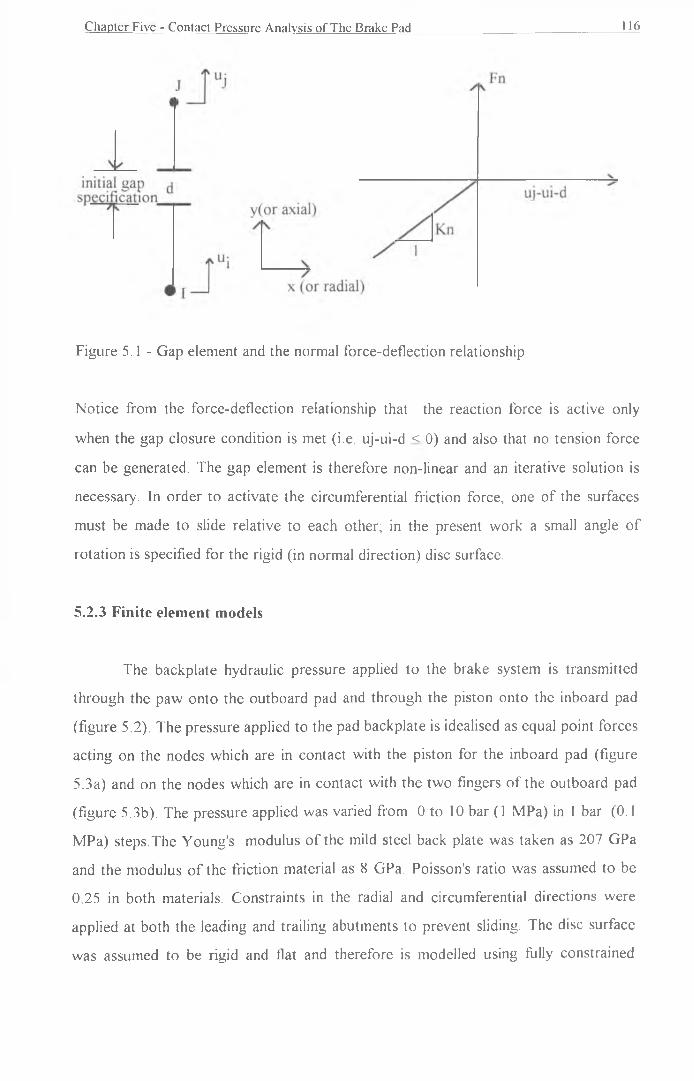
Chapter Five - Contact Pressure Analysis o f The Brake Pad 116
Figure 5 .1 - Gap element and the normal force-deflection relationship
N otice from the force-deflection relationship that the reaction force is active only
when the gap closure condition is met (i.e. uj-ui-d < 0) and also that no tension force
can be generated. The gap element is therefore non-linear and an iterative solution is
necessary. In order to activate the circumferential friction force, one o f the surfaces
must be made to slide relative to each other; in the present work a small angle o f
rotation is specified for the rigid (in normal direction) disc surface.
5.2.3 Finite element models
The backplate hydraulic pressure applied to the brake system is transmitted
through the paw onto the outboard pad and through the piston onto the inboard pad
(figure 5.2). The pressure applied to the pad backplate is idealised as equal point forces
acting on the nodes which are in contact with the piston for the inboard pad (figure
5.3a) and on the nodes which are in contact with the two fingers o f the outboard pad
(figure 5.3b). The pressure applied was varied from 0 to 10 bar (1 MPa) in I bar (0.1
MPa) steps.The Young's modulus o f the mild steel back plate was taken as 207 GPa
and the modulus o f the friction material as 8 GPa. Poisson's ratio was assumed to be
0.25 in both materials. Constraints in the radial and circumferential directions were
applied at both the leading and trailing abutments to prevent sliding. The disc surface
was assumed to be rigid and flat and therefore is modelled using fully constrained

Chapter Five - Contact Pressure Analysis of The Brake Pad 117
target nodes corresponding to the pad surface nodes. The analyses were initially
performed both for zero friction (m=0) and for a typical operating value ( = 0.4).
Figure 5.2 - Actual position o f the paw (chain lines) and piston (dashed lines) relative
to the pad
itpfts
m,r-MBi
(a) Piston applied force (b) Paw applied force
Figure 5.3 - Idealised point forces acting on the pad finite element model
5.4 Results
5.4.1 Effect of circumferential friction
The important results from the present analysis are the nodal reaction forces at
the pad friction interface which are used in the subsequent work for the determination
o f nodal contact stiffness. The nodal reaction force for each node is selected and
displayed on a 3-dimensional graph showing the coordinates o f the nodes (angle and

Chapter Five - Contact Pressure Analysis of The Brake Pad
radius) and the magnitude o f the reaction force for each pad friction interface node.
The position o f these nodes is defined in figure 5.4. The interface nodes which have
angular coordinates o f less than 6 degrees are considered the leading edge nodes whilst
the nodes which have angular coordinates o f more than 54 degrees are considered the
trailing edge nodes.
Figures 5 .5 and 5 .6 show the effect o f piston applied pressure and paw applied
pressure respectively on the nodal reaction force at a line pressure o f 10 bar. The nodal
reaction force distribution in both cases is non-uniform , and for the zero friction
condition (Fig. 5.5a & 5.6a) , the distribution is symmetrical about the centre line ( 30
degrees location). The effect o f friction in both the piston and paw applied pressure
cases is to shift the reaction force distribution tow ards the leading edge. In the case o f
the piston applied pressure , there is an increase in the number o f nodes in contact
when friction is included , with all the nodes forward o f the centreline o f the pad
coming into contact as well as an additional node at the 48 degrees line (inner radius).
Therefore the effect o f friction for the piston applied pressure case is to spread the
contact area further tow ards the leading edge whilst at the same time reducing the
magnitude o f the maximum reaction force from 114.9 N to 109.5 N. For the paw
applied pressure case , all the nodes are in contact initially except for the 3 nodes
across the centre line at the inner radius o f the pad (due to the shape o f the paw).
When friction is included , the number o f nodes in contact is reduced from 50 to 38 out
o f a total o f 53 nodes at the model interface. This loss o f contact results in an increased
reaction force at the leading edge , thus making the reaction force distribution
asymmetric.
In general , these analyses show that for a relatively concentrated load (as in
the case o f the piston applied pressure) the effect o f friction is to increase the number
o f nodes in contact whilst for a more distributed load (as in the case o f the paw applied
pressure) the effect is to reduce the number o f nodes in contact. In both cases, friction
enhances the reaction force at the leading edge and reduces the reaction force at the
trailing edge. Figure 5 .7 illustrates the displaced shape o f the pad under piston applied
pressure and clearly show the lifting o f the trailing edge o f the pad.

Chapter Five - Contact Pressure Analysis of The Brake Pad119
Figure 5.4 - Position o f the interface nodes on the pad friction surface

Chapter Five - Contact Pressure Analysis of The Brake Pad 120
Reaction force
120
100
80
60
40
20
[Nj
/ ’
0 0Trailing
edge
O uterradius
Inmicr radius12 18 24 30 36 42 48 54 60
Leading
N ode location (degrees)edge
(a) (i=0
edge Node location (degrees) edge
(b) (i=0.4
Figure 5.5- Nodal reaction force at the pad interface under piston applied pressure

Chapter Five - Contact Pressure Analysis of The Brake Pad 121
Reaction force
Leadingedge
12 ' 18 24 30 36 42 48 54 60Trailing
N ode location (degrees) c(jpc
Inner radius
(a) (i=0.0
edge edge
(b) n=0.4
Figure 5.6 - Nodal reaction force at the pad interface under paw applied pressure
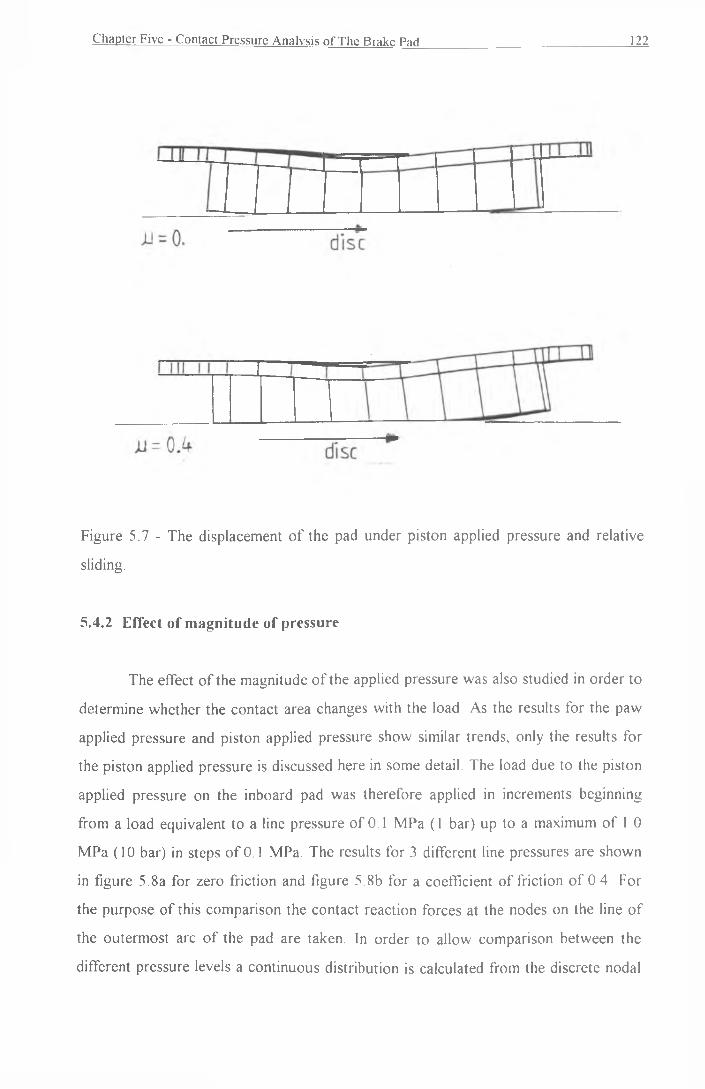
Chapter Five - Contact Pressure Analysis o f The Brake Pad 122
Figure 5.7 - The displacement o f the pad under piston applied pressure and relative
sliding.
5.4.2 Effect of magnitude of pressure
The effect o f the magnitude o f the applied pressure was also studied in order to
determine whether the contact area changes with the load As the results for the paw
applied pressure and piston applied pressure show similar trends, only the results for
the piston applied pressure is discussed here in some detail. The load due to the piston
applied pressure on the inboard pad was therefore applied in increments beginning
from a load equivalent to a line pressure o f 0.1 MPa (1 bar) up to a maximum o f 1.0
M Pa (10 bar) in steps o f 0.1 MPa. The results for 3 different line pressures are shown
in figure 5.8a for zero friction and figure 5.8b for a coefficient o f friction o f 0 4. For
the purpose o f this comparison the contact reaction forces at the nodes on the line o f
the outerm ost arc o f the pad are taken. In order to allow comparison between the
different pressure levels a continuous distribution is calculated from the discrete nodal

Chapter Five - Contact Pressure Analysis o f The Brake Pad 123
reaction forces. This is done by taking into account the distances between the
neighbouring nodes resulting in specific reaction force as defined below:
Specific reaction force = Average nodal reaction force between 2 nodes
Distance between the 2 nodes
The area under the resulting curve (as shown in figures 5.8a and 5.8b) is the total
nodal reaction force for the the line around the outermost arc considered. For zero
friction coefficient , the specific pressure distribution is symmetrical for all pressure
magnitudes and the effect o f increasing pressure is to increase the reaction force
magnitude in a linear manner as shown in figure 5.8a. It is is also apparent that the
number o f nodes in contact does not change with the pressure magnitude.
Figure 5.8b shows that the corresponding pressure distribution with friction
included is shifted tow ards the leading edge and is no longer symmetric. However the
effect o f the pressure magnitude on the reaction force is still linear. Again there is no
change in the number o f nodes in contact as the pressure magnitude increases. Thus
the linear relationship between the nodal reaction force and the applied pressure is
maintained even when friction is present.

Chapter Five - Contact Pressure Analysis of The Brake Pad
Specific reaction force [N/m]
Specific reaction force (N/m|
(b) |.l=0 .4
Figure 5 .8 - Specific reaction force distribution for different magnitudes o f line
pressure (piston applied pressure)
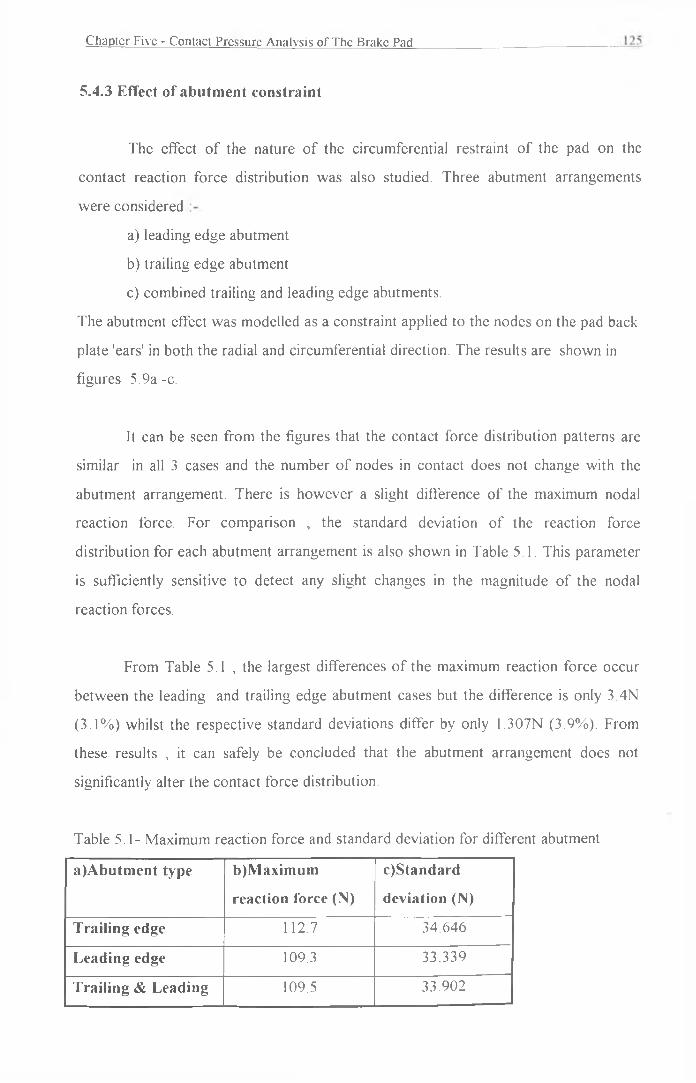
Chapter Five - Contact Pressure Analysis o f The Brake Pad
5.4.3 Effect of abutment constraint
The effect o f the nature o f the circumferential restraint o f the pad on the
contact reaction force distribution was also studied. Three abutment arrangements
w ere considered
a) leading edge abutment
b) trailing edge abutment
c) combined trailing and leading edge abutments.
The abutment effect was modelled as a constraint applied to the nodes on the pad back
plate 'ears' in both the radial and circumferential direction. The results are shown in
figures 5.9a -c.
It can be seen from the figures that the contact force distribution patterns are
similar in all 3 cases and the number o f nodes in contact does not change with the
abutment arrangement. There is however a slight difference o f the maximum nodal
reaction force. For comparison , the standard deviation o f the reaction force
distribution for each abutment arrangement is also shown in Table 5.1. This parameter
is sufficiently sensitive to detect any slight changes in the magnitude o f the nodal
reaction forces.
From Table 5.1 , the largest differences o f the maximum reaction force occur
between the leading and trailing edge abutment cases but the difference is only 3.4N
(3.1% ) whilst the respective standard deviations differ by only 1.307N (3.9%). From
these results , it can safely be concluded that the abutment arrangement does not
significantly alter the contact force distribution.
Table 5.1- Maximum reaction force and standard deviation for different abutment
a)Abutment type b)Maximum
reaction force (N)
c)Standard
deviation (N)
Trailing edge 112.7 34.646
Leading edge 109.3 33.339
Trailing & Leading 109.5 33.902

Chapter Five - Contact Pressure Analysis of The Brake Pad 126
Outerradius
Inner radius0 6
Leading edge
12 18 24 30 36 42 48 54 60
Reaction force [N ]
Node position (degrees)
(a) leading edge abutment
Trailingedge
Outerradius
er radius
■ 0A 6Leadingedge
12 18 24 30 36 42 48 54 60
i cdecNode position °
(b) trailing edge abutment
(c) combined leading and trailing edge abutments
Figure 5.9 - Nodal reaction force at the pad interface under piston applied pressure

Chapter Five - Contact Pressure Analysis of The Brake Pad 127
5.4.4 Effect of friction material modulus
The effect o f the Young's modulus o f the friction material on the contact
reaction force distribution was also studied. The baseline value for the study was taken
as 8000 M Pa representing a relatively 'hard' friction m ateria l, and alternative values o f
18.75 %, 50% and 125% o f this baseline material property were also studied. Only the
piston applied pressure case with combined trailing and leading abutments is shown
here as similar trends were found for the paw applied pressure case and other abutment
arrangements. The results for the different friction material modulus values are shown
in figures 5 .10(a) - (d).
The results shown that the general pattern o f contact force distribution does
not change with the friction material modulus. The number o f nodes in contact
however does change , with increasing number o f nodes in contact for lower modulus
values. For the softest material considered (E=1500 MPa), the number o f nodes in
contact is 43 whilst for the hardest material (E= 10000 MPa) the number o f nodes in
contact is 39.The standard deviation o f the contact force distribution is again used as a
measure o f how the distribution pattern varies , with a lower standard deviation
indicating a more uniform contact force distribution. The trend is shown in figure 5.11.
It can be seen that the standard deviation o f the nodal contact forces increases with
the friction material modulus although not in a linear manner. A softer friction material
allows more nodes to come into contact and simultaneously reduces the magnitude o f
the maximum reaction force. This also makes the contact force distribution more
uniform as shown by the reducing standard deviation.

Chapter Five - Contact Pressure Analysis of The Brake Pad
Reaction force |N
100
80
60
40
20
0
u f f ~ 2 '■EL Outer
radius
Inner radius0 6 12 18 24 30 36 42 48 54 60
Leading Trailingedge Node position (degrees) edge
Figure 5 .10a - Contact force distribution for friction material modulus o f 1500 MPa
Reaction force |N |
120
100
80
60
40
20
0
71
Outerradius
Inner radius0 6 12 18 24 30 36 42 48 54 60
Leading Trailingec*Se Node position (degrees)
Figure 5 .10b - Contact force distribution for friction material modulus o f 4000 MPa

Chapter Five - Contact Pressure Analysis o f The Brake Pad 129
Node location (degrees)
Figure 5 .10c - Contact force distribution for friction material modulus o f 8000 MPa
Reaction force | N
120
100
80
60
40
20
0
y/
!
■
p
71Outer
radius
.
Inner radius0 6 12 18 24 30 36 42 48 54 60
a in cLeadingedge
TrailingNode position (degrees) edge
Figure 5. lOd - Contact force distribution for friction material modulus o f 10 000 MPa

Chapter Five - Contact Pressure Analysis o f The Brake Pad 130
Standard deviation o f the reaction force [N]
Friction material modulus (GPa)
Figure 5.11 - Standard deviation o f the contact force distribution for different friction
material Y oung’s modulus values.
5.5 Discussion
The contact reaction force analysis described above was carried out with the
intention that the results could be used in the determination o f contact stiffness. Also
the extent to which each param eter varied affected the magnitude and distribution o f
the nodal reaction forces was determined
In the first study described in section 5.3 1 the effect o f both piston and paw
applied pressure load were investigated.Overall the results match well with the load
distribution for a different pad geometry as measured by Tumbrink [69] using the ball
pressure method Both sets o f results reported indicate that the nodal contact force
Chapter Five - Contact Pressure Analysis of The Brake Pad 131
distribution is not uniform and that not all the interface area is in contact. Therefore,
within the operating pressure range o f the brake this non-uniformity has to be taken
into account when determining the nodal contact stiffness at the interface. The effect o f
circumferential friction is to shift the reaction force distribution towards the leading
edge in both cases. The results o f section 5.3.1 also indicate that the nodal reaction
force distribution is strongly affected by the method o f the applying the force (i.e. the
piston or the paw) with the distrribution for the outboard pad (under the paw applied
force) more uniform and with more nodes in contact than that for the inboard pad.
Therefore , the strength o f the nodal coupling (which is assumed at this level to be
proportional to the reaction force ) for the inboard pad which is loaded by the piston
has a distribution different from that for the outboard pad which is loaded by the paw
and this effect should be included in the stability analysis to follow.
In section 5.3.2 , the effect o f the magnitude o f the pressure loading on the
nodal contact force distribution is studied.The results highlight the fact that the nodal
reaction forces vary linearly with the applied pressure and the number o f nodes in
contact is not affected by the pressure magnitude. This corresponds well with the
findings o f Harding [65] and Day [66], Previous work on the stability o f a disc brake
carried out by Liles [6] assuming that the distribution o f stiffness is uniform because o f
the low pressure cannot be justified according to these results.
In section 5.3.3 the effect o f the abutment arrangement on the reaction force
distribution was shown to be o f little significance with the difference between the
leading edge abutment and the trailing edge abutment cases both in terms o f maximum
reaction force and standard deviation o f the contact force distribution less than 4%.
The number o f nodes in contact and the distribution pattern remain the same for
different abutment arrangements. With this knowledge , the stability analysis for
different abutment arrangements could be carried out by limiting the parameter
changes to the abutment support position , and not changing the contact stiffness
distribution or magnitude.
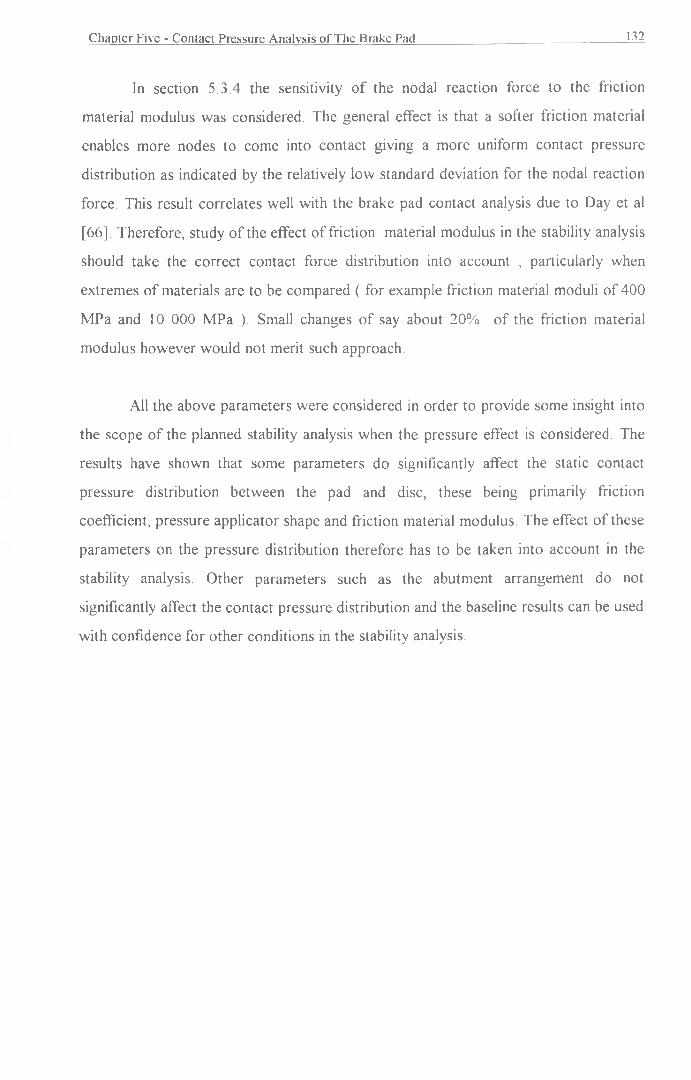
Chapter Five - Contact Pressure Analysis o f The Brake Pad 132
In section 5.3.4 the sensitivity o f the nodal reaction force to the friction
material modulus was considered. The general effect is that a softer friction material
enables more nodes to come into contact giving a more uniform contact pressure
distribution as indicated by the relatively low standard deviation for the nodal reaction
force. This result correlates well with the brake pad contact analysis due to Day et al
[66], Therefore, study o f the effect o f friction material modulus in the stability analysis
should take the correct contact force distribution into account , particularly when
extremes o f materials are to be compared ( for example friction material moduli o f 400
M Pa and 10 000 MPa ). Small changes o f say about 20% o f the friction material
modulus however would not merit such approach.
All the above parameters were considered in order to provide some insight into
the scope o f the planned stability analysis when the pressure effect is considered. The
results have shown that some param eters do significantly affect the static contact
pressure distribution between the pad and disc, these being primarily friction
coefficient, pressure applicator shape and friction material modulus. The effect o f these
parameters on the pressure distribution therefore has to be taken into account in the
stability analysis. Other param eters such as the abutment arrangement do not
significantly affect the contact pressure distribution and the baseline results can be used
with confidence for other conditions in the stability analysis.

Page 133
C H A P T E R SIX
CONTACT STIFFNESS DETERMINATION
6.1 Introduction
One o f the most important parameters in the proposed finite element modelling
o f disc brake squeal is the magnitude o f the stiffness coupling the components at the
sliding friction interface. As discussed in Chapter Two, the contact stiffness (also
termed the coupling stiffness in some literature) needs to be within a certain range for
instability to occur In the present chapter methods for the determination o f contact
stiffness are discussed and compared The most important criterion is the ability o f the
method to relate the contact stiffness to the magnitude o f the load applied to the pad
thus establishing a link between pressure and contact stiffness.

Chapter Six - Contact Stiffness Determination
6.2 Methods for interface contact stiffness determination
There are several methods to determine contact stiffness including :
a) stress-strain relationship method
b) experimental method
c) random process approach
M ethod (a) has been used by Nishiiwaki [50], Method (b) has been used by D'Souza
and Dweib [27] and Sherif et al [56], Method (c) has been used by Sherif [57], Each
method is discussed in turn below.
6.2.1 Stress-strain relationship method
In method (a) the stress-strain relationship for the pad friction material is used to
determine the contact stiffness. Assume the pad is pressed with force F against the disc
which is assumed to be a rigid surface as shown in figure 6. 1 .
F
\ \ \ \ \ \ \ \ \ \ \ x v
K c coupling stiffness to the aisc
\ V \- V '\ \ \ \ < \ \ —S—^
lumped parameter of the pad
Figure 6.1 - Deformation o f pad under normal load
The normal stress in the friction material is a with resulting strain 8 and the nominal
contact area is A. From the elatic stress-strain relationship, the contact stiffness is :
Kc = F / dL = ctA / eL = AE / L (6. 1 )
where dL is the change in L under load F.
In the above equation the contact stiffness is a function o f contact area A, thickness o f
pad friction material L and the friction material modulus E. Therefore, there is no

Chapter Six - Contact Stiffness Determination 135
effect o f pressure on the contact stiffness which is the major drawback o f this
approach. Furtherm ore the stiffness o f the friction material is already accounted for in
the finite element model o f the brake pad and therefore in the global stiffness matrix. It
is clear from the above that this approach is suitable only in lumped parameter models
in which the pad is assumed to be rigid.
6.2.2 Experimental method
In various experiments on friction-excited vibration using a pin-on-disc
apparatus [27], the contact stiffness was derived from the equations o f motion o f the
system for which the mass, acceleration,velocity, displacement and force were
measured. The basis for this method is that the contact generates stiffness and damping
which add to the existing structural and damping forces in the system An algorithm
based on an experimental method to determine contact stiffness is an extension to the
one used by Raguskis and Yurkauskas [76] in the determination o f the stiffness o f a
radial thrust bearing assembly. The approach will be discussed here in some detail
using a model o f a beam mounted on ball bearings at each end which are idealised as
springs o f unknown stiffness.
Li i l > ____ *\
m . 3
x-L]9X+L20
/ / / /
Figure 6.2 - Schematic diagram for computing unknown support stiffness [76]
The equations o f motion o f the system are :
mx + (k , + k , ) x - ( x ,L , - k ,L , ) 0 = 0 (6.2a)

Chapter Six - Contact Stiffness Determination 136
- ( k j L j - k 2L 2 )x + J0 + ( k , L 12 + k 2L 22 )0 = O (6.2b)
Equations (6.2 ) are linear differential equations with constant coefficients. Therefore
the solution can be written in the form o f :
x= A, sin (cot+f)
0 =A sin (cot+f)
(6.3a)
(6.3b)
Substitute equations (6.3) into (6.2 ) and after algebraic transformation a quadratic
equation in terms o f co2 will be formed By solving the quadratic equation, the first and
second natural frequencies can be found in terms o f the system parameters. At
resonance the modes o f vibration would be analogous to the principal modes acting at
the natural frequencies o f the system. Therefore a search can be made for the values o f
k, and k , to give the correct predicted natural frequencies co;. Assuming that each
stiffness is bounded between two values, k-high and k-low, a closeness function C,
could be used for assessment o f the search accuracy :
C = X (w , - a , ') 2 (6 4 )i=l
where co,' is the experimental value obtained from modal analysis. For this example
(n=2 ), the closeness function would be :
C= (co| — to |' ) “ + (co2 — co2 ' )~ (6.5)
The stiffness coefficients k, and k, are selected to minimise the closeness function.

Chapter Six - Contact Stiffness Determination 137
F sin(wt) 1
/PISTON
PAD
1RIGID SURFACE
Figure 6.3 - Simplified model illustrating the experimental approach
In the present finite element model o f the pad-disc system , contact is idealised
as equivalent springs distributed throughout the interface connecting the surface nodes
on the disc with the adjacent nodes on the pad as discussed in Chapter Three. The
above method could be used to determine the effective overall stiffness o f the pad
(including the stiffness o f the piston-backplate contact) idealised as shown in figure
6.3. The response o f the clamped pad could be determined by forced vibration
experiments for varying piston loads and, as in equation (6.3), the closeness function
could be made to approach zero from which the effective overall stiffness Kc could be
determined relatively easily as a function o f load. However a major shortcoming o f this
approach is the need to establish a relationship between the support stiffness at the
piston-backplate interface (Ks) and the desired contact stiffness (Kc). This requires
predetermined values o f the support stiffness (Ks).
6.2.3 Random process approach
The determination o f contact stiffness by the random process approach is based
on the culmination o f several studies by Greenwood and Williamson [77], Greenwood
and Tripp [78], Nayak [79] and Thomas and Sayles [80], This approach was used by
Sherif [57] in his analysis o f the longitudinal vibration o f a brake pad. The method
emanated from the need to determine the joint stiffness o f machine tools, for example
between the saddle and the bed o f a lathe. It is based on the definition o f a band o f
wavelengths relevant to the surface interactions (plane-plane) and using them to obtain

Chapter Six - Contact Stiffness Determination 138
working expressions for stiffness in terms o f measured surface parameters. As the
approach is very relevant to the problem o f flat surface interactions such as between
the disc and the pad, it is discussed below in some detail.
6.2.3.1 Theory of random process approach
Greenwood and Williamson [77] used the random process approach to explain
the behaviour o f two surfaces in contact, one o f which is rough and the other perfectly
smooth as shown in figure 6.4. The rough surface is assumed to be covered with a
large number o f asperities o f random height which at least near their summits are all
spherical with the same radius P as shown in figure 6.5. The probability o f a particular
asperity having a height between z and z + dz above some reference plane will be
<\>(z)dz where ()) is the probability density function.
smooth surface plane
Figure 6.4 - Contact between a smooth surface and a rough surface
z
Figure 6.5 - Idealised rough surface with each peak having a spherical top with radius
(3, differing only in height.

Chapter Six - Contact Stiffness Determination 139
The standard Hertzian contact equations can be used to determine the individual
asperity behaviour. The contact radius a,, contact area A, and load P, for each
asperity in contact can be expressed in terms o f the normal compression or compliance
and E ,, E, are the Y oung’s moduli o f surfaces 1 and 2 respectively, v ,,v 2 the
corresponding Poisson's ratios and p the asperity radius. In the case o f very different
material moduli such as those o f the friction material o f the brake pad and the cast iron
rotor, E' is simply the plane stress modulus o f the softer material.
If the two surfaces come together so that their reference planes are separated
by a distance d , then there will be contact at any asperity whose height was originally
greater than d. Therefore the probability o f contact at any given asperity o f height z is
given by
w defining the amount by which the points outside the deforming zone move together
during the deformation, thus :
(6 .6)
A] = 7lPw (6.7)
Pj = ( 4 / 3 ) E ' P ,/2w V2 (6 .8)
wherei i 2 , 2 1 1 - v j 1 - V2
(6.9)++E' E, E 2
(6.10)d
For N number o f asperities, the expected number o f contacts n will be
00
n = N J<j)(z)dzd
( 6 . 11 )

Chapter Six - Contact Stiffness Determination 140
Also, since for any asperity in contact w = (z - d) (see figure 6.5) and therefore
A, - 7iP w (z - d) from equation 6.7, then the mean asperity contact area is given by
A] = d)<j>(z)dz (6 .12)d
and the expected total area in contact is
A = A i n - 7tnpJ(z-d)( |)(z)dz (6 .13)d
Equally from equation (6.8) the expected total load is
P = P| n = — E 'p 1/2n J ( z - d ) 3 /2(t>(z)dz ( 6 . 14)3 d
where P, is the mean asperity load.
Thus, from the probability o f asperities being in contact, Greenwood and Williamson
[77] managed to establish a relationship between the total load P and the separation o f
the mean (or reference) planes d as shown in equation 6.14. For convenience, they
used standardized variables and described the asperity heights in terms o f the standard
deviation a o f the height distribution and the surface density o f the asperities r]
defined by N =r|A 0 where A, is the nominal contact area. This gives :

Chapter Six - Contact Stiffness Determination 141
where the standardized separation is given by h= —
and the function (6.18)h
where (() (s)ds is the probability o f finding an asperity tip at a dimensionless height s
z(i.e. s = — ) above the mean plane o f the rough surface,
a
Greenwood and Williamson [77] argued that most engineering surfaces have
height distributions which can be approximated by a Gaussian distribution. Therefore
the height distribution is given by
The above function was tabulated for different values o f n by Greenwood and
Tripp[78], Equation (6.17) was simplified by Greenwood and Williamson [77] to the
form below
2s
from whichh
(6 .20)
P = c F3/2(h) (6 .21)
(6.22)
The variation o f the ratio (P/c) with h based on equation 6.21 is shown in figure 6.6.
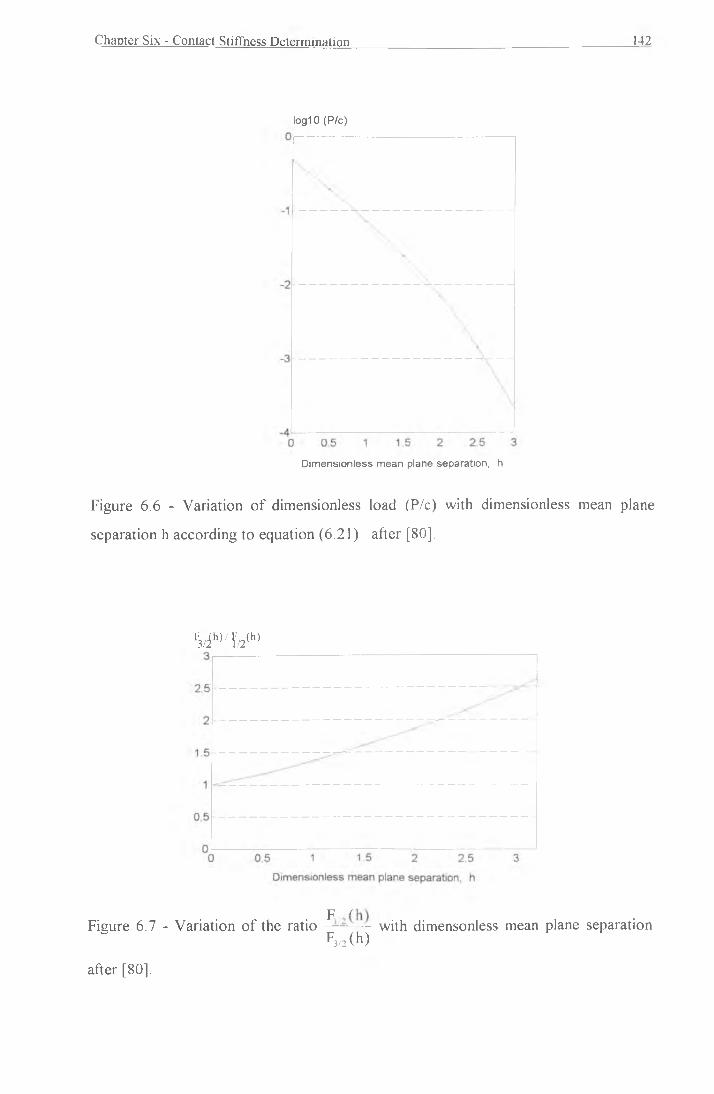
Chapter Six - Contact Stiffness Determination 142
log 10 (P/c)
Dimensionless mean plane separation, h
Figure 6.6 - Variation o f dimensionless load (P/c) with dimensionless mean plane
separation h according to equation (6.2 1 ) after [80],
h3 / ih ) / f /2 (h)
F /Figure 6.7 - Variation o f the ratio ----- with dimensonless mean plane separation
F3/2 (h )
after [80],

Chapter Six - Contact Stiffness Determination 14.1
The stiffness resulting from the interaction o f the two planes is defined as the load P
necessary to produce unit displacement o f the mean plane separation and for the
purpose o f the present study can be taken as the contact stiffness value , Kc :
dP dP dhK c = — = — .— (6.23)
dd dh dd
dh 1N ow — = — and by differentiating equation (6.2 1 ) with respect to h and
dd a
rearranging to include the load P rather than the constant c :
3 H 2( h ) »/
K c = (6.24)
Equation (6.24) provides an expression whereby the contact stiffness o f the surfaces
can be related to the applied load by the standard deviation o f the height distribution a
F ( h)and the ratio 1/2 . This ratio has been determined by Greenwood and Tripp [78]
F3/2 ( h )
and plotted by Thomas and Sayles [80] against h as shown in figure 6.7.
Upto this point it is still not possible to apply equation (6.24) as some o f the
terms needed to calculate F3/2(h) from equations (6.21) and (6.22) such as the asperity
radius |3 and the surface density o f asperities r\ cannot be measured directly. Nayak
[79] promoted a way o f statistically relating the asperity radius and surface density
using a random process model whereby the rough isotropic surface is characterised by
its autocorrelation R and power spectral density (PSD). He was thus able to derive
several important characteristics o f a surface using the random process such as the
surface asperity density:
n = — -7 = 1 — 1 (6 -2 5 )6 tw 3 [m 2 J
where m ,= 2nd moment o f the PSD
m4=4th moment o f the PSD.

Chapter Six - Contact Stiffness Determination 144
Nayak [79] also proved from his analysis that the surface gradient could be expressed
as follows :
e2=( ~ r (6.26)
and that the mean asperity radius (3 can be approximated by the following equation.
P -y /m ^ 3 yfn1.50 (6.27)
Thomas and Sayles [80] proposed that the surface gradient could be related to the
mean absolute profile slope, tan 9 by the following expression :
- ^ 1 ,ta n 0 )> 3 (6.28)
where H is the hardness o f the material and E is the Y oung’s modulus. By assuming in
general that the hardness is three times the yield strength Y, we obtain
tan 9 <Y (6.29)
For most materials the ratio is very small. Thus to a good approximation
Equation (6.28) can be related to equation (6.26), thus
m, -71
r y
E(6.30)
which enables m2 to be calculated from the assumed material properties o f the surfaces.

Chapter Six - Contact Stiffness Determination 145
Thomas and Sayles [80] proposed further that the first three even moments o f the
PSD curve are given as follows :
m 0 = 4 a 2 tan 1 (6. 31)
m, = 4 a 2c r ( Q - t a n 1 Q) (6.32)
m 4 = 4 a 4a 2(-------Q + t a n ' Q ) (6.33)
where a is the auto-correlation decay function o f the height distribution , D = —-a
and co: is the cut-off wavelength for the high pass filter (i.e. an upper frequency limit
for the analysis).
Therefore, knowing m2 from equation (6.30), equation (6.32) can be solved for O in
terms o f material properties and measured surface profiles which enables mo and m4
to be calculated. Knowing the first three even moments o f the PSD and surface
roughness properties a and a , all other properties such as the mean asperity radius P
and the mean asperity density r) (from equations (6.27) and (6.25) respectively) can
then be calculated. Thus, in order to use the random process approach, the main
parameters required from the measurement o f the surface profiles are the rms value o f
the roughness a and the auto-correlation decay function o f the height distribution a.
The main assumptions o f this method can be listed as below :
a) the distribution o f surface heights is Gaussian
b) the upper frequency limit is set by the onset o f plasticity, the condition for
which can be expressed in terms o f the mean absolute profile slope related to
the ratio o f hardness to the Y oung’s modulus
c) the surfaces are considered to have exponentially decaying autocorrelation
functions
d) hardness is assumed to be three times the yield strength.
Chapter Six - Contact Stiffness Determination 146
The random process asperity approach applied to the modelling o f surface
roughness has one major limitation [78], When the load applied is sufficiently large, the
mean planes will tend to overlap and the mean plane separation d becomes negative.
This may suggest that the real area o f contact becomes larger than the apparent area
which cannot be true. Thus a limit o f positive d must be imposed.
The implementation o f the random process approach in the present work is
discussed in in more detail in section 6.4.
6.3 Comparison of the three methods
In order to determine the most suitable method for the present purposes
comparison has to be made between the three methods discussed above which all take
into account the material properties and the contact area.
In the first method, the contact stiffness derived is not related to the applied
load. The only way for the contact stiffness o f a constant modulus material to change is
by reducing the thickness and even then only one value o f stiffness is obtained for any
load magnitude. In a lumped parameter model the contact stiffness (or coupling
stiffness) derived using this method is valid as the material stiffness is not represented
directly in the model. However in the finite element method the stiffness matrix has
already taken into account the elastic properties o f the friction material. Therefore this
method is not suitable for the present analysis o f the effect o f pressure on disc brake
squeal.
In the second method, the contact stiffness calculated does change with the
applied applied as shown by Bracken and Sakioka [51 ] with a higher load causing the
natural frequency o f the system to increase. This method however includes the
cumulative effect o f the surface roughness and the pressure at all joints. It is difficult
therefore to establish a relationship between the support stiffness at the piston-pad
backplate interface and the pad-disc contact stiffness as only the cumulative effect o f

Chapter Six - Contact Stiffness Determination 147
theoretical calculation o f its stiffness). To allow for a non-uniform stiffness
distribution, the distribution would have to be pre-determined and the closeness
function calculated to allow for this. Further difficulties lie in introducing friction at the
interface (in order to represent the sliding condition) as the analysis presented in
Chapter Five shows that friction causes the contact force distribution (and hence the
stiffness) to be biased tow ards the leading edge which may change the dynamic
response o f the system.
In the random process approach , the contact stiffness is a function o f the
applied load. The relationship also includes the surface properties o f the interface
(experimental work by Sherif et. al. [56] showed that a glazed disc surface is a
necessary condition for squeal to occur). With this approach the effect o f pressure can
be isolated from the surface properties and analysed independently. As the contact
stiffness is related to the applied load, the contact stiffness for each node pair at the
disc-pad interface can be directly related to the nodal contact reaction force. Thus high
reaction force will give high contact stiffness and the distribution o f contact stiffness
will follow exactly that o f contact reaction force. This is very much in accordance with
the requirements o f the present analysis as discussed in Chapter Three.
It should be noted however that all the approaches described above can only
approximate the actual contact stiffness as other operating factors unaccounted for
such as disc run-out , thermal distortion o f the pad and uneven wear o f the mating
surfaces can all affect the force distribution and the stiffness resulting from the contact.
From the above discussion, the random process approach has distinct
advantages over the two other methods, namely the ability to relate contact stiffness
to the load and the consideration o f surface roughness in the calculation.Therefore the
random process approach is used to determine the contact stiffness in the present study
as described in the following section

Chapter Six - Contact Stiffness Determination 148
6.4 Contact Stiffness Determination by The Random Process Approach
The steps for implementing the random process approach for contact stiffness
determination in the present work can be summarised as below :
a) Measurement o f the surface roughness o f both the pad and the disc surface using a
Talysurf 5 surface profile measuring machine. As the machine does not calculate the
autocorrelation function, the roughness heights were digitised from the printout o f the
surface profiles for use in further computations.
b) Calculation o f the autocorrelation function (section 6.4.2) for each surface. The
delay length was limited to 10% o f the record length to reduce error.
c) Calculation o f the relevant parameters o f the surfaces as discussed in section 6.3. A
programme was written in C (see Appendix I for the programme listing)to calculate
the stiffness for each load condition ( 0 . 1 - 1 MPa line pressure in steps o f 0.1 MPa),
the results from which were used to produce the contact stiffness versus load curves.
d) Calculation o f the contact stiffness for different surface and material properties to
determine the sensitivity o f contact stiffness to various parameters.
6.4.1 Measurement of surface roughness of the disc and the pad
M easurement o f the surface roughness o f an unworn disc and a new pad was
carried out using a Talysurf 5 profile meter . The longest measured length from this
profile meter is 100 mm. The measurement was carried out in a tangential straight line
across the face o f the disc and the pad through the pad centroid (it was not feasible
with the available equipment to measure along a circumferential arc to more closely
follow the circular interaction between the disc and the pad). The printed surface
profiles were then digitised and the data used for the calculation o f the variance and
root mean square value o f the roughness and the decay constant o f the autocorrelation
function. These parameters are the necessary input for the contact stiffness
determination.

Chapter Six - Contact Stiffness Determination 149
6.4.2 Calculation of the autocorrelation function
One o f the requirements in the implementation o f the random process approach
in determining contact stiffness is the calculation o f the autocorrelation function o f the
surfaces. In this section the definition o f the autocorrelation function and its
importance is discussed based on the work o f Hailing [81], The autocorrelation
function for a single profile is obtained by delaying the profile relative to itself by some
fixed interval, then multiplying the original profile by the delayed one and averaging the
product values over a representative length o f the profile. Thus
R(/) = E [ z(x) z(x +/)] (6 46)
where E expected (average) value
z(x) height o f the profile at a given coordinate x along the mean line
z(x)=0
z(x + /) height at an adjacent coordinate (x + I) taken at an interval /
from the previous one
If the values o f the ordinates at discrete intervals / are known this may be interpreted
as
I N-/R(/) = ^ —7 X z (x )z (x + /) (6.47)
where N is the total number o f ordinates in a sample length L It can be clearly seen
that when the interval length /=0, R(/) reduces to the variance a 2 or the root mean
square value a o f the profile. The autocorrelation function is therefore usually plotted
in standardised form r(/) where
( 6 4 8 )R(0) CT2
The general decay o f the function indicates a decrease o f correlation as / increases and
is an indication o f the random component o f the surface profile while the oscillatory

Chapter Six - Contact Stiffness Determination 150
component o f the function indicates any inherent periodicity o f the profile. Detail
discussion and examples o f various engineering surfaces and their autocorrelation
functions can be found in [81],
6.4.3 Results from the autocorrelation function of the disc and pad surfaces
Figures 6.9 and 6.11 show the calculated autocorrelation functions o f the disc
and pad surface profiles for different delay lengths upto 11 mm and 10 mm
respectively. These functions can be approximated by an exponential function as
shown in the logcR(/)/R(0) versus / plots o f figures 6.10 and 6.12 which indicates that
the height distribution are Gaussian. The best fit straight lines drawn through the
a /experimental points on these plots give the decay constant in the equation R(/) = Ae’ .
An non-Gaussian surface (such as a perfectly sinusoidal topography) would have a
non-exponential decay function for its autocorrelation function There are indeed small
oscillations about the best fit straight line as shown in figures 6.10 and 6.12 indicating
some small inherent periodicity in the surfaces. For Flertzian dry contact applications
(for which the random process approach is derived), the periodic component o f the
profile can be negelected as it is the random component (i.e the exponential decay
term ) which is o f primary importance. Therefore the small periodicity is ignored in the
following calculations. The present results also fulfill two o f the criteria (section
6 .2 .3 . 1 ) for the implementation o f the random process approach namely that the
surface is Gaussian and its autocorrelation function decays exponentially. The
statistical parameters o f both surfaces are shown in table 6.1
From table 6.1, the root mean square roughness from the measurement o f the
disc surface is 11.38 pm which is five times smaller than the value for the pad which is
51.78 pm. This is due to the better surface finish o f the disc which is machined
compared to the relatively rough surface o f the pad which consists o f embedded
particles in a polymer matrix. Consequently the autocorrelation function decay
constant reflects the fact that the variation o f the height distribution on the disc surface
is less than that on the pad surface (a perfectly constant amplitude sinusoidal surface
has a zero decay constant)

Chapter Six - Contact Stiffness Determination
Autocorrelation (mm2)
delay length. 1 (mm)
Figure 6 .8 - Autocorrelation function o f the disc surface roughness profile
Log ( R (l)/R (lo))
Figure 6.9 - Decay constant o f specific autocorrelation function o f the disc

Chapter Six - Contact Stiffness Determination 152
Autocorrelation (m m 2)
delay len g th ,1 (m m )
Figure 6. 1 0 - Autocorrelation function o f the pad surface.
log I R (l)/R (lo ) ]
de lay length ,1 (m m )
Figure 6.11 - Decay constant o f specific auto correlation function o f the pad surface.

Chapter Six - Contact Stiffness Determination 153
Table 6.1 - Results from the roughness measurement o f the disc and pad
Component Root mean square
roughness, a (pm)
Auto correlation function
decay constant,a (mm ')
Disc 11.38 0.057
Pad 51.78 0.081
6.4.4 Results of the contact stiffness calculation
Using the available material data and the surface roughness properties
measured for both the disc and the pad, the contact stiffness for the initial baseline
system was calculated for each load condition. The data and results from the
calculations are listed in table 6.2. The calculation o f the effective modulus according
to equation 6.2 gives a value which at 8.000 GPa is identical to that o f the pad friction
material (since this has a very much lower Y oung’s modulus than that o f the disc). In
other words, in terms o f this calculation the disc can be regarded as effectively rigid.
Table 6.2 - Material data and results from calculation
Disc Pad
Y oung’s modulus E (GPa) 120 8
Poisson ratio, v 0.25 0.25
Asperity radius (3 (mm) 0.4348 14.35
Asperity density (mm 2) 39.34 0.0415
The results shown in table 6.2 indicate that the asperity radius o f the pad is
comparatively very large and the asperity density very low. This is because equation
6.32 used in the calculation o f the even moments produces a very small value o f Q
=24.148 for the pad since both the surface roughness rms ct and the decay constant a
are large. In comparison the low rms value and the low decay constant o f the disc
surface roughness produce a relatively large value o f f i = 1088.3 which results in a

Chapter Six - Contact Stiffness Determination 154
small predicted asperity radius and relatively high asperity density. Physically this result
is believable as a relatively smooth surface with small asperity radii such as that o f the
disc is expected to have higher asperity density than a relatively rough surface with
large asperity radii such as the pad.
In the random process approach, the ratio o f the load P to the constant c is
required to be less than 0.4 in order to obtain a dimensionless mean plane separation
greater than zero. For the pad friction material surface measured in the present case the
ratio P/c for a load o f 173N (equivalent to 1 bar line pressure) is 1 59 x 10"2. In
contrast for the disc surface at the same load level, the ratio P/c = 2 x 10'4 which is
tw o orders o f magnitude smaller. Selection o f the ratio P/c (as per equation 6.21) is
based on the fact that the results show that the pad asperity radius is thirty-three times
larger than the disc asperity radius, indicating that it is a 'rough' disc acting on the 'flat
and smooth' pad (in the sense that the smaller asperities on the disc are acting against
the relatively flat and large asperities on the pad). A further consideration is that the
approach is based on the Hertzian equations for asperity contact and it is therefore the
smaller asperity radius which strongly influences the effective radius o f the contact.
Therefore a surface profile with a much smaller rms and a value will much more greatly
influence the final outcome than the surface profile with the larger rms and a value
(i.e. the rougher surface). These factors indicate that it is ratio P/c for the disc only
which needs to be used in the determination o f contact stiffness and reduce the
problem to that o f essentially normally distributed spherical asperities on a rigid disc
acting against a flat elastic pad. Therefore for all further calculations the disc surface
rms value alone is used in equation (6.24) even though the effective or composite
radius is still used in equation (6.22 ).
For the measured value o f the disc roughness and the material properties listed
above, the contact stiffness is calculated for load steps o f 0.1 MPa (1 bar) upto 11
MPa (11 bar) line pressure.

Chapter Six - Contact Stiffness Determination 155
Contact stiffness (MN/m)
Line pressure (bar)
Figure 6. 12- Calculated contact stiffness for the pad-disc interface
The results shown in figure 6.12 indicate that the contact stiffness, K (. (N/m) for the
condition described can be approximated as a linear function o f the line pressure P (in
bar) as follows :
Kc = 4722 IP (6.49).
For comparison Sherif [57] predicted a similar linear curve from his data which for a
load o f 1 kN gave a contact stiffness o f 38 MN/m. This is one order o f magnitude less
than the stiffness under a similar load ( 279.90 MN/m at 5.7 bar) in figure 6.16. The
difference can however be attributed to the softer pad used by Sherif (E pad = 1 GPa)
and the fact that his measurements were restricted to the pad surface only whereas in
the present work the disc surface roughness is dominant as discussed above.

Chapter Six - Contact Stiffness Determination 156
6.4.^. 1 Effect of friction material properties on contact stiffness
The effect o f friction material property on the contact stiffness was studied by
varying the Young's modulus and the yield strength o f the friction material
Esimultaneously to give a constant ratio o f — = 40 (recall that a yield strength o f 20
Gv
M Pa was taken as the baseline value corresponding to the 8 000 MPa modulus ).
Contact stiffness (MN/m)
— E10000/Y25
+ E8000/Y20
E4000/Y10
E2000/Y5
- E1000/Y2.5
Line pressure (bar)
Figure 6 . 13- Effect o f friction material modulus on the contact stiffness
The results shown in figure 6.13 indicate that the contact stiffness does not vary
greatly with changes in the friction material properties. This is due to the fact that the
surface interactions are still between the relatively flat asperities o f the pad and the
small radius o f the disc asperities. For a modulus o f 10 000 MPa, the calculated pad
asperity radius is 14.33 mm whilst for a modulus o f 2000 MPa it is still 14.33 due to
Ethe constant ratio — used in the calculation. The differences in the calculated values

Chapter Six - Contact Stiffness Determination 157
o f contact stiffness arise simply from the effect o f different E values on the effective
modulus. The general trend as expected is that a friction material with low modulus
results in a lower contact stiffness value than for a higher modulus pad material. For a
tenfold reduction o f the friction material modulus from 10 000 MPa to 1 000 MPa, the
corresponding contact stiffnesses at 10 bar line pressure differ only by 104 MN/m, a
change o f about 20%.
6.4.4.2 Effect of disc material on contact stiffness
To study the effect o f disc material on the contact stiffness, different disc materials are
modelled including aluminum alloy, aluminum metal matrix composite, mild steel,
magnesium metal matrix composite in addition to the baseline material o f grey cast
iron. The properties o f the materials selected are shown in table 6.3. The surface
topography was assumed to be as measured for the cast iron disc.
Table 6.3 - Material properties for the disc
Material Modulus, E (GPa) Yield strength,
c v(MPa)
E
a y
Cast iron 120 345 348
Aluminum alloy 76 505 150
Aluminum MMC 100 215 465
Mild steel 205 304 674
Magnesium MMC 63 220 286
The results shown in figure 6.14 indicate that the contact stiffness for the different disc
Ematerials does not differ very much. In each case, material with a lower ratio o f -
CTv
gives higher contact stiffness as expected since a yis a hardness indicator (based on the
assumption that the hardness o f the material is three times the yield strength). A high
disc modulus does not significantly affect the contact stiffness calculation as it is the

Chapter Six - Contact Stiffness Determination 15X
friction material modulus (which is two orders o f magnitude smaller) which dominates
the effective modulus in the calculation.
Contact stiffness (MN/m)600
500
400
300
200
100
O'0 1 2 3 4 5 6 7 8 9 10 11
Line pressure (bar)
Figure 6.14 - Effect o f disc modulus on contact stiffness
6.4.4.3 Effect of disc rms roughness on contact stiffness
To study this effect three alternative roughness rms values for the disc surface o f
15pxn, lO^m and 7.5pm are considered in addition to the baseline value (1 1.38 pm).
The results shown in figure 6.15 indicate that contact stiffness increases significantly
with decrease in the rms surface roughness o f the disc. This is as expected since
contact stiffness is inversely proportional to the disc rms surface roughness as shown
by equation (6.24). Furthermore the calculated asperity radius increases with the rms
surface roughness o f the disc (which leads to a reduction in the asperity density). The
cumulative effect is to increase the contact stiffness as rms surface roughness
decreases.
Cast iron
Al-Alloy
AI-MMC
Mg-MMC
Mild steel

Chapter Six - Contact Stiffness Determination 159
Contact stiffness (MN/m)
— 1 1 .38yim
-4 - 15.0(Vn
10.0(im
-Q- 7.5
Line pressure (bar)
Figure 6 .1 5 - Effect o f disc surface rms surface roughness on contact stiffness
6.4.4.4 Effect of brake pad surface roughness on contact stiffness
In the calculation o f the effect o f the brake pad surface, two different cases are
considered in addition to the baseline measured values. Firstly the rms roughness o f the
pad is reduced to 25|.im (which is about half o f the measured rms) with the decay
constant unchanged at a = 0.081 mm '. The second case is where the rms roughness
o f the pad is unchanged at 51.74(.tm but the decay constant is reduced to 0.0415 mm '.
The results are shown in Table 6.4. It is clear that as the rms roughness o f the pad is
decreased the pad asperity radius P also decreases whilst the asperity density r)
increases. This in turn reduces the effective radius o f the asperity at the pad-disc
interface. However, as the constant c and the area density r] used in the calculation
(as per equation 6.22) are effectively those o f the disc, the effect on contact stiffness is
minimal.

Chapter Six - Contact Stiffness Determination 160
Table 6.4 - Calculated parameters for different pad surfaces rms value
Parameters rms=25 pm
a=0.081 m m '1
52 pm (measured)
a=0.081 mm’1
rms=52 pm
a=0.0415 m m '1
(3 pad (mm) 3.59 14.35 7.68
(3 disc (mm) 0.4348 0.4348 0.4348
(3 effective (mm) 0.3878 0.4220 0.4115
r| pad (m m '2) 0.6614 0.415 0.1446
r| disc (mrrT2) 39.34 39.34 39.34
c pad (eqn. 6.22) 55786 10883 37423
c disc (eqn. 6.22) 1019727 1063627 1050325
Contact stiffness at
line pressure o f 10
bar (MN/m)
479.7 481.4 480.9
H owever as the pad becomes smoother the decay constant a cannot be expected to
remain unchanged and as shown in the final column o f table 6.3 the effective radius is
also reduced for smaller a. Nevertheless the pad surface needs to have even smaller
rms and a values than those shown in table 6.4 in order to significantly reduce the
contact stiffness. The last row o f table 6.3 shows that there is only a very small
difference in contact stiffness for the different pad surface roughness parameters
considered.
6.4.5 Example of nodal contact stiffness calculation.
The objective o f estimating the total interface contact stiffness is to determine a
suitable value for the nodal contact stiffness value for use in the friction matrix in the
stability analysis. An example is now given o f how the nodal contact stiffness is
calculated for the pad-disc interface, assuming a friction material modulus o f 8000
MPa, the measured roughness properties o f the pad, equal trailing and leading edge

Chapter Six - Contact Stiffness Determination
abutments, friction coefficient o f 0.4 and line pressure o f 10 bar.The node chosen is the
one for which the maximum reaction force is predicted (109.5 N) which has
coordinates o f ( R = 1 10mm, 9 = 30 degrees) on the pad model definition (see figures
5.4 and 5.5a).
Piston diameter = 46.84 mm
The total force applied to the pad = Pressure at 10 bar X piston area
= (0.1 N)x(—\46.842 ) = 1735N 4
Total contact stiffness (from figure 6.12) = 496 MN/m
Nodal reaction force (from figure 5 .6c) = 109.5 N
Nodal contact stiffness = (Nodal reaction force /Total force)*(Total stiffness)
= 31.3 MN/m
The calculation is repeated for all other node pairs on the pad-disc interface to
determine the individual node contact stiffness for use in the friction matrix in the
stability analysis.
6.5 Discussion
The random process approach to contact stiffness calculation takes account o f
both the material and surface properties at the interface. For the baseline parameters
studied, the calculated contact stiffness varies in direct proportion to the applied
pressure. In section 6 4.4.1, the effect o f friction material properties on contact
stiffness was studied. From the results, a stilfer friction material gives a higher contact
stiffness for the same applied pressure as expected but the proportional change o f
contact stiffness is much less than that o f the friction material modulus.
The effect o f the disc material studied in section 6.4.4.2 showed that for the
five different materials considered the contact stiffness does not vary very much.

Chapter Six - Contact Stiffness Determination 162
Generally harder materials as indicated by the ratio — give higher contact stiffness as
expected.
In section 6.4.4.3 the effect o f the disc surface rms roughness on the contact
stiffness was investigated. The results indicate that contact stiffness is sensitive to the
disc surface roughness and in particular that a reduction in surface roughness increases
the contact stiffness. Therefore the effect o f wear on brake squeal could be analysed
indirectly by considering the effect o f rms roughness on the contact stiffness. The
curves presented in figure 6.15 could be used to determine the operating roughness
domain over which the contact stiffness may vary throughout the life o f the disc, for
example by taking the measured rms value o f 11.38 f.tm as being for a new and unworn
disc. Then, by assuming that the surface roughness is decreased by wear, the contact
stiffness would progressively increase even though the line pressure remains the same.
The effect o f disc surface roughness has been demonstrated in the experimental work
o f Sherif et al [57] in which the disc surface had to be glazed (i.e smooth) for squeal to
occur - a neccessary but not sufficient condition. The results shown in section 6.4.3.3
together with those from the stability analysis reported in Chapter Seven below may
help explain these effects.
Section 6.4.4.4 shows that pad surface roughness has little effect on the contact
stiffness. This is due to fact that the pad asperity is large and therefore has little
influence on the effective radius compared to the effect o f the much smaller disc
asperity. However if the pad surface was sufficiently reduced in its rms roughness and
decay constant, the effect would then be significant.
The sample calculation given in section 6.4.5 demonstrates how the nodal
contact stiffness is derived. It gives a distribution pattern identical to that o f the nodal
reaction force as the predetermined total force and total stiffness do not vary for a
given pressure. Using this method force equilibrium is maintained and the sum o f the
distributed nodal stiffness equates to the current total stiffness at the interface.

Chapter Six - Contact Stiffness Determination 163
In all, the approach used to calculate the nodal contact stiffness in this thesis
has taken into account both the partial contact state at the pad-disc interface and the
material and surface properties o f the interface thereby providing the necessary link
between applied pressure and contact stiffness.

C H A P T E R SEVEN
STABILITY ANALYSIS OF THE COUPLED PAD-DISC SYSTEM
Page 164
7.1 Introduction
The individual finite element models o f the pad and the disc (free-free modal
analysis o f which has been compared with experimental results in Chapter Four) can be
coupled for stability analysis in order to predict squeal taking into account the contact
pressure distribution at the interface as discussed in Chapter Five. By using an
unsymmetric eigenvalue solver, the resulting eigenvalues are complex numbers in
which the sign and the magnitude o f the real part indicates the relative stability and the
imaginary part estimates the frequency o f the resulting modes.
In the present chapter , the stability o f the coupled pad-disc system is
discussed in terms o f the unstable modes o f interest and their evolution with
param eters such as contact stiffness. The complex eigenvectors which describe the
asynchronous motion o f the modes are studied and these modes are compared with
experimental squeal mode shapes [10] for validation o f the approach. Additional

Chapter Seven -Stability Analysis o f the Coupled Pad-Disc System 165
sensitivity studies are also carried out in order to investigate the effect o f certain
parameters on the stability o f the coupled pad-disc system
7.2 Methodology
The individual finite element models o f the disc and the pad are validated for
dynamic analysis in Chapter Four. The reduced (substructured) models o f the pads
and the disc are now to be coupled using the interface matrix derived in Chapter Three.
External connections to the pads where the inboard pad makes contact with the piston
and the outboard pad with the paw are modelled using stiff springs connected to rigid
points as schematically shown in figure 7.1. The finite element model o f the coupled
pad-disc system is shown in figure 7.2. The baseline condition is taken as a combined
trailing and leading edge abutment with the friction coefficient set at p= 0.4 and a
support stiffness o f 24 MN/m for both the pad backplate -piston and also the
backplate-paw external connections.
The distribution o f the contact stiffness at the nodes on the pad-disc interface is
determined by the magnitude o f the nodal reaction force predicted by a non-linear
finite element contact analysis , the results o f which are presented in Chapter Five
Complex eigenvalue analysis is carried out for different values o f contact
stiffness in order to observe the system behaviour throughout for the range o f typical
line pressures. The analysis is carried out in steps o f 50 MN/m upto 600 MN/m starting
from a contact stiffness o f 50 MN/m, representing line pressure in the range 0.1 - 1.2
MPa (1-12 bar).
In order to determine the effect o f operating pressure two parameters in
particular are considered:
i) interface contact stiffness , K c
ii) external support stiffness , K s

Chapter Seven -Stability Analysis o f the Coupled Pad-Disc System 166
IPAD
Fy2Fy l , ___
direction ol ^ rotation
yi* ~ T F zi'
PAD—7*N—
Z
->y
Figure 7.1 - Active forces acting at the sliding interface and the schematic diagram of
the coupled pad-disc model
INBOARD PAD
NODE 4840
DIRECTION OF ROTATION
PLOT NO. ELEMENTS TYPE NUM
XV¥VZVDIST=0.1780 <F
IDDEN
21220
14840
COUPLED PAD-DISC SYSTEM
Figure 7.2 - The finite element model o f the coupled pad-disc system.

Chapter Seven -Stability Analysis o f the Coupled Pad-Disc System 167
In this study the parameters are varied independently so that the effect o f each can be
isolated A full listing o f the input data for the stability analysis can be found in
Appendix II.
For each complex eigenvalue problem the solution takes over 60 hours on a
standalone Apollo Domain Series 4500 computer. Using a Sun GPSB com puter which
is a general purpose server the solution takes about 6 - 1 2 hours depending on the
number o f users on the computer. It is therefore essential to reduce the problem size as
discussed in Chapter Four.
7.2.1 Interpretation of complex eigenvalues
As the approach adopted in this chapter relies heavily on the evaluation o f
complex eigenvalues, their meaning is explained here based on the work o f Newland
[82], For the i-th eigenvalue the complex eigenvalue Sj is written as
s ,= o ,+ jc o , (7.1)
In control literature the complex eigenvalues are plotted on the complex number plane
(commonly known as the s-plane) as shown in figure 7.3. For an eigenvalues which is
complex , s its complex conjugate , s, = a , - j c o , must also exist. For these
eigenvalues there will be a corresponding pair o f complex conjugate eigenvectors , Uj
and Uj*.
In stability assessment it is the real part o f the eigenvalue which is o f
importance. Thus for complex eigenvalues all the necessary information relating to the
stability o f the system is adequately represented by the first and second quarters o f the
s-plane with unstable modes lying in the first quarter and stable modes lying in the
second quarter.
The displacement response for free vibration in any mode can be written as

Chapter Seven -Stability Analysis o f the Coupled Pad-Disc System 168
u (t) = C je^U , + Cj*eS| U, (7.3)
where c, and Cj are arbitrary constants. By selecting c1 = c, =1 then ,
u (t) = es'U, + e s' U, (7.4)
The displacement response for a mode with complex eigenvalues is the combination o f
the separate responses o f the tw o eigenvectors (the complex eigenvector and its
conjugate). Thus for an eigenvalue o f s = ct+ jco and its complex conjugate o f s = c - jco
the displacement response can be rewritten as:
Using the Argand diagram , the contribution from each eigenvector to the
mode shape can be represented by tw o counter-rotating vectors o f increasing
magnitude ( for an unstable mode as the real part a is positive) as shown in figure 7.4.
The sign o f the imaginary part will determine the direction o f rotation o f the vector ,
positive is counter-clockwise and negative is clockwise.
The response u(t) is the addition o f these two complex quantities which rotate
in opposite directions at angular rate co multiplied by the increasing exponential
em.These rotating complex quantities are sometimes described as phasors and the
addition o f the two phasors is twice the projection onto the real axis o f either o f them.
Therefore the displacement response for each mode can be written as :
u(t) = e CTt(eKOtU + e_KOtU*) (7.5)
u(t) = 2eCTt|U|cos(cot + <j>) (7.6)
where the phase angle § is given by:
tan (j) = Im {U}/Re{U} (7.7)

Chapter Seven -Stability Analysis o f the Coupled Pad-Disc System 169
Figure 7.3 - Complex eigenvalue and its conjugate on the s-plane
Im Im
(a) I m (b)Uc'°
Rc
(c)
Figure 7.4 - Argand diagram for (a) complex-conjugate eigenvector pair (b)counter
rotating phasors o f unit length (c) the results o f multiplying complex quantites in (a)
and (b) [82]
Chapter Seven -Stability Analysis o f the Coupled Pad-Disc System 170
From equations (7.6) and (7 .7 ) , it is no longer adequate to represent the mode shape
for a complex mode with complex eigenvectors in a single mode shape diagram as for
the free-free response in Chapter Four as the individual mode coordinates in general no
longer moves in phase or out o f phase together.The notion o f fixed nodes and anti
nodes can no longer apply as there exists a non-zero phase relationship between the
coordinates. The exception would be when the imaginary part o f the eigenvector is
very small compared to the real part thus making the phase difference calculated from
equation 7.7 insignificant.
In order to interpret a complex mode shape , it is necessary to calculate the
position o f each point on the model over a cycle and present the mode shape as an
evolution in time as it repeats itself over each cycle (although for an unstable mode the
amplitude also grows with time). These changes over a cycle are not easily presented
for a very large degree o f freedom model as used in the present study. Therefore only
the real parts o f the eigenvectors are displayed (which is equivalent to the displaced
shape o f the mode when cot= 2k , 471.. as per equation 7.6). However one particular
unstable mode is selected and the evolution o f the phase angle o f its complex
eigenvector between the coupled nodes o f the finite element is studied as the mode
moves in and out o f the unstable region.
7.3 Results
7.3.1 Effect of contact stiffness, Kc
For the baseline condition defined above , the effect o f contact stiffness is
studied by changing the stiffness in steps o f 50 MN/m between 50 and 600 M N/m and
determining the complex eigenvalues for each case using the unsymmetric eigenvalue
solver in ANSYS [8], The results obtained indicate that lowest contact stiffness for
instability is 100 MN/m. Therefore complex eigenvalues for this condition are shown
in the s-plane plot o f figure 7.5 from which it can be seen only one unstable mode
(7.5 + 8917j) is evident. For the purpose o f the following discussion this mode is

Chapter Seven -Stability Analysis o f the Coupled Pad-Disc System 171
referred to as mode A. This unstable mode is paired with a stable mode o f the same
frequency (-7.5 + 8917j) as also observed in other published results [6,43],
Imaginary (kHz)
12
10
4
Mode A
-100 -50 50 100
Real part (1/s)
Figure 7.5 - Eigenvalue plot for contact stiffness o f 100 MN/m

Chapter Seven -Stability Analysis o f the Coupled Pad-Disc System
Imaginary part (kHz)12
10
4
-100 -50
Mode A
x Mode C
Mode B
—r~ 50
Real part (1/s)
100
Figure 7.6a - Eigenvalues for contact stiffness o f 150 MN/m
Imaginary part (kHz)
12
10Mode A
-100 -50 0 50
Real part (1/s)
Mode C
100
Figure 7.6b - Eigenvalues for contact stiffness o f 200 MN/m
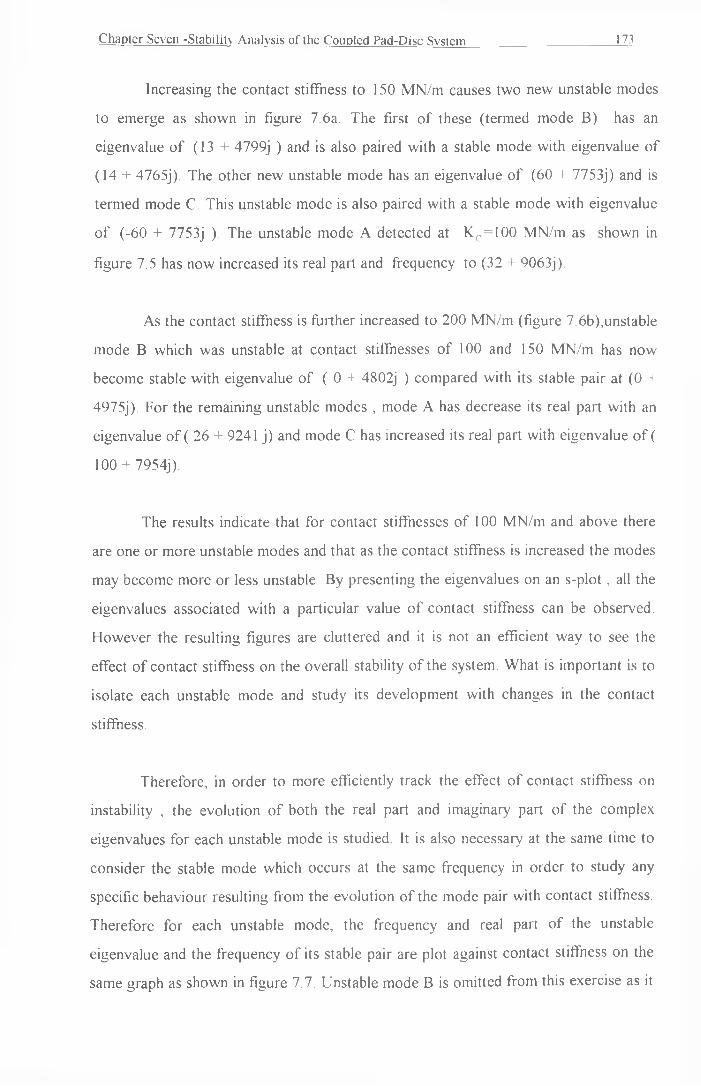
Chapter Seven -Stability Analysis o f the Coupled Pad-Disc System 173
Increasing the contact stiffness to 150 MN/m causes two new unstable modes
to emerge as shown in figure 7.6a. The first o f these (termed mode B) has an
eigenvalue o f (13 + 4799j ) and is also paired with a stable mode with eigenvalue o f
(14 + 4765j). The other new unstable mode has an eigenvalue o f (60 + 7753j ) and is
termed mode C. This unstable mode is also paired with a stable mode with eigenvalue
o f (-60 + 7753j ). The unstable mode A detected at K c =100 MN/m as shown in
figure 7.5 has now increased its real part and frequency to (32 + 9063j).
As the contact stiffness is further increased to 200 MN/m (figure 7.6b),unstable
mode B which was unstable at contact stiffnesses o f 100 and 150 MN/m has now
become stable with eigenvalue o f ( 0 + 4802j ) compared with its stable pair at (0 +
4975j). For the remaining unstable modes , mode A has decrease its real part with an
eigenvalue o f ( 26 + 9241 j) and mode C has increased its real part with eigenvalue o f (
100 + 7954j).
The results indicate that for contact stiffnesses o f 100 MN/m and above there
are one or more unstable modes and that as the contact stiffness is increased the modes
may become more or less unstable. By presenting the eigenvalues on an s-plot , all the
eigenvalues associated with a particular value o f contact stiffness can be observed.
However the resulting figures are cluttered and it is not an efficient way to see the
effect o f contact stiffness on the overall stability o f the system. What is important is to
isolate each unstable mode and study its development with changes in the contact
stiffness.
Therefore, in order to more efficiently track the effect o f contact stiffness on
instability , the evolution o f both the real part and imaginary part o f the complex
eigenvalues for each unstable mode is studied. It is also necessary at the same time to
consider the stable mode which occurs at the same frequency in order to study any
specific behaviour resulting from the evolution o f the mode pair with contact stiffness.
Therefore for each unstable mode, the frequency and real part o f the unstable
eigenvalue and the frequency o f its stable pair are plot against contact stiffness on the
same graph as shown in figure 7.7. Unstable mode B is omitted from this exercise as it

Chapter Seven -Stability Analysis o f the Coupled Pad-Disc System 174
occurs only for one contact stiffness value o f 150 MN/m and is also considered less
important as the real part is relatively small.
The results in figure 7.7 show that throughout the contact stiffness range
studied there are five significant unstable modes occuring at different frequencies
(shown as solid lines) and over different ranges o f contact stiffness. These inodes are
marked A,C,D,E and F respectively. It is important to note that in each case the real
part (shown as dashed lines) becomes positive as tw o modes o f different frequencies
converge ; also that the real part develops until it reaches a maximum and then
reduces back to zero as the frequencies o f the modes again diverge. This type o f
behaviour is typical o f complex eigenvalue instability analysis [45],
Mode A has an unstable frequency range o f 8917 - 9236 Hz. This frequency
range lies between the frequencies o f the 7th diametral (8708 Hz) and 8th diametral
(11225 Hz) modes o f the disc model under free-free conditions. Since frequency must
increase as a result o f contact (since the restraint stiffness increases) it is expected that
the disc diametral mode order for mode A should be 7 This effect can be seen even at
a low contact stiffness o f 100 MN/m where the frequency is 8.92 kHz is 209 Hz higher
( 4.1% higher) than for the free-free condition. The displaced shape for mode A is
shown in figure 7.10. from which the seventh diametral mode o f the disc can indeed
clearly be seen.
M ode C has an unstable frequency range o f 7753 - 8301 Hz which lies
between the frequencies o f the 6th diametral mode (6578 Hz) and 7th diametral mode
(8708 Hz) o f the free-free disc. However the initial o f unstable frequency o f 7753 Hz
is 1 175 Hz higher (17.9% higher) than the 6th diametral mode frequency under free-
free conditions. The frequency increase is too high to suggest that the diametral mode
order o f the disc is six. This aspect o f the results for mode C is discussed in more detail
in section 7.4.1
M ode D has an unstable frequency range o f 6166 - 63 16 Hz occuring between
contact stiffnesses o f 350 - 400 MN/m. The lower end o f this unstable frequency is 412

Chapter Seven -Stability Analysis o f the Coupled Pad-Disc System 175
Hz less (6.4% lower) than the sixth diametral mode o f the disc under free-free
conditions.
M ode E has an unstable frequency range o f 6667 - 6736 Hz occuring between
contact stiffnesses o f 450 - 550 MN/m. The lower end o f this unstable range is 89 Hz
greater (1.4% higher) than the sixth diametral mode o f the disc under free-free
conditions.
M ode F becomes unstable at a contact stiffness o f 400 MN/m with the real part
reaching its maximum at a contact stiffness o f 500 MN/m after which the mode
becomes more stable with the real part reducing as contact stiffness is increased. The
unstable frequency range o f mode F is between 10151 - 10394 Hz. The minimum
unstable frequency is 1741 Hz more (20.7% higher) than the seventh diametral mode
under free-free conditions.
These results show that the unstable modes do not possess higher frequencies
as contact stiffness is increased ; in other words a low contact stiffness does not
restrict an unstable mode to be o f low frequency (as shown by mode A) and indeed ,
even at relatively high values o f contact stiffness , modes o f relatively low frequency
still exist (as shown by mode D and E).
From figure 7.7 , the contact stiffness ranges over which particular modes
become unstable are different and in some cases overlap (for example modes C and D).
This indicates that for a particular value o f contact stiffness several unstable modes
may occur. The magnitude o f the real part as discussed in Section 7.2.1 above does not
predict the relative amplitude (or strength) o f each mode ; it only reveals how fast the
mode is growing and is thus only a relative measure o f squeal propensity in the sense
that a mode with large real part is more likely to manifest itself as squeal. From Table
7.1 which compares the maximum real part which occurs throughout the contact
stiffness range, mode C has the highest maximum real part followed by mode F.
Interestingly these modes occur over different ranges o f contact stiffness , mode C at
the lower range and mode F at the higher end.

Chapter Seven -Stability Analysis o f the Coupled Pad-Disc System 176
Table 7.1- Contact stiffness and frequency range o f the unstable modes (K s=24
MN/m)
M ode Contact Stiffness
range (MN/m)
Frequency range (Hz) Maximum real part ( 1/s)
A 100 - 250 8917 -9 2 3 6 32.1
B 150 4799 13
C 150 - 350 7753 - 8301 107
D 350 - 400 6166 - 6316 88.5
E 450 - 550 6667 - 6736 64.3
F 400 - 600 10151 - 10394 101
7.3.2 Effect of support stiffness , Ks
The contacts between the pad backplate and the piston or paw are modelled as
stiff springs o f total stiffness Ks connecting to ground those nodes on the pad
backplate to which point forces are applied to model the piston or paw applied force as
defined in Chapter Five (figures 5 .3 a-b). Results o f the stability analysis for the
baseline values o f support stiffness Ks=24 MN/m are discussed in section 7.3.1 above.
The complex eigenvalue analysis is now repeated for two alternative values o f support
stiffness:
i) K s = 2.4 MN/m
ii) K s = 240 MN/m
The stability analysis was again carried out over a contact stiffness range o f 50 - 600
MN/m in each case.
The results for a support stiffness o f 2.4 MN/m presented in figure 7.8
indicate three unstable modes within the range o f contact stiffness and frequency
studied. The first unstable mode (labelled A) first appears at a contact stiffness o f 125
MN/m with frequency o f 8977 Hz and dies out at a contact stiffness o f 250 MN/m
with frequency o f 9394 Hz. The second unstable mode (labelled C) occurs at a contact

Chapter Seven -Stability Analysis o f the Coupled Pad-Disc System 177
stiffness o f 200 MN/m and frequency o f 7833 Hz and persists upto the maximum
contact stiffness modelled. The third unstable mode (labelled F) occurs at a contact
stiffness o f 350 MN/m with frequency o f 10053 Hz and also continues upto the end o f
the contact stiffness range studied. The contact stiffness range for the first unstable
mode (mode A) is quite narrow compared to the other two. Furthermore the
appearance o f these unstable modes level as the contact stiffness is increased is not in
the same order as their respective frequencies. In each case (as before), the instability is
signalled by the convergence o f two different modes initially at different frequencies
whereupon the real part o f one mode becomes positive whilst stability is achieved
when the frequencies o f the two modes diverge.
The results shown in figure 7.7 for a support stiffness o f Ks=24 MN/m are
revisited in order to discuss the support stiffness effect. Comparison o f figure 7.7 and
7.8 shows that, a support stiffness is increased tenfold from initially 2.4 MN/m to 24
MN/m , two additional unstable modes appear (modes D and E). Furthermore mode C
which initially covered a wide range o f contact stiffness 175 - 600 MN/m (figure 7.8)
has now been reduced to a range o f 150 - 350 MN/m (figure 7.7). More importantly
the critical value o f contact stiffness at which the modes converge has been shifted to a
lower value. M ode F which first becomes unstable at contact stiffness o f 350 MN/m in
figure 7.8 now begins at a contact stiffness o f 400 MN/m (figure 7.7).
When the support stiffness is further increased to K s = 240 MN/m , a very
different trend to figure 7.7 and 7.8 is seen as shown in figure 7.9. There are now only
tw o unstable modes which occur near the extreme ends o f the frequency range. The
first unstable mode (mode G) occurs within a contact stiffness range o f 200 - 250
MN/m with a frequency range o f 3500 -3600 Hz whilst the second (mode F) occurs
within a contact stiffness range o f 400 - 600 MN/m with a frequency range o f 9262 -
9496 Hz. Compared to the two other values o f support stifffness , the real part in this
case is much reduced (40.0 maximum) and the unstable modes A,B,C,D and E
occuring for K s=:24 MN/m have now disappeared.

Chapter Seven -Stability Analysis o f the Coupled Pad-Disc System__________________________ 178
Frequency (kHz) Real part (1/s)
Contact stiffness (M N /m )
Figure 7.7 - The evolution o f the frequency and real part o f unstable modes (baseline
condition , support stiffness Ks= 24 MN/m)
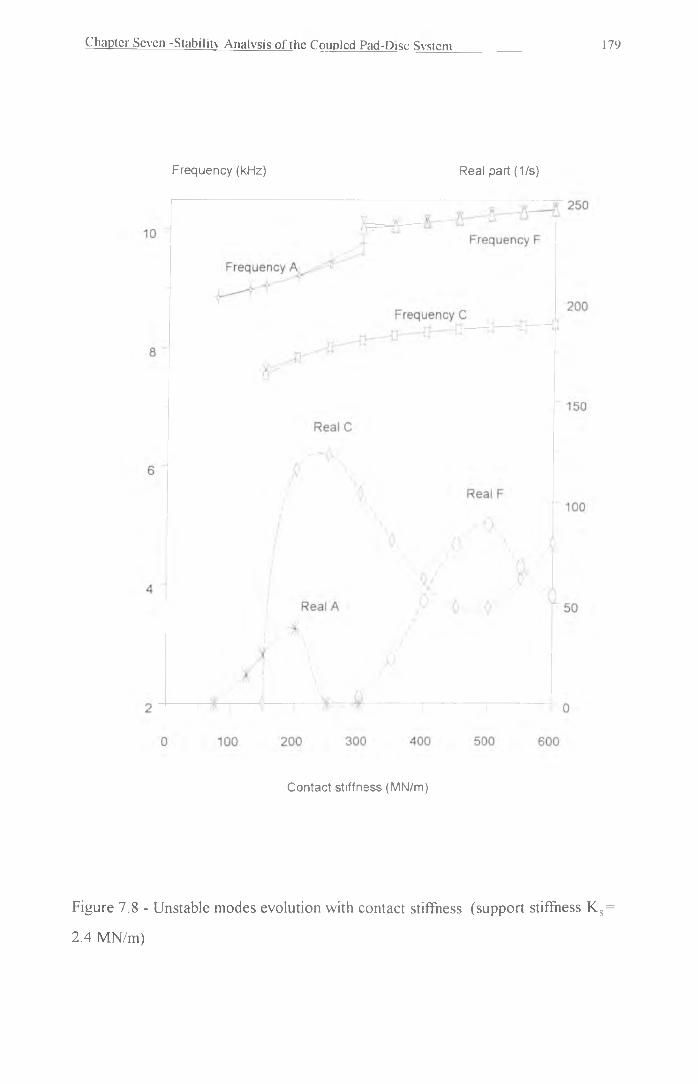
Chapter Seven -Stability Analysis o f the Coupled Pad-Disc System 179
Frequency (kHz) Real part (1/s)
C ontact stiffness (M N/m )
Figure 7.8 - Unstable modes evolution with contact stiffness (support stiffness K s=
2.4 MN/m)

Chapter Seven -Stability Analysis o f the Coupled Pad-Disc System ISO
Frequency(kHz) Real part (1/s)
0 100 200 300 400 500 600
Contact stiffness (MN/m)
Figure 7.9 - Evolution o f unstable modes with contact stiffness ( support stiffness K s
-2 4 0 MN/m)

Chapter Seven -Stability Analysis o f the Coupled Pad-Disc System
7.3.3 M ode shapes
The unstable modes discussed in Section 7.3.1 and 7.3.2 above were only
labelled in alphabetical order to allow for comparison and reference purposes. In this
section the mode shape for each unstable mode is presented in figures 7.11 - 7.15 It
must be stressed that, although the eigenvector from the analysis is complex, only the
real part is shown in these figures. Therefore these can be said to represent the mode
shape when cot = 2k , 471 , 6rc... (as per equation 7.6). For comparison the
undisplaced shape o f the model and the relative positions o f the components are shown
in figure 7.2.
Mode A (figure 7.10) involves the disc undergoing displacements similar to
those o f the 7th diametral mode. The inboard pad (operated on by the piston) is
moving in a ‘bent ears’ mode whilst the outboard pad (pressed by the paw) is in its
second twisting mode.
M ode B (figure 7.11) involves the disc undergoing its fifth diametral mode
even though the displacements are not very pronouced relative to those o f the pad. The
inboard and outboard pads both undergo their second bending mode o f deformation.
The mode shape o f the disc in mode C (figure 7.12) is discussed in more detail
in section 7.4 below. The inboard pad clearly undergoes the third bending mode whilst
the outboard pad undergoes a combination o f bending at the leading end and twisting
at the trailing end.
M ode D (figure 7.13) involves the disc moving in the sixth diametral mode.
The inboard pad appears undeformed with only the leading ear undergoing bending.
The outboard pad clearly experiences the first twisting mode Mode E (figure 7.14)
which is a progression o f mode D as the contact stiffness increases also has the disc
deforming in the sixth diametral mode. The inboard pad, which for mode D is relatively
immotive, now experiences deformation o f the trailing ear. The outboard pad is no
longer twisting but possesses an almost similar mode shape to that o f the inboard pad

Chapter Seven -Stability Analysis o f the Coupled Pad-Disc System 182
In mode F (figure 7.15) the disc undergoes the seventh diametral mode. The
inboard pad does not experience significant deformation whilst the outboard pad is
clearly undergoing the second twisting mode.
M ode G which occurs only for a very high value o f support stiffness (Ks= 240
MN/m) and with a narrow range o f contact stiffness and relatively low maximum real
part o f 15 is not considered important and is therefore omitted from discussion.
All the unstable modes described above involve diametral deformation o f the
disc. In all cases it is the outboard pad which has a more pronounced displaced shape
compared to that o f the inboard pad. In addition the mode o f deformation o f the
outboard pad is different from that o f the inboard pad except for mode B. This can be
attributed to the way the support stiffness is distributed at the backplate and the
resulting contact stiffness distribution at the pad-disc interface.

Chapter Seven -Stability Analysis o f the Coupled Pad-Disc System 183
PLOT NO. DISPLACEMENTSTEP=1 SUB =45 FREQ=25,357 RSYS=0 DMX =2.268
DSCA=0.00785
ZVDIST=0 18295 XFYF =0.333E- ZFPRECISE HIDDEN
= 24 MN/m)PLOT NO. 1DISPLACEMENTSTEP=1SUB =19FREQ=13.248RSYS=0DMX =4.496
DSCA=0.00396 XV =1 YV =1 ZV =1DIST=0.182538 XF =0.005671 YF =-0.929E-04 ZF =0.026548 PRECISE HIDDEN
Figure 7 .10 - M ode shape for unstable mode A (Kr - 150 MN/m , Ks
Figure 7. 11- M ode shape for unstable mode B ( K(- - 150 MN/m , Ks 24 MN/m)

Chapter Seven -Stability Analysis o f the Coupled Pad-Disc System 1S4
PLOT NO. 1DISPLACEMENTSTEP=1SUB =35FREQ=62,529RSYS=0DMX =3.875
DSCA=0.004594 XV =1 YV =1 ZV =1DIST=0.182964 XF =0.005901 YF =-0.460E-03 ZF =0.035341 PRECISE HIDDEN
Figure 7.12 - M ode shape for unstable mode C ( Kc = 150 MN/m , Ks - 24 MN/m)PLOT NO. 1 DISPLACEMENT STEP=1 SUB =25 FREQ=88 509 RSYS=0 DMX =2.142
DSCA=0.008309 XV =1 YV =1 ZV =1DIST=0.181588 XF =0.004926 YF =0.260E-03 ZF =0.035444 PRECISE HIDDEN
L
Figure 7.13 - M ode shape for unstable mode D (Kc- - 350 MN/m , Ks 24 MN/m )

Chapter Seven -Stability Analysis o f the Coupled Pad-Disc System 185
PLOT NO. 1DISPLACEMENTSTEP=1SUB =25FREQ=59 531RSYS=0DMX =3.123
DSCA=0.005701 XV =1 YV =1 ZV =1DIST=0.183763 XF =0.005381 YF =0.476E-03 ZF =0.033847 PRECISE HIDDEN
Figure 7.14 - M ode shape for unstable mode E (Kc - 500 MN/m , Ks - 24 MN/m)PLOT NO. 1 DISPLACEMENT STEP=1 SUB =49 FREQ=101.671 RSYS=0 DMX =3.53
DSC A=0.005043 XV =1 YV =1 ZV =1DIST=0.182847 XF =0.006273 YF =-0.245E-04 ZF =0.035785 PRECISE HIDDEN
Figure 7. 15- M ode shape for unstable mode F ( K(- -5 0 0 MN/m , Ks 24 MN/m)

Chapter Seven -Stability Analysis o f the Coupled Pad-Disc System 186
7.3.4 Variation of phase angle with contact stiffness.
It is o f interest to investigate the evolution o f the phase difference between the
normal displacements at the interface between the principal components (the disc and
the pads) as a function o f contact stiffness. Unstable mode C (for Kc= 100 - 425 MN/m
and Ks= 24 MN/m as in figure 7.7) was selected for this study. It is not feasible to
compare all the coupled nodes at the interface at once and therefore a representative
node is selected for each component: one node located on the centre o f the outer
circumference on the friction face o f each o f the outboard (node 14480) and inboard
pads (node 4480) as well as the adjacent node on the disc (node 21220) as shown in
figure 7.2. These nodes are selected as they lie on the pad centreline plane and in any
diametral mode o f the disc it is the outermost node (i.e. at the disc circumference)
which undergoes maximum displacement. Within the formulation o f the interface
element it is the interaction between the nodes on the pad and the disc represented by
their normal (axial) displacements which generates the contact force as indicated in
figure 7.1 Therefore the phase angle o f the normal displacement at each node selected
was calculated using equation 7.7 and the results together with the components o f the
complex eigenvectors for these displacements are listed in Table 7.2. It can be seen
that the phase difference is effectively zero for the stable condition (i.e. K<- = 100
MN/m and Kr = 425 MN/m ). In all other cases the phase angles are not zero. The
phase differences between the normal displacements o f the pad nodes and that o f the
disc together with the real part o f the unstable mode eigenvalue are plotted against
contact stiffness in figure 7.16.
The results in figure 7.16 show that the phase difference for both the inboard
pad-disc and outboard pad-disc normal displacements follow closely the trend o f the
real part o f the eigenvalue. The maximum real part coincides with the phase difference
value closest to 180 degrees and the real part becomes zero as the phase difference
also tends to zero. This aspect can be explained by considering the interface element
matrix used to couple the nodes for which maximum variation o f normal force implies
a phase difference o f 180 degrees between the normal displacements o f the node pair.
Thus the maximum real part o f the unstable mode C coincides with the maximum

Chapter Seven -Stability Analysis o f Ihc Coupled Pad-Disc System 187
phase difference between the pads and disc as the pads effectively ‘hammer’ the disc. It
is expected that this same relationship between phase difference and positive real part
would apply to other modes. It is also interesting to note that the inboard pad leads the
outboard pad by 43 degrees within the unstable range o f contact stiffness and the phase
difference remains relatively constant at about 43 degrees (= k/4 radian) except when
K(- = 350 MN/m where the phase difference between the outboard pad and the inboard
pad is 33.44 degrees. This imply that the inboard pad hammers the disc first followed
by the outboard pad thus allowing for energy transfer between the pads and the disc.
Table 7.2 - The components o f the eigenvector and phase angle o f the selected normal displacements for different values o f contact stiffness
Contact stiffness Kc (MN/m)
Inboard pad node
Disc node Outboard pad node
100 Eigenvector (Re) (Im)
Phase angle , <J)
1.6137+ 0.3462E-4j 0.00°
-0.5233 - 0.9428E-4j 0.01°
0.2008 + 0.6917E-4j 0.02°
150 Eigenvector (Re) dm )
Phase angle , (j)
0.5597 - 0.6530) 310.60°
-0.0293 + 0.2856j 95.87°
-0.0299 - 0.235 1 j 277.24°
200 Eigenvector (Re) (Im)
Phase an g le , (J)
-0.0494 - 0.7270j 224.03°
0.1583 + 0.2045j 52.26°
-0.3667 - 0.3545j 266.11°
250 Eigenvector (Re) (Im)
Phase angle , 4>
0.3326 + 0.443 lj 53.11°
-0.1136 - 0.0115j 185.79°
0.5501 + 0.1016j 10.46°
300 Eigenvector (Re) (Im)
Phase angle , (j)
0.2668 + 0.295 8j 47.95°
-0.0275 +0.0296j132.92°
0.5784 + 0.0623j 6.14°
350 Eigenvector (Re) (Im)
Phase angle , (J)
0.2123 + 0 .1546j 36.05°
0.0237 +0.044()j61.67°
0.5944 + 0.0273j 2.61°
425 Eigenvector (Re) (Im)
Phase angle , (J)
0.3152 - 0.2663E-4j 0.00"
0.1429 - 0.2868E-5j
0.00°
0.6801 - 0.5486E-5j0.00°

Chapter Seven -Stability Analysis o f the Coupled Pad-Disc System 188
Real part (1/s) Phase difference (degrees)
Contact stiffness (M N /m )
Figure 7 .16- The real part o f the eigenvalue and the phase difference between normal
dispalcements o f the outboard and inboard pad nodes and the disc node for mode C
(support stiffness Ks = 24 MN/m)

Chapter Seven -Stability Analysis o f the Coupled Pad-Disc Svslcm 189
7.4 Discussion
The results from the complex eigenvalue analysis suggest that for different
values o f support stiffness there are different unstable modes. Instability occurs in each
case as a result o f two modes initially of different frequencies coming together to form an
unstable mode (with a corresponding stable mode with real part of equal magnitude but
negative sign) at a certain value o f contact stiffness. This instability continues upto a higher
value o f contact stiffness whereupon the mode frequencies diverge resulting in both modes
becoming stable again.
Beginning from a very low value o f backplate support stiffness o f 2.4 MN/m,
there are initially three unstable modes which occur over a relatively wide range o f
contact stiffness. As the support stiffness is increased to K s=24 MN/m one o f these
unstable mode vanishes but a new unstable mode appears and the two other unstable
modes seen at Ks = 2.4 MN/m now occur over a narrower range o f contact stiffness.
As the support stiffness is further increased to K s=240 MN/m, only one significant
unstable mode from the previous condition remains but with very much reduced real
part and lower frequency.
The effect o f applied pressure on disc brake squeal problem can now be
explained using the results from the analysis for both varying contact stiffness Kc and
support stiffness Ks. In the contact stiffness determination discussed in Chapter Six , the
effect o f increasing applied pressure is to increase the contact stiffness linearly. Based
on this result, an assumption can be made that the same trend applies to the pad
backplate interface i.e. the support stiffness also increases linearly with the applied
pressure (although the exact relationship is not determined). As the pressure is
increased on the pad backplate , the contact stiffness increases causing some modes to
converge to form unstable modes and this instability continues upto a certain value o f
stiffness when the modes diverge to become two separate stable modes. At the same
time the support stiffness also increases with increasing applied pressure and this forces
the unstable modes to occur within a narrower band o f contact stiffness. This translates
in practice to the range o f applied pressure over which squeal occurs as shown by

Chapter Seven -Stability Analysis o f the Coupled Pad-Disc System 190
Fieldhouse and Newcomb [10], As the pressure increases further new unstable modes
arise with the same convergence-divergence phenomenon However the corresponding
increase in the support stiffness finally suppresses these modes and squeal therefore
dies out above a certain value o f applied pressure. The stabilising effect of increased
support stiffness also compares well with the experimental finding by Sherif et al [56] that
increased support stiffness (achieved by using a steel ball pressing on the pad and also by
having a grooved backplate) reduces squeal noise. It also compares well with the analytical
work o f Ghesquirre [46] whereby increasing the caliper normal stiffness (equivalent to the
support stiffness of the model used in the present study) caused one of the modes to
become stable.
For comparison with the experimental results the tw o modes with the highest
maximum real part are selected from the analytical results for a support stiffness o f 24
MN/m. It may be judged that these modes have the highest squeal propensity
compared to the other modes and furtherm ore they occur over a wide range o f contact
stiffness and also a relatively wide range o f support stiffness. The values o f the contact
stiffness used in the analysis is converted to equivalent line pressure according to the
results o f the interface contact stiffness calculation shown in figure 6.12 o f Chapter
Six. The unstable frequency range from the analysis for these two modes is compared
with the squeal frequency range o f the experiment [10] in figure 7.17
Chapter Seven -Stability Analysis o f the Coupled Pad-Disc System 191
Pressure (bar)
Frequency (kHz)
Figure 7.17 - The line pressure-frequency relationship for both experimental and
analytical squeal modes
The results in figure 7.17 indicate that the first unstable frequency range from the
analysis compares very well with the experiment whilst the second unstable frequency
range from the analysis is somewhat higher. The discrepancy for the higher frequency
range may be due to the fact that, as stated in Chapter Four, the pad finite element
model under free-free condition compares well with experimental results only for
frequencies below 8 kHz (figure 4.13). The discrepancy could also be reduced by
increasing the support stiffness which would result in a lowering o f the second unstable
frequency range as shown by comparison o f figure 7.9 and 7.7. Bearing in mind these
observations, it is fair to conclude that the approach has been successful in predicting
the correct range o f line pressure and frequency over which squeal occurs.
In order to compare the predicted unstable mode shapes with experiment, only
the most significant unstable modes are selected which as discussed above are modes C

Chapter Seven -Stability Analysis o f the Coupled Pad-Disc System 192
and F. The unstable mode C is compared to the low pressure range from the
experiment [10] whilst, for the high pressure range , unstable mode F is selected for
comparison. The analytical unstable mode is displayed as an equal displacement
contour plot which allows for direct comparison with the reconstructed holographic
image from the experiment. It is important to note that the analysis does not directly
model the caliper. On the other hand in the actual brake system the caliper forms an arc
o f 93 degrees covering the disc and therefore only the fringes outside the caliper arc
can be revealed in the reconstructed holographic image. The results from the finite
element analysis can however reveal the equal displacement contours under the pad
which provides a distinct advantage in the analysis o f the mode shape. In addition the
construction o f the actual brake system is such that the outboard pad is partially
obscured by the caliper paw while the inboard pad is totally hidden. Therefore
comparison o f the pad mode shapes can only be made for the outboard pad (with the
limitation mentioned above) whilst for the inboard pad only the analytical mode shape
is available.
7.4.1 Low pressure range squeal
In order to allow for comparison o f the mode shape from the analysis with
experiment, the equal displacement contour plots o f the disc and the pads from the
analysis are shown separately in figures 7.19a-c in order to allow the contour plot o f
the disc under the pad to be displayed.
The disc mode shape from experiment (figure 7.18) is evidently diametral with
a uniform node spacing outside the pad-disc contact area. A total o f 1 1 antinodes and
10 nodes can be counted outside the caliper arc. Measurement between two successive
nodes reveals an angle o f 27 degrees. Similarly the mode shape from the analysis
(figure 7.19a) reveals 11 nodes and 10 antinodes outside the 92 degrees arc
representing the pad and caliper shown by the two bold lines in the figure Measuring
the angle between the nodes outside the caliper arc again reveals an angle o f 27
degrees. Thus the nodal spacings o f the experimental and analytical modes outside the
caliper arc are the same. I f one assumes that the disc nodal spacing under the pad and

Chapter Seven -Stability Analysis o f the Coupled Pad-Disc System 19.3
caliper remains similar to that elsewhere on the disc, this condition implies a diametral
mode order o f 6.67 (360°/(27°x 2)). In order for the disc mode shape to be purely o f
sixth diametral mode, the nodal spacing need to be 30 degrees ( 360°/12) and
uniformly spaced both in and out o f the contact area (for comparison free-free sixth
diametral mode shape can be found figure 4.6e of Chapter Four). However the equal
displacement plot (figure 7.19a) shows that there are 4 nodes and 3 antinodes under
the pad with the angle between the nodes no longer uniform. At the leading edge the
angle between the nodes is 32 degrees which is 5 degrees more than that between the
nodes outside the caliper arc. Furtherm ore by closely inspecting the displacement
contours there are 6 maxima (lines marked I) and 7 minima (6 lines marked A and a
single line marked C) and 13 node clusters (lines marked E) around the disc
circumference. The diametral mode order is defined by the (even) number o f nodes (or
antinodes) divided by two. This shows that the mode shape occuring under the coupled
condition is not the sixth diametral mode o f the disc and therefore cannot be detected
in advance by natural frequency analysis o f the free-free disc.
This conclusion provides an added explanation to the hypothesis o f Fieldhouse
and Newcomb [10] that the source o f excitation for low pressure squeal is the pad
rather than the disc due to the large difference in the natural frequency o f the disc sixth
diametral mode (6450 Hz) and the squeal frequency (7850 Hz). As the coupled
diametral mode o f the disc does not exist naturally, it must therefore be excited at this
mode shape and frequency by interaction with the pad.
It is difficult to compare the predicted mode shape o f the outboard pad with
experiment as in the latter a large proportion o f the pad is covered by the caliper paw
The equal displacement contour plot on the outboard pad model (fig. 7.19b) shows a
bending deformation o f the trailing end indicated by the curved contours whilst the
leading end is undergoing some form o f twisting indicate by the horizontal contour
lines. In the experiment , the pad trailing end also undergoes a relatively large bending
deformation as shown by the closely spaced vertical (relative to the pad longest
dimension) fringe lines whilst the leading end has two widely spaced vertical fringe
lines indicating a relatively small bending displacement. The similarity o f the mode

Chapter Seven -Stability Analysis o f the Coupled Pad-Disc System 194
shapes for the pad therefore is limited to the trailing end o f the pad as the leading end
in the finite element analysis displays a twisting mode whilst in the experiment it
undergoes a small degree o f bending.
For the inboard pad no comparison can be made as the inboard pad is hidden
in the experiment by the caliper housing. However the mode shape o f the coupled
system (figure 7.12) shows that the pad is only undergoing small displacements relative
to the outboard pad. The finite element contour plot (figure 7.19c) indicates the
inboard pad to have a displaced shape similar to that o f the first bending mode.

Chapter Seven -Stability Analysis o f the Coupled Pad-Disc System 195
Figure 7.18 - Reconstructed holographic image for low pressure squeal mode [10]
Arc covered by
by calliper and pad
32 deg.
A =-1.135B =-0.85263C =-0.569936D =-0.287241E =-0.004546F =0.278148G =0.560843H =0.843538I =1.126
Figure 7.19a - Equal displacement contours on the disc for unstable mode C (KC'-1 5 0
M N/m , Ks = 24 MN/m)

Chapter Seven -Stability Analysis o f the Coupled Pad-Disc System 196
DISC SLIDING DIRECTION
STEP 1 SUB= IFREQ 69.629UZRSYS=0 DMX 3.934 SEPC 93.16 SMN=-3.349 SMX=3.7412 A=-3.7311 B=-2.8448 C=—1.9585 D=-1.0722 E=-0.1859 F=0.7004 0=1.5867 H 2.4730 I 3.3593
Figure 7 .19b - Equal displacement contours on the outboard pad for unstable mode C (Kc-= 150 M N/m , Ks =24 MN/m)
ISTEP=1 SUB=1FREQ-69.629 UZRSYS=0 I)M .\ 3.934
I SEPC-93.183 j SMN=-0,I99801 1 SMX=0.435298
A--0.1646 I B=-0.093951 C=-0.023384 D= 0.047182 E=0.1178 F=0.18840 G=0.258882II 0.329448 1=0.400015
DISC SLIDING DIRECTION
Figure 7.19c - Equal displacement contours on the inboard pad for unstable mode C (Kc=150MN/m , Ks = 24 MN/m)

Chapter Seven -Stability Analysis o f the Coupled Pad-Disc System 197
7.4.2 High pressure range squeal
The equal displacement contour plot from the analysis (figure 7.21a) shows
that the disc has a total o f 12 antinodes (lines marked A and H) and 11 nodes (lines
marked E) outside the caliper arc with an average nodal angular spacing o f 23
degrees. Inside the caliper arc, the contour lines are very much distorted with 2
antinodes and 3 nodes detected whilst the nodal spacing is much larger with 35 degrees
between those under the leading edge part o f the pad and 37 degrees between those
nodes under the trailing edge. Since there are 14 nodes and 14 antinodes around the
disc circumference in total the mode can be defined as the seventh diametral mode. The
reconstructed holographic image o f the disc brake during squeal in the high pressure
range (figure 7.20) shows that outside the caliper arc there are a total o f 11 nodes and
12 antinodes with an angular nodal spacings o f 24 degrees. Therefore the nodal
spacing o f the disc from the analysis and experiment is very similar whilst the numbers
o f nodes and antinodes outside the caliper arc are identical.
The holographic image for the outboard pad (figure 7.20) is covered by the
caliper and only the fringe lines on the ears can be clearly seen These reveal the pad
ears at both leading and trailing edges to be undergoing twisting. Although the trailing
ear has higher fringe density than the leading ear. The results from the analysis (figure
7.20c) also reveal the trailing pad ears to have a twisting deformation indicated by the
one horizontal (relative to the pad longest dimension) contour line. The leading edge o f
the pad has similar horizontal contour lines but with higher density which indicates
larger deformation as shown in the mode shape plot for mode F (figure 7.15). As both
ends o f the pad undergo twisting in the analysis and in the experiment in can
confidently be stated that the outboard pad mode shape from the analysis compares
well with experiment for the high pressure range.
The results from the analysis (figure 7.21c) show horizontal lines on the trailing
edge o f the inboard pad indicating a twisting motion whilst the leading edge has
diagonal lines bending indicating with slight twisting. Again it is not possible to
compare those predicted motions with experiments.

Chapter Seven -Stability A nalysis o f the Coupled Pad-Disc System 198
Figure 7.20 - Reconstructed holographic image for the high pressure range squeal [10]
35 degrees
G j C D e F qH1
37 degrees
Arc covered by caliper and pad
LEADING EDGE
A =-0.796344B =-0.584909C =-0.373475D =-0.16204E =0.049395F =0.26083 G =0 472265H =0.683699I =0.895134
Figure 7.21a - Equal displacement contours on the disc for unstable mode F

Chapter Seven -Stability Analysis o f the Coupled Pad-Disc System 199
STEP 1 SUB= 1FREQ 85.185UZRSYS 0 DMX 8.855 SEPC 93.2 SMN 7.651 SMX 8 547 A -6.751 B=-4.951 C=-3.151 D -1 .3 5 2 E=0.448023 F=2.248 G 4.047 H=5.847 I 7.647
DISC SLIDING DIRECTION
Figure 7.2 lb - Displacement contours on the outboard pad for unstable mode F (Kc =500 M N/m , Ks = 24 M N/m)
STEP- 1 SUB 1FREQ -85.185 UZRSYS=0 DMX 1.869 SEPC=93.591 SMN -0.757618 SMX 1.302 A --0.643211 B=-0.414397 C=-0.185583 D=0.043232 E -0 .272046 E -0.50086 G=0.729675 11=0.958489 1=1.187
Figure 7.21c - Displacement contours on the inboard pad for unstable mode F (Kr =500MN/m. Ks = 24 MN/m)

Chapter Seven -Stability Analysis o f the Coupled Pad-Disc System 200
For both the low and high pressure range squeal, the disc mode shape is
somewhat distorted compared to the free-free condition. In both cases it has been
shown that the angular spacing o f the nodes is regular away from the caliper but very
much changed under the pad. This suggests that modal analysis o f disc under free-free
conditions would not indicate the squeal mode shape or frequency. Similarly the pad
mode shapes from the coupled analysis do not show much similarity with those under
free-free conditions as described in Chapter Four. Therefore a coupled pad-disc
analysis is necessary to correctly predict the mode shape and frequency o f the unstable
modes which can be related to squeal and provide the necessary information for squeal
abatement. It has been shown by Hoffman [54] that for damping layer on the pad
backplate to be effective it must undergo relatively large displacements as in a bending
mode. The results presented in figure 7.19b show the pad undergoing bending and the
leading part o f the outboard pad also undergoing bending which indicates the
suitability o f the damping layer approach to moderate unstable mode C.
The diametral modes o f the disc for the unstable modes as described above no
longer takes the form o f a pure diametral mode (i.e uniform node spacing). This
suggests that modification to the disc would not have much effect on the stability o f
the coupled pad-disc system as diametral mode separation would be effective only for
diametral modes which have uniform nodal spacing. The effect o f mode separation on
the stability o f the coupled pad-disc system is further considered in Chapter Eight.
The results from the analysis revealed some unstable modes which were not
apparent in the experiment. However the unstable modes with a relatively high real part in
their complex eigenvalue compare well with experimentally observed squeal modes. This
indicates that the order o f magnitude of the contact stiffness derived in Chapter Six has
produced results in terms frequency and pressure range for the major unstable modes that
compare reasonably with the experimental results of Fieldhouse and Newcomb [10],
The good correlation between the results from the finite element analysis and
the experiments in terms o f instability frequency and the associated mode shapes within
the right range o f applied pressure have shown that squeal can be successfully

Chapter Seven -Stability Analysis o f the Coupled Pad-Disc System 201
modelled using the finite element method. This also demonstrate that the magnitude o f
contact stiffness assumed is correct in the sense that it produces unstable modes which
resemble experimental squeal modes. Thus the general effect o f pressure on disc brake
squeal has been explained taking account o f both interface contact stiffness and
support stiffness. The coupled finite element model and the complex eigenvalue
solution technique can now be applied to investigate the effect o f parametric changes
(from the baseline values) on the propensity for disc brake squeal as explained in
Chapter Eight below.

Page 202
CHAPTER EIGHT
PARAMETRIC STUDIES OF THE COUPLED PAD-DISCSYSTEM
8.1 Introduction
The coupled pad-disc model used in Chapter Seven for the complex eigenvalue
stability analysis has predicted a number o f unstable modes, several o f which show
good correlation with experimental squeal evidence. The conditions for which the
results from the model compare well with experiment are selected as baseline values
and the sensitivity o f the results to variations in these baseline parameters is studied in
this chapter.
There are several reasons why sensitivity studies are needed. Firstly there is a
desire to determine parameters which lead to improved stability o f the system thus
helping designers to eliminate squeal by changing those parameters. Secondly there is
the need to compare variations from the present approach with other variations carried
out experimentally and analytically, thereby further validating the present modelling

Chapter Eight - Parameric studies o f the coupled pad-disc system 203
approach for squeal related work. The parameters studied here are open to physical
interpretation and, as much as possible , related experimental work is used to verify the
trend o f the results.
8.2 Methodology
The baseline condition selected for this sensitivity analysis is o f a combined
trailing and leading edge abutment with a friction coefficient o f 0.4. The contact
stiffness distributions are the same as in Section 6.3.1 i.e. leading edge biased for both
inboard and outboard pads. The backplate connection stiffness is taken as 24 MN/m
and the abutment stiffness is taken as 1.2 MN/m.
The parameters studied in this exercise include:
a) friction coefficient, |a
b) stiffness o f the abutment
c) contact stiffness distribution
d) Y oung’s modulus o f the disc material
e) Y oung’s modulus o f the pad material
f) effect o f disc asymmetry.
8.3 Effect of Friction Coefficient
Friction coefficient which is one o f the most important factors in any friction
brake design is governed by controlling the composition o f the friction material and
also proper matching o f the friction pair. As economic factors begin to make
downsizing o f components more attractive , the use o f a higher friction coefficient to
achieve similar braking performance for a smaller rotor diameter is encouraged. In this
study the squeal propensity o f the coupled pad-disc system is estimated for different
friction coefficients in the range o f 0.1 to 0.7 in steps o f 0.1 Only one value o f contact
stiffness o f 300 MN/m is used for the analysis as, at this value, the resulting unstable
modes compare well with experiment as reported in Chapter Six.

Chapter Eight - Parameric studies o f the coupled pad-disc system 204
There are three unstable modes detected within the range o f friction coefficient
studied. The first unstable mode begins at a friction coefficient o f between 0.4 and 0.5
(as at (1=0.5 the real part is already 30) as shown in figure 8.1. It comes about as a
result o f tw o different modes at an initially different frequencies (5970 Hz , 6090 Hz)
coming together at a common frequency o f 5975 Hz. After the modes converge, the
real part grows with increasing friction coefficient whilst the frequency continues to
fall. The real part reaches a maximum at p= 0.6 after which it reduces with increasing
l-i
The second unstable mode first occurs at a friction coefficient o f 0.5 as shown
in figure 8.2 as two different modes at different frequencies (6530 Hz , 6709 Hz)
coalesce at a common frequency o f 6551 Hz. After this, the real part increases with
increasing friction coefficient whilst the frequency remains relatively unchanged.
Figure 8.3 shows the third unstable mode first occurring at a friction coefficient
o f 0.35 when two separate modes at different frequencies (8120 Hz , 8340 Hz)
coalesce at a common frequency o f 8231 Hz. Again the real part increases
monotonically with the friction coefficient whilst the frequency remains relatively
unchanged.
To give an overall picture , the evolution o f the frequency for all three unstable
modes is shown in figure 8.4. It can be seen that there are different critical friction
coefficients at which the modes converge. For modes A and B, the critical friction
coefficient is about 0.5 whereby the critical friction coefficient for mode C is 0.35. The
lower the critical friction coefficient the easier the mode will become unstable. Also the
real part (which indicates the instability) tends to grow with increasing friction
coefficient (with the exception o f mode A which reaches a maximum at |H=0.6 as
shown in figure 8.1). In general higher friction coefficient therefore results in a less
stable system as the system can accommodate more unstable modes. This is in
agreement with all other published results [6,7,43,47],

Chapter Eight - Parameric studies o f the couplcd pad-disc system 205
Frequency (Hz) Real part (1/s)
Friction coefficient
Figure 8.1 - Unstable mode A
■*- Freq.AI
+■ Freq.A2
Real part
Frequency(Hz) Real part (1/s)
0.2 0.3 0.4 0.5
Friction coefficient
Figure 8.2 - Unstable mode B
Freq.BI
Freq.B2
Real part

Chapter Eight - Parameric studies o f the couplcd pad-disc system 206
Frequency (Hz) Real part (1/s)8.500
8,000
7.500
7.000
6.500
6.000
5.5000 0.1 0.2 0.3 0.4 0.5 0.6 0.7
Friction coefficient
Figure 8.3 Unstable mode C
Frequency(Hz)8.500
i?----------- - „ Mode C* £ a 2 2
k---------A---------*8,000
7.500
7.000
X----------- * -----------x______ Mode B6.500
------------- f—---------1_______ i Mode C6.000 - L------- 1 1. t -= k= — +— -------' T -----—6-
5.5000 0.1 0.2 0.3 0.4 0.5 0.6 0.7
Friction coefficient
Figure 8.4 - The overall unstable modes
Frequency(Hz)
i \ ------------g-------------------------Z -- Mode C“ ___________---------------------------------- f t ------------------------ f t ------------------------ft------------------------i
A ------------------------ft------------------------* '
± = t = b
Mode Bn i
Mode C— -f— —
Freq.CI
Freq.C2
* Real part
— Freq.AI
H - Freq.A2
-O- Freq.BI
-X- Freq.B2
-A- Freq.CI
s - Freq.C2

Chapter Eight - Parameric studies o f the coupled pad-disc system 207
8.4 Effect of Abutment Stiffness
The pad abutments are modelled as stiff springs connecting two nodes at each
o f the pad ears to ground. The baseline stiffness is 2.4 MN/m at each end. Two
additional values are used to study the sensitivity o f the model to the abutment
stiffness:
i) 0.0024 MN/m
ii) 2400 MN/m
The results for the abutment stiffness o f 0.0024 MN/m shown in figure 8.5 indicate
five unstable modes within different ranges o f contact stiffness. All the unstable modes
occur at frequencies above 5 kHz.
Comparing the results for abutment stiffnesses o f 0.0024 MN/m (figure 8.5)
and 2.4 MN/m (figure 7.7), the trends and the frequency range over which the modes
are unstable remain essentially the same. There is one exception to this observation in
that the mode with the highest frequency range (10.1 - 10.6 kHz) has increased its
maximum real part from 71 to 102 as the abutment stiffness is increased. However,
when the abutment stiffness is further increased to 2400 MN/m (about an order o f
magnitude greater than the pad-disc contact stiffness), there are some major changes to
the unstable modes indicated in figure 8.6 including:
a) a reduction o f the contact stiffness range over which the modes are unstable
b) significant increase in the maximum real part o f the complex eigenvalues.
Therefore the effect o f abutment stiffness is mode-specific in the sense that different
modes are influenced in a different manner by the magnitude o f the abutment stiffness.
An increase in abutment stiffness tends to stabilise modes which are unstable over a
relatively narrow range o f contact stiffness by reducing further the unstable contact
stiffness range and the magnitude o f the maximum real part. For modes which are
unstable over a relatively wide range o f contact stiffness, an increase in abutment
stiffness from the baseline value increases the magnitude o f the real part and hence
reduces the stability. There is also a downward shift o f the critical contact stiffness for
the higher frequency unstable modes, in particular mode F for which the critical
contact stiffness value is reduced from 400 MN/m to 300 MN/m.

Chapter Eight - Paramcric studies o f the coupled pad-disc system
Frequency (kHz) Real part (1/s)
Contact stiffness (M N /m )
208
Figure 8.5 - Unstable modes for abutment stiffness o f 2.4 kN/m

Chapter Eight - Parameric studies o f the coupled pad-disc system
Frequency (kHz) Real part (1/s)
Contact stiffness (M N /m )
209
Figure 8.6 - Unstable modes for abutment stiffness 2 400 MN/m

Chapter Eight - Parameric studies o f the coupled pad-disc system 210
8.5 Effect of Contact Stiffness Distribution
Three different contact stiffness distributions are considered in this study
namely:
i) leading edge biased
ii) uniform
iii) trailing edge biased.
The leading edge biased distribution is the baseline condition from the contact analysis
described in Chapter Five which showed that the distribution tends to be biased
tow ards the leading edge for both inboard and outboard pads due to the friction effect.
The uniform contact stiffness distribution is achieved by specifying the same contact
stiffness for all the node pairs at the pad-disc interface. This in practice could be
achieved (to a certain extent) by using softer friction material and spreading out the
force applied to the backplate as demonstrated in Chapter Five for the case o f paw
applied pressure. The trailing edge biased contact stiffness distributions are obtained by
mirroring all the contact values for the leading edge biased distribution about the pad
centreline (as the pad is symmetric about this line). This again result in partial contact
but now the nodes at the trailing edge have higher contact stiffness values than those at
the leading edge. In practice a very similar effect can be achieved for the inboard pad
by moving the piston tow ards the trailing edge.
All the analyses are carried out for a combined trailing and leading edge
abutment with friction coefficient o f 0.4 and for a range o f contact stiffnesses upto
600 MN/m Figure 7.7 shows the mode evolution for the baseline leading edge biased
distribution which occurs under normal sliding As discussed in detail in Chapter Seven,
there are five major unstable modes within the range all involving the sixth and seventh
diametral modes o f the disc.
Figure 8.7 shows the corresponding mode evolution for a uniform pressure
distribution over both pads. A total o f three unstable modes is indicated with the first
mode (mode D) occurring over a very narrow contact stiffness range. In contrast mode

Chapter Eight - Parameric studies o f Ihc couplcd pad-disc system 211
C occurs over a contact stiffness range o f 250 - 400 MN/m and mode F occurs over a
contact stiffness range o f 300 - 450 MN/m. The maximum real part for this condition is
175 for unstable mode C compared with 107 for the same mode with the baseline
contact stiffness distribution (figure 7.7).
Figure 8.8 shows the mode evolution for the trailing edge biased condition
from which a total o f three unstable modes can again be detected. The first unstable
mode (mode D) occurs over a contact stiffness range o f 350-450 MN/m , the second
unstable mode (mode E) occurs over a contact stiffness range o f 500 - 600 MN/m and
the third unstable mode (mode C) occurs over a contact stiffness range o f 550 - 600
MN/m. The maximum real part for this condition is now 70, again for mode C.
In general these results demonstrate that interface contact stiffness distribution
does influence the stability o f the coupled pad-disc system. M oreover a contact
stiffness distribution biased tow ards the trailing edge results in unstable modes within
a very narrow range o f contact stiffness compared to the leading edge biased
distribution. Furtherm ore the maximum real part o f the complex eigenvalues for the
trailing edge biased condition ( 73) is very much reduced from the leading edge biased
condition (100) and the uniform contact pressure distribution (145). In addition
unstable mode F which appears for both leading edge biased and uniform distribution
no longer exists in the trailing edge biased distribution. The results also indirectly
suggest that wear resulting in a reduction o f the thickness o f the friction material and
(usually) a more uniform contact pressure distribution will affect the stability o f the
system and in particular the contact stiffness range over which modes become unstable.
Therefore two important trends can be detected from these results:
1) the leading edge biased and uniform contact stiffness distributions have
similar unstable modes (at this level indicated by the frequency range over which they
occur)
2) the trailing edge biased contact stiffness distribution tends to stabilise the
system as indicated by the reduced range o f contact stiffness for the unstable modes
and the reduction in magnitude o f the real part.

Chapter Eight - Parameric studies o f the coupled pad-disc system 212
The above trends match well with the lumped parameter model results o f Brooks et al
[43] which predicted that moving the centre o f pressure towards the leading edge
creates a more unstable system and also the experimental results o f Fieldhouse and
Newcomb [10] which showed that when the pressure application point on the pad
backplate is shifted towards the trailing edge the squeal noise level is much reduced.

Chapter Eight - Parameric studies o f the couplcd pad-disc system
Frequency (kHz) Real part (1/s)
10
250
200
150
R eal C
R eal D .* .
o100
50
.-O'-o-,
100 200 300 400 500 600
Contact stiffness (M N /m )
2 13
Figure 8.7 - Unstable modes for uniform contact stiffness distribution

Chapter Eight - Paramcric studies of the coupled pad-disc system 2 1 4
Frequency (kHz) Real part (1/s)
C ontact s tiffness (M N/m )
Figure 8.8 - Unstable modes for trailing edge biased contact stiffness distribution

Chapter Eight - Parameric studies of the coupled pad-disc system 215
8.6 Effect of The Pad Flexibilty
The effect o f pad flexibility is studied here by setting the Young's moduli o f the
pad backplate and friction material at artificially high values (205 x 109 GPa and 8 x
10 9 GPa respectively) such that there are no flexible modes within the frequency
range studied. The contact pressure distribution however is assumed to be unaffected
(i.e. leading edge biased) in order to isolate the effect o f pad flexibility.
The results shown in figure 8.9 indicate that there are only two unstable modes
for a rigid pad. These occur at 4227 Hz and 6253 - 6387 Hz with maximum real parts
o f 42 and 26 respectively. The unstable frequency o f 4227 Hz is very near to the pad
first rigid body translation (transversely) frequency whilst the second unstable
frequency is very near to the pad rotational frequency (about the pad longitudinal axis).
Comparison o f figure 8.9 with the baseline condition (figure 7.7) shows that flexibility
o f the pads is important in the generation o f instability. Rigid pads still produce
instability but with much reduced real part and within a narrower range o f contact
stiffness (less than 50 MN/m for both modes). These results suggest that rigid pads
would improve the stability o f the system. This aspect o f the results compares well
with the work o f Liles [6] and Sherif [57] where shorter pads (i.e. less flexible) were
found to improve stability. In practice, any change o f the friction material stiffness (and
possibly also o f the backplate material) may effect the contact pressure distribution.
H owever consideration o f this additional effect o f pad flexibility was not possible
within the time constraints o f the present study.

Chapter Eight - Parameric studies o f the coupled pad-disc system 216
Frequency (kHz) Real part (1/s)
Contact stiffness (MN/m)
Figure 8.9 - Unstable modes for inflexible pads

Chapter Eight - Parameric studies of the coupled pad-disc system 2 1 7
8.7 Effect of Different Disc Material
The material properties o f the disc are varied here to determine the effect o f
different disc material on the system stability. Both the density and Y oung’s modulus
are varied for each case as they are the most important from a dynamics point o f view.
The baseline properties are for the traditional grey cast disc with assumed modulus o f
E=120 GPa and density o f p -7250 kg/m ’. Three other material property sets are
considered :
i) E = 120 GPa and p=2250 kg/m-’
ii) E = 8000 GPa and p=7250 kg/nr
iii) E = 120x l03 GPa and p=7250 kg/nr
The properties for material (i) are based on that o f aluminum metal matrix composite
(Al-M MC) [83], Properties (ii) are for a hypothetical material with unrealistically high
Y oung’s modulus such that only one diametral mode (the second diametral) occurs
within the frequency range studied. Material (iii) is also hypothetical with a Y oung’s
modulus which is made so high that there are no flexible modes within the frequency
range studied in order to see whether flexible modes o f the disc are essential for
instability o f the system.
For the baseline disc properties (figure 7.7), five unstable modes can be
detected as discussed in detail in Chapter Seven. With disc material properties similar
to those o f Al-MMC, free-free modal analysis shows that diametral modes o f order up
to six exist under 12 kHz compared to eight for the baseline properties (Table 8.1).
The stability results (figure 8.10) indicate that only one unstable mode exists at a
contact stiffness o f 100 MN/m and higher with the unstable frequency beginning at 7
kHz and increasing gradually with the contact stiffness. The real part also generally
increases with the contact stiffness. These results indicate that an Al-MMC disc may
well be less prone to squeal as there are only one unstable mode compared to five for
the grey cast iron equivalent.

Chapter Eight - Parameric studies of the coupled pad-disc system 118
When the Y oung’s modulus o f the disc is increased to 8000 GPa, free-free
modal analysis o f the disc revealed the natural modes listed in Table 8.2. With only one
free-free diametral mode within the frequency range studied, the number o f unstable
modes is reduced from five to three as shown in figure 8.11, all which have frequencies
below that o f the second diametral mode. As the Y oung’s modulus o f the disc is
further increased to 120x10'’ GPa , the first mode occurs at 18473 Hz as shwon in
Table 8 .3 which is outside the frequency range o f interests ( 1 - 1 1 kHz).
Table 8 .1 - Free-free modes for the Al-MMC disc
Frequency (Hz) M ode description
1068 1 st circumferential
1287 Not diametral or
circumferential
2094 2nd diametral
3585 3rd diametral
5734 4th diametral
8517 5th diametral
11917 6th diametral
Table 8.2 - Free-free modes for the disc with E=8000 GPa
Frequency (Hz) M ode description
4769 Circumferential
5748 Circumferential
9352 2nd diametral
Table 8.3 - Free-free modes for the disc with E= 120x10’ GPa
Frequency (Hz) M ode description
18 473 Circumferential

Chapter Eight - Parameric studies of the coupled pad-disc system 219
However increasing the Y oung’s modulus further to an essentially rigid disc
does not remove the instability. As shown in figure 8.12, there are still three unstable
frequency bands o f 5680 -6609 Hz , 6975 - 7370 Hz and 8676 - 9419 Hz with
maximum real parts o f 179, 145 and 245 respectively which are significantly higher
than for the disc with E=8000 GPa. A detail study o f the mode shape for each o f these
unstable modes does not show any diametral modes o f the disc. The disc mode shape
in each case shows an upward deflection for the half o f the disc in which contact
occurs whilst the other half remains flat.
These results dem onstrate that raising the disc natural frequencies by increasing
the Y oung’s modulus is not necessarily beneficial in reducing squeal propensity. There
seems to be one band o f unstable frequency in the range 5-9 kHz which occurs for all
the disc material properties studied. It would appear that this unstable frequency band
has little relation with the disc dynamic characteristics suggesting the pad to be the
principal source o f instability in this case.

Chapter Eight - Parameric studies of the coupled pad-disc system_____ ________________________ 220
Frequency (kHz) Real part (1/s)
Contact stiffness (MN/m)
Figure 8 10- Unstable modes for aluminum metal matrix composite disc (E=120 GPa ,
p=2250 kg/m3)

Chapter Eight - Parameric studies o f the coupled pad-disc system 221
Frequency (kHz) Real part (1/s)
Contact stiffness (MN/m)
Figure 8.11 - Unstable modes for a disc with very high Young's modulus (E -8000
GPa)

Chapter Eight - Parameric studies of the coupled pad-disc system 222
Frequency (kHz) Real part (1/s)
Contact stiffness (MN/m)
Figure 8.12 - Unstable modes for an inflexible disc.

Chapter Eight - Parameric studies o f the coupled pad-disc system 223
8.7 Effect of Disc Symmetry
One suggested method to stabilise a squeal mode is to separate the doublet
modes o f the disc. The term "doublet m ode’ is used to describe diametral modes o f the
disc which have the same diametral mode order and same frequency but have a relative
phase difference o f 90 degrees in the free-free condition. The basic idea that stability
can be achieved by separating these modes is based on the fact that unstable squeal
modes occur when tw o stable modes converge at particular values o f certain
param eters (friction coefficient, contact stiffness). These two modes are usually o f the
same diametral mode order but are initially separated in frequency by the coupling
between the pad and the disc under the applied pressure. Figures 8.1 - 8.3 show clear
examples o f this convergence effect.
There are several ways o f separating the diametral modes all based on
modifying the stiffness or mass distribution around the circumference o f the rotor.
Lang et al [59] used a technique o f adding mass along the outer circumference o f a
drum brake in order to separate the doublet modes. Nishiiwaki et al [58] varied the
number o f stiffeners on a ventilated disc to achieve the same effect. For a plain disc as
assumed in this analysis, a practical way to achieve the separation o f the doublet modes
is by machining slots in the disc. In the finite element m o d e l, this can be simulated by
simply reducing the thickness o f the disc shell elements in certain areas. The slot
angular width in the model is limited to multiples o f 6 degrees as the constraint that the
disc mesh must be compatible with the pad model still applies. Obviously in practice
the width o f slots would not be limited by this constraint. In the present analysis the
number o f slots modelled is 4 , 5 , 6 , 10 and 12.The depth o f the slot in each case is
5.5mm compared with the total thickness o f the disc 10.25 mm and the slot is assumed
to be symmetrical about the disc mid-plane. The circumferential symmetry o f the disc
however must also be maintained by regularly spacing the slots in order to preserve
disc balance. The effect o f the slots therefore is primarily to reduce the infinite
symmetry o f the disc to an order o f symmetry equivalent to the number o f slots.

Chapter Eight - Paramcric studies of Ihc coupled pad-disc system 224
Table 8 >3 - Frequencies o f the free-free diametral modes for a slotted disc
Number of
slots
Frequency 2nd
diam.
mode
3rd
diam.
mode
4th
diam.
mode
5th
diam.
mode
6th
diam.
mode
7th
diam.
mode
8th
diam.
mode
0
(PLAIN)
f l (Hz)
n (Hz)
1145
1145
1961
1961
3137
3137
4659
4659
6578
6578
8708
8708
11225
11225
4 fl (Hz)
f2 (Hz)
1092
1171
1916
1916
3029
3037
4478
4478
6148
6345
8324
8324
10859
10908
5 fl (Hz)
f2 (Hz)
1125
1125
1906
1906
3008
3008
4377
4497
6181
6181
8223
8223
10560
10560
6 fl(H z)
f2(Hz)
1123
1123
1845
1937
2984
2984
4392
4392
5979
6262
8153
8153
10444
10444
10 f l (Hz)
f2 (Hz)
1112
1112
1847
1847
2879
2879
4107
4336
5867
5867
7791
7791
9875
9875
12 f l (Hz)
f2 (Hz)
1106
1106
1827
1827
2830
2830
4120
4120
5470
6006
7647
7647
9773
9773
^ The results from free-free modal analysis o f the slotted disc are shown in Table
8 X in which fl indicates the frequency o f the lower diametral mode o f the doublet
pair and f2 the frequency o f the higher mode. It is clear that the number o f slots does
alter the frequency o f the diametral modes but this effect is limited to certain modes for
which the mode diametral order is a simple multiple o f the number o f the slots. For
example the results for the disc with four slots show that the second , fourth and eighth
diametral modes are all affected (the sixth diametral mode being affected the most with
a frequency separation o f 197 Hz) whilst for five slots, it is only the fifth diametral
m ode which shows any separation. Another important trend is that increasing the
number o f slots increases the frequency separation as shown in figure 8.13. For the

Chapter Eight - Parameric studies o f the coupled pad-disc system 225
present numbers o f slots studied , the sixth diametral mode is most affected and, as the
number o f slots is increased from 6 to 12 , the frequency separation for this mode is
increased from 283 Hz to 536 Hz
In order to investigate the effect o f separated doublet modes on the system
stability , an unstable mode is selected for which the disc mode is clearly pure diametral
in that the nodal distance remains constant for the disc both in and out o f the contact
area and the coupled frequency is relatively close to that o f the free-free diametral
mode o f the disc. This unstable mode involves the disc sixth diametral mode as shown
in figure 7.20. Separation o f the sixth diametral doublet modes can be achieved with 4 ,
6 or 12 slots as indicated in figure 8.13. However, in order to reduce the problem to a
manageable size , only a disc with six slots giving a frequency separation o f 283 Hz
under free-free conditions is selected to study the effect o f mode separation on the
stability o f the system. An end view o f the finite element model o f the disc with six
slots is shown in figure 8.14 in which the slots are shown blank and the circumferential
angle is measured from the global x-axis. Equal displacement contour plots o f the sixth
diametral doublet modes for the disc model with six slots are shown in figures 8.15 and
8.16 respectively
Figure 8 .15 shows the lower o f the sixth diametral doublet modes which occurs
at a frequency o f 5979 Hz. It is clear that the x-axis in the diagram represents one o f
the node lines o f the disc. In figure 8 16 the contour plot o f the other sixth diametral
mode which occurs at a frequency o f 6263 Hz is shown and this time the x-axis
coincides with one o f the anti-node lines (marked E). It is therefore clear that the sixth
diametral doublet mode pair has now been separated in frequency terms by 284 Hz
whilst the mode shape is different only in the relative phase angle o f 90 degrees. The
lower frequency mode occurs when the anti-node is positioned over the slots in the
disc where the stiffness is lower due to the reduction in thickness whilst the higher
frequency mode occurs when the node is positioned over the slots which therefore
have a less significant effect on the frequency (the corresponding frequency for the
unslotted disc is 6578 Hz).

Chapter Eight - Parameric studies of the coupled pad-disc system 226
600
500
400
300
200
100
Frequency difference (Hz)
H 4 slots
i J 5 slots
6 slots
ill 10' slots-
12 slots
4th 5th 6th
Diametral mode order
7th 8th
Figure 8.13 - Effect o f number o f slots on the frequency difference o f the disc
diametral modes
Figure 8.14 - The finite element model o f the slotted disc showing the slot position
(blank)

Chapter Eight - Parameric studies of the coupled pad-disc system 227
modal analysis o f slo tted disc
PLOT NO. 1 NODAL SOLUTION STEP=1 SUB =9FREQ=5979 UZ TOP RSYS=0 DMX =1.684 SMN =-1.499 SMX =1.684 A =-1.322 B =-0.968702 C =-0.61495 D =-0.261198 E =0.092554 F =0.446306 G =0.800057 H =1.154 I =1.508
Figure 8.15 - Displacement contour plot o f the lower sixth diametral mode for a six
slot disc (for position o f slot refer to figure 8.14).
PLOT NO. 1 NODAL SOLUTION STEP=1 SUB =10 FREQ=6263 UZ TOP RSYS=0 DMX =1.647 SMN =-1 647 SMX =1.647 A =-1.464 B =-1098 C =-0.731896 D =-0.365948 E =0.258E-09 F =0.365948 G =0 731896 H =1098 I =1464
modal analysis o f slotted disc
Figure 8 .16 -Displacement contour plot o f the upper sixth diametral mode for a six slot
disc (for relative position o f slots refer to figure 8.14).

Chapter Eight - Parameric studies o f the coupled pad-disc system 228
As the slotted disc rotates, the position o f the disc asymmetry changes with
respect to the pad. This effect was taken into account in the stability analysis by
rotating the disc (with respect to the pads) by successive angular interval o f 6 degrees
and determining complex eigenvalues at each angular position for a contact stiffness
range o f 50 - 600 MN/m. The leading edge biased contact pressure distribution is
assumed throughout. The angle o f rotation is measured relative to the pad centreline as
shown in figure 8.14. The results for an angular position o f zero degrees (i.e. when the
axis o f one o f the slots is 30 degrees forward o f the pad centreline) as shown in figure
8.17 indicate that there are several unstable modes within the contact stiffness range
studied. Detail investigation o f the mode shape plots show that these modes involve
the sixth , seventh and eighth diametral modes o f the disc. O f these there are two
unstable modes both involving the sixth diametral disc mode which occur at different
frequencies and ranges o f contact stiffness. The low contact stiffness range mode
(referred as mode M) is unstable for contact stiffnesses o f 250 - 350 MN/m whilst the
high contact stiffness range mode (referred to as mode N) occurs for contact
stiffnesses o f 375 - 450 M N/m.The range o f contact stiffness for these two modes to
be unstable was found to vary slightly with the relative angle o f rotation. The
remaining two unstable modes involve the seventh diametral disc mode (mode O)
which occurs at a contact stiffness o f 200 MN/m and above and the eighth diametral
mode (mode P) which occurs at a contact stiffness o f 500 MN/m and above. The
contact stiffness ranges o f these two modes however were found not to vary with the
angle o f rotation.
In order to study the effect o f rotation angle on the stability o f the system, the
maximum real part for modes M and N throughout the unstable contact stiffness range
is plotted against the angle o f rotation in figure 8 .18a whilst for modes O and P the
corresponding values at a contact stiffness o f 550 MN/m are shown in figure 8 .18b. In
both cases the range o f angle o f rotation shown is only from 0 - 6 0 degrees as the cycle
repeats itself every 60 degrees o f rotation. For modes M and N (figure 8.18a) which
involve the sixth diametral modes o f the disc the real part varies greatly with the
rotation angle. For mode M which involves the lower frequency sixth diametral mode
the maximum real part peaks at relative angular positions o f 0 , 30 and 60 degrees
whilst for mode N which involves the higher frequency sixth diametral mode the

Chapter Eight - Parameric studies of the coupled pad-disc system 229
maximum real part peaks at angular positions o f 18 and 48 degrees. Furthermore the
peak positions for mode M coincide with the trough positions for mode N. This
variation in real part indicates cyclic instability for each o f these mode as the disc
rotates.
For modes O and P the results (figure 8.18b) show little variation o f the real
part ( ± 8) with the angle o f rotation. Detail studies o f the disc contour plots show
that the nodal spacing is not uniform particularly for the disc contact area under the
pads.
The above results show that limiting the symmetry o f the disc is only effective
for certain modes, in particular those modes for which the disc diametral deformation
coincides with the symmetry o f the slotted disc (in this case the sixth diametral mode).
For unstable modes which involve the disc seventh and eight diametral modes the
effect is minimal. Thus it can be said that the strategy o f separating a disc doublet
mode o f a certain diametral order is effective for reducing squeal propensity involving
that same diametral mode order only. In the present case it is also interesting to note
that the real part for the unstable mode involving the disc sixth diametral mode (mode
M ) reduces to zero (i.e. completely stable) at certain angles o f disc rotation. However,
for the mode in the higher contact stiffness range (mode N), the real part only reduces
to a minimum o f 15. This suggests further that the separation o f the doublet modes is
more effective for low applied pressures.

Chapter Eight - Parameric studies o f the coupled pad-disc system 230
Frequency (kHz) Real part (1/s)
C ontact s tiffness (MN/m)
Figure 8.17 - Unstable modes evolution for zero angle o f relative rotation

Chapter Eight - Parameric studies o f the coupled pad-disc system 231
Real part (1/s)
Rotation angle (degrees)
Figure 8 .18a - Variation o f maximum real part o f mode M and N with relative angle o f
rotation.
Real part (1/s)
Rotation angle (degrees)
Figure 8 .18b - Variation o f maximum real part o f mode O and P with relative angle o f
rotation.

Chapter Eight - Parameric studies o f the coupled pad-disc system 232
8.9 Discussion
The parametric studies described above have shown several important trends.
The study on the effect o f friction coefficient (section 8.3) has shown that there is a
critical friction coefficient to initiate instability the value o f which is mode dependant.
The minimum critical coefficient o f friction for the instability with the present
configuration is 0.35. Increasing the friction coefficient has the effect o f increasing the
magnitude o f the real part which can be interpreted as an increase in squeal propensity.
A similar effect was reported by Liles [6],
The abutment stiffness (section 8.4) does not have a great effect on the system
stability except when the stiffness is about one order o f magnitude larger than the pad-
disc contact stiffness in which case the tendency is to make the unstable contact
stiffness range narrower and to cause certain modes to become unstable at a lower
value o f contact stiffness (e.g. mode F). Another effect o f increasing abutment stiffness
is to increase the magnitude o f the real part o f the unstable modes. All these effects are
however mode specific.
The pad-disc contact stiffness distribution (section 8.5) greatly affects the
stability o f the system by varying the contact stiffness range over which a mode
becomes unstable and by changing the magnitude of the real part o f the complex
eigenvalue. A uniform stiffness distribution is the most unstable whilst a trailing edge
biased distribution is the least unstable
Making the pad inflexible within the frequency range studied (section 8.6)
causes the magnitude o f the real part o f the unstable modes to be very much reduced (a
maximum real part o f 42) and a very narrow unstable contact stiffness range o f 100
MN/m or less. A rigid pad therefore significantly improves the system stability.
Varying the properties o f the disc (section 8 .7) changes the natural frequencies
o f the disc and the stability behaviour. For a disc having properties similar to Al-MMC,
there is only one unstable mode with the real part in general increasing with the contact
stiffness. With an artificially high Y oung’s modulus in which the flexible modes o f the
Chapter Eight - Parameric studies o f the couplcd pad-disc system 233
disc (under 11 kHz) are limited to the second diametral mode, instability still occurs
within frequency ranges o f 5.5 - 6.5 kHz and 8 -9 kHz. For a disc with no flexible
modes at all (i.e. a rigid disc), the coupled system remains unstable within the same
frequency range and the eigenvector plots show that the pads have similar displaced
shape in both cases. This aspect o f the results supports the prediction o f Hulten [49]
that instability still occurs even when the pad is pressed against a rigid surface.
Reducing the symmetry o f the disc by machining six equispaced slots and
thereby separating the sixth diametral mode pair by 283 Hz under free-free conditions
(section 8.8) produces cyclic instability for unstable modes in which the sixth diametral
mode o f the disc is involved. Other modes however are not affected. This result
com pares well with the experimental observation o f Lang et al [59] that modifying the
symmetry o f a drum brake rotor by adding mass caused cyclic squeal. M oreover
Niishiwaki [58] showed that separating the diametral mode pair is only effective under
low applied pressures. This is confirmed by the present analysis in which the stability o f
the low contact stiffness unstable mode is more greatly improved with the real part
reducing to zero during the cycle whilst the real part for the high contact stiffness
unstable mode only reduces to a minimum o f 15.
The results from the current modelling approach show that instability o f the
coupled system consists o f several unstable modes. Studies in which the disc properties
were varied (section 8.7 and 8.8) show that the influence o f the disc is limited to
certain modes only which are characterised by a relatively uniform nodal spacing.
These results confirm the hypothesis advanced in Chapter Seven that unstable modes in
which the disc diametral mode is no longer pure (in the sense that the nodal spacing is
no longer uniform) will not be affected by changes to the disc. This therefore excludes
any unstable modes occurring at high contact stiffness (i.e. high pressure application)
as such modes are greatly affected by the strong coupling between the pads and the
disc. Indeed all the changes to the disc considered above only affect unstable modes
which can in terms o f frequency be related to modes D , E and F (o f the baseline case)
whilst the unstable modes with frequency range between 7-9 kHz (i.e. mode C) remain
relatively unchanged.

Chapter Eight - Parameric studies of the coupled pad-disc system 234
These results suggest that much o f the instability can be traced to the pad as
also suggested by the fact that when param eters directly linked to the pad (abutment
stiffness, support stiffness, contact pressure distribution , pad flexibility) are varied, the
stability o f the system is greatly affected. Therefore the present parametric studies are
similar to the experimental results o f Lewis and Shah [54] which showed that the
natural frequencies o f the pad clamped under pressure to the complete disc and those
when it is clamped to a portion o f the disc only were both close to the squeal
frequency.This therefore largely excludes the disc from the instability process. Indeed
the present analysis for an inflexible pad gave a much reduced magnitude for the real
part o f the complex eigenvalues which suggests that stability o f the system can be
improved by moving to a stiffer pad.
In the results discussed above, instabilities can be linked to both the pad and
disc depending on the unstable modes considered. This aspect o f the results explains
and supports both arguments as to the cause o f the disc brake instability. On the one
hand many researchers have argued that instability is caused by the coalescence o f disc
diametral modes [48,58,59,60] with the resulting suggestion that stability can be
achieved by separating these mode pairs. At the other extreme o f opinion, it is shown
that a model in which the disc is represented as a rigid surface can still generate
instability [49] and therefore the proponents suggest that modifying the pad will
improve stability. This latter hypothesis is supported by the experimental work o f
Lewis and Shah [54] in which the stability was improved by adding mass to the pad
Both ideas as to the origin o f instability are therefore supported by experimental
evidence and also now by the results from the present analysis. Some unstable modes
are indeed caused by the diametral mode pairs o f the disc converging and the analysis
showed that changing the disc modulus (and thus the disc natural frequencies) can
reduce the instability. Also separating the diametral mode pair o f concern by
destroying the axial symmetry produces cyclic instability. However there are other
unstable modes which are insensitive to the disc parameters and the analysis shows
that even with a rigid disc instabilities can still occur. Furthermore these instabilities
w ere shown to be sensitive to modification o f the pad only. It is therefore imperative
that instability be explained from both points o f view thus allowing for modification o f
both the pad and disc in order to achieve better stability. Any generalisation that squeal

Chapter Eight - Parameric studies o f the coupled pad-disc system 235
can be eliminated or reduced by carrying out modifications exclusively to one or other
o f the com ponents must be treated with caution.
The results also further highlight the many parameters affecting squeal. For
example it is likely that the effect o f pad wear is to make the contact pressure
distribution at the pad-disc interface more uniform such that the system becomes less
stable and more prone to squeal. The many and various parameters affecting the
stability o f the system could well explain the fugitive nature o f squeal. By taking
account o f all these parameters, the problem o f squeal could be made more
deterministic than at present but a limitation would be the enormous size and
complexity o f the required analysis.
At the present state o f knowledge, it is suggested that an approach to reduce
squeal propensity at the design stage using the finite element method should consist o f
the following stages:
1) From stability analysis using complex eigenvalues, the unstable modes which occur
over a wide range o f interface contact stiffness and have a relatively large positive real
part should be targeted.
2) Detailed analysis o f the disc diametral modes involved will reveal whether any
particular unstable mode can be stabilised by carrying out changes to the disc in terms
o f its natural frequencies or limiting its symmetry thus separating the diametral mode
pairs.
3) The effectiveness o f (2) can be confirmed by varying the disc properties. Persistent
instability with near constant unstable frequency range would indicate that the pad
should be targeted.
4) If the pad is indeed responsible for the instability, parameter changes to the pad
affecting the natural frequencies or contact pressure distribution will improve the
stability o f the system. A stiff pad has been shown to encourage stability in the present
study.

C H A P T E R NINE
CONCLUSIONS AND RECOMMENDATION
Page 236
9.1 Conclusions
These can be summarised as follows:
(i) Careful consideration o f the available literature has indicated that a complex
eigenvalue approach together with an accurate finite element representation o f the
coupled pad-disc system offers a potential means o f predicting disc brake squeal taking
full account o f the flexibilities o f the major components and their interaction at the
friction interface. To yield the unsymmetric stiffness matrix necessary for complex
eigenvalue analysis to be meaningful, the interface contact model must involve the
effect o f circumferential friction. To account for the effect o f varying brake applied
pressure, a relationship between applied pressure and interface contact stiffness is
required.

Chapter Nine - Conclusions and Recommendations 237
(ii) Finite element models o f the pad and disc for a typical disc brake installation have
been developed. Free-free modal analysis has shown that both these finite element
models are adequate to describe the dynamic properties o f the components with a
maximum frequency difference from experimental results o f 10%.
(ii) A non-linear contact pressure analysis o f the pad pressed against a rigid surface has
shown that contact is partial but that the contact reaction force at the pad interface
varies linearly with the applied pressure because the contact area does not change.
Introduction o f friction due to circumferential sliding causes the contact pressure
distribution to become asymmetric with the distribution biased tow ards the leading
edge for both the piston and paw applied pressure cases. This is manifested in
increased contact reaction force at the leading edge and lifting o f the trailing edge o f
the pad. The abutment arrangement (leading, trailing and combined) has only a small
effect on the distribution pattern and the magnitude o f the contact reaction force at any
position is changed by less than 4%. A softer friction material causes a larger contact
area and a more uniform pressure distribution.
(iii) The interface contact stiffness between the pad and the disc has been calculated
using a random process approach, the results o f which show a linear relationship
between contact stiffness and applied pressure. The contact stiffness calculated using
this approach is most sensitive to the measured disc surface roughness whilst the effect
o f pad surface roughness is negligible. This is due to the relatively large pad mean
asperity radius (thirty times larger than the disc mean asperity radius) calculated using
the measured pad surface profile data. Therefore the pad surface roughness can be
ignored in the contact stiffness calculation and the pad surface can safely be assumed
to be flat. On the other hand , the Y oung’s modulus o f the friction material is so much
lower than that o f the disc that the latter can be effectively regarded as rigid in the
calculations.
(iv) A stability analysis o f the coupled pad-disc system using complex eigenvalues
identifies a minimum contact stiffness for instability to occur, the value o f which is
mode specific. Instability occurs as the frequencies o f two different modes converge at

Chapter Nine - Conclusions and Recommendations 238
a critical contact stiffness value; one mode then becomes very stable with a large
negative real part whilst the other is very unstable with a relatively large positive real
part. The instability continues until a certain maximum contact stiffness at which point
the tw o modes diverge to be at different frequencies with the real part reducing to zero
or less in both cases.
(v) The effect o f increasing the external support stiffness Ks on the pad backplate is to
stabilise the system in terms o f reducing the number o f unstable modes and the
magnitude o f the positive real part.
(vi) Arising from (iv) and (v) , the effect o f brake applied pressure on squeal can be
explained by the fact that at low pressures there is a certain range o f contact stiffness
(translated in practice as a range of line pressure) within which unstable modes occur.
Increasing the contact stiffness beyond this range causes the instability o f these
particular modes to cease with other unstable modes emerging. However a parallel
increase in the external support stiffness as a result o f the increasing pressure tends to
suppress these new instabilities. This therefore explains why squeal tends to occur at
low applied pressures.
(vii) The trends from the analysis match those from the experiment in terms o f
frequency and mode shapes o f unstable modes and the pressure range over which they
occur. This correlation validates the approach used in the present work for squeal
analysis
(viii) The magnitude o f the real part o f an unstable mode is directly related to the phase
difference between the pad and the disc motions. The maximum real part occurs when
the phase difference approaches 180° . Instability ceases when the phase difference is
zero.
(ix) Instability occurs above a critical friction coefficient, the value o f which is mode
specific. For the baseline conditions studied (Kc =250 MN/m and Ks =24 MN/m), the

Chapter Nine - Conclusions and Recommendations 239
critical coefficient o f friction is 0.35 . Instability increases with increasing friction
coefficient beyond this value.
(x) A contact pressure distribution at the pad-disc interface which is uniform is most
unstable and a distribution pattern biased towards the trailing edge o f the pad is least
unstable. The actual contact pressure distribution predicted by the finite element
analysis is leading edge biased which gives intermediate instability.
(xi) Instability o f the coupled pad-disc system is not very sensitive to the abutment
stiffness. Only when the magnitude o f the abutment stiffness is one order higher that
the pad-disc contact stiffness is the stability affected , increasing the real part but
reducing the range o f contact stiffness over which instability occurs.
(xii) An inflexible pad reduces the system instability. This suggests that a short ,stiff
pad would be less prone to squeal.
(xiii) Variation o f the disc Y oung’s modulus affects the number o f unstable modes.
However, even with an effectively rigid disc, instability still occurs. For all values o f
disc Y oung’s modulus studied , instability occurs within the 7- 9 kHz range. This
suggests that the pad is mostly responsible for the instability within this frequency
range.
(xiv) Reducing the disc symmetry to lie on six diametral axes by introducing six
equispaced slots in the disc surface only affects instability involving the sixth diametral
mode o f the disc. As the modified disc rotates , the real part fluctuates with the angle
o f rotation. This in practice can be related to cyclic squeal which has been shown to
occur for a modified drum rotor with mass added to limit the axial symmetry.
(xv) The results suggest that instability can be explained by both the effect o f disc
doublet modes and pad instability depending on the mode. Unstable disc diametral
modes with relatively uniform nodal spacing around the disc circumference can be
stabilised by limiting the symmetry o f the disc. This can be achieved practically by

Chapter Nine - Conclusions and Recommendations 240
machining slots in a plain disc or by a systematic arrangement o f stiffeners in a
ventilated disc. Unstable modes involving non-uniform nodal spacing in the disc are
not affected by limiting the disc symmetry. Modification o f the pad is the most
effective strategy to stabilise these modes.
(xvi) The approach outlined in this thesis therefore unifies the tw o schools o f thought
on the origin o f instability in a disc brake system. The results also suggest methods by
which squeal can be systematically reduced at the design stage by targeting the most
appropriate component as outlined in (xv) above.
9.2 Recommendations for Future Work
The following suggestions are made for future work :
(i) The present w ork does not take into account the effect o f damping. Damping is one
o f the most important factors influencing stability o f any system. Future work therefore
should take this into account.
(ii) Inclusion o f a caliper model will make the present approach more complete and
enabled the effect o f support stiffness to be more accurately modelled. A coupled
caliper-pad-disc system may further enable the instability arising at lower frequency
such as judder to be combined with the high frequency squeal as studied in the present
work.
(iii) The present model assumes a variable friction force in direct proportion to the
variable normal force based on Am onton’s Law. Implementation o f the Oden-Martin
friction model might provide a more complete and realistic representation o f friction.

Page 241
References
1. Crolla, D A. and Lang, A.M. “Brake Noise and Vibration - The State o f the Art” ,
Vehicle Tribology , Leeds-Lyon 17, Tribology Series 18, (Dowson, D. ; Taylor, C M.
and Godet, M. , ed.) Elsevier Science Pub., Sept. 1991, pp. 165 -174.
2. ‘Case For Support” Internal Report o f Mechanical Engineering Department , Leeds
University, Sept. 1990.
3. ‘W HICH? CAR-Guide to New and Used Cars 1995’,Consumer Association,
London 1995.
4. ‘Lexus Brake Squeal Problem and Prevention o f Recurrence’ , Lecture given by
personnel o f Toyota M otor Corporation (Europe) Ltd. at the Mechanical Engineering
D epartm en t,Leeds University, 30th o f December 1993.
5. Smales, H “Friction M aterials - Black Art or Science” , Proc. I.Mech.E. ,Vol. 209,
No. D3 , Part D : Journal o f Automotive Engineering, 1995, pp. 151 -157.
6. Liles , G.D. “Analysis o f Disc Brake Squeal Using Finite Element M ethod” , SAE
Paper 891150.
7. Murakami, H.; Tsunada, N.;Kitamura, M. “A Study Concerned With Mechanism o f
Disc brake Squeal”, SAE Paper 841233.
8. Oden, J.T. and Martins, J.A.C. “Models and Computational M ethods for Dynamic
Friction Phenomena”, Computational M ethod in Applied Mechanics and Engineering.,
Vol. 52 , 1985 , pp.527 -634 .
9. ANSYS U ser’s Manual , Revision 5.0A (Vol I-IV), Swanson Analysis Inc.,
Houston, USA, 1992.

References 242
10. Fieldhouse, J.D. and Newcomb, T.P. “An Investigation Into Disc Brake Squeal
Using Hologrpahic Interferom etry”, 3rd In t’l EAEC Conference on Vehicle Dynamics
and Powertrain Engineering - EAEC Paper No. 91084, Strasbourg , June 1991
11 ABAQUS U ser’s Manual (Vol. I-IV) , Hibbit, Karlsson and Sorenson
Inc.,P aw tu ck e t,USA, 1993.
12. Lang, A.M. and Smales, H. “An Approach to the Solution o f Disc Brake Vibration
Problems” , Proc. I. Mech. E. Conf. on “Braking o f Road Vehicles”, Paper C37/83
Loughborough, 1983.
13. Lamarque, P.V. “Brake Squeak: The Experience o f Manufacturers and Operators:
Report No. 8500B” Inst. Auto. Engrs. Research and Standardisation Comittee 1935.
14. Fosberry, R A C. and Holubecki, Z. “An Investigation o f the Causes and Nature o f
Brake Squeal” , MIRA Report 1955/2.
15. Fosberry, R A C . and Holubecki, Z. “ Some Experiments on the Prevention o f
Brake Squeal” , M IRA Report 1957/1.
16. Fosberry, R.A.C. and Holubecki, Z. “Third Report on Squeal o f Drum Brakes" ,
M IRA Report 1957/3.
17. Fosberry, R.A.C. and Holubecki, Z. “Disc Brake Squeal : Its Mechanism and
Suppression” , MIRA Report 1961/2.
18. Sinclair, D. “Frictional Vibrations” , Journal o f Applied Mechanics , 1955 , pp 207
-214.
19. Basford, P R. and Twiss, S B. “Properties o f Friction Materials. I - Experiments on
Variables Affecting Noise: II- Theory o f Vibrations in Brakes”, Trans. ASME, 1958,
Vol. 80 pp. 402-406 and pp. 407-410.

References 243
20. W agenfuhrer, H. “Bremsgerausche” (Noises from Brakes), A.T.Z Augusts 1964,
Vol. 6 6 , No. 8 , pp. 217 - 222.
21. Spurr, R.T. “A Theory o f Brake Squeal”, I.Mech. E. Auto Div. Proc. No. 1,
1961/62, pp. 33-40.
22. Lienkewicz, W. “The Sliding Friction Process - Effect o f External Vibrations” ,
W ear, Vol. 13, 1969 , pp. 99-108.
23. Ko, P.L. & Brockeley, C.A. “The Measurement o f Friction and Friction-Induced
Vibration”, Journal o f Lubrication Technology , Trans. ASME , Vol. 92 , 1970 , pp
543 -549.
24. Aronov, V. ; A.F. , D ’Souza ; Kalpakijan, S. and Shareef, I. “Experimental
Investigation o f the Effect o f System Rigidity on W ear and Friction-Induced
Vibrations” , Journal o fT rib o lo g y , Trans. ASME , Vol. 105 , 1983 , pp. 206 -21 1
25. Soom, A. and Kim, C. “Interactions Between Dynamic Normal and Frictional
Forces During Unlubricated Sliding”, Journal o f Lubrication Technology, Trans.
ASME , Vol. 105 , April 1983, pp. 221-229.
26. Soom, A. and Kim, C. “Roughness-Induced Dynamic Loading at Dry and
Boundary-Lubricated Sliding Contacts”, Journal o f Lubrication Technology, Trans.
ASME , Vol. 105 , October 1983 , pp. 514-517
27. Dweib, A.H. and D ’Souza, A.F. “Self-Excited Vibrations Induced by Dry Friction,
Part 1 - Experimental Study” , Journal o f Sound and Vibration, Vol. 137 (2), 1990 ,
pp. 163 -175.

References
28. D ’Souza, A.F. and Dweib, A H. “ Self-Excited Vibrations Induced by Dry Friction,
Part 2 : Stability and Limit Cycle Analysis” , Journal o f Sound and Vibration, Vol. 137
(2), 1990 , pp. 177-190.
29. Yokoi, M. and Nakai, M. “A Fundamental Study on Frictional Noise (1st Report,
The generating mechanism o f rubbing noise and squeal noise)”, Bulletin o f JSME ,
Vol.22, No. 173, November 1979, pp. 1665-1671.
30. Yokoi, M. and Nakai, M. “A Fundamental Study on Frictional Noise (2nd Report,
The generating mechanism o f squeal noise o f higher modes)”, Bulletin o f JSME ,
Vol.23, No. 186, December 1980 , pp. 2118-2124.
31. Yokoi, M. and Nakai, M. “A Fundamental Study on Frictional Noise (3rd Report,
The influence o f periodic surface roughness on frictional noise)”, Bulletin o f JSME ,
Vol. 24, No. 194, Augusts 1981 , pp. 1470 -1476.
32. Yokoi, M. and Nakai, M. “A Fundamental Study on Frictional Noise (4th Report,
The influence o f angle o f inclination o f the rod on frictional noise)” , Bulletin o f JSME ,
Vol.24 , No. 194, Augusts 1981 , pp. 1477 - 1483.
33. Tworzydlo, W.W , Becker, E.E. and Oden, J.T. “Numerical Modelling o f Friction-
Induced Vibrations and Dynamic Instabilities”, Friction-Induced Vibration, Chatter,
Squeal and Chaos , (Ibrahim , R.A. and Soom, A. e d .) , ASME Pub. 1992 . pp 87-97.
34. Swayze, J.L. and Akay, H. “Stability o f Friction-Induced Vibrations in Multi-
Degree-of-Freedom System” , Friction-Induced Vibration, Chatter, Squeal and Chaos ,
(Ibrahim , R.A. and Soom, A. e d .) , ASME Pub. 1992 , pp. 49 -56.
35. Jarvis, R.P and Mills, B “Vibrations Induced by Dry Friction”, Proc. I Mech E.,
Vol. 178 , Pt. 1 No. 32 1963/54 , pp. 847 -857.
36. Hales F.D. Communications in Reference [35]

References 245
37. Earles, S.W.E. and Soar, G.B. “ Squeal Noise in Disc Brakes”, Paper C l00/71,
Proc. I. Mech. E. Conf. on “Vibration and Noise in M otor Vehicles”, 1971 , pp. 61-69.
38. Earles, S.W.E. and Soar, G.B. “A Vibrational Analysis o f a Pin-Disc System with
Particular Reference to Squeal Noise in Disc Brakes”, Stress, Vibration and Noise
Analysis In Vehicles (Gibbss, G.H. and Richards, T.H. ed.) , Applied Science Pub.,
L ondon , 1975 pp 237 -251.
39. Earles, S.W.E. and Lee, C.K. “Instabilities Arising From the Frictional Interaction
o f a Pin-Disk System Resulting in Noise Generation”, Journal o f Engineering for
Industry , Trans. ASME , Feb. 1976 , pp 81 - 86.
40. Earles, S.W.E. and Badi, M.N.M. “Oscillatory Instabilities Generated In A Double-
Pin and Disc Undamped System : A Mechanism o f Disc Brake Squeal”, Proc.
I.M ech.E. , Vol. 198C , No. 4 ,1984 pp 43 -50.
41. North, M R. “Frictionally Induced Self Excited Vibrations in a Disc Brake System"
PhD Thesis , Loughborough University, 1972.
42. Millner, N. “An Analysis o f Disc Brake Squeal”, SAE Paper 780332.
43 Brooks, P C. ;Crolla, D.A.;Lang , A.M.; Schafer, D R “Eigenvalue Sensitivity
Analysis Applied To Disc Brake Squeal” Proc. I. Mech. E. Conf. on “Braking o f Road
Vehicles”, Paper C444/04/93 London 1993.
44. Berndt, P.J. and Schweiger, W. “Experimental and Theoretical Investigation o f
Brake Squeal Qith Disc Brakes Installed In Rail Vehicles”, Wear , Vol. 113 ,1986
pp 131 -142.

References 246
45. Ghesquire, H. and Castel, L. “High Frequency Vibration Coupling Between An
Automobile Brake-Disc and Pads” , Proc. I.Mech.E. Conf. ‘Autotech 1991’ ,
I.Mech.E. Congress Seminar Paper C /472/11/021.
46. Ghesquire, H. and Castel, L. “Brake Squeal Noise Analysis and Prediction" , Proc.
I.Mech.E. Conf. ‘A utotech 1992’ Paper C389/257.
47. Lee , A.C. “Study o f Disc Brake Noise Using Multibody Mechanism With Friction
Interface” , Friction-Induced Vibration, Chatter, Squeal and Chaos , (Ibrahim , R A.
and Soom, A. ed ) ,ASM E 1992, pp99-105.
48 M ottershead, J.E. and Chan,S.N. “Brake Squeal - An Analysis o f Symmetry and
Flutter Instability” , Friction-Induced Vibration, Chatter, Squeal and Chaos , (Ibrahim ,
R.A. and Soom, A. ed ) ,ASME Pub. 1992 , pp87-97
49. Hulten , J. “Brake Squeal - A Self-Exciting Mechanism With Constant Friction" ,
Paper presented at SAE Truck and Bus Meeting, Detroit USA, November 1993.
50. Niishiwaki, M “Generalized Theory o f Brake Noise” , Proc. I.Mech.E. ,Vol. 207,
Part D : Journal o f Automotive Engineering, 1993, pp. 195- 202.
51 Bracken, W.J. and Sakioka, J.K. “A M ethof For The Quantification o f Disc Brake
Squeal” , SAE Paper 820037.
52. Tarter, J.H. “Disc Brake Squeal” , SAE Paper 830530.
53. Schwartz, H.W.; Hays ,W.D. and Tarter , J.H. “A Systematic Approach To The
Analysis o f Brake Noise” , SAE Paper 850990.
54. Lewis, T.M. and Shah, P. “Analysis and Control o f Brake Noise” , SAE Paper
872240.

References 247
55. Hoffman , C.T. “Damper Design and Development for Use on Disc Brake Shoe
and Lining Assemblies” , SAE Paper 880254.
56,Sherif , H.A.;Blouet, J.;Cretegny, J.F.;Gras, R. and Vialard, S. “Experimental
Investigation o f Self-Excited Squeal”, SAE Paper 892451.
57. Sherif, H.A. “On the Design o f Anti-Squeal Friction Pads for Disc Brakes”, SAE
Paper 910575.
58. Niishiwaki, M .;Harada. H.;Okamura, H. and Ikeuchi,T. “Study on Disc Brake
Squeal” , SAE Paper 890864.
59. Lang, A.M. ; Schafer, D.R.;Newcomb, T.P. and Brooks, P C. “Brake Squeal - the
Influence o f R otor Geometry” , Proc. I. Mech. E. Conf. on “Braking o f Road
Vehicles”, Paper C 444/016/93, London 1993.
60. Kim , S.Y. “ S-Cam Brake Noise and Vibration Analysis” Lecture in Mechanical
Engineering Dept. , Bradford University, 1993.
61. Felske, A. and Happe, A. “Vibration Analysis by Double Pulsed Laser
Holography”, SAE Paper 770030.
62. Felske, A. ; Hoppe, G. and Matthai, H. “Oscillations in Squealing Disk Brakes -
Analysis o f Vibration M odes by Holographic Interferometry” , SAE Paper 780333.
63. Felske, A. ; Hoppe, G. and Matthai, H. “A Study on Drum Brake Noise by
Holographic Vibration ANalysis” , SAE Paper 800221.
64. Fieldhouse, J.D. and Newcomb, T.P. “An Experimental Investigation Into Disc
Brake Noise” , Proc. I. Mech E. Conf. on “Braking o f Road Vehicles”, Paper
C 444/016/93 London 1993.

References 248
65. Harding, P.R.J. and Wintle, B.J. “Flexural Effects in Disc Brake Pads” , Proc
I.M ech.E. ,Vol. 192 , Automobile Division, 1978 , pp. 1 - 7.
66. Tirovic, M. and Day, A.J. “Disc Brake Interface Pressure Distribution” , Proc.
I.Mech.E. ,Vol. 205, Part D : J o.Auto. Engrg. 1991 , pp. 137 - 146.
67. Day, A.J. ; Tirovic, M. and Newcomb, T.P. “Thermal effects and Pressure
Distributions in Brakes” , Proc. I.Mech.E. ,Vol. 205, Part D : J o. Auto. Engrg. ,1991 ,
pp. 199- 205.
68. Rendle, S. “Ford Sierra Owners W orkshop M anual” , Haynes Pub., 1994 , pp
216-243.
69. Tumbrink, H.J. “M easurement o f Load Distribution on Disc Brake Pads and
Optimization o f Disc Brakes Using the Ball Pressure M ethod” , SAE Paper 890863.
70. Kuo, B.C. “Automatic Control System” , Prentice-Hall Inc. , 1982 , pp. 362 -372.
71. Wilkinson, J.H. “The Algebraic Eigenvalue Problem” , Clarendon Press, Oxford ,
1966 , pp 30 -38.
72. Kikuchi, N. “Finite Element M ethods in Mechanics” , Cambridge University Press,
1986 , pp. 1 -22.
73. Chandrupatla, T.R. and Belegundu, A D. “Introduction to Finite Elements in
Engineering” , Prentice-Hall Int’l , 1991 , pp. 1-44.
74. Den Hartog “Mechanical Vibrations”, M cGraw Hill, 1956 , pp 90-101.
75. Guyan, R.J. “Reduction o f Stiffness and Mass M atrices” , AIAA Journal , Vol. 3 ,
No. 2 , Feb. 1965 , pp. 380.

References 249
76. Ragulskis, K. and Yurkauskas “Vibration o f bearings” , Hemisphere Pub. , New
Y o rk , 1989, pp. 102 -104.
77. Greenwood, J.A. and Williamson, J.B.P. “Contact o f Nominally Flat Surfaces”,
Proc. o f the Royal Society, Vol. A295 , 1966 , pp. 300-3 19.
78. Greenwood, J.A. and Tripp, J.H. “The Contact o f Two Nominally Flat Rough
Surfaces”, Proc. I.Mech.E. ,V ol.l85, 1971, pp. 625-633.
79. Nayak, P.R. “Random Process Model o f Rough Surfaces”, J o. Lubrication
Technology, Trans. ASME, Series F, Vol. 93, No. 3, July 1971, pp. 398 -407.
80. Thomas, T.R. and Sayles, R.S. “Stiffness o f Machine Tool Joints. A Random
Process A pproach” Journal o f Engineering for Industry, Trans. ASME, Series F, Vol
99B, Feb. 1977, pp. 250 - 256.
81. Hailing, J. “Principles o f Tribology”, MacMillan Press Ltd. , 1975 , pp. 16-38.
82. Newland, D.E. “Mechanical Vibration Analysis and Computation” , Longman
Scientific & Technical Pub., 1989 p p .122-176.
83.Grieve, D.G. “The Design and Performance o f Automotive Brakes in Advanced
Composites : DTI-Link Structural Composites Project” Quarterly Progress Report ,
Mechanical Engineering D epartm ent, Leeds University , June 1995.

Page 250
APPENDIX I
Programme Listings for the Calculation of Contact Stiffness Using The Random
Process Approach In C++
^include <stdio.h>#include <math.h>#include <float.h>
/* comment : declaration o f the parameters used in the calculation*//* comment : rms - roughness mm, a - autocorrelation decay constant ,*//* comment : e - modulus MPa, g - poisson ratio , r - effective radius o f asperity mm*/ /* comment : y -yield strength MPa*//* comment : 1 - friction m ateria l, 2 - disc */
double pie,rms 1 ,rms2,a 1 ,a2,e,e 1 ,e2,g 1 ,g2,r 1 ,r2,r; double pI,p2,xl,y01,y2,xr,xm ,left,right,del,mid,aut[l 1]; double stdl,std2,sigl,sig2,sig31,sig32,cl,c2,w ,w i,sigtl,sigt2; double area ,d l,d2 ,t,ratf,sq ,s[l I],sig3_pl,sig3_p2;
int i,l;double logauto;
main(){pie=3 141593,rms 1=51 78e-3;rm s2=l 1.384e-3;a l =0 .081;a2=0.057;e=0.;el=8 .e3 ;gl= 0.25;e2=120e3;g2=0.25;y01=20.00;y2=345.0;P1 =0.; p2=0.; del=5.; d l= 0 .; d2=0.; xl=0.; xr=0.5; xm=0.;

Appendix I 251
left=0.; right=0.; mid=0.5; t= 0 .9558139; std 1=2681.46; std2=l 29.60;
/* comment : to calculate effective modulus */
e= 1 /((1 -g 1 *g 1 )/e 1 + (l-g2*g2)/e2); printf("neff :% 5.2f',e); getch();
/* Calculation o f pad friction material surfaces *//* to calculate sigma 1 by iteration no 1 */
p l= (l/(2*pie))*(y01/(e*al *rm sl))*(y01/(e*al *rm sl));del=5.;xl=pl-del;xr=pl+del;
/* while((xr-xl)>0.0001 && m id>0.000001) */ for(i=0; i<=100; i++)/\left=xl-atan(xl)-p 1; right=xr-atan(xr)-p 1; xm=(xr*left - xl*right)/(left - right); mid=xm - atan(xm) -p 1; if(left*mid < 0.) xr=xm;if(left*mid > 0.) xl=xm;
sig 1 =xm ;printf("\npl :% 2.8f',p l ); printf("\nleft :% 2.8f',left); printf("\nsigmal :% 2.5f',sig l);}
sig31 =sig 1 * sig 1 * sig 1 /3 ;
sig3_pl=sig3 1 - p i;sq= sqrt((sig31 - p i)); printf("\nsig3_p 1 :% 4.4f',sig3_p 1); printf("\nsigma3 :% 3.6f',sq); getch();
/* Calculation o f asperity radius o f the friction material surface*/

Appendix I 252
rl= l./(3 .* a l* a l* rm sl* sq rt((s ig 3 _ p l ))); printf("\nrl :% 3 .4 f',rl);
/* Calculation o f disc surface properties *//* to calculate sigma2 by iteration no.2 *//* sigma = asperity density */
p2=(l/(2*pie))*(y2/(e*a2*rm s2))*(y2/(e*a2*rm s2));del=5.;xl=p2-del;xr=p2+del;
/* while((xr-xl)>0.0001 && mid>0.000001) */for(i=0; i<=10; i++)ixleft=xl-atan(xl)-p2;right=xr-atan(xr)-p2;xm=(xr*left - xl*right)/(left - right);mid=xm - atan(xm) -p2;if(left*mid < 0.)xr=xm;if(left*mid > 0.) xl=xm; sig2=xm ;printf("\np2 :% 2 .8 f ',p 2 ); printf("\nleft :% 2.8f',left); printf("\nsigma :% 2.5f',sig2);}
sig3 2=(sig2 * sig2 * sig2)/3; d l= ((a l*al)/(6*p ie*sqrt(3 ))) *
(sig31 - p i ) / p i ; d2=((a2*a2)/(6*pie*sqrt(3))) *
(sig32 - p2) /p2 ; area=3212.0; sig3_p2=sig32 - p2; sq= sqrt((sig32 - p2)); printf("\nsig3_p2 :% 4.4f',sig3_p2); printf("\nsigma3 :% 3.6f',sq); getch();
/^Calculation o f the asperity radius o f the disc*/
r2= l ,/(3.*a2*a2*rms2*sqrt((sig3_p2 ))); printf("\nr2 :% 3.4f',r2);
/* Calculation o f effective radius */

Appendix I 253
r=(rl * r2 )/(rl + r2);
/* Calculation o f the constant c */
c l= (4 ./3 .)*d l *area*e*sqrt(r)*pow(rm sl, 1.5); c2=(4./3.)*d2*area*e*sqrt(r)*pow(rms2,1.5);
printf("\ndl :% 2 .8 f ',d l); printf("\nd2 :% 4.4f',d2); printf("\nrl :% 3 .4 f ',rl); printf("\nr2 :% 3.4f',r2); printf("\nsigl :% 3.4f',s ig l); printf("\nsig32 :% 3.4f',sig32); printf("\nr :% 6.9f',r); printf("\ncl :% 6 .6 f',c l); printf("\nc2 :% 6.6f',c2); getch();
/* Beginning o f load calculation *//* One bar applied pressure = 173.5 N , load = w *//* t= dimensionless mean plane separation*/
for(i= l; i<= 11; i++){
w=i* 173.5; wi=w/c2;
if( (loglO( w i ) > (0.)) & (log l0( w i ) <= 2. 5) ) t = ( -loglO(wi) +0.5) /(0.5)*(53./35.) - (73./35.);
if( (log l0 ( w i ) > (-0.5)) & (log l0 ( wi ) <= 0) ) t = ( -loglO(wi) - 0) /(0.5)*(28./35.) - (20./35.);
if( (loglO(wi) > -1) & (loglO(wi) < -0.5 )) t= ((-logl0(w i) - 0.5) /0.5)*(22./35.) + (8 /35 );
if(( loglO(wi) > -1.5) & (loglO(wi) < -1)) t= ((-logl0(w i) - 1)/0.5)*(18 /35.) + (30 /35.);
if(( loglO(wi) > -2.0) & (loglO(wi) < -1.5)) t=((-loglO (w i) - 1,5)/0.5)*(16.5/35.) + (48 /35 );
if( (loglO(wi) > -2.5) & (loglO(wi) < -2.0)) t=((-loglO(wi) - 2.0)/0.5)*(14./35.) + (64.5/35.);
if( (loglO(wi) > -3.0) & (loglO(wi) < -2.5))

Appendix I 254
t=((-loglO(wi) - 2.5)/0.5)*( 12.5/35.) + (78.5/35.);
if(( loglO(wi) > -3.5) & (loglO(wi) < -3.0)) t= ((-logl0(w i) - 3.0)/0.5)*(l 1./35.) + (91 /35 );
if(( loglO(wi) > -4.0) & (loglO(wi) < -3.5)) t=((-loglO(wi) - 3.5)/0.5)*(9.5/35.) + (102./35.);
if( (loglO(wi) > -4.5) & (loglO(wi) < -4.0)) t= ((-logl0(w i) - 4.0)/0.5)*(7./35.) + (111.5/35.);
if( (loglO(wi) >= -5.0) & (loglO(wi) < -4.5)) t=((-loglO(wi) - 4.0)/0.5)*(5./35.) + (118.5/35.);
/* to calculate the value o f ratio f , ra tf by interpolation
if( t>= -3.0 && t < -2.5)ra tf = (12.5/17.8)*0.5 + ( ( t - (-3.0))/0.5)*0.5*(( 14. - 12.5)/17.8);
if( t>= -2.5 && t < -2.0)ra tf = (14./17.8)*0.5 + (( t - (-2.5))/0.5)*0.5*((16.5-14.)/l 7.8);
if( t>= -2.0 && t < -1.5)ra tf = (16.5/17.8)*0.5 + ( ( t - (-2.0))/0.5)*0.5*((20.5 - 16.5)/17.8);
if( t>= -1.5 && t < -1.0)ra tf = (20.5/17.8)*0.5 + (( t - (-1 5))/0.5)*0.5*((24.5 - 20.5)/l 7.8);
if( t>= -1.0 && t < -0.5)ra tf = (24.5/17.8)*0.5 + (( t - (-1 ,0))/0.5)*0.5*((29 -24.5)/l 7.8);
if( t>= -0.5 & & t < 0 . )ra tf = (29/17.8)*0.5 + ( ( t - (-0.5))/0.5)*0.5*((34.5 - 2 9 ) /l7 8);
if( t>= 0. && t < 0.5)ra tf = (34.5/17.8)*0.5 + ( t /0.5)*0.5*((41.5 - 34.5)/l 7.8);
if( t>= 0.5 & & t < 1.0)ra tf = (41 ,5/17.8)*0.5 + (( t - (0.5))/0.5)*0.5*((48.5 - 41.5)/17.8);
if( t>= 1.0 && t < 1.5)ra tf = (48.5/17.8)*0.5 + (( t - (1.0))/0.5)*0.5*((57 - 48.5)/l 7.8);
if( t>= 1.5 && t < 2.0)ra tf = (57/17.8)*0.5 + ( ( t - (1 .5))/0.5)*0.5*((66-57)/l7.8);
if( t>= 2.0 && t < 2.5)ra tf = (66/17.8)*0.5 + ( ( t - (2 .0))/0.5)*0.5*((76-56)/l7.8);

Appendix I 255
if( t>= 2.5 && t < 3.0)ratf = (76/17.8)*0.5 + ( ( t - (2.5))/0.5)*0.5*((88-76)/17.8);
if( t>= 3.0 && t < 3.5)ra tf = (88/17.8)*0.5 + ( ( t - (3 0))/0.5)*0.5*((88-76)/l 7.8);
if( t<= 0.0) ra tf =0.9559787;
printf("\nload :% 6.2f',w ); printf("\nw/c :% 6.4f',w i); printf("\nlogl0w /c2 :% 2.6f',logl0(w /c2)); printf("\nthick :% 2.9f',t); printf("\nratioF :% 2.4f',ratf);
/* Calculation o f the contact stiffness s[i] for each load condition */
s[i] = 3 * ra tf |!w/(2*rms2); printf("\n Stifness :% 6.6f’,s[i]);getchO;
}}

Page 256
APPENDIX II
Input Data For The Finite Element Analysis Using ANSYS REVISION5.0A
/BATCH, LIST /FILNAM, SUBDISC /UNIT. S. I./TITLE, SUBSTRUCTURING OF THE SIMPLFIED DISC FINITE ELEMENT MODEL
/PREP7! define element type ! coordinate system is cylindrical
CSYS, 1 ET. 1,63 ET.7,50
! material properties of grey cast ironMP,EX,1,120E9MP.DENS,1,7.520E3
'constants defining thickness of shell elementsR.13.8.3E-3R. 14,10.2E-3
! definition of disc N,20010,68E-3„5.255E-3 N,20012,78.5E-3„5.255E-3 N,20014,89.5E-3„5.255E-3 N,20016.98.5E-3,,5.255E-3 N,20018,107.5E-3„5.255E-3 N,20020,120E-3„5.255E-3 NGEN.60.100,20010,20020,2„6,
MAT.lTYPE,]REAL. 13NUMSTR.ELEM, 1001E,20010,20012,20112,20110 REAL. 14E,20012,20014,20114,20112 E.20014.20016,20116,20114 E,20016,20018,20118,20116 E,20018.20020,20120,20118 EGEN,59,1001,1005,1 E,25910,25912,20012,20010 REAL, 14E,25912,25914,20014,20012

Appendix II 257
E.25914,25916,20016.20014 E,25916,25918,20018,20016 E.25918.25920,20020.20018
! constraint the inner periphery of the simplified disc\D.20010,UZ.0.„25910.100,UX.UYNSEL.ALLNROTAT.ALL
FINISH
! solution phase /SOLUANTYPE.SUBSTR SEOPT. SUBDISC,3
! define masters M20012.UZ,25912,100 M.20014.UZ.25914.100 M .20016,UZ.25916.100 M.20018.UZ.25918.100 M,20020,UZ,25920,100
SOLVESAVEFINISH/EXIT.ALL
definition of the inboard pad and substructuring
/BATCH.L1ST /FILNAM.SUBPAD 1/TITLE.SUBSTRUCTURING OF THE INBOARD PAD/UNITS,S.I./PREP7
CSYSJET.2.14ET,3,14„3
! material properties of the mild steel baekplate of the padMP.EX.2.207E9MP.DENS.2.7.725E3
! material properties of the friction materialMP,EX,3,8E9MP.DENS.3,2.5E3
lvalue of the nodal support stiffness R.4,1.2E6
(definition o f the pad finite element model

Appendix II 258
N,1.106.5E-3.-7.33 N,2,l 12E-3,-8.33 N,3,121E-3,-6 N,4,128E-3,-3.8 N,5.129.33E-3.-0.33
N,6,104.5E-3,-6 N,7,108.5E-3,-3.5 N,8,l 16.5E-3.-2 N,9,125E-3,0 N.10.128.5E-3J
N.l 1.89.5E-3.3.5 N.12.89.5E-3.4.5 N.13.97.5E-3.1.5 N,14,97.5E-3,2.5 N,15,103.5E-3,0
N ,16.107.5E-3,3 N. 18.116E-3.2 N.19.119E-3.1.5
N,20.81.5E-3.6N.22.85E-3.6R24.89.5E-3.6N.26.98.5E-3.6N.28.107.5E-3.6N.30J16.5E-3?6N.32,118.5E-3,6
N,120,78E-3?12 N .122.80.5E-3,12 N,124.89.5E-3,12 N.126.98.5E-3J2 N,128,107.5E-3,12 N, 130,116.5E-3J2 N.132,118.5E-3.12
NGEN.7,100? 120,132,„6,
N,820,81.5E-3,54 N.822.85E-3.54 N,824,89.5E-3,54 N,826.98.5E-3,54 N.828,107.5E-3,54 N.830.116.5E-3.54 N.832.118.5E-3.54
N.834.89.5E-3.55.5N,844,89.5E-3,56.5N,846,97.5E-3,58.5N.836.97.5E-3.57.5

Appendix II 259
N,848,103.5E-3,60
N,838,107.5E-3,60 N,840,116E-3,58 N, 842,119E-3,57.5
N,940,104.5E-3,66 N,942,108.5E-3,63.5 N,944.116.5E-3,62 N,946.125E-3.60 N,948,128.5E-3,59
N,1040,106.5E-3,67.33 N,1042,112.5E-3,68.33 N,1044.121E-3,66 N. 1046,128E-3,63.8 N, 1048.129.33E-3,59
N, 1115,107E-3,-1.8 N ,1116.110E-3,-l N, 1118.117E-3,0 N ,1119,121E-3,1.5
N ,1138,110E-3,61 N ,1140,117E-3,60 N ,1142,121E-3,58.5 N ,1148,107E-3,61.8
NGEN.2,200.1,1148, l,„4.75E-3
Imild steel backplateTYPE.6MAT, 2E, 1,2,7,6,2001,2002,2007,2006 EGEN.4,1,1
E. 1115.7.1116,1116,3115,2007,3116.3116 E. 1116.7.8,1118.3116.2007,2008,3118 E, 1118.8,9,1119,3118,2008.2009,3119
E.l 115,1116,16,15,3115,3116,2016,2015 E, 1116,1118,18,16,3116,3118,2018,2016 E.l 118,1119.19,18,3118,3119,2019.2018
E,20,l 1.12,22,2020.2011,2012.2022 E ,11,13,14,12,2011,2013,2014,2012 E, 13,15,16,14,2013,2015,2016,2014
E,22,12.24,24,2022,2012,2024,2024 E, 12,14,26,24.2012,2014.2026,2024 EGEN,3,2,15E. 18,19,32,30,2018,2019,2032,2030

Appendix II 260
E.20,22,122,120.2020,2022,2122,2120EGEN,6,2.19EGEN.8,100,19,24.1
E,822.824,834,834,2822,2824,2834.2834 E,824,826.836.834,2824,2826,2836,2834 EGEN.4,2,68E.822.834.844.820.2822,2834.2844,2820 E.834.836.846.844.2834.2836.2846.2844 EGEN.2,2.73
E,848,838,1 138.1 148,2848,2838,3138,3148 E,838.840,1140.1138.2838,2840.3140,3138 E, 840,842,1142,1140,2840,2842,3142,3140
E.942,1148.1138,1138,2942,3148,3138.3138 E,942,1138,1140,944,2942,3138,3140,2944 E.944.1140,1142,946,2944.3140,3142.2946
E. 1040.940.942.1042,3040,2940.2942,3042 EGEN.4,2.81
! friction materialTYPE.6MAT,3NGEN.2,2000,2011.2842,1,„ 12.5E-3
NUMSTR.ELEM,101E,2022,2012,2024,2024.4022.4012,4024,4024 E.2012.2014.2026,2024.4012,4014.4026.4024 EGEN.3.2,102
E,2022,2024,2124,2122,4022.4024,4124,4122 EGEN.4,2,105
EGEN.8.100.105,108.1E,2822.2824,2834,2834,4822.4824.4834.4834
NUMSTR.ELEM,150E.2824.2826,2836.2834,4824,4826,4836,4834 EGEN.3,2,150
NUMSTR.ELEM.201E.2018,2019.4018,4018,2030.2032,4030.4030 E,2030,2032,4030,4030,2130,2132.4130.4130 EGEN.8.100.202E.2830.2832.4830.4830.2840.2842.4840,4840
NUMSTR.ELEM,301E.2020.2022,4022.4022,2120,2122,4122,4122 EGEN.8,100,301

Appendix II 261
E,2020,2022,4022,4022,2011,2012,4012,4012 E,2011,2012,4012,4012,2013,2014,4014,4014 E,2013,2014.4014,4014,2015,2016,4016,4016
E,2820.2822,4822.4822,2844.2834,4834,4834 E,2844.2834,4834.4834,2846,2836,4836.4836 E,2846,2836.4836,4836,2848,2838.4838,4838
! replacing portion of the mild steel on the backplate with friction material ('peg')
EDELE,17EDELE,26EDELE.56EDELE,70
EDELE,5EDELE.8EDELE.75EDELE.78
TYPE,6 MAT.2
E, 16,18,30.28.2016,2018,2030,2028 E, 122.124,224,222,2122,2124,2224,2222 E,622,624.724.722,2622,2624,2724.2722 E,828,830,840,838,2828,2830,2840,2838
Inode generation to represent ground nodes for caliper support stiffness
NGEN,2,5000,1,1148,1,,,-1.75E-3
TYPE,4 REAL. 10NUMSTR.ELEM.401E.5222,222 EGEN,4,2,401 E.5622,622 EGEN,4,2,405 E,5320,320 E,5322,322 E,5330,330 E,5332.332 E,5420.420 E.5422.422 E,5432,432 E,5520,520 E.5522,522 E,5530.530 E,5532.532

Appendix II
! constraint fully the ground nodes NSEL.NODE,5001,5700D.ALL.ALL.O.NROTAT.ALLNSEL.ALL
FINISH
! solution phase /SOLUANTYPE,SUBSTR SEOPT.SUBPAD 1,3
! selecting masters M,1,UZ, 1148,1 M,1,UY,10,1,UX M,940.UY. 1046,1 ,UX
M.4012,UZ.4018.2.UY M.4834.UZ.4840.2,UY M.4022,UZ.4840,100,UY M.4024,UZ.4822,100.UY M.4026,UZ.4826,100.UY M.4028.UZ.4828.1OO.UY M.4030.UZ.4830,100.UY
SOLVESAVEFINISH/EXIT.ALL
definition of the outboard pad and substructuring
/BATCH.LIST /FILNAM.SUBPAD2/TITLE.SUBSTRUCTURING OF THE OUTBOARD PAD /UNITS.S.I./PREP7
CSYS,1ET.2.14ET.3,14,,3
! material properties of the mild steel backplate of the padMP.EX.2.207E9MP.DENS,2,7.725E3
! material properties of the friction material MP.EX,3,8E9

Appendix II
MP.DENS,3,2.5E3
lvalue of the nodal support stiffness R.4.1.2E6
! definition of the pad finite element model!the outboard pad is position off zz above the inboard pad parallel to the z-axis ZZ=60E-3
NNNNN
NNNNN
NNNNN
NNN
10001,106.5E-3,-7.33, ZZ 10002,112E-3,-8.33,ZZ 10003,12 lE-3,-6.ZZ 10004,128E-3,-3.8,ZZ 10005,129.33E-3.-0.33,ZZ
10006,104.5E-3.-6.ZZ 10007.108.5E-3,-3.5.ZZ 10008,116.5E-3,-2.ZZ 10009,125E-3,0,ZZ 10010.128.5E-3,1.ZZ
10011.89.5E-3,3.5,ZZ 10012,89.5E-3,4.5,ZZ 10013,97.5E-3,1,5,ZZ 10014,97.5E-3,2.5,ZZ 10015,103.5E-3,0.ZZ
10016,107.5E-3,3,ZZ 10018,116E-3,2,ZZ 10019.119E-3.1,5,ZZ
N. 10020.81.5E-3,6,ZZ N. 10022,85E-3.6.ZZ N, 10024,89.5E-3.6.ZZ N, 10026,98.5E-3,6,ZZ N, 10028,107.5E-3,6.ZZ N ,10030,116.5E-3.6.ZZ N, 10032.118.5E-3.6.ZZ
N. 10120.78E-3,12,ZZ N. 10122.80.5E-3.12.ZZ N, 10124.89.5E-3,12,ZZ N,10126,98.5E-3,12,ZZ N, 10128.107.5E-3.12.ZZ N, 10130,116.5E-3.12.ZZ N ,10132,118.5E-3,12.ZZ
NGEN,7.100.10120,10132„.6,
N.10820.81.5E-3.54.ZZ N, 10822,85E-3,54,ZZ N, 10824.89.5E-3.54.ZZ

Appendix II 264
N.10826.98.5E-3,54.ZZ N, 10828,107.5E-3,54, ZZ N, 10830,116.5E-3,54.ZZ N, 10832,118.5E-3,54, ZZ
N, 10834.89.5E-3.55.5.ZZ N, 10844,89.5E-3,56.5,ZZ N,10846.97.5E-3.58.5.ZZ N,10836.97.5E-3,57.5.ZZ N, 10848,103.5E-3,60,ZZ
N, 10838,107.5E-3,60, ZZ N. 10840,116E-3,58.ZZ N .10842,119E-3.57.5.ZZ
N. 10940.104.5E-3.66.ZZ N ,10942,108.5E-3,63.5,ZZ N. 10944.116.5E-3.62.ZZ N. 10946,125E-3,60,ZZ N, 10948.128.5E-3.59.ZZ
N, 10040.106.5E-3,67.33.ZZ N.10042,112.5E-3.68.33,ZZ N. 10044.121E-3,66,ZZ N.l 0046,128E-3,63.8.ZZ N. 10048,129.33E-3,59.ZZ
N .l 1115.107E-3.-1.8.ZZ N, 111 16,110E-3,-l,ZZ N, 11118.117E-3.0.ZZ N.l 1119,121 E-3.1.5 .ZZ
N ,11138,110E-3,61,ZZ N ,11140,117E-3,60,ZZ N, l l 142,121E-3,58.5, ZZ N, 11148.107E-3,61 8.ZZ
NGEN.2,2000.10001,11148,l„,-4.75E-3
!mild steel backplateTYPE,6MAT,2NUMSTR.ELEM. 1001E, 10001.10002,10007.10006,12001,12002.12007.12006 EGEN.4.1.1001
E.l 1115.10007.11116.11116.13115,12007.13116.13116 E.l 1116.10007.10008.11118.13116,12007.12008.13118 E. 11118,10008.10009,11119.13118.12008.12009.13119
E,11115,11116,10016,10015,13115,13116,12016,12015 E.l 1116.11118.10018.10016.13116.13118.12018.12016

Appendix II 265
E,11118,11119,10019,10018,13118,13119,12019,12018
E, 10020,10011.10012,10022,12020,12011,12012,12022 E.10011,10013,10014,10012,12011,12013,12014.12012 E, 10013,10015,10016,10014,12013,12015,12016.12014
E. 10022,10012,10024,10024,12022,2012,12024.12024 E, 10012,10014.10026,10024.12012,12014.12026,12024 EGEN.3,2,1015E. 10018.10019,10032,10030,12018.12019,12032.12030
E. 10020,10022,10122,10120,12020,12022,12122,12120EGEN.6.2.1019EGEN. 8,100,1019,1024,1
E. 10822,10824,10834,10834.12822,12824.12834.12834 E. 10824.10826.10836,10834.12824,12826,12836.12834 EGEN.4.2.1068E, 10822.10834.10844,10820,12822,12834.12844.12820 E. 10834.10836.10846,10844.12834,12836,12846.12844 EGEN.2.2.1073
E, 10848.10838,11138,11148.12848.12838.13138.13148 E. 10838.10840.11140.11138.12838.12840.13140,13138 E. 10840,10842,11142,11140,12840,12842,13142.13140
E. 10942,11148.11 138.11 138.12942,13148.13138.13138 E. 10942,11138.11140,10944,12942,1313 8.13140.12944 E. 10944.11140.11142,10946.12944.13140.13142,12946
E.l 1040.10940.10942,11042.13040,12940,12942,13042 EGEN.4,2,1081
! friction materialTYPE.6MAT.3NGEN.2 ,2000,12011,12842,112.5E-3
NUMSTR.ELEM, 1101E, 12022,12012,12024,12024,14022,14012,14024.14024 E, 12012.12014,12026.12024,14012,14014.14026.14024 EGEN.3,2.1102
E. 12022.12024.12124.12122.14022,14024.14124.14122 EGEN.4,2,1105
EGEN,8,100,1105,1108,1E. 12822,12824,12834.12834.14822,14824.14834.14834
NUMSTR.ELEM. 1150E. 12824.12826,12836,12834.14824.14826.14836.14834 EGEN,3,2,1150

Appendix II
NUMSTR.ELEM. 1201E. 12018.12019,14018,14018,12030,12032,14030,14030 E. 12030,12032,14030.14030,12130,12132,14130.14130 EGEN,8.100.1202E. 12830.12832.14830,14830.12840.12842.14840.14840
NUMSTR.ELEM. 1301E, 12020.12022,14022,14022,12120,12122.14122.14122 EGEN,8,100.1301
E. 12020.12022,14022,14022,12011.12012,14012.14012 E, 12011.12012,14012,14012,12013,12014.14014.14014 E, 12013.12014,14014,14014,12015,12016,14016.14016
E. 12820.12822,14822,14822,12844.12834,14834.14834 E, 12844.12834.14834,14834.12846,12836,14836.14836 E. 12846.12836.14836.14836,12848.12838.14838.14838
1 replacing portion of the mild steel on the backplate with friction material ('peg')
EDELE,1017 EDELE,1026 EDELE. 1056 EDELE, 1070
EDELE. 1005 EDELE. 1008 EDELE, 1075 EDELE. 1078
TYPE,6 MAT,2
E. 10016.10018,10030,10028.12016,12018.12030.12028 E. 10122,10124,10224,10222,12122,12124.12224.12222 E, 10622,10624,10724.10722,12622,12624.12724.12722 E. 10828.10830.10840,10838.12828.12830.12840.12838
Inode generation to represent ground nodes for caliper support stiffness
NGEN,2,5000,10001,11148,1 ,„ 1.75E-3
TYPE,4 REAL. 10NUMSTR.ELEM, 1401 E. 15024.10024 EGEN.5,2.1401 E ,15124,10124 EGEN.5,2.1406 E,15724.10724 EGEN,5,2,1411

Appendix II 267
E ,15824,10824 EGEN.5,2,1416 E,15228.10228 EGEN,3,2,1421 E ,15628.10628 EGEN,3,2,1424 E.15530,10530 E,15532.10532 E.15330,10330 E.15332,10332
'constraint fully the ground nodes NSEL.NODE, 15001,15900D.ALL,ALL,0.NROTAT.ALLNSEL.ALL
FINISH
! solution phase /SOLUANTYPE.SUBSTRSEOPT.SUBPAD2,3
[selecting masters M,10001,UZ,11148.1 M. 10001,UY, 10010,1.UX M. 10940,UY,11046,1,UX
M. 14012,UZ, 14018,2,UY M. 14834,UZ,14840.2,UY M. 14022,UZ, 14840.100.UY M. 14024.UZ, 14822,100, UY M.14026.UZ. 14826,100,UY M.14028.UZ. 14828.100.UY M.14030.UZ. 14830.100,UY
SOLVESAVEFINISH/EXIT.ALL
coupling of the disc . inboard pad and outboard pad substructures using the interface elements with friction included , stiffness for each interface element is determined from the random process approach calculation
/BATCH.LIST /FILNAM.STABILITY /UNITS,SI/TITLE, STABILITY ANALYSIS OF THE COUPLED PAD-DISC SYSTFM

Appendix II 26X
/PREP7
CSYS.l ET.1,63 ET.2,4.14„3 ET,6.45 ET.7,50
Icontact stiffness KC = 350 MN/m & and total force applied FTOT 1734 9 \(fo r Icontact pressure distribution purposes )KC=350.0E6 FTOT=l 734.9
Istiffness of the abutment to ground. KA=1,2MN/m R.3.1.2E6
! determination of individual interface element contact stiffnessIbased on the nodal contact reaction force on the pad from contact pressure anak sis!in Chapter Five - Figure 5.5b
*DIM.F.,800*DIM.K,.800*DIM.MUK.,800
! nodal reaction force for the inboard padF(201)=0F(202)=l 1.96F(203)=10.46F(204)=3.855
F(205)=10.33F(206)=20.01F(207)=23.50F(208)=17.39F(209)=4.004
F(210)=23.62 F(211 )=53.28 F(212)=50.02 F(213)=43.81 F(214)=15.32
F(215)=29.67F(216)=77.67F(217)=70.81F(218)=72.37F(219)=28.07
F(220)=30.20 F(221)=98.16 F(222)=88.96 F(223)= 100.6

Appendix II
F(224)=32.23
F(225)=28.90F(226)=103.4F(227)=92.45F(228)=109.5F(229)=29.87
F(230)=27.31 F(231)=87.63 F(232)=77.32 F(233)=84.78 F(234)=22.55
F(235)=22.59F(236)=49.82F(237)=37.2F(238)=30.26F(239)=4.716
F(240)=2.433
! continue to define as F(241) - F(253) = 0
! nodal reaction for the outboard pad
F(301)=10.38F(302)=44.88F(303)=83.90F(304)=32.85
F(305)=3.068F(306)=25.85F(307)=69.87F(308)=123F(309)=49.26
F(310)=0 F(311 )=25.97 F(312)=63.45 F(313)=108 F(314)=46.49
F(315)=0 F(316)=3 863 F(317)=36.92 F(318)=81.33 F(319)=36.05
F(320)=0F(321)=0F(322)=17.62

Appendix II
F(323F(324
F(325F(326F(327F(328F(329
F(330F(331F(332F(333F(334
F(335F(336F(337F(338F(339
F(340F(341F(342F(343F(344
F(345F(346F(347F(348F(349
F(350 F(351 F(352 F(353
60.5=28.78
=0=0= 11.46 =54.89 =30.95
=0=0=20.91=70.7=38.23
=0=0=36.95=93.50=50.55
=0=2.21e-3 =45.87 = 105.6 =58.23
=0=0=29.1=85.88=47.71
=0=0= 1.756 =0.783
*DO,I,l,53K(200+1)=KTC)T(F(200+I)/FTOT))MUK(200+I)=MU*K(200+I)
Ifilling the matrix27 interface element (matrix 12 x 12) with individual contact stillness !to couple the inboard pad to the disc
R.200+I RMORERMORE,,-MUK(200+I)RMORE,. MUK(200+I)?„.K(200+I)RMORE.., ,„-K(200+I)RMORE.RMORE,

Appendix II 271
RMORE,RMORE,RMORE,RMORE,„„-MUK(200+I)RMORE..,K(200+I)RMORE.RMORE,RMORE.RMORE.RMORE,,,,,.MUK(200+I)RMORE,-K(200+I)
*ENDDO
!repeat the above command exactly but with opposite sign i.e. + becomes + for Ml K.!for the outboard pad as the direction of the normal forccs changes relative to the 'inboard pad — reactionary forces
Icall the substructure files (or the superelement file , SE)TYPE.7SE.SUBDISCSE.SUBPAD1SE.SUBPAD2
Icouple all the nodes on the pad friction face to the disc . for example!for the inboard padTYPE,5REAL,201E.20014.4012
E,21020.4840
!for the outboard pad REAL,301E,20014,14012
E.21020.14840
!define ground nodes for the abutments and constraints use u \ and uy dol springS FINISH
(solution phase of modal analysis between 2-11 kHz /SOLUANTYPE.MODALMODOPT.DAMP. 100.2000,11000SOLVESAVEFINISH/EXIT,ALL