Analysis of Differentiation Strategy and Profitability of ... of Differentiation Strategy and...
12
PMKT – Brazilian Journal of Marketing, Opinion, and Media Research ISSN: 1983-9456 (Print) ISSN: 2317-0123 (Online) Editor: Fauze Najib Mattar Valuation system: Triple Blind Review Languages: Portuguese and English Publication: ABEP – Associação Brasileira de Empresas de Pesquisa Analysis of Differentiation Strategy and Profitability of Business Auto Parts Industry in Brazil Análise Estatística da Estratégia de Diferenciação e Rentabilidade de Empresas da Indústria de Autopeças no Brasil 1 Submission: 21 set. 2012 - Approval: 27 fev. 2013 Viviane Chunques Gervasoni Master in Business Administration from City University of São Caetano do Sul - USCS. Nine University doctoral student by July - UNINOVE. Professor at Universidade Nove de Julho - UNINOVE. E-mail: [email protected]. Address: UNINOVE - Av. Dr. Adolpho Pinto, 109 - Barra Funda - 01156-050 - São Paulo/SP - Brasil. George Bedinelli Rossi Master and PhD in Marketing from FGV/EAESP. Professor at ESPM and EACH/USP. E-mail: [email protected]. Dirceu da Silva M.Sc. in Physics from the University of São Paulo - USP and PhD in Education from UNICAMP. Professor at UNICAMP and Nove de Julho University - UNINOVE. E-mail: [email protected]. 1 The authors of this article are grateful to the referees of the PMKT journal for fundamental contributions made to this work.
Transcript of Analysis of Differentiation Strategy and Profitability of ... of Differentiation Strategy and...
PMKT – Brazilian Journal of Marketing, Opinion, and Media Research
ISSN: 1983-9456 (Print)
ISSN: 2317-0123 (Online)
Editor: Fauze Najib Mattar
Valuation system: Triple Blind Review
Languages: Portuguese and English
Publication: ABEP – Associação Brasileira de Empresas de Pesquisa
Analysis of Differentiation Strategy and Profitability of Business Auto Parts Industry in
Brazil
Análise Estatística da Estratégia de Diferenciação e Rentabilidade de Empresas da Indústria
de Autopeças no Brasil1
Submission: 21 set. 2012 - Approval: 27 fev. 2013
Viviane Chunques Gervasoni
Master in Business Administration from City University of São Caetano do Sul - USCS. Nine
University doctoral student by July - UNINOVE. Professor at Universidade Nove de Julho -
UNINOVE.
E-mail: [email protected].
Address: UNINOVE - Av. Dr. Adolpho Pinto, 109 - Barra Funda - 01156-050 - São Paulo/SP -
Brasil.
George Bedinelli Rossi
Master and PhD in Marketing from FGV/EAESP. Professor at ESPM and EACH/USP.
E-mail: [email protected].
Dirceu da Silva
M.Sc. in Physics from the University of São Paulo - USP and PhD in Education from UNICAMP.
Professor at UNICAMP and Nove de Julho University - UNINOVE.
E-mail: [email protected].
1 The authors of this article are grateful to the referees of the PMKT journal for fundamental contributions made to this
work.

Analysis of Differentiation Strategy and Profitability of Business Auto Parts Industry in Brazil
Viviane Chunques Gervasoni / George Bedinelli / Rossi Dirceu da Silva
PMKT – Brazilian Journal of Marketing, Opinion, and Media Research (ISSN 1983-9456 Print and ISSN 2317-0123 Online), São Paulo, Brasil, V.
13, pp. 34-45, October, 2013 – www.revistapmkt.com.br 35
ABSTRACT
The objective of this research is to investigate how costs and expenses explain the profitability of
the company with emphasis on Statistical Analysis of Differentiation Strategy in Product Quality.
The literature review indicates that the company's profitability depends on the generic strategy
adopted to deal with this structural force in the industry. Among these strategies should focus on the
differentiating features unique and valued by the purchasers and at the same time, attempt to costs.
This study was done using the values of costs, expenses, and net sales of seven companies,
originally extracted from the financial statements of the same, published by BM&F BOVESPA.
These analyzes via multiple regression indicate that costs and expenses explain the profitability in
the auto parts industry when it adopted the generic strategy of differentiation management in
product quality.
KEYWORDS:
Differentiation strategy, costs and profitability.
RESUMO
O objetivo desta pesquisa é investigar quanto os custos e as despesas explicam a rentabilidade da
empresa com ênfase na Análise Estatística da Estratégia de Diferenciação em Qualidade de Produto.
A revisão da literatura indica que a rentabilidade da empresa depende da estratégia genérica adotada
por esta para lidar com as forças estruturais da indústria. Dentre essas estratégias, a de diferenciação
deve enfocar características únicas e valoradas pelos compradores e, ao mesmo tempo, atentar aos
custos. Este estudo foi feito usando os valores dos custos, despesas, patrimônio líquido e vendas de
sete empresas, extraídos originalmente dos demonstrativos contábeis das mesmas, divulgados pela
BM&F BOVESPA. As análises feitas via regressão múltipla indicam que custos e despesas
explicam a rentabilidade na indústria de autopeças quando adotada a gestão estratégica genérica de
diferenciação em qualidade do produto.
PALAVRAS-CHAVE:
Estratégia de diferenciação, custos e rentabilidade.

Analysis of Differentiation Strategy and Profitability of Business Auto Parts Industry in Brazil
Viviane Chunques Gervasoni / George Bedinelli / Rossi Dirceu da Silva
PMKT – Brazilian Journal of Marketing, Opinion, and Media Research (ISSN 1983-9456 Print and ISSN 2317-0123 Online), São Paulo, Brasil, V.
13, pp. 34-45, October, 2013 – www.revistapmkt.com.br 36
1. INTRODUCTION
Porter (1989) says that the value of the costs of a company has important implications for the
successful differentiation strategy. For the autoparts industry the most common way to measure
quality is given by means of certifications that aim to ensure the establishment of criteria patterns of
relationships between customers and suppliers (LAMENZA, 2008).
The problem of this research appeared on the idea of Porter (2004) that, for use in the management
of differentiation strategy, costs must be sized, but to explain how the costs reflected in profitability
is also necessary to scale the amount of expenses.
As Iudícibus et al. use to say (1998), expenses are directly or indirectly goods or services consumed
for obtaining revenue, thus the problem of this research is: the costs and expenses explain the
profitability of the company with emphasis on generic strategy of differentiation in product quality?
The objective of this research is to investigate the relative importance of costs and expenses to
explain the profitability of the company that adopts the generic strategy of differentiation in product
quality in the auto parts industry. Therefore, the hypothesis of this research is: costs and expenses
explain the profitability in the auto parts industry when adopted the generic strategy of
differentiation in product quality?
This study was done using the values of the costs, expenses, equity and sales of firms in the
Brazilian autoparts industry, originally of the financial statements of the same companies, published
by BM & F BOVESPA extracted. Data collection was exploratory, documentational type
(Malhotra, 2001). A sample of seven companies in the auto parts industry comprises: Fras-Le S/A;
Iochpe Maxion S/A; Mahle-Metal Leve S/A; Marcopolo S/A; Randon S/A Implements and
Interests; Tupy S/A and metallurgical Riosulense S/A.
Applied regression analysis where made and the dependent variable studied was the amount of the
return and the independent variables were the sales figures, costs, expenses, operating income and
net worth.
2. DEVELOPMENT
The beginning of the automobile industry in Brazil coincides with the policy of internationalization
of production of vehicles from large corporations and the incentives offered by the government
(financial, protectionism, infrastructure installation and running administrative reforms) (LADIES;
DIAS, 2005).
In the XXI century, given the need for product launches with agility in the marketplace, companies
are applying concurrent product development, working with various departments in an integrated
manner, saving time and producing a positive effect by omitting some stages of development
(KOTLER; ARMSTRONG, 1999). Thus, the mutual exchange of information tends to improve the
design quality and the product becomes more chances of commercial success (BAXTER, 2000).
Greater integration of suppliers and manufacturers in product development activities has enabled to
reduce design complexity, shorten the execution time, the hours of necessary engineering and renew
more frequently, both the product and the technology used, with lower costs and division of

Analysis of Differentiation Strategy and Profitability of Business Auto Parts Industry in Brazil
Viviane Chunques Gervasoni / George Bedinelli / Rossi Dirceu da Silva
PMKT – Brazilian Journal of Marketing, Opinion, and Media Research (ISSN 1983-9456 Print and ISSN 2317-0123 Online), São Paulo, Brasil, V.
13, pp. 34-45, October, 2013 – www.revistapmkt.com.br 37
responsibilities. These factors have contributed to the partnerships with suppliers are recognized as
important for the acceleration of the product development cycle, since a significant percentage of
the cost of the vehicle comes from parts purchased from autoparts companies (CUSUMANO;
NOBEOKA, 1993).
The involvement of suppliers in product development contributes significantly to the improvement
of process performance in terms of time and quality (CLARK; FUJIMOTO, 1991; WOMACK et
al., 1990; BROWN; EISENHARDT, 1995; KESSELER, 1997).
The specialization of suppliers enables faster technology innovations and frees the company to
specialize in what is their core business (PRAHALAD; HAMEL, 1990), the design and assembly of
the vehicle, not your specific parties via organizational strategies.
To Hofer and Schendel (1978), strategy is evidenced by the existence of levels when they explain
that there is strategy focused on the corporation and so turned to the business unit.
Mintzberg (1987), for example, provided about five synonyms for the word strategy in the field of
business:
A plan.
A play.
A pattern.
A positioning.
A perspective.
Ansoff and McDonnell (1993) define strategy as a set of rules that helps in the decision making
process and aims to guide the behavior of an organization to achieve its goals.
In this sense, quality Garvin (1992) has five main settings are:
Transcendent.
Product based.
User based.
Production based.
Value based.
When referring to the definition of quality is meant to mean "innate excellence" and that perceived
differences in the same can be seen in some ingredient or product attribute.
According to Oliveira (2004), the quality within the strategic management must be defined before
fixed and internal standards are the customers that determine the acceptance of a product, is the
need for customers to be served.
Narasimhan, Ghosh and Mendez (1993), claim that the quality and cost are compatible for
leadership in business strategies. Therefore, costs should actually decrease more rapidly with the
acquisition of more experience in producing high quality products.
The central point of the total cost leadership strategy is the company to make its total cost is less
than that of its competitors. Lowest cost works as a defense mechanism against the rivalry of the
company from its competitors, especially with regard to price wars (PORTER, 2004).

Analysis of Differentiation Strategy and Profitability of Business Auto Parts Industry in Brazil
Viviane Chunques Gervasoni / George Bedinelli / Rossi Dirceu da Silva
PMKT – Brazilian Journal of Marketing, Opinion, and Media Research (ISSN 1983-9456 Print and ISSN 2317-0123 Online), São Paulo, Brasil, V.
13, pp. 34-45, October, 2013 – www.revistapmkt.com.br 38
Differentiation gives the company a defense against the forces of the environment, although other
than as permitted by cost leadership.
Loyalty and decreased sensitivity to price (customers willing to pay more to have a product that
they consider best suits your needs) isolate, to a greater or lesser degree, the company rivalry of its
competitors (PORTER, 2004).
For Porter (1989) the success of the strategy and goal achievement became a competitive
advantage. In the 1990s, Porter (1989) competitive advantage related to value creation, competitive
advantage arises from the value that a company can create for its buyers exceeds the cost of making
the company and provides the difference between the supply of one against the other company.
In the case of suppliers, the bargaining power is manifested when the market is dominated by a few
organizations and there are no substitute products, the industry is not important client, produce
buyers depend on the products of suppliers and the supplier's products are differentiated (PORTER,
1989).
According to Hill and Jones (1998), a firm has a competitive advantage when its profitability is
greater than the industry average, and it is sustainable when it can maintain this higher long-term
profitability.
3. METHODOLOGY
The population in this research is the Brazilian auto parts industry and the sample consists of seven
companies was used as a criterion for choosing the sample of firms non-probability selection and
trial (MALHOTRA, 2001), because the selections of the companies studied here are publicly traded
and, therefore, disclose their financial data.
Companies analyzed were: Fras-Le S/A; Iochpe Maxion S/A; Mahle-Metal Leve S/A; Marcopolo
S/A; Randon S/A Implements and Interests; Tupy SA and Metallurgical Riosulense S/A.
Considering that, when adopted the strategy of differentiation in product quality, should be
controlled or even reduce costs (PORTER, 2004), the seven companies already mentioned were
surveyed, listed on the BM & F BOVESPA (2009) of the auto parts industry the period 1996-2007.
Secondary data were collected through documentary exploratory research based on reports provided
by the BM & F BOVESPA. Sales information, costs, expenses, net worth, operating profit came
from the balance sheets posted on the BM & F BOVESPA site.
For data analysis techniques of multiple regression and Pearson correlation were used, since the
data metrics have natures and are described by well-defined quantities. Data were analyzed with
SPSS 5.0 software, where the normal distribution was evaluated.
Levene's test to assess the homogeneity of the variances (homoscedasticity) was used. Cook
distances to evaluate conflicting or extreme points (outliers) in the regression model. The values of
collinearity (Variance Inflation Factor - VIF) to check whether the independent variables are highly
correlated, and analysis of the normal distribution of non-standard residues and for how
assumptions of multiple linear regression requires that the dependent variable has normal
distribution and that the independent variables present is homoscedastic form (DOBSON, 2002).
Analysis of Differentiation Strategy and Profitability of Business Auto Parts Industry in Brazil
Viviane Chunques Gervasoni / George Bedinelli / Rossi Dirceu da Silva
PMKT – Brazilian Journal of Marketing, Opinion, and Media Research (ISSN 1983-9456 Print and ISSN 2317-0123 Online), São Paulo, Brasil, V.
13, pp. 34-45, October, 2013 – www.revistapmkt.com.br 39
Based on the statistical tests we observed that costs explains 36% of the profitability of the auto
industry of the seven companies studied.
4. DATA ANALYSIS AND PRESENTATION
Porter (1989) says that the value of the costs of a company has important implications for the
successful differentiation strategy.
From the data obtained in the financial statements of companies, made use of multiple linear
regression for each company in order to quantify the importance of costs and expenses to determine
profitability for the proposition Porter (2004) that costs should be minimized when adopted the
strategy of differentiation, product quality.
The variable profitability ROE (return on equity) was obtained by dividing the net income (LL) by
equity (PL) (Kassai; Kassai and Santos, 2000).
Rentabilidade ou ROE = PL
LL
The other variables, namely: sales, costs, expenses, equity and operating profit were used with their
original values.
Clarifying further, the term sales or revenue input elements for the asset (rights organization), in the
form of cash or rights to receive, corresponding usually to the sale of goods, products or services
(IUDÍCIBUS et al. 1998).
The costs are expenditures on goods or services used in the production of other goods or services
(MARTINS, 2008). Already expenditure means as Iudícibus et al. (1998), as the consumption of
goods or services that directly or indirectly help in the production of income and thus increase
profitability.
Operating income is the amount of profit on the sale of goods or services of the company
(GITMAN, 1997).
Finally, as equity (PL) means the difference between the value of assets (rights) and liabilities
(obligations) of a company at a given time (IUDÍCIBUS et al., 1998). Also according to Gitman
(2004) profitability or ROE measures the return earned on investment of capital of the company
shareholders. The higher this number better for homeowners.
In short, we collected data from 1996 to 2007 seven companies, according to five variables and
calculated (taken as the dependent variable in a linear regression model).
More specifically data analysis, according to the Kolmogorov-Smirnov (Table 1) revealed that
independent (sales, costs, expenses, operating income and net worth) and the dependent variable
variables (profitability) is shown with values of probability significance (p-value) above 0.05,
indicating that all can be described by normal distributions.
This evidence meets the first assumption of linear regression models (Malhotra, 2001).

Analysis of Differentiation Strategy and Profitability of Business Auto Parts Industry in Brazil
Viviane Chunques Gervasoni / George Bedinelli / Rossi Dirceu da Silva
PMKT – Brazilian Journal of Marketing, Opinion, and Media Research (ISSN 1983-9456 Print and ISSN 2317-0123 Online), São Paulo, Brasil, V.
13, pp. 34-45, October, 2013 – www.revistapmkt.com.br 40
TABLE 1 Kolmogorov-Smirnov test for normal distribution tests for non-standard residues.
KOLMOGOROV-SMIRNOV (A)
STATISTICS DF P-VALUE
non-standard
residues 0,073 56 0,200
A = Lilliefors’s significance correction
For homogeneity of variances, the Levene test showed the following values of probability of
significance (p-value):
Psales = 0,114
pCosts = 0,078
pexpenses = 0,410
pPL = 0,099
p operating profit = 0,191
What indicates failure to reject the null hypothesis of the test because the variances are
homogeneous, and have similar shapes for the independent variables (MAROCO, 2005).
The analysis of possible extreme values or outliers showed that the distances Cook showed lower
values than 0.50.
The Cook distance is a measure that is intended to assess the individual influence of each
observation on the estimate of the coefficient vector β. In other words, it evaluates whether the
regression change much if each value were eliminated each time.
Thus, values greater than 0.50 indicate that the data are atypical and aberrant and should be
investigated carefully. For this study, removing each analyzed value would not change regression
(DOBSON, 2002).
The calculations of the values of collinearity (VIF) showed that VIFCosts = 6,046; VIFExpenses =
3.130; VIFPL = 6.906 and VIFOperating profity = 3.337. Therefore, all values are below 10.0,
indicating that the variables keeps good and reasonable independence of one another.
When the values of collinearity are greater than 10.0, the estimated regression coefficients tend to
be inaccurate and the coefficient estimates vary greatly from one sample to another (MAROCO,
2005). However, for the sales value of the VIF variable appears more than 1000 and thereby
varying the model must be eliminated. In fact, the p-value calculation of independence the Student t
test shows no significant (p = 0.434). The interpretation of the value of t when the beta test is not
significant is that it does not contribute to the multiple regression model and, so to speak, is zero
(DOBSON, 2002).
Entering more specifically in the multiple linear regression model, it is seen that the values of the
standardized beta coefficients (coefficients with application of z-scores to facilitate interpretation of
results), indicates that the major contribution is the variable operating profit because beta = 1,526
and the smallest contribution is the variable expenses (beta = -0.275), as shown in Table 2.

Analysis of Differentiation Strategy and Profitability of Business Auto Parts Industry in Brazil
Viviane Chunques Gervasoni / George Bedinelli / Rossi Dirceu da Silva
PMKT – Brazilian Journal of Marketing, Opinion, and Media Research (ISSN 1983-9456 Print and ISSN 2317-0123 Online), São Paulo, Brasil, V.
13, pp. 34-45, October, 2013 – www.revistapmkt.com.br 41
TABLE 2
Standardized values of the multiple linear regression model coefficients.
MODEL STANDARDS COEFICIENTS
BETA T P-VALUE
(Constant) 12,170 0,000
Costs 0,360 2,960 0,005
Expenses -0,275 -3,143 0,003
PL -1,119 -8,606 0,000
Operating profits 1,526 16,882 0,000
a) Dependent variable: profitability.
In addition, to verify the quality of the fitted model should be noted the value of the Pearson
coefficient of determination (R2) (see Table 3). The value of R2 is R2Adjusted and 93.5% (with the
z-score) is 86.5%. Either one or the other indicates an excellent fit (DOBSON, 2002). It is thus
confirmed that the fitted model can be interpreted. Still, the Durbin-Watson test was lower than 2.0
indicating that the model does not auto correlated variables significantly and there are no problems
with the data impossible to interpret the results and to present possible misinterpretations
(DOBSON, 2002).
TABLE 3
Values of the fit of the multiple linear regression model.
a) Predictors: (Constant), operating profits, expenses, costs and pl.
b) Dependent variable: profitability.
Table 3 indicates that corporate profitability is influenced by costs, expenses, operating income and
PL. Among these, the most important factors influencing the profitability are operating income and
costs.
Still, it remains to analyze the residuals of the fitted model. Such analysis is of great importance,
because a condition of acceptance of the regression models is the need of residuals respect a normal
distribution, otherwise there outliers that may indicate poor quality of the adjustments.
Table 4 shows the Kolmogorov-Smirnov test for non-standard residues. The value of probability of
significance (p-value) indicates no difference between the values of the waste in question and a
normal distribution (p = 0.200). Thus, the condition of validity of the model is respected.
TABLE 4 Test for normal distribution by Kolmogorov-Smirnov test for non-standard residues.
KOLMOGOROV-SMIRNOV (A)
STATISTICS DF P-VALUE
Non Standards Residues 0,073 56 0,200
a) Lilliefors’s significance correction.
MODEL R R2ADJUSTED
STANDARD
ERROR
ESTIMATION
DURBIN-
WATSON
1 0,935 a 0,865 0,063 1,402
Analysis of Differentiation Strategy and Profitability of Business Auto Parts Industry in Brazil
Viviane Chunques Gervasoni / George Bedinelli / Rossi Dirceu da Silva
PMKT – Brazilian Journal of Marketing, Opinion, and Media Research (ISSN 1983-9456 Print and ISSN 2317-0123 Online), São Paulo, Brasil, V.
13, pp. 34-45, October, 2013 – www.revistapmkt.com.br 42
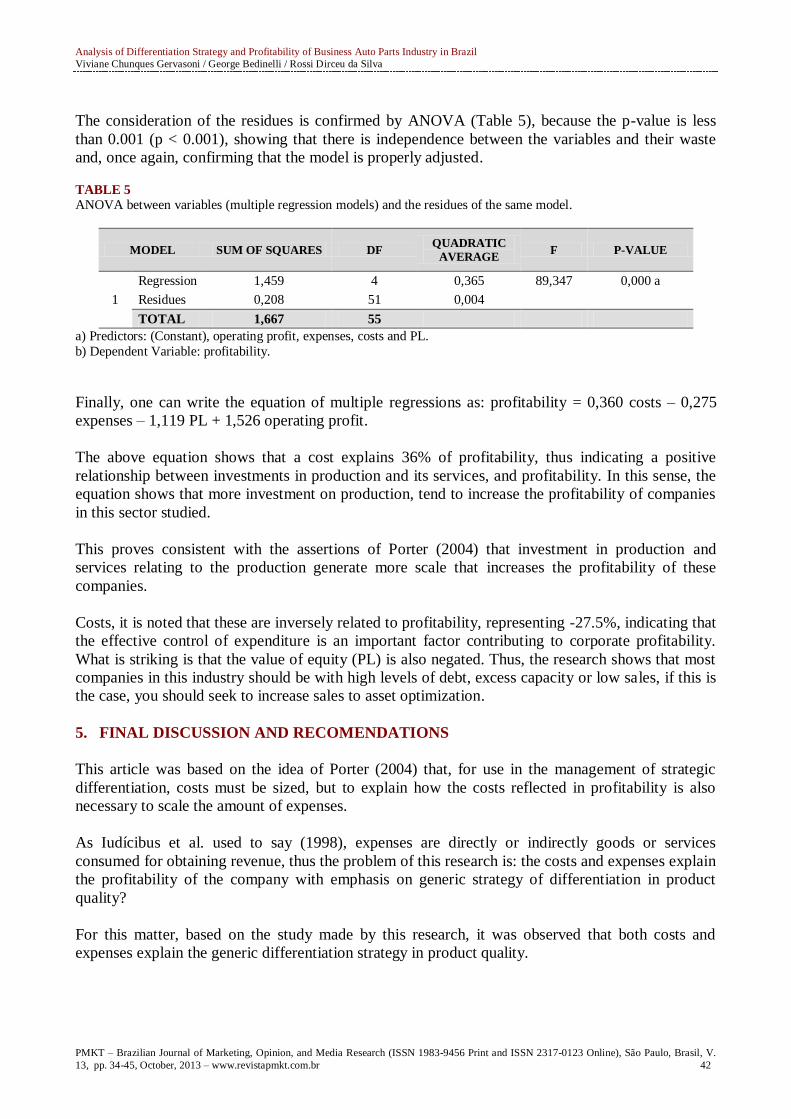
The consideration of the residues is confirmed by ANOVA (Table 5), because the p-value is less
than 0.001 (p < 0.001), showing that there is independence between the variables and their waste
and, once again, confirming that the model is properly adjusted.
TABLE 5
ANOVA between variables (multiple regression models) and the residues of the same model.
MODEL SUM OF SQUARES DF QUADRATIC
AVERAGE F P-VALUE
1
Regression 1,459 4 0,365 89,347 0,000 a
Residues 0,208 51 0,004
TOTAL 1,667 55
a) Predictors: (Constant), operating profit, expenses, costs and PL.
b) Dependent Variable: profitability.
Finally, one can write the equation of multiple regressions as: profitability = 0,360 costs – 0,275
expenses – 1,119 PL + 1,526 operating profit.
The above equation shows that a cost explains 36% of profitability, thus indicating a positive
relationship between investments in production and its services, and profitability. In this sense, the
equation shows that more investment on production, tend to increase the profitability of companies
in this sector studied.
This proves consistent with the assertions of Porter (2004) that investment in production and
services relating to the production generate more scale that increases the profitability of these
companies.
Costs, it is noted that these are inversely related to profitability, representing -27.5%, indicating that
the effective control of expenditure is an important factor contributing to corporate profitability.
What is striking is that the value of equity (PL) is also negated. Thus, the research shows that most
companies in this industry should be with high levels of debt, excess capacity or low sales, if this is
the case, you should seek to increase sales to asset optimization.
5. FINAL DISCUSSION AND RECOMENDATIONS
This article was based on the idea of Porter (2004) that, for use in the management of strategic
differentiation, costs must be sized, but to explain how the costs reflected in profitability is also
necessary to scale the amount of expenses.
As Iudícibus et al. used to say (1998), expenses are directly or indirectly goods or services
consumed for obtaining revenue, thus the problem of this research is: the costs and expenses explain
the profitability of the company with emphasis on generic strategy of differentiation in product
quality?
For this matter, based on the study made by this research, it was observed that both costs and
expenses explain the generic differentiation strategy in product quality.
Analysis of Differentiation Strategy and Profitability of Business Auto Parts Industry in Brazil
Viviane Chunques Gervasoni / George Bedinelli / Rossi Dirceu da Silva
PMKT – Brazilian Journal of Marketing, Opinion, and Media Research (ISSN 1983-9456 Print and ISSN 2317-0123 Online), São Paulo, Brasil, V.
13, pp. 34-45, October, 2013 – www.revistapmkt.com.br 43
Costs explain the profitability by 36% and expenses -27.5%, indicating that a better use of the
expenditure will further contribute to profitability.
The objective of this research was to investigate the relative importance of costs and expenses to
explain the profitability of the company that adopts the generic strategy of differentiation in product
quality of the auto parts industry. The analysis of the data obtained through the multiple linear
regression equation results in:
Profitability = 0,360 costs – 0,275 expenses – 1,119 PL + 1,526 operating profits.
Based on this equation one can conclude that the value of cost explains 36% of the yield factor for
these companies in the industry.
The values of investments have been higher than revenues obtained by them. Therefore, the value
of equity (PL), (-1.119) has declined and expenses have not contributed effectively to the
production of income (-0.275), since the values of costs, namely expenditures made for production
of new goods or services used in production has been constant.
Thus, the operating profit is the amount of profit on the sale of goods or services of the company are
positive, showing that there is profitability. What is suggested as more grounded in the theoretical
aspects equation would be:
Costs are kept or, these expenditures occur in the production in order to seek greater
profitability (ROE).
Reduced costs.
The reflection would be stagnation or increase in equity (PL) and possibly considerable increase in
operating income and profitability (ROE). So when Porter (1989) asserts that the value of the costs
of a company has important implications for the successful differentiation strategy, in this study, for
these businesses, and industry in this period, the statement shown to be feasible in its fullness.
The equation shows that cost is an important factor for profitability, therefore, explains 36% of the
profitability for companies that compete through product differentiation, corroborating the findings
of the author that while companies that compete on differentiation should pay attention to costs.
For these companies, the industry and the successful period of differentiation strategy should be
based on: decrease expenses with the goal of producing revenue, enhance equity, increase operating
income and thus increase profitability (ROE). Costs could be kept in the form that present or
elevated.
6. REFERENCES
ANSOFF, H. I.; MCDONNELL, E. J. Implantando a administração estratégica. 2. ed. São Paulo:
Atlas, 1993.
BAXTER, Mike. Projeto de produto: guia prático para o desenvolvimento de novos produtos. São
Paulo: Edgard Blücher, 2000.

Analysis of Differentiation Strategy and Profitability of Business Auto Parts Industry in Brazil
Viviane Chunques Gervasoni / George Bedinelli / Rossi Dirceu da Silva
PMKT – Brazilian Journal of Marketing, Opinion, and Media Research (ISSN 1983-9456 Print and ISSN 2317-0123 Online), São Paulo, Brasil, V.
13, pp. 34-45, October, 2013 – www.revistapmkt.com.br 44
BM&F BOVEPSA. Empresa para investidores. Disponível em:
<http://www.bovespa.com.br/Empresas/InformacoesEmpresas/FormConsultaEmpresas.asp>.
Acessado em: 27 mai. 2009.
BROWN, S. L.; EISENHARDT, K. M. Product development: past research, present findings, and
future decisions. Academy of Management Review, v. 20, n. 2, p. 343-378, 1995.
CLARK, K. B.; FUJIMOTO, T. Product development performance: strategy, organization and
management in the world auto industry. Boston: Harvard Business School Press, 1991.
CUSUMANO, M. A.; NOBEOKA, K. Strategy, structure and performance in product development:
observations from the auto industries. Research Policy, v. 21, p. 265-293, 1993.
DOBSON, A. J. An Introduction to Generalized Linear Models. 2. ed. Boca Raton: Chapman e
Hall, 2002.
DYER, J. H.; SINGH, H. The relational view: cooperative strategy and sources of
interorganizational competitive advantage. The Academy of Management Review, Briarcliff Manor,
v. 23, n. 4, p. 660-679, out. 1998.
GARVIN, David A. Gerenciando a qualidade: a visão estratégica e competitiva. Rio de Janeiro:
Qualitymark, 1992.
GITMAN, Lawrence J. Princípios de administração financeira. 10. ed. São Paulo: Pearson, 2004.
______.______. 7. ed. São Paulo: Pearson, 1997.
HILL, C. W. L.; JONES, G. R. Strategic Management: an Integrated Approach. Boston: Houghton
Mifflin Company, 1998.
HOFER, Charles W.; SCHENDEL, Dan. Strategy formulation: analytical concepts. Saint Paul,
Minnesota: West Publishing Co., 1978.
IUDÍCIBUS, Sérgio et al. Contabilidade introdutória. 7. ed. São Paulo: Atlas, 1998.
KASSAI, José Roberto; KASSAI, Silvia; SANTOS, Ariovaldo dos. Retorno de investimento:
abordagem matemática e contábil do lucro empresarial. 2. ed. São Paulo: Atlas, 2000.
KESSELER, A. Evolution of supplier relations in European automotive industry: product
development challenge for a first tier supplier. Actes du Gerpisa, n.19, 1997.
KOTLER, Philip; ARMSTRONG, Gary. Princípios de marketing. Rio de Janeiro: LTC, 1999.
LAMENZA, Ademir. Estratégias empresariais: pesquisas e casos brasileiros. São Paulo: Saint
Paul, 2008.
MALHOTRA, Naresh K. Pesquisa de marketing: uma orientação aplicada. 4. ed. São Paulo:
Bookman, 2001.
Analysis of Differentiation Strategy and Profitability of Business Auto Parts Industry in Brazil
Viviane Chunques Gervasoni / George Bedinelli / Rossi Dirceu da Silva
PMKT – Brazilian Journal of Marketing, Opinion, and Media Research (ISSN 1983-9456 Print and ISSN 2317-0123 Online), São Paulo, Brasil, V.
13, pp. 34-45, October, 2013 – www.revistapmkt.com.br 45
MAROCO, J. Análise estatística: com a utilização do SPSS. 2. ed. Lisboa: Silabo, 2005.
MARTINS, E. Contabilidade de custos. 9. ed. São Paulo: Atlas, 2008.
MINTZBERG, H. Strategy Concept: Five Ps for Strategy. California Management Review, v. 30,
n. 1, p.11-24, 1987.
MOKYR, Joel. The lever of riches: tecnological creaticity and economic progress. Nova York:
Oxford University Press. 1990.
NARASIMHAN, Ram; GHOSH, Soumen; MENDEZ, David. A dynamic model of product quality
and pricing decisions on sales response. Decision Sciences, U.S.A., v. 24, n. 5, p. 893-907, 24 set.
1993.
OLIVEIRA, Otávio J. Gestão da qualidade: tópicos avançados. 2. ed. São Paulo: Pioneira
Thomson Learning, 2004.
PRAHALAD. C. K.; HAMEL, G. “The Core Competence of the Corporation”. Harvard Business
Review, v. 68, n. 3, p. 79-91, 1990.
PORTER, M. Estratégia competitiva: técnicas para análise de indústrias e da concorrência. 5. ed.
Rio de Janeiro: Campus, 2004.
______. Vantagem competitiva: criando e sustentando um desempenho superior. Rio de Janeiro:
Campus, 1989.
SENHORAS, Eloi; DIAS, Josimara. Tendências da indústria automotiva brasileira: um estudo do
caso FIAT. Disponível em:
<http://www.ead.fea.usp.br/semead/8semead/resultado/trabalhosPDF/223.pdf>. Acessado em: 27
jan. 2011.
WOMACK, J. P. et al. The machine that changed the world. New York, NY, Maxwell
MacMillian.1990.