
Analysis of Crash Causes, Costs, and … Analysis of Crash Causes, Costs, and Countermeasures 2 . in...
12
Analysis of Crash Causes, Costs, and Countermeasures 1 in Alabama Work Zones 2 Virginia P. Sisiopiku*, Ph.D. Associate Professor. Civil, Construction and 3 Environmental Engineering. University of Alabama at Birmingham. 1075 13 th St S, 4 HOEN 311B, Birmingham, Alabama, 35294-4440. Phone: (205) 934-9912, Fax: 5 (205) 934-9855, Email: [email protected] 6 Ossama E. Ramadan, M.A.Sc. Doctoral Candidate. Civil, Construction and 7 Environmental Engineering. University of Alabama at Birmingham. Email: 8 [email protected] 9 Mohammed I. Eltaher Ismail, M.S.C.E, Civil, Construction and Environmental 10 Engineering. University of Alabama at Birmingham. Email: [email protected] 11 Ozge Cavusoglu, Ph.D. Research Associate. Civil, Construction and 12 Environmental Engineering. University of Alabama at Birmingham. Email: 13 [email protected] 14 ABSTRACT 15 Work zone traffic safety is an important issue as it affects safety of drivers, passengers, and 16 construction workers. In addition, the recent rise in scheduled construction activities necessary to 17 maintain function of highways aggravates the issue. Still, little is known about actual conditions 18 and causes for crashes at work zones in Alabama. Thorough the past five decades, only four 19 studies were performed to investigate crashes in Alabama work zones. The purpose of this study 20 is to investigate crashes in Alabama work zones to identify causes, estimate costs, and research 21 potential countermeasures. The study analyzed Alabama crash records within the five year 22 period from 2008 to 2012. Analysis was performed using the Critical Analysis Reporting 23 Environment (CARE) that has been developed by the Center for Advanced Public Safety at the 24 University of Alabama. Posted speed limit, lighting in dark conditions, work zone traffic control, 25 and human factors were identified as key factors for crashes in Alabama work zones. Costs were 26 reported and countermeasures were identified and summarized. This study is significant for its 27 contribution to existing literature in investigating highway work zone crashes, which will enables 28 researchers to identify unique work zone safety problems. Accordingly, effective 29 countermeasures could be implemented with a potential to save lives of drivers, passengers, and 30 construction workers in the future. 31 Keywords: Crashes, Work Zone Safety, Crash Causes, Countermeasures, Traffic Safety 32 * Corresponding author 33 5th Road Safety and Simulation International Conference
Transcript of Analysis of Crash Causes, Costs, and … Analysis of Crash Causes, Costs, and Countermeasures 2 . in...
Analysis of Crash Causes, Costs, and Countermeasures 1
in Alabama Work Zones 2
Virginia P. Sisiopiku*, Ph.D. Associate Professor. Civil, Construction and 3 Environmental Engineering. University of Alabama at Birmingham. 1075 13th St S, 4
HOEN 311B, Birmingham, Alabama, 35294-4440. Phone: (205) 934-9912, Fax: 5 (205) 934-9855, Email: [email protected] 6
Ossama E. Ramadan, M.A.Sc. Doctoral Candidate. Civil, Construction and 7 Environmental Engineering. University of Alabama at Birmingham. Email: 8
Mohammed I. Eltaher Ismail, M.S.C.E, Civil, Construction and Environmental 10 Engineering. University of Alabama at Birmingham. Email: [email protected] 11
Ozge Cavusoglu, Ph.D. Research Associate. Civil, Construction and 12 Environmental Engineering. University of Alabama at Birmingham. Email: 13
ABSTRACT 15
Work zone traffic safety is an important issue as it affects safety of drivers, passengers, and 16 construction workers. In addition, the recent rise in scheduled construction activities necessary to 17 maintain function of highways aggravates the issue. Still, little is known about actual conditions 18 and causes for crashes at work zones in Alabama. Thorough the past five decades, only four 19 studies were performed to investigate crashes in Alabama work zones. The purpose of this study 20 is to investigate crashes in Alabama work zones to identify causes, estimate costs, and research 21 potential countermeasures. The study analyzed Alabama crash records within the five year 22 period from 2008 to 2012. Analysis was performed using the Critical Analysis Reporting 23 Environment (CARE) that has been developed by the Center for Advanced Public Safety at the 24 University of Alabama. Posted speed limit, lighting in dark conditions, work zone traffic control, 25 and human factors were identified as key factors for crashes in Alabama work zones. Costs were 26 reported and countermeasures were identified and summarized. This study is significant for its 27 contribution to existing literature in investigating highway work zone crashes, which will enables 28 researchers to identify unique work zone safety problems. Accordingly, effective 29 countermeasures could be implemented with a potential to save lives of drivers, passengers, and 30 construction workers in the future. 31
Keywords: Crashes, Work Zone Safety, Crash Causes, Countermeasures, Traffic Safety 32
* Corresponding author 33
5th Road Safety and Simulation International Conference
Sisiopiku et al. 2
INTRODUCTION 34 In recent years, the focus of many states has shifted from building new highways to maintenance 35 and rehabilitation, which gives rise to scheduled construction activities at work zones. Such 36 activities mandate lane closures and disruption of traffic to provide a work space (1). A recent 37 report, cited by Yang et al. (2), stated that “approximately twenty percent of the U.S. highways 38 are under construction during the peak construction season, which involve over three thousand 39 work zones. About twelve billion vehicle miles of travel a year will be through active work 40 zones and travelers can expect to encounter an active work zone one out of every hundred miles 41 driven on the highway system. Consequently, about 24 percent of the non-recurring delays and 42 10 percent of overall delays on freeways were attributed to work zones and 87,606 crashes 43 occurred in work zones that led to over 37,000 injuries and 576 fatalities during 2010.” 44
Table 1 summarizes work zone related fatalities in the US within the period 2008 to 2012 (3). 45 Drivers and passengers represented 85% of those killed in work zone crashes (4). While the 46 majority of victims are drivers, the National Safety Council reports (5), show that more than 100 47 road construction workers are killed in construction zones every year, 50% of which are killed by 48 motor vehicles. 49
Table 1: Work Zone Related Fatalities in the US, 2008-2012 (7) 50
2008 2009 2010 2011 2012 Total
US Work Zone Related Crashes 716 680 586 590 609 3,181
51
Driver distraction and excessive merging are usually cited as the main cause of work zone 52 crashes; however, unlike other non–work zone related safety studies, there has not yet been a 53 comprehensive review and assessment of methodological approaches for work zone safety (2). 54 Mitigating mobility and safety impacts of work zones has become one of the overwhelming 55 challenges that traffic engineers and researchers have to confront (6). Studying the characteristics 56 of work zone crashes is the first step towards improving work zone safety. Investigating highway 57 work zone fatal crashes enables researchers to identify unique work zone safety problems. 58 Accordingly, effective countermeasures could be developed to save lives of drivers, passengers, 59 and construction workers. 60
Literature was expected to be abundant on such demanding topic. Yet, there is a challenge in 61 identifying literature that strictly differentiates between work zone related and non-work zone 62 related crashes. Recently, Yang et al. (2) performed an extensively comprehensive literature 63 review of work zone crash data analysis and modeling. They identified 81 articles within the 64 period 1962 to 2013 that studied work zone related crashes, four of which were concerned with 65 Alabama. Evidently, there is a deficiency in research of crashes in Alabama work zones. To 66 overcome this deficiency, this study presents an analysis of the causes of crashes in Alabama 67 work zones, and investigates potential countermeasures. Analysis spanned over a five years 68 period, and attention was given to contributing factors and conditions present at work zone crash 69 locations. Appropriate engineering, education, and enforcement countermeasures were proposed 70 in order to address the work zone safety issue in the future. 71
5th Road Safety and Simulation International Conference
Sisiopiku et al. 3
METHODS 72 For the analysis period, 2008 to 2012, Alabama had an average of 888 fatalities in crashes, of 73 which an average of 10 fatalities were work zone related (7). A recent analysis indicated that 74 construction workers are the victims on nearly 16% of all crash fatalities at work zones (8). In 75 addition, a comparison between the ratios of work zone crash fatalities to all crash fatalities 76 revealed that Alabama has 43.4% less fatalities than all US. Still, as the Alabama traffic safety 77 community is moving toward a Zero Deaths goal, efforts have to intensify to reduce the number 78 of fatalities in Alabama roadways and eliminate fatal crashes at work zones in the years to come. 79 In doing so, better understanding of contributing factors to such crashes is important in 80 developing engineering, education, and enforcement strategies for meeting the Zero Deaths goal. 81
Analysis of historical crash data in Alabama was performed to determine the extent of work zone 82 crashes and identify relevant risk factors. Crash records focusing on work zone related crashes 83 were analyzed using Critical Analysis Reporting Environment (CARE) over the five year period, 84 2008 to 2012. CARE is a data analysis software package developed by the Center for Advanced 85 Public Safety at the University of Alabama and is designed for problem identification and 86 countermeasure development in traffic safety applications (9). The records on CARE are 87 constructed based on the police reports that were filled out at the crash sites and provide detailed 88 information about the conditions that contributed to the crash and severity. CARE provides 89 filters, based on which, specific records can be obtained including work zone presence. Using 90 such records, charts and graphical displays were produced for selected variables in the database. 91
Using CARE capabilities, summary information for the subset of the database that related to 92 work zone crashes over the 5-year study period was retrieved. Table 2 lists five main categories 93 defined by 23 variables that were considered in the analysis, which include responsible driver 94 information, time of occurrence, climatic environmental information, crash type and related 95 information, and roadway conditions (9). Frequency output of any variable or a cross-tabulation 96 of any two variables was used to process the data and help to understand and interpret them. 97
Table 2: Main Categories of Work Zone Crash Data in CARE 98
Variables Category
Age; Gender Responsible Driver
Time; Day; Month; Year Time Information
Light Condition; Weather Condition; Road Surface Condition
Climatic Environment
Vehicle Maneuver Before Crash; Crash Severity; Crash Type; Vehicle Body Type; Number of Vehicles Involved
Crash Information
Road Class; Road Character; Number of Lanes; Speed Limit; Crash Location; Surface Type; Road Special Feature; Area Information; Traffic Control
Roadway Condition
5th Road Safety and Simulation International Conference

Sisiopiku et al. 4
RESULTS AND DISCUSSION 99 This section presents the analysis results and discussion of crash causes, costs, and 100 countermeasures. Understanding the crash causes, and associated costs, as well as potential 101 countermeasures will facilitate further research of work zone crashes in an effort towards a zero-102 deaths policy. 103
Crash Causes 104 Responsible Driver Information 105 This category includes basic information about the driver responsible for the crash occurrence. 106 Age and gender were the two variables related to responsible driver category. Age was divided 107 into seven groups and gender contained two types: male and female. Figure 1 presents the age 108 distribution of the drivers responsible for work zone crashes between 2008 and 2012 in the state 109 of Alabama. The results show that age group 25-34 years had the highest share of work zone 110 crashes with 18.9%, followed by 35-44 years with 16.2%, and 45-54 years had 14.2%. With 111 respect to gender, approximately 58% of the drivers responsible for work zone crashes were 112 males and 37% were female drivers, with 5% reported as “unknown.” 113
114 Figure 1: Age Distribution of Responsible Drivers 115
Time Information 116 This category included time-related information such as the time and date of the crash 117 occurrence. Figure 2 shows the work zone crash distributions by hour. Results indicate that the 118 highest crash frequency at work zone sites occurred during the daytime non-peak period 119 10:00am to 4:00pm, with 937 crashes/hr reported over the study period. In addition, 662 120 crashes/hr were reported during the AM peak (6:00 to 9:00am), and 676 crashes/hr were reported 121 during the PM peak (4:00to 8:00 pm). Furthermore, results indicate that most work zone crashes 122 occur from 3:00-4:00 pm (8.9%) followed by the lunch break, noon-1:00 pm (7.5%). 123 Surprisingly, nighttime crashes (i.e., those occurring from 12:00-6:00 am and 8:00-12:00 am 124 combined) were much lower (only 197 crashes/hr). These results were contrary to the 125 expectation that typically associates heavier traffic and nighttime conditions with increased crash 126 risk. 127
128
0%
5%
10%
15%
20%
Age
5th Road Safety and Simulation International Conference

Sisiopiku et al. 5
129 Figure 2: Work Zone Crash Distributions over Time of Day 130
Figure 3 illustrates the distribution of work zone crashes by month of year. As expected, more 131 crashes occurred between April and November, a period that coincides with the roadway 132 constructions season in Alabama. 133
134 Figure 3: Distribution of Work Zone Crashes by Month of the Year 135
136 Climatic Environment Information 137 The climatic environmental information refers to the environmental conditions such as light, 138 weather, and road surface conditions at the work zone site when the crash happened. In CARE, 139 light conditions included 14 types based on the factors that affecting visibility like natural 140 brightness (e.g., daylight, dusk, dawn, and darkness) and streetlight. Weather conditions were 141
0%
2%
4%
6%
8%
10%
12:0
0-12
:59
am
1:00
-1:5
9 am
2:00
-2:5
9 am
3:00
-3:5
9 am
4:00
-4:5
9 am
5:00
-5:5
9 am
6:00
-6:5
9 am
7:00
-7:5
9 am
8:00
-8:5
9 am
9:00
-9:5
9 am
10:0
0-10
:59
am
11:0
0-11
:59
am
Noo
n-12
:59
pm
1:00
-1:5
9 pm
2:00
-2:5
9 pm
3:00
-3:5
9 pm
4:00
-4:5
9 pm
5:00
-5:5
9 pm
6:00
-6:5
9 pm
7:00
-7-5
9 pm
8:00
-8:5
9 pm
9:00
-9:5
9 pm
10:0
0-10
:59
pm
11:0
0-11
:59
pm
Time of Occurence
0%
2%
4%
6%
8%
10%
Month
5th Road Safety and Simulation International Conference
Sisiopiku et al. 6
considered in 13 weather types that might have impacts on traffic safety such as clear, cloudy, 142 fog, mist, rain, sleet, snow, windy, etc. Road surface conditions also consider 13 types to reflect 143 the situations of road surfaces. 144
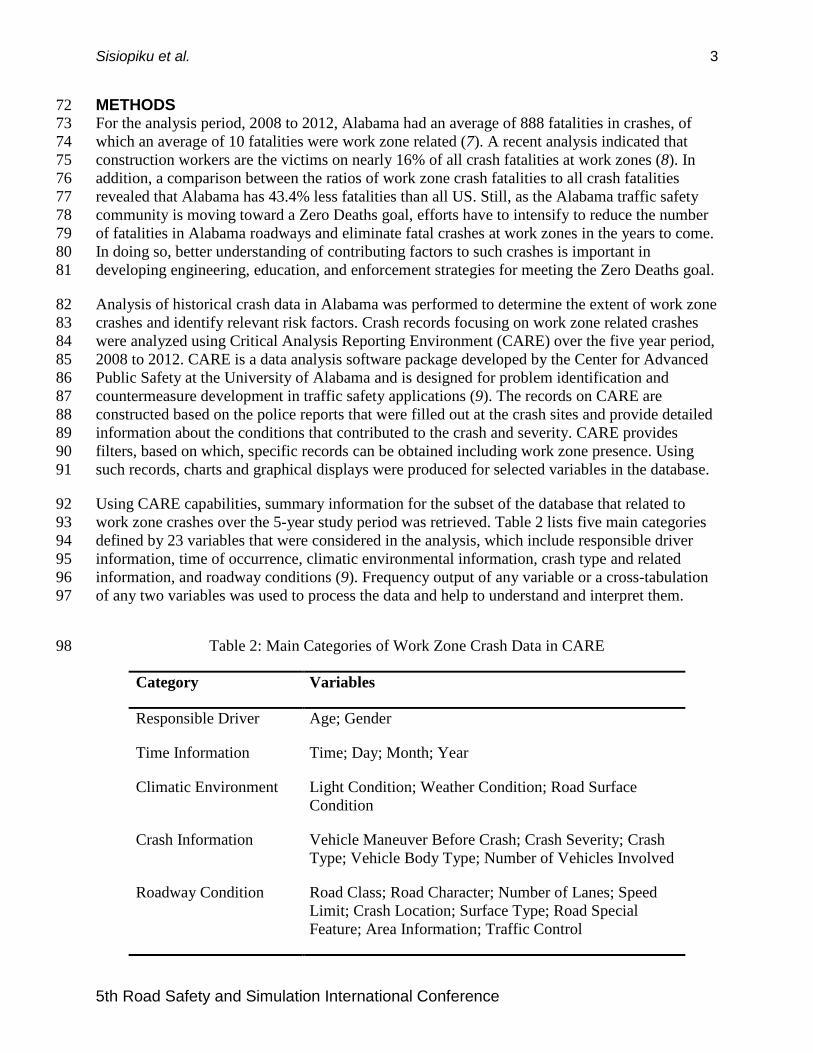
Results show that 76% of the work zone crashes happened in daylight conditions, as illustrated 145 by Figure 4. Under dark conditions, 1,411 work zone crashes were reported when the roadway 146 was not lighted, compared to 472 crashes when the roadway was lighted. This indicates the 147 importance of providing additional lighting at work zones operating at nighttime to reduce the 148 likelihood of crashes occurrence. 149
150 Figure 4: Work Zone Crash Distributions Based on Light Conditions 151
Another factor considered in the analysis was weather conditions. The crash data analysis 152 indicated that 67.2% of crashes in work zones happened in clear weather, 20.8% under cloudy 153 conditions, and 9.8% under rainy conditions. As for the effect of road surface conditions on work 154 zone crashes, results indicate that 84.3% of crashes in work zones occurred when road pavement 155 was dry and only 14.3% of total crashes occurred when the road was wet, with minimal attribute 156 to ice and snow due to Alabama ambient weather conditions. 157
Crash Information 158 The crash information category for work zone crashes in CARE includes vehicle maneuver 159 before crash, crash severity, crash type, vehicle body type, and number of vehicles involved. The 160 before-crash vehicle maneuver includes several values such as going straight, changing lane, 161
76.21%
0%
20%
40%
60%
80%
100%
Dayl
ight
Dusk
Daw
n
Dark
-Roa
dway
Lig
hted
Dark
-Roa
dway
Not
Lig
hted
Dark
-Unk
now
n Ro
adw
ayLi
ghtin
g
Dark
-Spo
t Illu
min
atio
n O
ne S
ide
of R
oadw
ay
Dark
-Spo
t Illu
min
atio
n Bo
thSi
des o
f Roa
dway
Dark
-Con
tinuo
us L
ight
ing
One
Side
of R
oadw
ay
Dark
-Con
tinuo
us L
ight
ing
Both
Side
s of R
oadw
ayLight Conditions
5th Road Safety and Simulation International Conference

Sisiopiku et al. 7
slowing down, overtaking another vehicle, etc. The crash severity has three classical types, 162 namely fatal, injury, and property damage only severity classifications. Other crash types include 163 single vehicle crashes, rear end crashes, and sideswipe crashes, among others. The vehicle body 164 types were classified into many categories such as heavy trucks, passenger cars, motorcycles, 165 etc. The number of vehicles involved in a crash was considered using the actual number of 166 vehicles on record. 167
Results indicate that approximately 58% of crashes occurred while the vehicle was moving 168 straight before the crash and 10% happened while the vehicle was slowing or stopped. 169 Approximately 6% of crashes took place as the main vehicle was changing lanes and another 6% 170 while the vehicle was turning left. In addition, results show that 48% of work zone crashes in 171 Alabama involved passenger cars and 24% involved pick- up trucks (four-tire light trucks), while 172 only 4.3% involved tractors or semi-trailers. These results indicate the misconception of over-173 representing trucks in work zone crashes. 174
Figure 5 summarizes work zone crashes by crash type, and indicates the most frequent type of 175 collision at work zones involving two vehicles is the rear end collision with 32% followed by 176 sideswipe collision with 8%. Rear end collisions are often associated with lower travel speeds 177 while the sideswipe collisions are associated with lane changing/merging maneuver. It is also 178 observed that the single vehicle crashes account for 1 out of every 7 work zone crashes, or 15%. 179 These results suggest that taking strong measures to prevent rear end crashes as well as single 180 vehicle crashes would greatly improve the safety of work zones in the future. 181
182 Figure 5: Work Zone Crashes by Crash Types 183
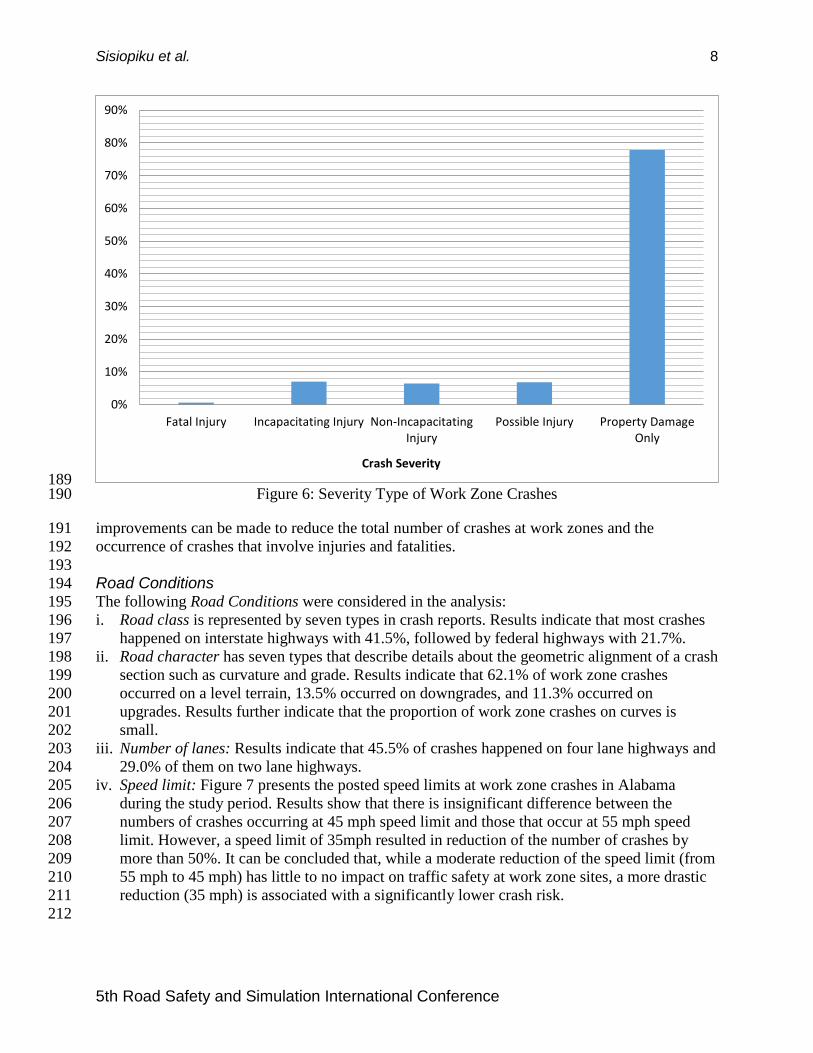
As illustrated by Figure 6, the majority of work zone crashes in Alabama are property damage 184 only crashes representing 77.8%, followed by incapacitating injury (7.0%), possible injury 185 (6.5%), and non-incapacitating injury (6.8%). Over the study period, 84 fatal crashes occurred 186 representing 0.65% of the total work zone crashes. These numbers show that while thousands of 187 crashes occur at work zones every year, the vast majority of them are property damage only. Still 188
0%
5%
10%
15%
20%
25%
30%
35%
Crash Type
5th Road Safety and Simulation International Conference
Sisiopiku et al. 8
189 Figure 6: Severity Type of Work Zone Crashes 190
improvements can be made to reduce the total number of crashes at work zones and the 191 occurrence of crashes that involve injuries and fatalities. 192 193 Road Conditions 194 The following Road Conditions were considered in the analysis: 195 i. Road class is represented by seven types in crash reports. Results indicate that most crashes 196
happened on interstate highways with 41.5%, followed by federal highways with 21.7%. 197 ii. Road character has seven types that describe details about the geometric alignment of a crash 198
section such as curvature and grade. Results indicate that 62.1% of work zone crashes 199 occurred on a level terrain, 13.5% occurred on downgrades, and 11.3% occurred on 200 upgrades. Results further indicate that the proportion of work zone crashes on curves is 201 small. 202
iii. Number of lanes: Results indicate that 45.5% of crashes happened on four lane highways and 203 29.0% of them on two lane highways. 204
iv. Speed limit: Figure 7 presents the posted speed limits at work zone crashes in Alabama 205 during the study period. Results show that there is insignificant difference between the 206 numbers of crashes occurring at 45 mph speed limit and those that occur at 55 mph speed 207 limit. However, a speed limit of 35mph resulted in reduction of the number of crashes by 208 more than 50%. It can be concluded that, while a moderate reduction of the speed limit (from 209 55 mph to 45 mph) has little to no impact on traffic safety at work zone sites, a more drastic 210 reduction (35 mph) is associated with a significantly lower crash risk. 211 212
0%
10%
20%
30%
40%
50%
60%
70%
80%
90%
Fatal Injury Incapacitating Injury Non-IncapacitatingInjury
Possible Injury Property DamageOnly
Crash Severity
5th Road Safety and Simulation International Conference

Sisiopiku et al. 9
213 Figure 7: Posted Speed Limits at Work Zone Crash Locations 214
215 v. Traffic control is represented through 11 types of traffic control devices. Results indicate that 216
half of all crashes in work zones occurred at sites that were not controlled. Accordingly, 217 absence of traffic control can be viewed as a contributing factor in work zone crashes. In 218 addition, proper work zone traffic control may have a positive impact on traffic safety at 219 work zones. 220
Crash Costs 221 Crash costs at work zones are difficult to assess due to the wide range of cost categories and 222 items involved in such crashes. Coburn et al. (10) conducted a comprehensive study to estimate 223 costs associated with crashes at work zones. Their average comprehensive results were $542,533 224 for incapacitating crashes in work zones, $147,536 for non-incapacitating crashes, and $86,943 225 for possible injury crashes. Their study excluded fatal crashes due to relatively small sample 226 sizes, and PDO crashes were defaulted to the FHWA value of $10,956, all in 2010 USD. 227
Countermeasures 228 Analysis of crashes in Alabama work zones for the period 2008 to 2012, provided valuable 229 insight about the nature of such crashes. The most relevant causes of crashes in Alabama work 230 zones were found to be: 231 • Posted speed limit 232 • Lighting in dark conditions 233 • Work zone traffic control, and 234 • Human factors 235
Countermeasures that consider these causes are likely to result in improved traffic safety in 236 Alabama work zones. Table 3 summarizes these countermeasures in three categories: 237 engineering, education, and enforcement, through evaluating 5 risk categories of work zone 238 crashes. 239
0%
5%
10%
15%
20%
25%
30%
Speed Limit
5th Road Safety and Simulation International Conference

Sisiopiku et al. 10
Table 3: Work Zone Safety Improvement Recommendations 240
Risk Type Risk Description Safety Improvement Recommendation
High-risk drivers
Male drivers Safety education
Drivers between 25-64 Safety education
High-risk time periods
Daytime peak hours (06:00 – 10:00 am and 03:00– 7:00 pm)
Safety education and traffic control enforcement
Nighttime (8:00 pm – 6:00 am)
Illumination or retro-reflective devices
Slow-construction season (November – March)
Routine traffic control inspection and public information
High-risk locations
Urban interstate 4-lane highways; Speed limits from 45 to 55 mph
Effective speed control devices and speed limit enforcement
Complex geometric alignments Developing special traffic controls for complex geometric alignment
Most common crash types
Multi-vehicle collisions (rear-end) Effective speed control devices and speed limit enforcement
Truck involved crashes Safety education, speed control, and work-zone geometric design with enough space for heavy truck maneuver
Driver errors
Inattentive driving Devices such as flashing lights or temporary raised pavement markers in the advance warning area
Misjudgment/disregarded traffic controls
Traffic control enforcement and avoiding confusing traffic control signs/signals
241
The following sub-sections briefly discuss the proposed counter measures as presented in the 242 aforementioned table. 243
Engineering 244 Clear guidance to drivers through proper signage and efficient work zone traffic control 245 strategies are expected to have a major positive impact on traffic safety at work zones. Dynamic 246 work zone traffic control and dynamic merge control strategies that adapts to traffic flow 247 conditions should be considered whenever and wherever feasible. In addition, there is an 248 apparent need for innovative speed limit enforcement solutions in work zones. Maintaining 249
5th Road Safety and Simulation International Conference

Sisiopiku et al. 11
relatively low speeds throughout the work zone (35 mph when appropriate) is important for 250 protecting construction workers and the traveling public, and reducing the severity of potential 251 crashes. The dominance of rear-end collisions in injury crashes indicates a strong association 252 between speeds and work zone crashes. 253
Improved visibility is an important factor for traffic safety at work zones in Alabama. It is 254 recommended to install additional illumination or reflector devices in work zones to improve the 255 visibility under dark conditions. In addition, temporary raised pavement or transverse markings 256 may help to alert drivers in advance when approaching work zones. Traditional methods like 257 flags and flasher arrows should not be ignored. 258
Education 259 Driver errors are a major contributing factor to all traffic crashes, including work zone related 260 crashes. Therefore, driver education is important to raise awareness of safe driving practices at 261 work zones. Training programs and courses that teach drivers about the consequences of reckless 262 driving, in general, and the importance of complying with work zone regulations, in particular, 263 are recommended. Increasing knowledge and awareness of work zones by disseminating work 264 zone safety information to travelers is also important. Work zone awareness campaigns are also 265 recommended to help inform the public about the complexities of driving through work zones 266 and the importance of compliance with work zone regulations. 267
Enforcement 268 Drivers tend to strictly abide by traffic laws when the presence of traffic law enforcement is 269 perceived. In addition, the perceived presence of traffic law enforcement provides traffic calming 270 effect similar to that provided by traffic calming devices. The need for innovative enforcement 271 techniques, tools, and technologies is evident. Enforcement costs are significant within any 272 agency or project, and this adds to the challenge of the development of cost-effective 273 enforcement strategies. However, enforcement should be used to achieve a specific objective, 274 and the implementation strategy should be consistent with that objective (11). 275
CONCLUSION 276 Crash records in Alabama work zones were analyzed for a 5 years period to present a clear and 277 objective understanding of the nature of crashes in Alabama work zones. Results show that the 278 vast majority of crashes occurring in Alabama work zones are property damage only. Still, given 279 the commitment of the state of Alabama toward Zero Traffic Deaths, additional engineering, 280 education, and enforcement improvements can be made to reduce the total number of crashes at 281 work zones and the occurrence of crashes that involve injuries or fatalities. 282
Specifically, the analysis showed that rear end crashes are the most common type of work zone 283 crashes in Alabama. Moreover, the frequency of crashes in work zones with speed limits above 284 35 mph was significantly higher. These findings pinpoint to an association between high speeds 285 and work zone crash occurrence. To address this issue, better speed control at work zone is 286 recommended through appropriate traffic control and enforcement strategies. The analysis also 287 revealed that under dark conditions, lack of lighting contributes to an increase in the frequency 288 and severity of crashes. This finding shows the importance of providing good lighting at work 289 zones operating in the evening and night hours in order to reduce the likelihood of crash 290
5th Road Safety and Simulation International Conference

Sisiopiku et al. 12
occurrence. In addition, it was observed that most of the work zone crashes occur due to driver 291 errors. Accordingly, driver education and training on proper driving behavior at work zones is 292 essential in preventing such crashes. Moreover, results emphasize the importance of traffic 293 control, as it is the single most important measure that can be implemented to address traffic 294 safety concerns at work zones. 295
This paper serves as a useful reference to transportation stakeholders interested in improving 296 work zone traffic safety for workers, motorists, and other highway users through work zone 297 design and control interventions and increased motorists awareness and compliance to work zone 298 regulations. 299
REFERENCES
1. Wei, H. et al. Synthesis of Unconventional Dynamic Merge Metering Traffic Control for Work Zones. Open Transportation Journal, Vol. 4, 2010, pp. 52-60.
2. Yang, H. et al. Work Zone Safety Analysis and Modeling: A State-of-the-Art Review. Proceedings of the Transportation Research Board 93rd Annual Meeting, Washington, DC, 2014.
3. Rocky Mountain Insurance Information Association. Construction Zone Safety. http://www.rmiia.org/auto/traffic_safety/Construction_Zone_Safety.asp. 2014.
4. Federal Highway Administration. Work Zone Safety for Drivers. Publication FHWA-SA-03-012. Federal Highway Administration, Washington, DC, 2003.
5. ADTSEA Driver Education Curriculum 2.0. The American Driver and Traffic Safety Education Association (ADTSEA), 2011.
6. Bai, Y. and Y. Li. Determining Major Causes of Highway Work Zone Accidents in Kansas. Publication KU-05-1. Kansas Department of Transportation, Topeka, Kansas, 2006.
7. American Road and Transportation Builders Association (ARTBA) and Texas A&M Transportation Institute (TTI). The National Work Zone Safety Information Clearinghouse, Work Zone Fatalities: Work Zone Fatalities by Year and State. https://www.workzonesafety.org/crash_data/workzone_fatalities. 2013.
8. Pegula, S. M. An analysis of fatal occupational injuries at road construction sites, 2003–2010. Monthly Labor Review, 2013, Retreived from http://www.bls.gov/opub/mlr/2013/article/an-analysis-of-fatal-occupational-injuries-at-road-construction-sites-2003-2010.htm.
9. Critical Analysis Reporting Environment (CARE), Ver. 9.0. Center for Advanced Public Safety, Tuscaloosa, AL, 2011. Computer Software.
10. Coburn, J. S. et al. Injury Outcomes and Costs for Work Zone Crashes. Proceedings of the Transportation Research Board 92nd Annual Meeting, Washington, DC, 2013.
11. Ullman, G. L. et al. Traffic Enforcement Strategies for Work Zones. National Cooperative Highway Research Program (NCHRP) Reports, Publication 746. Transportation Research Board, Washington, DC, 2013.
5th Road Safety and Simulation International Conference


![Kegworth Air disaster Example of multiple levels of analysis What causes a plane to crash? [1 min.]](https://static.fdocuments.us/doc/165x107/56649dda5503460f94ad105e/kegworth-air-disaster-example-of-multiple-levels-of-analysis-what-causes-a.jpg)


