Analysis of CIVMAR Attrition and the Role of Shore Leave
46
4825 Mark Center Drive • Alexandria, Virginia 22311-1850 CRM D0013980.A4/1REV May 2006 Analysis of CIVMAR Attrition and the Role of Shore Leave Michael J. Moskowitz • Benjamin C. Horne
Transcript of Analysis of CIVMAR Attrition and the Role of Shore Leave

4825 Mark Center Drive • Alexandria, Virginia 22311-1850
CRM D0013980.A4/1REVMay 2006
Analysis of CIVMAR Attrition and the Role of Shore Leave
Michael J. Moskowitz • Benjamin C. Horne

This document represents the best opinion of CNA at the time of issue. It does not necessarily represent the opinion of the Department of the Navy.
Approved for Public Release; Distribution Unlimited. Specific authority: N00014-05-D-0500. For copies of this document call: CNA Document Control and Distribution Section at 703-824-2123.
Copyright © 2006 The CNA Corporation
Approved for distribution: May 2006
Henry S. Griffis, DirectorWorkforce, Education and Training TeamResource Analysis Division

Contents
Executive summary . . . . . . . . . . . . . . . . . . . . . . . . 1
Background . . . . . . . . . . . . . . . . . . . . . . . . . . . . 3MSC shore leave policies. . . . . . . . . . . . . . . . . . . 3Other types of leave for mariners . . . . . . . . . . . . . . 3Why MSC might want to increase shore leave . . . . . . . 4Initiatives . . . . . . . . . . . . . . . . . . . . . . . . . . . 4Past studies . . . . . . . . . . . . . . . . . . . . . . . . . . 5
Is CIVMAR compensation comparable with industry? [4] . . . . . . . . . . . . . . . . . . . . . . 5
Compensation and unlicensed CIVMAR attrition . . 6
Data and methodology . . . . . . . . . . . . . . . . . . . . . . 7Definition of attrition . . . . . . . . . . . . . . . . . . . . 7
Attrition data . . . . . . . . . . . . . . . . . . . . . . 9Data issues and attrition calculation. . . . . . . . . . . . . 10Separation survey data . . . . . . . . . . . . . . . . . . . . 10Shore leave data . . . . . . . . . . . . . . . . . . . . . . . 11Shore leave methodology . . . . . . . . . . . . . . . . . . 11Definition of attrition problem . . . . . . . . . . . . . . . 12
Attrition findings . . . . . . . . . . . . . . . . . . . . . . . . . 13Unlicensed vs. licensed attrition. . . . . . . . . . . . . . . 13Unlicensed rating and attrition . . . . . . . . . . . . . . . 14Attrition based on tenure . . . . . . . . . . . . . . . . . . 15New mariners vs. experienced mariners . . . . . . . . . . 16Coast and attrition . . . . . . . . . . . . . . . . . . . . . . 16Overall MSC experience level . . . . . . . . . . . . . . . . 18Conclusion . . . . . . . . . . . . . . . . . . . . . . . . . . 19
Attrition and shore leave . . . . . . . . . . . . . . . . . . . . . 21Visualizing attrition . . . . . . . . . . . . . . . . . . . . . 21Use rates increase with tenure . . . . . . . . . . . . . . . . 23
i
Surveys show mixed results for shore leave . . . . . . . . . 25Separation surveys . . . . . . . . . . . . . . . . . . . 25Time series surveys . . . . . . . . . . . . . . . . . . . 26
Impact of shore leave on attrition . . . . . . . . . . . . . . 26
Conclusion . . . . . . . . . . . . . . . . . . . . . . . . . . . . . 33
References . . . . . . . . . . . . . . . . . . . . . . . . . . . . . 35
List of figures . . . . . . . . . . . . . . . . . . . . . . . . . . . 37
List of tables . . . . . . . . . . . . . . . . . . . . . . . . . . . . 39
ii

Executive summary
In the past few years, Military Sealift Command (MSC) leadership has discussed with its mariners the idea of increasing shore leave. The most recent initiative proposed increasing shore leave using the justi-fication that the increase is necessary to ensure retention and recruit-ment of quality mariners. This initiative was not approved by the Office of Management and Budget (OMB) because it required empirical evidence of the impact of shore leave on retention and recruitment.
MSC asked CNA to determine whether increasing shore leave for Civil Service Mariners (also known as civilian mariners, or CIVMARs) leads to reduced attrition rates. We were asked to begin by analyzing the existence and extent of an MSC attrition problem. If attrition were not found to be a problem, further analysis would not be neces-sary. If it were found to be a problem, however, we would analyze the relationship between shore leave and attrition, measuring the reten-tion effects of increasing shore leave. CNA would then draw up vari-ous shore leave proposals and draft illustrative legislation in support of the best proposal. MSC officials could then present the proposal to Congress.
To determine the effects of shore leave on attrition, this study consid-ered the following:
• Attrition trends in MSC over the past 5 years by coast, rating, and tenure
• Links between shore leave and attrition
• The effect of MSC shore leave policies on attrition.
Since 1999, MSC has used retention allowances to reduce attrition. These retention allowances are targeted to certain critical ratings to reduce attrition in these ratings. These targeted bonuses have been successful in lowering attrition among the targeted ratings since
1
1999, but there is still concern that attrition is a problem. It is possible that there is a connection between leave and attrition because depar-ture surveys of those leaving MSC employment indicate some unhap-piness with leave policies, and annual leave earnings for CIVMARs fall below commercial industry's levels. However, the impact of additional CIVMAR shore leave on mariner attrition has not been fully explored.
There are different ideas as to what constitutes an attrition "prob-lem." We discuss some of the theories and attempt to address this issue by looking at a few specific ways in which attrition could be a problem.
Our research and analysis did not yield convincing evidence of a sig-nificant attrition problem. Accordingly, the MSC council decided not to pursue an increase in shore leave at this time, and we did not con-tinue the analysis to the end steps of supporting the drafting of legis-lation. We did, however, examine some relationships between shore leave and attrition to evince any correlation and provide more infor-mation to MSC should this issue arise again.
We did find a negative correlation between shore leave balances and attrition. We found that those mariners who attrite typically have lower shore leave balances, and those that stay typically have higher shore leave balances. Based on CNA’s previous analysis of CIVMAR attrition we conclude that increasing shore leave would reduce attri-tion, given that shore leave is a form of compensation and the rela-tionship between compensation and attrition is negative.
This research memorandum begins with background information on MSC shore leave and attrition, including a summary of the previous studies and results. In the following section, we detail the data we used and the methodology for computing attrition and analyzing shore leave. The next section explains the attrition results, followed by a section comparing shore leave with attrition. We conclude by summarizing our results.
2

Background
MSC shore leave policies
Shore leave is compensatory leave earned above and beyond annual leave. It is tied to time spent aboard ship, to account for the hardships inherent in serving at sea. The shore leave benefit is codified in the United States Code, which states that shore leave can be earned “at a rate not to exceed 2 days for each 30 calendar days” of qualifying ser-vice (see [1]). This benefit is further regulated in the Code of Federal Regulations, which notes that shore leave is earned at the rate of 1 day of shore leave for every 15 days spent assigned to a ship on an extended voyage (see [2]). There is no ceiling on shore leave accrual, but shore leave cannot be converted into pay at any point in a mari-ner's career, including at separation.
Other types of leave for mariners
In addition to shore leave, mariners can accrue and use several other types of leave. As federal employees, CIVMARs earn annual leave biweekly based on tenure. Mariners with less than 3 years of credit-able service (government service) earn 4 hours each pay period (every 2 weeks), equating to 13 days of annual leave per year. Mari-ners with 3 to 15 years of creditable service will earn 6 hours each pay period, totaling 20 days of annual leave per year. Mariners with more than 15 years of creditable service accrue 8 hours each pay period, or 26 days per year. The maximum amount of annual leave that may be carried over each calendar year is 360 hours. Unlike shore leave, how-ever, annual leave can be cashed in upon termination from MSC.
CIVMARs also accrue sick leave at a constant rate of 4 hours biweekly. Sick leave has no maximum and no trade-in value and is to be used only for medical reasons.1 Shore leave, annual leave, and sick leave are the three main types of compensatory leave and the types of leave
3
most commonly used by mariners. Other types of compensatory leave include court leave; other types of noncompensatory leave include unpaid medical leave and leave without pay.
Why MSC might want to increase shore leave
MSC is required by law to provide wages comparable to those in com-mercial industry. As is specifically stated in [3], "the pay of officers and members of crews of vessels... shall be fixed and adjusted from time to time as nearly as is consistent with the public interest in accor-dance with prevailing rates and practices in the maritime industry." Although CIVMAR pay is legally required to be comparable to indus-try pay, the law does not address benefits. In practice, MSC offers many benefits similar to those in commercial industry, as well as some that the maritime industry does not offer. But some benefits still lag behind. The differential in terms of leave accrual is especially notable and is the one factor that renders CIVMAR and industry compensa-tions so disparate [4].
Initiatives
MSC leadership has discussed increasing shore leave with its mariners over a number of years. There have been several campaigns to increase shore leave, including at least two prior to 2002. The most recent compaign was as follows: on 1 October 2002, MSC issued a memorandum announcing that the organization was pursuing a leg-islative change to increase shore leave accrual rates.2 The proposed change, which was never implemented, would have increased the rate of shore leave accrual as tenure increases. MSC continued working to increase shore leave for mariners, without success. The most recent MSC initiative to increase shore leave was not approved by the Office of Management and Budget. This initiative intended to increase shore leave effective in FY2006 and stated that increasing shore leave
1. Sick leave could be used towards retirement under the prvious retire-ment system, CSRS, but not under the current FERS system.
2. The memo can be found on MSC's website: http://www.msc.navy.mil/civmar/benefits/shoreleavechange.htm
4

was necessary to ensure recruitment and retention of quality mariners. OMB officials said that they would need empirical evidence of shore leave's impact on retention and recruiting before approving any increase. OMB suggested that changes in shore leave accrual could be implemented in FY2007 if justification of shore leave's impact were found.
Past studies
Several MSC studies on CIVMARs have been conducted this decade. In particular, two 2001 CNA studies for MSC address similar issues. Relevant highlights of these studies are noted in the paragraphs that follow.
Is CIVMAR compensation comparable with industry? [4]
In 2001, [4] sought to determine whether CIVMAR compensation was comparable with industry compensation. Study findings pertained to the environment in 2001, and they include the following:
• CIVMAR compensation lags behind commercial industry benefits.
• Unions believe that CIVMAR compensation is too low.
• Base wages are comparable to industry ones, but benefits are not. In some cases, benefits are less expensive; in other cases, the cost to the CIVMAR of the benefit is higher.
• Industry leave "earnings" are 6.5 times to 27.5 times those of CIVMARs. When total compensation is defined to include such benefits as leave, CIVMARs can be thought of as receiving less compensation than commercial mariners.
• Shore leave does little to offset those great leave disparities.
• CIVMARs have difficulties in scheduling leave because MSC is already undermanned.
• Additional leave accrued would not necessarily lead to addi-tional leave taken.
• Retention bonuses should be created to reduce attrition.
5

Compensation and unlicensed CIVMAR attrition [5]
Reference [5] followed up on [4]. The author addressed attrition directly, and also looked at shore leave, concluding that it was not pos-sible to draw a direct causal relationship between shore leave and retention, but it was possible to infer one. His study conclusions follow:
• A negative relationship exists between total compensation (including benefits) and attrition.
• Leave should be considered as a type of compensation.
• Thus, a negative correlation can be inferred between leave accrual and attrition.
• Estimated pay elasticity shows a significant and negative rela-tionship between CIVMAR compensation and attrition, indicat-ing that an increase in compensation decreases attrition.
• Retention allowances successfully lowered attrition in 1999 and 2000.
6

Data and methodology
Definition of attrition
One way of determining attrition rates is using cohort attrition, which calculates the attrition rate to be the number who attrite in a given time period from a selected group that entered in a specified time period. For example, we could use cohort attrition calculations to find out what percentage of CIVMARs who accessed in fiscal year 2000 attrited within the next 5 years. This method is useful for com-parisons across "classes," but it overemphasizes the class affiliation. In our case, we are comparing attrition between individuals in a dynamic workforce, so using a cohort inaccurately groups mariners. The cohort attrition method also does not examine mariners outside the period specified in the numerator, and it requires more time to gather results because the length of time in the numerator is signifi-cantly longer than the denominator [6].
A much simpler, and perhaps more traditional method for calculat-ing attrition rates is to divide separations by a measure of yearly strength. In applying this method, we chose to use total man-years rather than endstrength in the denominator. This method can be called a cross-section measure of attrition and is useful for several rea-sons discussed below.
The MSC force has a large number of mariners who begin and end their employment with MSC in the same calendar year. Those mari-ners would not appear in any endstrength number. MSC's high turn-over for new accessions, coupled with the fact that the number of new mariners per year is highly variable, means that attrition rates are not steady from year to year. MSC adjusts its new hires based on its pro-jected needs. Because MSC has intentionally been growing its force in recent years, the volatile denominator can be made more compa-rable over time by using man-years instead of endstrength.
7

Using man-years instead of endstrength also norms for data anoma-lies that are due to an uneven distribution of accession or separation dates. The trend for short tenure in some recent hires means that if mariners happened to be in the workforce on the last day of the mea-surement period, they would be represented in the endstrength num-ber. Any endstrength number is a single point in time, and is not necessarily a reflection of the size of the force over a given year. A more accurate gauge of force size, and thus attrition rate, is man-years, which accurately reflect each worker's real yearly contribution to MSC's workforce.
We define the attrition rate as the number of total separations per man-year. A man-year is 365 days on the MSC payroll. For tenure groups, we define a man-year as 365 days spent in that tenure group. We use fiscal year data for all calculations. For example, a mariner who joins MSC 3 months into the fiscal year and completes the year will count as 0.75 man-year for calculation purposes. If that same mar-iner had left after working 3 months, he would count as 0.25 man-year. Had he worked 6 months, he would count as 0.5 man-year.
Calculations can further take into account only subsets of each com-ponent of the calculation. For instance, we could calculate a statistic such as "unwanted attrition" that only includes a numerator of those losses that we see as unwanted. Separations due to disciplinary action, for instance, would not be included. While this type of calculation is useful for some applications, it is often difficult to discern unwanted attrition since records are often obscured and the reason for separa-tion is not necessarily reported accurately, if it is reported at all. The same issues arise if we want to consider only preventable attrition (that is, attrition that is not due to retirement). While in theory these groups are separate, in practice they are much more difficult to dis-cern. It is possible that retiring mariners would work longer if incen-tives were high enough.
A broader definition of attrition eliminates these problems. Separa-tions are simply those who leave. This calculation is well defined and does not inaccurately imply things about the workforce. Still, this methodology leads to speculation as to the proportions of the work-force that fall into various categories (retirement, administrative
8
separation, etc.). Another disadvantage of the cross-section method for calculation is that it is very sensitive to the number of new acces-sions if there is a difference in attrition rates based on tenure. If so, an influx of new accessions can create a spike in attrition in a certain period if shorter-tenure mariners attrite at higher levels than longer-tenure mariners [6].
Attrition data
MSC provided us with both individual and aggregate data for those mariners who attrited. The individual data spanned FY 2000 to FY 2005, and included information on job rating, date of hire, coast, reason for separation, and the input and effective dates of separation. The individual attrition data for FY 2003-2005 had even more detail, including demographic information, such as race, gender, and age.3
The aggregate data were totaled by job rating and by coast.
MSC provided the accession data on an aggregate level for FY 2000-2005, but individual data were provided only for FY 2003-2005. The individual accession data included date of hire and job rating. The lack of individual accession data for FY 2000-2002 restricts some of our analyses, as discussed later in this section. The aggregate acces-sion data were totaled by rating. Coast is irrelevant here because all mariners come on board on the east coast at MSC's Norfolk, VA, facility.
In addition to attrition and accession data, MSC provided aggregate onboard levels at the start of each fiscal year from 2000 to 2005, as well as snapshots of the individual mariners on board at the begin-ning of each fiscal year from 2003 to 2006 (there are four total snap-shots, the last being on 30 September 2005). The aggregate onboard numbers are broken down by rating for each year. The individual databases contain job ratings, date of hire, and coast as well as demo-graphic information such as age, sex, and race.
3. CNA handled and stored all individual data in full compliance with gov-erning human subjects statutes and regulations and with a commitment to safeguard the rights and welfare of the individuals.
9
Data issues and attrition calculation
Our methodology for calculating attrition relies on knowing the date of hire and date of separation for each mariner in MSC in order to calculate man-years for each year. For those who are on board the full year, this is simply 1, but for those who access or attrite during a year, the man-year is a partial year based on the date of hire or date of sep-aration (or both, in the case of those who join MSC and leave within the same fiscal year).
Though we know the year of accession, we lack individual accession dates for FY 2000-2002, except for those who attrite in the same year that they access. For the mariners who access and then complete the fiscal year, we were unable to use the same methodology used for cal-culating attrition in FY 2003-2005. Instead, we made the assumption that the average accessing Mariner works 0.5 man-year in the fiscal year in which he or she is hired. The assumption of 0.5 year is consis-tent with the FY 2003-2005 data, for which the number ranges from 0.43 to 0.52 year. Also, because of a lack of individual onboard data for FY 2000-2002, we did not calculate attrition rates by tenure for those years.
Separation survey data
In addition to the individual and overall separation, accession, and onboard data, MSC provided some aggregated survey results from previous separation surveys. The separation surveys had 540 responses for mariners who separated from 1997 to the present, but only 252 completed surveys for those who separated since July 2000. As an indication of response rate, 2,811 Mariners separated from FY 2000 to 31 July 2005, a response rate of only about 10 percent.
The separation survey has four different versions:
• Version 1 - May 1997 through April 1998
• Version 2 - May 1998 through June 2000
• Version 3 - July 2000 through April 2005
• Version 4 - May 2005 to present.
10
The surveys have three variations-one each for retirement, separa-tion, and termination. The job issues addressed in the separation sur-veys include incentives to stay, suggested changes, and whether the mariner will remain in the maritime industry.
Shore leave data
For the analysis of shore leave, MSC provided beginning and end leave balances for the calendar years from 2000 to 2005. These individual-level data included annual leave, shore leave, sick leave, and other leave types, as well as job rating, and the federal service computation date and the rate at which annual leave is earned, which is based on the service computation date (see footnote 3 on p. 9).
In addition, mariner payroll data were provided that tracked the CIV-MARs through each pay period from the beginning of 2000 to Sep-tember 2005, the last available data point. These data included ship assignment, the earnings code, the number of hours, and the pay (see footnote 3 on p. 9).
Shore leave methodology
Mariners were tracked through the almost 6 years in the ship assign-ment data. For the calculation of shore leave use rates, the time mar-iners spent on shore each pay period was tracked and the remainder of time each pay period was calculated as sea time, accruing shore leave. Mariner shore leave accrual was calculated for each pay period and summed over the 2000-2005 period. Shore leave use was directly taken from the payroll records, where the use of shore leave is sepa-rately coded. We then compared overall use to accrual over the period for each tenure group. For the graph comparing the shore leave balances of attriting and nonattriting mariners, beginning shore leave balances were taken from the calendar year 2000 start bal-ances, and end balances were calculated for each mariner using the accrual and use data.
11
Definition of attrition problem
The term attrition problem is somewhat nebulous. Higher numbers of people attriting do not necessarily constitute a problem, and lower numbers do not necessarily mean that there is no problem. Yet, as [7] indicates, the existence of a problem is an important precursor to considering an increase in shore leave or an increase in any other form of compensation:
Two economic principles should guide any attempt at com-pensation reform. First, reform should not be pursued for the sake of reform. Rather, changes to compensation should be in direct response to a specific problem faced by the services.
If there is not a manning issue, "a pay increase might alleviate per-ceived inequities, [but] it would not solve a tangible problem" [7]. The first issue we consider, then, is whether MSC is able to fill all of its billets, or if certain ratings are experiencing shortages.
Often in manpower analysis, focus is on the more easily calculated "how many" rather than the quality question of "which ones" [8]. Ignoring this aspect can lead to a scenario in which the MSC force could become less experienced over time, which would indicate an attrition problem. Thus, the second issue we consider is whether the CIVMAR force is becoming more junior each year.
Lastly, we consider force imbalances that may be indirect indications of an attrition problem. For example, it could be a problem if there are significant differences in attrition across tenure groups, between licensed and unlicensed mariners, or between the coasts.
If the attrition problem is solved, this resolves any issues with reten-tion that may exist, such as expensive recruiting [9]. So, in some sense, attrition is not a problem in and of itself, but an attrition prob-lem is one where attrition is causing inefficiencies elsewhere in the organization.
12
Attrition findings
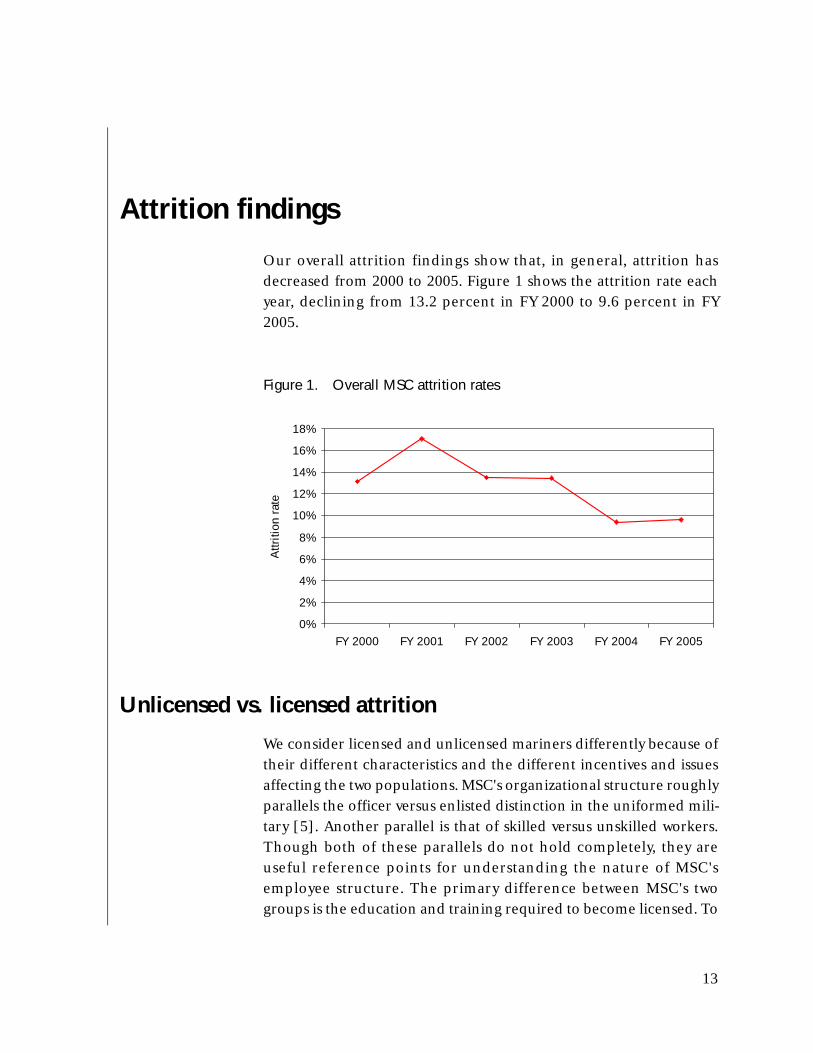
Our overall attrition findings show that, in general, attrition has decreased from 2000 to 2005. Figure 1 shows the attrition rate each year, declining from 13.2 percent in FY 2000 to 9.6 percent in FY 2005.
Unlicensed vs. licensed attrition
We consider licensed and unlicensed mariners differently because of their different characteristics and the different incentives and issues affecting the two populations. MSC's organizational structure roughly parallels the officer versus enlisted distinction in the uniformed mili-tary [5]. Another parallel is that of skilled versus unskilled workers. Though both of these parallels do not hold completely, they are useful reference points for understanding the nature of MSC's employee structure. The primary difference between MSC's two groups is the education and training required to become licensed. To
Figure 1. Overall MSC attrition rates
0%
2%
4%
6%
8%
10%
12%
14%
16%
18%
FY 2000 FY 2001 FY 2002 FY 2003 FY 2004 FY 2005
Attr
ition
rat
e
13

obtain a third officer's or a third engineer's license, a mariner must already have 3 years of "sea service," time spent aboard a ship, at sea. This typically takes more than 3 years to do, so even the lowest licensed officer has 4 or more years of experience. These sea service requirements can be replaced by training classes and additional edu-cation in some cases. In any case, a licensed mariner has obtained education and training and so is more likely to stay. Like a skilled worker, his options are fewer, but more lucrative. He has invested in a future as a mariner and, therefore, is less likely to attrite from the industry.
The results of calculations after splitting the MSC workforce into these two subpopulations support our theory. Figure 2 shows that there consistently has been a higher attrition level for unlicensed mariners. The overall trends of the separate groups are very similar: attrition decreased in the last 5 years for both licensed and unlicensed mariners, after peaking in 2001.
Unlicensed rating and attrition
The general decrease in attrition since 2000 is seen when we focus on individual ratings. Figure 3 shows several large and key unlicensed ratings. For those ratings that have been the focus of previous
Figure 2. Attrition rates by license
0%
2%4%
6%
8%10%
12%
14%
16%18%
20%
2000 2001 2002 2003 2004 2005
Attr
ition
rat
e
Licensed Unlicensed
14
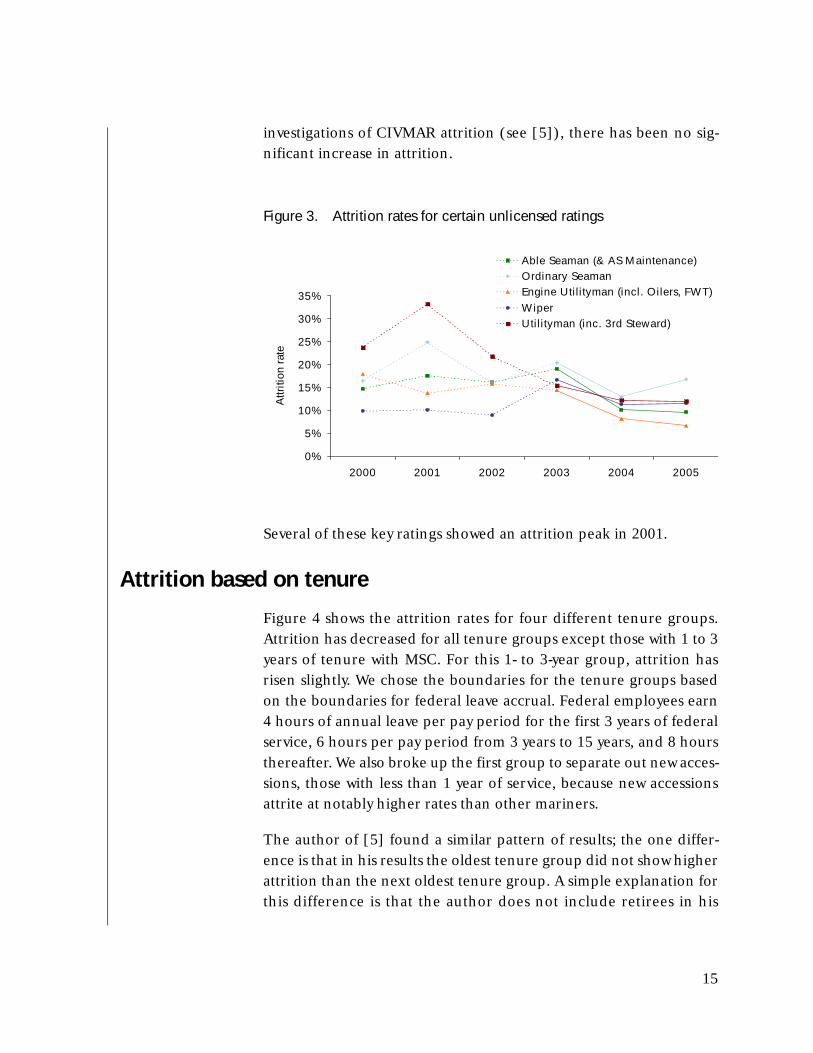
investigations of CIVMAR attrition (see [5]), there has been no sig-nificant increase in attrition.
Several of these key ratings showed an attrition peak in 2001.
Attrition based on tenure
Figure 4 shows the attrition rates for four different tenure groups. Attrition has decreased for all tenure groups except those with 1 to 3 years of tenure with MSC. For this 1- to 3-year group, attrition has risen slightly. We chose the boundaries for the tenure groups based on the boundaries for federal leave accrual. Federal employees earn 4 hours of annual leave per pay period for the first 3 years of federal service, 6 hours per pay period from 3 years to 15 years, and 8 hours thereafter. We also broke up the first group to separate out new acces-sions, those with less than 1 year of service, because new accessions attrite at notably higher rates than other mariners.
The author of [5] found a similar pattern of results; the one differ-ence is that in his results the oldest tenure group did not show higher attrition than the next oldest tenure group. A simple explanation for this difference is that the author does not include retirees in his
Figure 3. Attrition rates for certain unlicensed ratings
0%
5%
10%
15%
20%
25%
30%
35%
2000 2001 2002 2003 2004 2005
Attr
ition
rat
e
Able Seaman (& AS Maintenance)Ordinary SeamanEngine Utilityman (incl. Oilers, FWT)WiperUtilityman (inc. 3rd Steward)
15
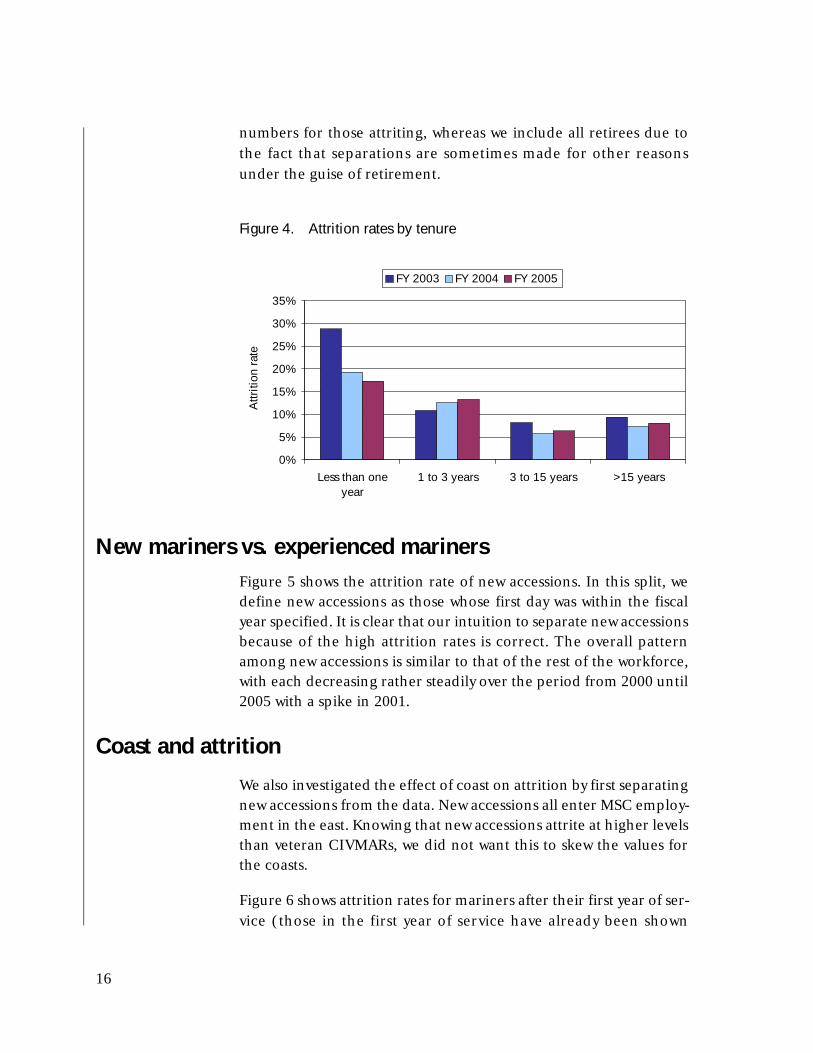
numbers for those attriting, whereas we include all retirees due to the fact that separations are sometimes made for other reasons under the guise of retirement.
New mariners vs. experienced marinersFigure 5 shows the attrition rate of new accessions. In this split, we define new accessions as those whose first day was within the fiscal year specified. It is clear that our intuition to separate new accessions because of the high attrition rates is correct. The overall pattern among new accessions is similar to that of the rest of the workforce, with each decreasing rather steadily over the period from 2000 until 2005 with a spike in 2001.
Coast and attrition
We also investigated the effect of coast on attrition by first separating new accessions from the data. New accessions all enter MSC employ-ment in the east. Knowing that new accessions attrite at higher levels than veteran CIVMARs, we did not want this to skew the values for the coasts.
Figure 6 shows attrition rates for mariners after their first year of ser-vice (those in the first year of service have already been shown
Figure 4. Attrition rates by tenure
0%
5%
10%
15%
20%
25%
30%
35%
Less than oneyear
1 to 3 years 3 to 15 years >15 years
Attr
ition
rat
e
FY 2003 FY 2004 FY 2005
16

separately). The east coast sees slightly higher attrition rates than the west coast. Several factors may contribute to this, including the fact that mariners join MSC on the east coast, so younger mariners are more likely to be found there. Since younger mariners are more likely to attrite, the east coast could be expected to see slightly higher attri-tion, all else being equal.
Figure 5. Attrition rates for new accessions vs. experienced mariners
Figure 6. Attrition rates by coast
0%
10%
20%
30%
40%
50%
60%
70%
80%
90%
Experienced New Accessions
Attr
ition
rat
e
FY 2000 FY 2001 FY 2002 FY 03 FY 2004 FY 2005
0%2%4%6%8%
10%12%14%16%18%20%
East West
Attr
ition
rat
e
FY 00 FY 01 FY 02 FY 03 FY 04 FY 05
17
Attrition has been decreasing slightly for both coasts since 2000, though attrition rates do vary from year to year. The highest attrition occurs in the east coast in 2001.
Overall MSC experience level
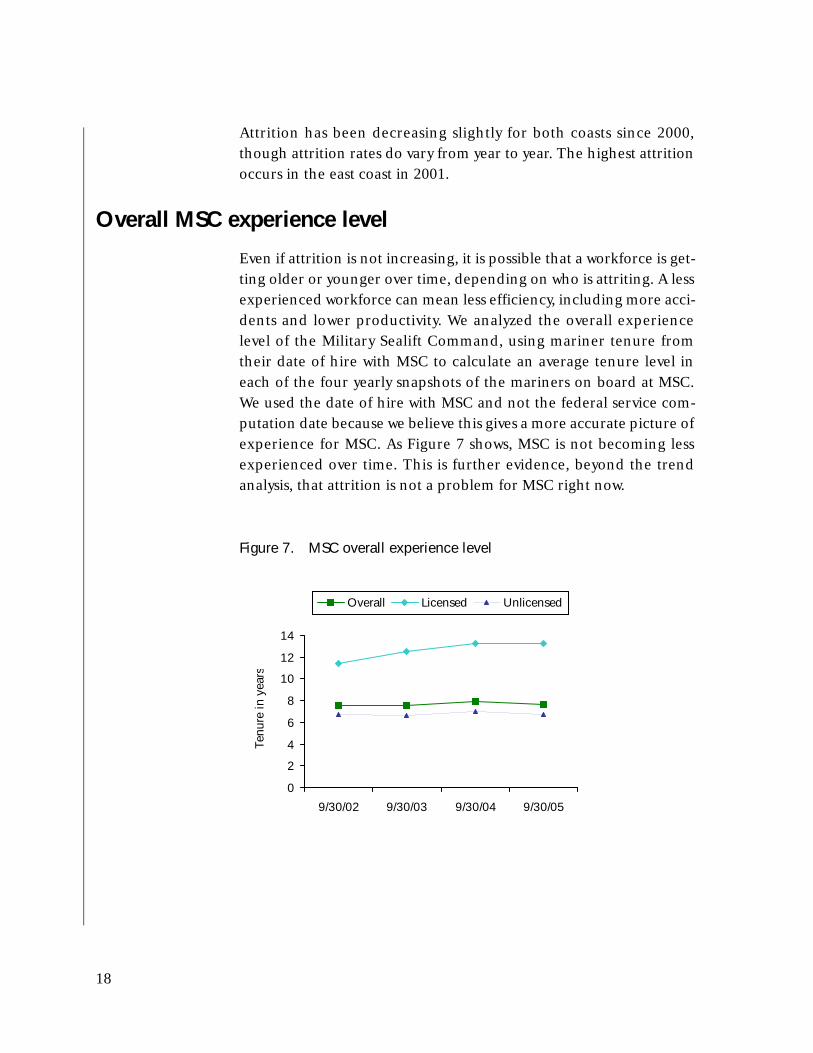
Even if attrition is not increasing, it is possible that a workforce is get-ting older or younger over time, depending on who is attriting. A less experienced workforce can mean less efficiency, including more acci-dents and lower productivity. We analyzed the overall experience level of the Military Sealift Command, using mariner tenure from their date of hire with MSC to calculate an average tenure level in each of the four yearly snapshots of the mariners on board at MSC. We used the date of hire with MSC and not the federal service com-putation date because we believe this gives a more accurate picture of experience for MSC. As Figure 7 shows, MSC is not becoming less experienced over time. This is further evidence, beyond the trend analysis, that attrition is not a problem for MSC right now.
Figure 7. MSC overall experience level
0
2
4
6
8
10
12
14
9/30/02 9/30/03 9/30/04 9/30/05
Tenu
re in
yea
rs
Overall Licensed Unlicensed
18
Conclusion
Overall attrition does not seem to be much of a problem for MSC. Attrition has declined in recent years, particularly for unlicensed mar-iners, as bonuses targeted to specific ratings have been effective. The overall MSC experience level has not decreased in recent years. Attri-tion is declining for both coasts and for new accessions. Most tenure groups saw a decreased attrition rate in recent years. Only the 1- to 3-year tenure group saw a slight increase in attrition rate.
When we reported to the MSC Leadership Council that the MSC is not currently experiencing an attrition problem, it decided not to pursue a shore leave increase. Therefore we did not undertake a full analysis of attrition's relation to shore leave. We did, however, explore some aspects of relationships between shore leave and attrition, which we present next.
19


Attrition and shore leave
Visualizing attrition
One way to visualize the correlation of shore leave and attrition is by plotting tenure vs. shore leave. Figure 8 shows this correlation. Mari-ners who ultimately separate from MSC have significantly lower shore leave balances than those who stay. This correlation could be due to a number of reasons. For example, those who do not like MSC may try to take more vacation to get away from MSC. But causation could be a factor—that mariners drop out of MSC because they want more vacation than they can have in MSC. For this comparison, the stayer data come from a single snapshot, September 2005, while the data for attrites span the years 2000 to 2005.
Figure 8. Shore leave balances for attriters and stayersa
a. Note that the stayer data comes from a single snapshot, September 2005, while attriter data spans the years 2000-2005 as a snapshot of final leave balances.
010
2030
4050
6070
80
<1 1-3 3-5 5-15 15+
Years of MSC tenure
Day
s of
sho
re le
ave
Attriters Stayers
21
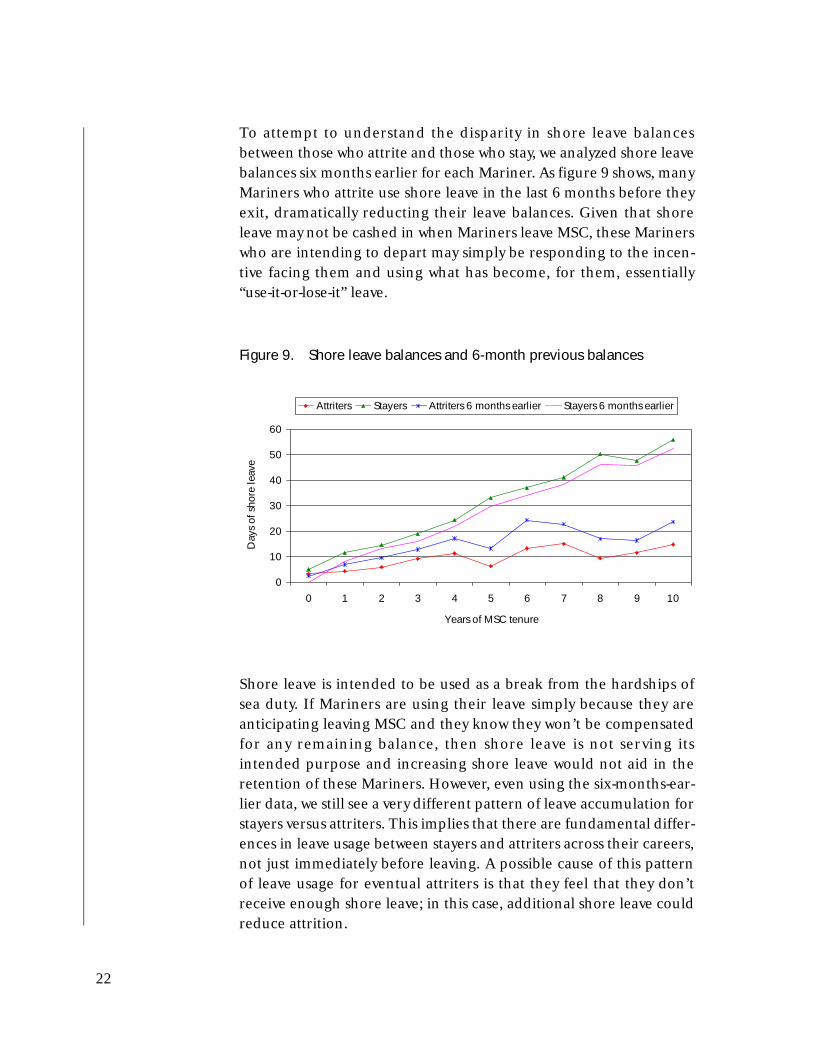
To attempt to understand the disparity in shore leave balances between those who attrite and those who stay, we analyzed shore leave balances six months earlier for each Mariner. As figure 9 shows, many Mariners who attrite use shore leave in the last 6 months before they exit, dramatically reducting their leave balances. Given that shore leave may not be cashed in when Mariners leave MSC, these Mariners who are intending to depart may simply be responding to the incen-tive facing them and using what has become, for them, essentially “use-it-or-lose-it” leave.
Shore leave is intended to be used as a break from the hardships of sea duty. If Mariners are using their leave simply because they are anticipating leaving MSC and they know they won’t be compensated for any remaining balance, then shore leave is not serving its intended purpose and increasing shore leave would not aid in the retention of these Mariners. However, even using the six-months-ear-lier data, we still see a very different pattern of leave accumulation for stayers versus attriters. This implies that there are fundamental differ-ences in leave usage between stayers and attriters across their careers, not just immediately before leaving. A possible cause of this pattern of leave usage for eventual attriters is that they feel that they don’t receive enough shore leave; in this case, additional shore leave could reduce attrition.
Figure 9. Shore leave balances and 6-month previous balances
0
10
20
30
40
50
60
0 1 2 3 4 5 6 7 8 9 10
Years of MSC tenure
Day
s of
sho
re le
ave
Attriters Stayers Attriters 6 months earlier Stayers 6 months earlier
22

Use rates increase with tenure
We further estimated mariner shore leave use by calculating shore leave use and accrual by tenure group. The calculation compared accrued shore leave over the 2000-2005 period to shore leave used over the same period. Table 1 presents the findings. The numbers show that the percentage of shore leave used increases as tenure increases. This is intuitive for several reasons.
First, new mariners have no bank of shore leave, so they must first earn each day of shore leave before they use it. Older mariners usually have a bank of shore leave that they have accrued. They could even use more shore leave than they accrue in any given period, something that new mariners cannot mathematically accomplish. (In some years, the tenure group with 15+ years used more than 100 percent of the leave it accrued in that year.)
Second, older mariners have less incentive to save shore leave once they have already accrued a bank. Since shore leave has no trade-in value, once a mariner accrues a sizable balance, it is in his/her best interest to use it all up or risk losing it upon retirement. The younger mariners might want to stockpile some leave before they use it, in order to take an extended vacation or simply to have the leave banked for a future need. Having a sizable amount of shore leave for use in unforeseen circumstances can be beneficial since sick leave is limited to the amount earned and annual leave is capped at a carryover ceiling.
Table 1. Shore leave use by tenure (2000-2005)
Tenure Shore leave used<1 year 40.8%1-3 Years 81.5%3-5 Years 84.1%5-15 Years 89.1%15+ Years 94.3%Overall 79.9%
23
Third, as a sort of combination between the two other reasons, a less experienced mariner is less likely to use large amounts of shore leave because he does not have the leave available. If several more experi-enced mariners take long stretches of shore leave, this pulls up the high-tenure average, while such uses of leave are not possible for mar-iners who have not accrued as much. Since shore leave is usually taken in large chunks, this is especially relevant. An experienced mar-iner can take an extended vacation once he has worked for a while at MSC, while a new hire cannot.
The implication of this finding is that increasing across-the-board shore leave will actually be very expensive because most mariners use most of their shore leave regardless of tenure group. The group with less than 1 year of tenure dramatically affects the overall shore leave use level because their percentage of use is so much lower and the number of mariners who are new is quite high. These new mariners often attrite or "age out" into the 1- to 3-year tenure group before they have an opportunity to use much of their accrued shore leave.
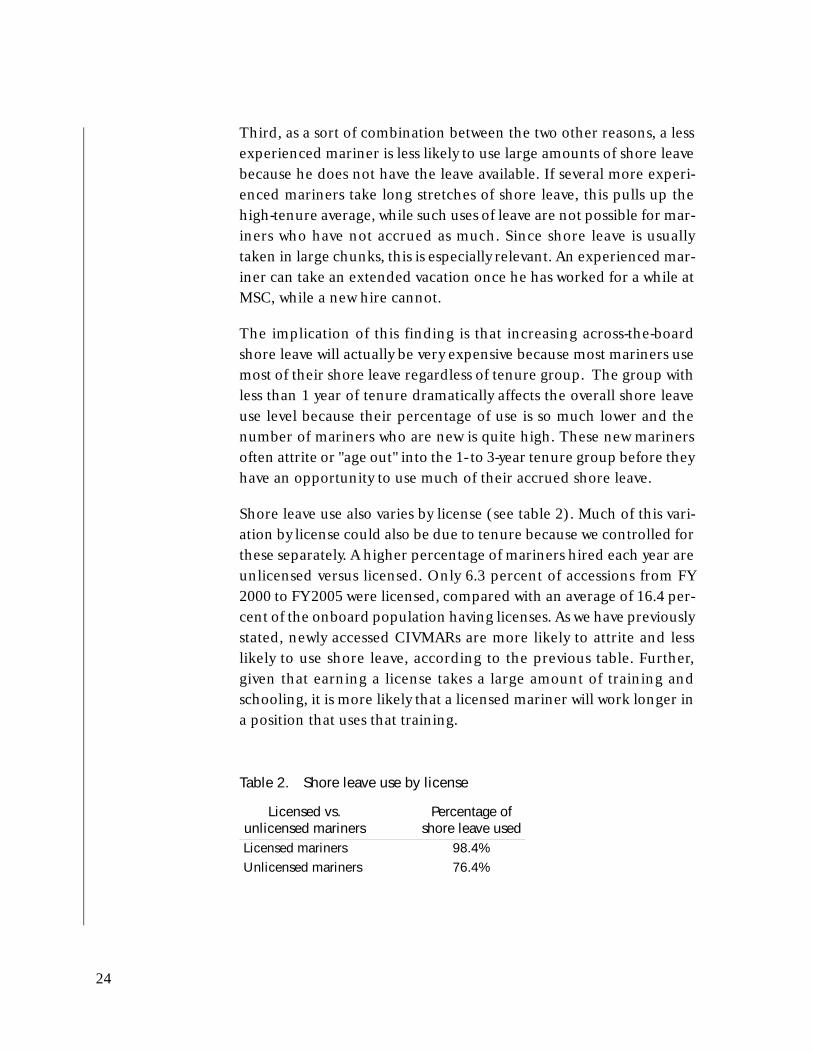
Shore leave use also varies by license (see table 2). Much of this vari-ation by license could also be due to tenure because we controlled for these separately. A higher percentage of mariners hired each year are unlicensed versus licensed. Only 6.3 percent of accessions from FY 2000 to FY 2005 were licensed, compared with an average of 16.4 per-cent of the onboard population having licenses. As we have previously stated, newly accessed CIVMARs are more likely to attrite and less likely to use shore leave, according to the previous table. Further, given that earning a license takes a large amount of training and schooling, it is more likely that a licensed mariner will work longer in a position that uses that training.
Table 2. Shore leave use by license
Licensed vs.unlicensed mariners
Percentage ofshore leave used
Licensed mariners 98.4%Unlicensed mariners 76.4%
24

Surveys show mixed results for shore leave
Although various surveys are available, since the response rates are usually low and not necessarily representative, their validity is ques-tionable. Intuition says that a small response rate can lead to a higher variation in estimates provided by the survey. Because the response rates were low and there was self-selection for survey completion, it is very reasonable to suspect that the group of attriting mariners who completed a survey is not necessarily representative of the population.
Separation surveys
The aggregated results from mariner separation surveys between 2000 and 2005 show leave to be a relevant factor in mariner separa-tions. The average mariner separation survey gives leave a score of 3.0 on a score of 1 to 5, with 5 being the most positive rating. Leave scored a 2.3 for those separating who will continue working at sea-pre-sumably at organizations with better leave benefits. Those separating who are staying at sea have a lower opinion of leave than the average separating mariner. In fact, of those mariners who selected leave as a specific reason for separating, the leave rating was 2.1, which is not far from the 2.3 for mariners continuing at sea.
Leave was the reason most cited for leaving MSC. Of 43 criteria (mar-iners could select multiple reasons), more leave time/better rotation was selected in 29 percent of surveys. Only six other criteria received 10 percent or more: salary issues (13 percent), improved communi-cations (20 percent), improved training opportunities (15 percent) , improved promotions process/opportunities (15 percent), follow industry standards/more CIVMAR input (12 percent) , and hire better quality personnel (11 percent).
In the separation surveys, only 28 percent of responding mariners plan to stay in the marine shipping industry. Of these staying in the industry, 48 percent (33 of 69) cited leave as a reason for separating from MSC, which is much higher than the average separating mari-ner. It is possible that these mariners sought other maritime jobs with more generous leave benefits.
25
Time series surveys
We also have survey data from various points along mariner careers, in which mariners were asked to rank the adequacy of the shore leave they receive (or will receive in the case of new hires). The four points at which the survey were given are:
1. New Employee Orientation (NEO) - 430 respondents, May 2005 through October 2005
2. NEO Completion (Training Center) - 65 respondents, June 2005 to October 2005
3. One-Year Surveys - 76 respondents, May 2005 through October 2005
4. Separation Surveys - 35 respondents, May 2005 through Octo-ber 2005.
While lack of shore leave seems to be a factor in mariner unhappi-ness, the surveys indicate that shore leave may not affect the attrition decision. For beginning mariners at the new employee orientation, 10 percent disagree that amounts of shore leave are adequate. After 1 year, 30 percent disagree that shore leave amounts are adequate. In the separation surveys 17 percent disagree that the amount of shore leave they had received was adequate. While these results are slim and not robust, they indicate that unhappiness with shore leave grows as a mariner increases his tenure with MSC.
Impact of shore leave on attrition
To analyze the impact of shore leave on attrition, we use the results from the multivariate analysis in [5], which showed the relationship between compensation and unlicensed CIVMAR attrition. The estimated relationship between compensation and attrition in that paper showed a pay elasticity of -1.6, meaning that a 1-percent increase in the CIVMAR's daily base wage leads to a 1.6-percent reduction in attrition among unlicensed mariners.
To use these results for the impact of increasing shore leave, one must make assumptions about the estimated percentage increase in pay due to a specified increase in shore leave. CIVMARs earn 1 day of
26
shore leave for every 15 days at sea, but if this were increased to 1 day every 14 days at sea, how much would CIVMAR shore leave increase, and how much would that cause CIVMAR pay to increase? Unlicensed mariners earn 17.8 days of shore leave on average each year, equating to 268 days assigned to a ship. If the rate of shore leave accrual were changed to 1 day earned per 14 days assigned to a ship, the average unlicensed CIVMAR would earn 19.1 days of shore leave per year, an increase of 1.3 days. This increase of 1.3 days of shore leave is equiva-lent to a 7.3-percent increase in shore leave, but what is its value in terms of pay?
The valuation of a day of shore leave is somewhat objective, so we will use a range of estimates. CIVMARs are given a day of pay for a day of shore leave used. This valuation, 1 day of pay for 1 day of leave, is often used in analysis because it is the most straightforward way of account-ing for vacation as a benefit to the employee (see [10] for an example). Going on the assumption that a mariner values a day of shore leave at exactly a day of pay, the increase of 1.3 days of shore leave implies a 0.356-percent increase in pay, however (1.3 days of pay out of 365 days of pay). Using the elasticity of -1.6, this increase in CIVMAR compen-sation would lead to a decrease in attrition of 0.57 percent.
The day of leave, however, may not exactly be "worth" a day of pay in the mariner's eye, and its cost to MSC will also not be exactly equal to 1 day of pay. It is the value to the mariner that is at issue here because that is the value that will affect the mariner's attrition decision, and it is that value that is affected by the elasticity of pay. The idea of shore leave is to provide the benefit of a respite from work and the hardships of sea time. This benefit provides value above and beyond the mone-tary compensation if the rest and relaxation is desired. In addition, a mariner need only take shore leave on the weekdays and not the week-ends. Yet for watchstanders the workweek aboard ship is 7 days. There-fore, if a CIVMAR in a watchstanding assignment takes an entire week off using shore leave, only 5 days of leave are charged to the mariner, but he/she is paid for the full 7 days. This potentially increases the value of shore leave to 140 percent of a day's pay. 4
4. We say potentially here because this benefit applies only to watchstanders and occurs only when shore leave is used to cover the weekend. If a watchstanding mariner takes 2 days off in the middle of the week, for example, this added benefit does not apply.
27

Working in the opposite direction, however, is the opportunity cost to the mariner of forgoing earned overtime pay and other allowances while on leave. Mariners cannot earn overtime pay or special pays while on shore leave, and these pays make up a sizable amount of a mariner's overall compensation. Specifically, overtime pay accounted for about 32 percent of the MSC mariner's average annual earnings in 20005 [11]. This opportunity cost can be very large for the mari-ners who earn lower income and depend on the overtime pays, thereby making shore leave worth significantly less to some subsets of CIVMARs.
Thus, there are alternative valuations for shore leave versus using exactly 1day of pay for 1day of leave. The actual reduction in attrition could be either higher or lower depending on how the mariner values the benefit. To provide a more robust estimate, we can interpret the elasticity for the lower and higher valuations and provide a range of effects on attrition of the shore leave increase. For the low estimate, we posit that a day of shore leave is worth 68 percent of a day's pay, given that overtime earnings account for 32 percent of annual earn-ings on average. For the higher bound, we estimate the effect of shore leave on attrition assuming that mariners value the leave at 140 per-cent of a day's pay to account for the extra benefit of weekends off. These values should provide a minimum and maximum for the aver-age effect of shore leave on attrition. Applying the low estimate of 68 percent, the increase of 1.3 days of shore leave accounts for an increase in pay of 0.242 percent. This increase in pay results in a decrease in attrition of 0.39 percent. The high estimate of 140 per-cent valuation increases the value to a 0.499-percent increase in pay, resulting in a decrease in attrition of 0.80 percent. These values are summarized in table 3.
All of the analysis summarized in table 3 is for unlicensed mariners. Whether these estimates are applicable to licensed mariners depends on the assumption of whether behavior is comparable for the two groups of mariners. This assumption may not hold, however, due to
5. The value of 32 percent is not broken down by licensed/unlicensed mariners and is, therefore, used for both groups for the estimate of the lower bound.
28
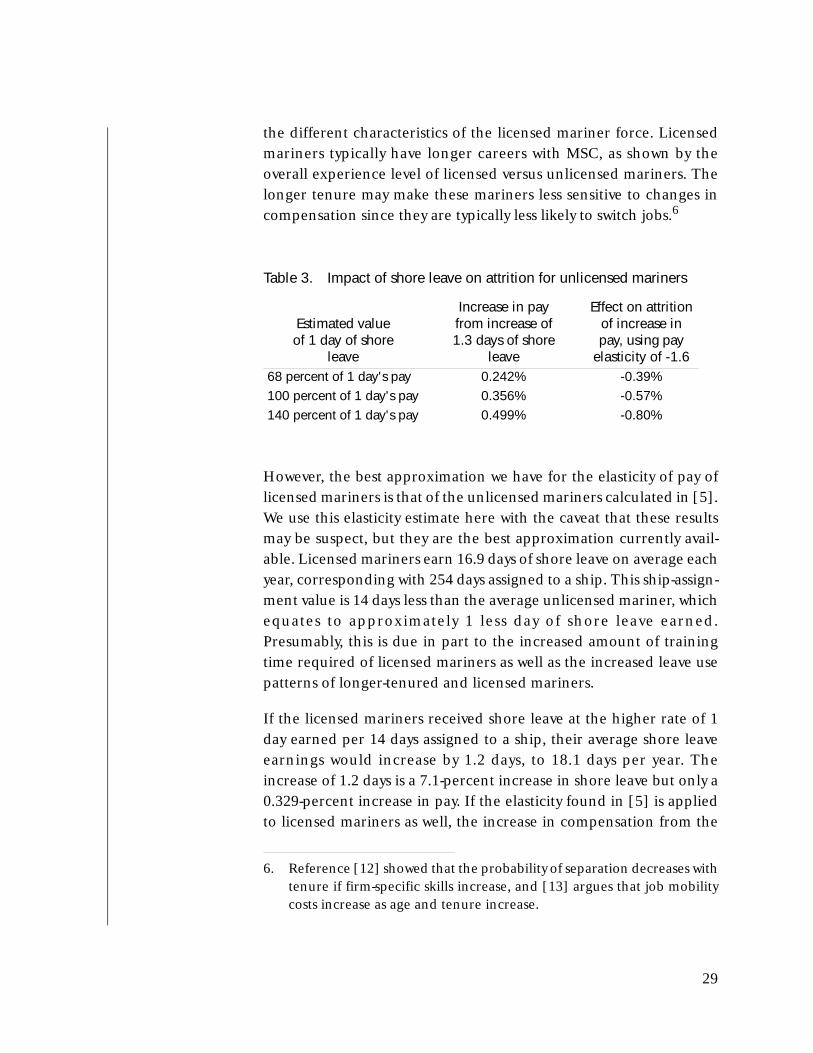
the different characteristics of the licensed mariner force. Licensed mariners typically have longer careers with MSC, as shown by the overall experience level of licensed versus unlicensed mariners. The longer tenure may make these mariners less sensitive to changes in compensation since they are typically less likely to switch jobs.6
However, the best approximation we have for the elasticity of pay of licensed mariners is that of the unlicensed mariners calculated in [5]. We use this elasticity estimate here with the caveat that these results may be suspect, but they are the best approximation currently avail-able. Licensed mariners earn 16.9 days of shore leave on average each year, corresponding with 254 days assigned to a ship. This ship-assign-ment value is 14 days less than the average unlicensed mariner, which equates to approximately 1 less day of shore leave earned. Presumably, this is due in part to the increased amount of training time required of licensed mariners as well as the increased leave use patterns of longer-tenured and licensed mariners.
If the licensed mariners received shore leave at the higher rate of 1 day earned per 14 days assigned to a ship, their average shore leave earnings would increase by 1.2 days, to 18.1 days per year. The increase of 1.2 days is a 7.1-percent increase in shore leave but only a 0.329-percent increase in pay. If the elasticity found in [5] is applied to licensed mariners as well, the increase in compensation from the
Table 3. Impact of shore leave on attrition for unlicensed mariners
Estimated valueof 1 day of shore
leave
Increase in payfrom increase of1.3 days of shore
leave
Effect on attritionof increase inpay, using pay
elasticity of -1.6 68 percent of 1 day's pay 0.242% -0.39%100 percent of 1 day's pay 0.356% -0.57%140 percent of 1 day's pay 0.499% -0.80%
6. Reference [12] showed that the probability of separation decreases with tenure if firm-specific skills increase, and [13] argues that job mobility costs increase as age and tenure increase.
29

shore leave policy change would correspond with a decrease in attri-tion of 0.53 percent. We again estimate a lower and upper bound on the effect of a shore leave increase on attrition, using the same values as before. The results for these estimates are shown in table 4, again with the caveat that the results depend on the assumption of similar behavior for licensed and unlicensed mariners.
The unlicensed CIVMAR attrition rate in 2005 was 10.15 percent. Using the 100-percent valuation, the impact of this increase in shore leave would be to reduce unlicensed CIVMAR attrition to 10.09 per-cent. Licensed mariner attrition was 6.52 percent in 2005 and would decrease from 6.52 to 6.49 percent. These data are summarized in table 5, with the expected number of mariners retained due to the increased compensation. This number is calculated based on the per-centage-point decrease in attrition multiplied by the number of man-years for each group in 2005. It implies that, given the increase in shore leave modeled here (1 day earned per 14 days assigned to a ship), it is expected that between two and three fewer mariners would attrite. Using the full range of estimates, between one and four fewer mariners would attrite given the increase in shore leave modeled here. Larger increases in shore leave would have proportionately larger effects. But, on net, this analysis suggests that shore leave is not a particularly powerful tool for addressing attrition problems.
Table 4. Impact of shore leave on attrition for licensed mariners
Estimated valueof 1 day of shore
leave
Increase in payfrom increase of1.2 days of shore
leave
Effect on attritionof increase inpay, using pay
elasticity of -1.6 68 percent of 1 day's pay 0.224% -0.36%100 percent of 1 day's pay 0.329% -0.53%140 percent of 1 day's pay 0.460% -0.74%
30

Table 5. Effects of shore leave increase in terms of mariners retained
Mariner 2005 attrition
Calculatedattrition withshore leave
policy change
Expected numberof mariners
retainedUnlicensed 10.15% 10.09% 2.21Licensed 6.52% 6.49% 0.18
31


Conclusion
Our overall analysis of the attrition at the Military Sealift Command did not find much evidence of a current attrition problem. Our anal-ysis of the shore leave incentive did show that attrition and shore leave balances are correlated, but the data do not allow us to conclude that there is causation behind the correlation. As with most incentives, an increase in shore leave will be beneficial in reducing attrition, although the magnitude of the effect appears to be quite small.
As a retention incentive, shore leave will not be as efficient as more targeted incentives, such as retention allowances for specific ratings, which MSC currently employs. In theory, however, the shore leave accrual could be structured in a targeted manner, as the previous MSC initiative attempted to do, with either tenure or rating being the factor that determines the accrual.
The most immediately actionable results are from our analysis of shore leave being used as "terminal leave." Many mariners appear to be taking shore leave as terminal leave despite its prohibition in pol-icy. There is potential room for improvement in the implementation of this policy and/or for in putting in place a set of consequences for those mariners who do not follow the policy.
33

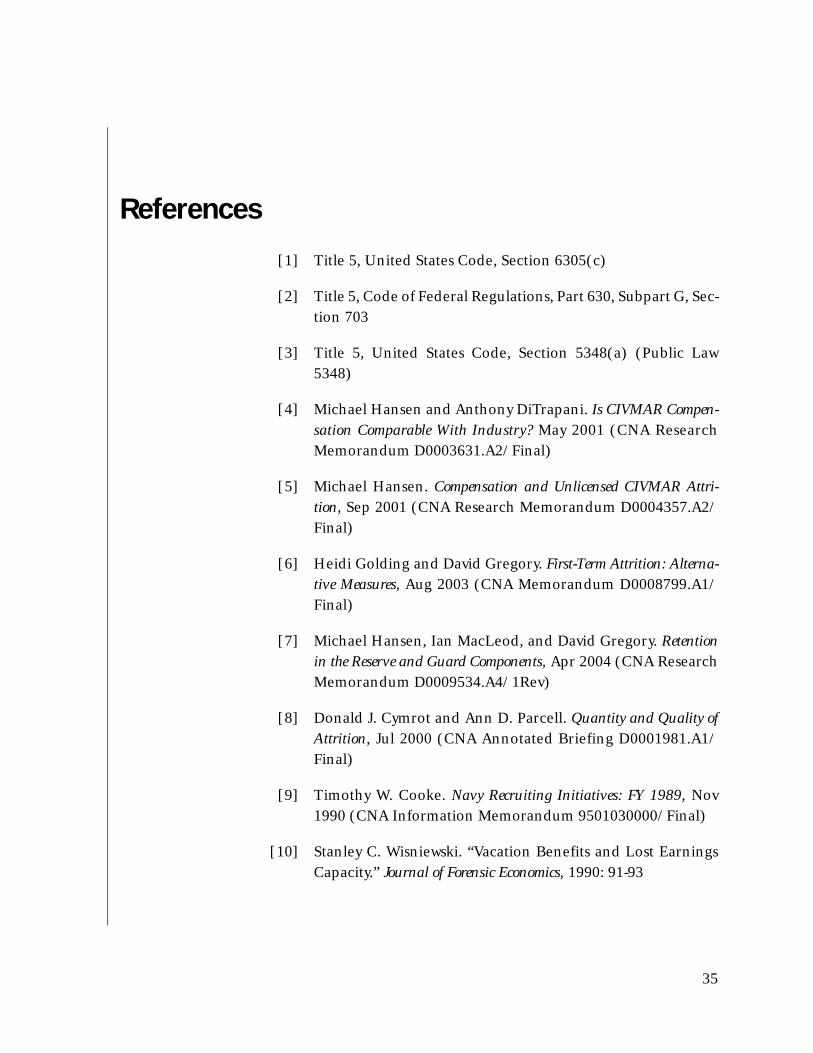
References
[1] Title 5, United States Code, Section 6305(c)
[2] Title 5, Code of Federal Regulations, Part 630, Subpart G, Sec-tion 703
[3] Title 5, United States Code, Section 5348(a) (Public Law 5348)
[4] Michael Hansen and Anthony DiTrapani. Is CIVMAR Compen-sation Comparable With Industry? May 2001 (CNA Research Memorandum D0003631.A2/Final)
[5] Michael Hansen. Compensation and Unlicensed CIVMAR Attri-tion, Sep 2001 (CNA Research Memorandum D0004357.A2/Final)
[6] Heidi Golding and David Gregory. First-Term Attrition: Alterna-tive Measures, Aug 2003 (CNA Memorandum D0008799.A1/Final)
[7] Michael Hansen, Ian MacLeod, and David Gregory. Retention in the Reserve and Guard Components, Apr 2004 (CNA Research Memorandum D0009534.A4/1Rev)
[8] Donald J. Cymrot and Ann D. Parcell. Quantity and Quality of Attrition, Jul 2000 (CNA Annotated Briefing D0001981.A1/Final)
[9] Timothy W. Cooke. Navy Recruiting Initiatives: FY 1989, Nov 1990 (CNA Information Memorandum 9501030000/Final)
[10] Stanley C. Wisniewski. “Vacation Benefits and Lost Earnings Capacity.” Journal of Forensic Economics, 1990: 91-93
35

[11] Anthony R. DiTrapani and Robert W. Shuford. MSC Overtime Distribution, 1993-2000, Sep 2001 (CNA Annotated Briefing D0004847.A1/Final)
[12] Bryan Jovanovic. “Firm-Specific Capital and Turnover.” The Journal of Political Economy, Vol. 87, No. 6, Dec 1979: 1246-1260
[13] W. Groot and M. Verberne. “Aging, Job Mobility, and Compensation.” Oxford Economic Papers (New Series), Vol. 49, No. 3, Jul 1997: 380-403
36

List of figures
Figure 1. Overall MSC attrition rates . . . . . . . . . . . . . . 13
Figure 2. Attrition rates by license . . . . . . . . . . . . . . . 14
Figure 3. Attrition rates for certain unlicensed ratings . . . . 15
Figure 4. Attrition rates by tenure. . . . . . . . . . . . . . . . 16
Figure 5. Attrition rates for new accessions vs. experienced mariners . . . . . . . . . . . . . . . . . . . . . . . . 17
Figure 6. Attrition rates by coast . . . . . . . . . . . . . . . . 17
Figure 7. MSC overall experience level . . . . . . . . . . . . . 18
Figure 8. Shore leave balances for attriters and stayers . . . . 21
Figure 9. Shore leave balances and 6-month previous balances . . . . . . . . . . . . . . . . . . . . . . . . 22
37

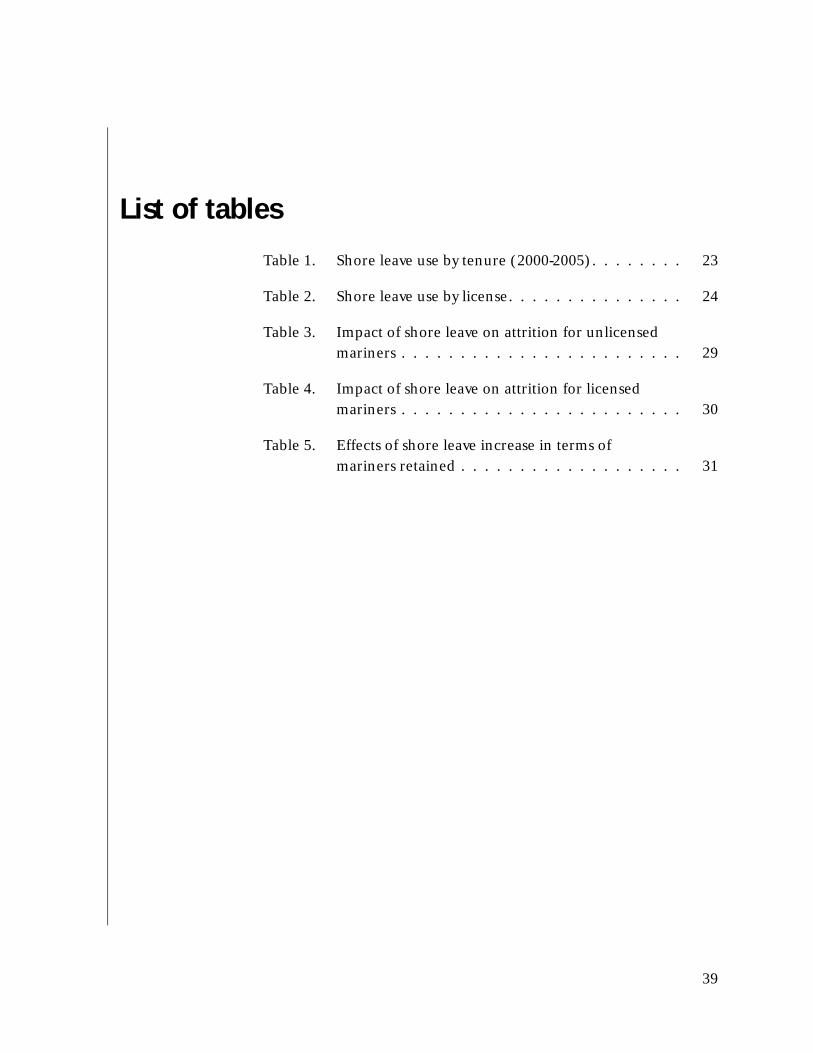
List of tables
Table 1. Shore leave use by tenure (2000-2005). . . . . . . . 23
Table 2. Shore leave use by license. . . . . . . . . . . . . . . 24
Table 3. Impact of shore leave on attrition for unlicensed mariners . . . . . . . . . . . . . . . . . . . . . . . . 29
Table 4. Impact of shore leave on attrition for licensed mariners . . . . . . . . . . . . . . . . . . . . . . . . 30
Table 5. Effects of shore leave increase in terms of mariners retained . . . . . . . . . . . . . . . . . . . 31
39


CR
M D
0013
980.
A4/
1RE
V