
Analysis of Capsule V from Pacific Gas & Electric Company Diablo Canyon Unit … · 2012. 11....
272
Westinghouse Non-Proprietary Class 3 Analysis of Capsule V from Pacific Gas and Electric Company Diablo Canyon Unit 2 Reactor Vessel Radiation Surveillance Program Westinghouse Electric Company LLC
Transcript of Analysis of Capsule V from Pacific Gas & Electric Company Diablo Canyon Unit … · 2012. 11....
Westinghouse Non-Proprietary Class 3
Analysis of Capsule V from
Pacific Gas and Electric Company Diablo Canyon
Unit 2 Reactor Vessel Radiation Surveillance Program
Westinghouse Electric Company LLC

WESTINGHOUSE NON-PROPRIETARY CLASS 3
WCAP-15423, Revision 0
Analysis of Capsule V from Pacific Gas and Electric Company Diablo Canyon Unit 2 Reactor Vessel Radiation
Surveillance Program
B. Burgos, ATI E. Terek, W
S. L. Anderson, W J. Conermann, W
September 2000
Approved:_d:________ D. M. 'erombola, Manager Mechanical Systems Integration
Approved:_ _ C. H. Boyd, Manager Equipment & Materials Technology
Westinghouse Electric Company LLC Energy Systems
P.O. Box 355 Pittsburgh, PA 15230-0355
©2000 Westinghouse Electric Company LLC All Rights Reserved

iii
TABLE OF CONTENTS
LIST O F TA B LE S ....................................................................................................................................... iv
L IST O F FIG U R E S .................................................................................................................................... vii
PR E FA C E ................................................................................................................................................... x
EXECU TIVE SU M M A RY .......................................................................................................................... xi
SUMMARY OF RESULTS ......................................................................................................... 1-1
2 IN TR O D U C TIO N ........................................................................................................................ 2-1
3 B A CK G R O U N D ......................................................................................................................... 3-1
4 DESCRIPTION OF PROGRAM ................................................................................................. 4-1
5 TESTING OF SPECIMENS FROM CAPSULE V ..................................................................... 5-1 5.1 O V ER V IEW .................................................................................................................... 5-1 5.2 CHARPY V-NOTCH IMPACT TEST RESULTS ......................................................... 5-3 5.3 TENSILE TEST RESULTS ............................................................................................ 5-5 5.4 1/2T COMPACT TENSION AND BEND BAR SPECIMEN TESTS ........................... 5-5
6 RADIATION ANALYSIS AND NEUTRON DOSIMETRY ..................................................... 6-1 6.1 IN TR O DU CTION ........................................................................................................ 6-1
6.2 DISCRETE ORDINATES ANALYSIS .......................................................................... 6-2
6.3 NEUTRON DOSIMETRY .............................................................................................. 6-4
6.4 PROJECTIONS OF REACTOR VESSEL EXPOSURE ................................................ 6-8
7 SURVEILLANCE CAPSULE REMOVAL SCHEDULE ........................................................... 7-1
8 RE FERE N C E S ............................................................................................................................. 8-1
APPENDIX A LOAD-TIME RECORDS FOR CHARPY SPECIMEN TESTS ....................... A-0 APPENDIX B CHARPY V-NOTCH SHIFT RESULTS FOR EACH CAPSULE PREVIOUS
FIT VS. SYMMETRIC HYPERBOLIC TANGENT CURVE-FITTING METHOD (CVGRAPGH, VERSION 4.1) .............................................................. B-0
APPENDIX C CHARPY V-NOTCH PLOTS FOR EACH CAPSULE USING SYMMETRIC HYPERBOLIC TANGENT CURVE-FITTING METHOD .............................. C-0
APPENDIX D DIABLO CANYON UNIT 2 SURVEILLANCE PROGRAM CREDIBILITY A N ALY SIS ......................................................................................................... D -0

iv
LIST OF TABLES
Table 4-1 Heat Treatment History of the Diablo Canyon Unit 2 Reactor Vessel Surveillance M aterials .......................................................................................................................... 4-3
Table 4-2 Chemical Composition (wt%) of the Diablo Canyon Unit 2 Reactor Vessel Surveillance M aterial (U nirradiated) ................................................................................................... 4-4
Table 4-3 Best Estimate Chemical Composition for Surveillance Weld Metal (heat number 12008/2 1935) .................................................................................................................. 4-5
Table 4-4 Best Estimate Chemical Composition for Intermediate Shell Plate B5454-1 Surveillance M aterial ........................................................................................................................... 4-6
Table 5-1 Charpy V-Notch Data for the Diablo Canyon Unit 2 Intermediate Shell Plate B5454-1 Irradiated to a Fluence of 2.41 x 10¹⁹ n/cm 2 (E > 1.0 MeV) (Longitudinal O rientation) .............................................................................................. 5-6
Table 5-2 Charpy V-notch Data for the Diablo Canyon Unit 2 Intermediate Shell Plate B5454-1 Irradiated to a Fluence of 2.41 x 10'9 n/cm2 (E> 1.0 MeV) (Transverse O rientation) ................................................................................................. 5-7
Table 5-3 Charpy V-notch Data for the Diablo Canyon Unit 2 Surveillance Weld Metal Irradiated to a Fluence of 2.41 x 10'9 n/cm2 (E> 1.0 MeV) ............................................ 5-8
Table 5-4 Charpy V-notch Data for the Diablo Canyon Unit 2 Heat Affected Zone Material Irradiated to a Fluence of 2.41 x 10t" n/cm 2 (E> 1.0 MeV) ............................................ 5-9
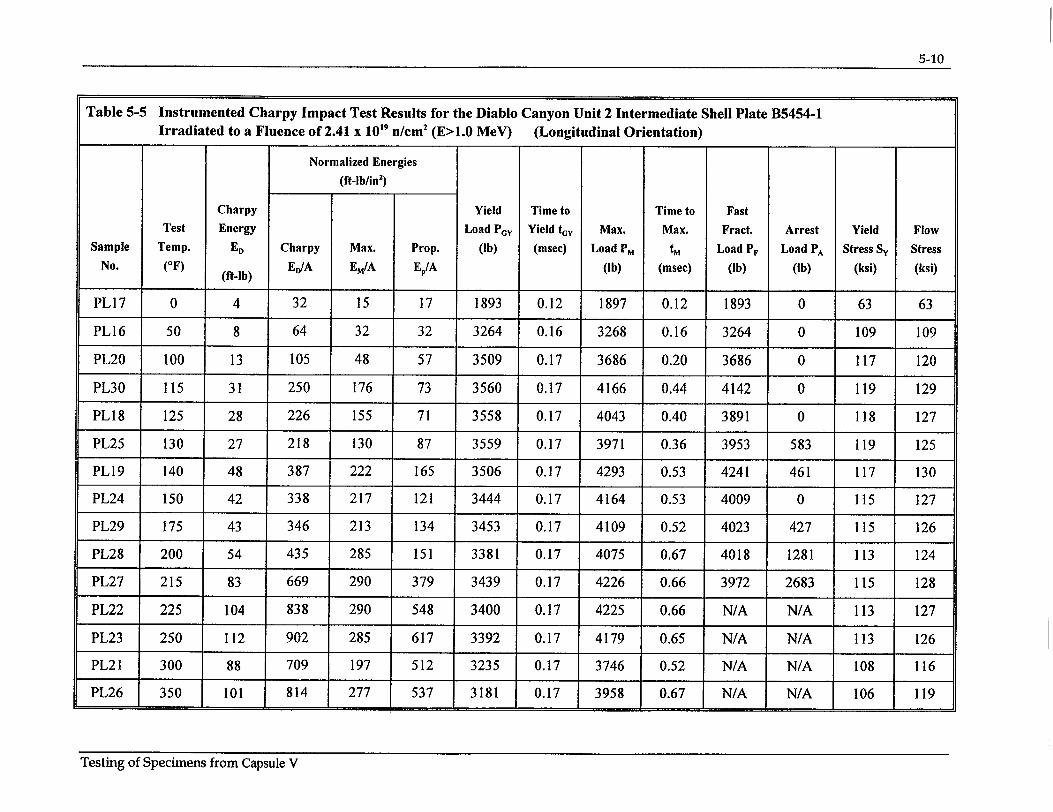
Table 5-5 Instrumented Charpy Impact Test Results for the Diablo Canyon Unit 2 Intermediate Shell Plate B5454-1 Irradiated to a Fluence of 2.41 x 10¹⁹ n/cm 2 (E> 1.0 MeV) (Longitudinal O rientation) ............................................................................................ 5-10
Table 5-6 Instrumented Charpy Impact Test Results for the Diablo Canyon Unit 2 Intermediate Shell Plate B5454-1 Irradiated to a Fluence of 2.41 x 10'9 n/cm2 (E> 1.0 MeV) (Transverse O rientation) ............................................................................................... 5-11
Table 5-7 Instrumented Charpy Impact Test Results for the Diablo Canyon Unit 2 Surveillance Weld Metal Irradiated to a Fluence of 2.41 x 10'9 n/cm 2 (E> 1.0MeV) ....................... 5-12

V
LIST OF TABLES (Cont.)
Table 5-8 Instrumented Charpy Impact Test Results for the Diablo Canyon Unit 2 Heat-AffectedZone (HAZ) Metal Irradiated to a Fluence of 2.41 x 10¹⁹ n/cm 2 (E> 1.0MeV) ......... 5-13
Table 5-9 Effect of Irradiation to 2.41 x 10¹⁹ n/cm2 (E> 1.0 MeV) on the Notch Toughness Properties of the Diablo Canyon Unit 2 Reactor Vessel Surveillance Materials .......... 5-14
Table 5-10 Comparison of the Diablo Canyon Unit 2 Surveillance Material 30 ft-lb Transition Temperature Shifts and Upper Shelf Energy Decreases with Regulatory Guide 1.99, R evision 2, Predictions .................................................................................................. 5-15
Table 5-11 Tensile Properties of the Diablo Canyon Unit 2 Reactor Vessel Surveillance Materials Irradiated to 2.41 x 10¹⁹ n/cm 2 (E> 1.0M eV) .............................................................. 5-16
Table 6-1 Calculated Fast Neutron Exposure Rates and Iron Atom Displacement Rates at the Surveillance Capsule Center ............................................................................... 6-12
Table 6-2 Calculated Azimuthal Variation of Fast Neutron Exposure Rates and Iron Atom Displacement Rates at the Reactor Vessel Clad/Base Metal Interface ............... 6-14
Table 6-3 Relative Radial Distribution of 4(E> 1.0 MeV) Within the Reactor Vessel Wall ........ 6-16
Table 6-4 Relative Radial Distribution of O(E> 0.1 MeV) Within the Reactor Vessel Wall ........ 6-17
Table 6-5 Relative Radial Distribution of dpa/sec Within the Reactor Vessel Wall. .................... 6-18
Table 6-6 Nuclear Parameters Used in the Evaluation of Neutron Sensors .................................. 6-19
Table 6-7 Monthly Thermal Generation During The First Nine Fuel Cycles of the Diablo Canyon U nit 2 Reactor ...................................................................................... 6-20
Table 6-8 Measured Sensor Activities and Reaction Rates - Surveillance Capsule U ............................................................................... 6-23 - Surveillance Capsule X ............................................................................... 6-24 - Surveillance Capsule Y ............................................................................... 6-25 - Surveillance Capsule V ............................................................................... 6-26
Table 6-9 Summary of Neutron Dosimetry Results Surveillance Capsules U, X, Y and V ......... 6-27
Table 6-10 Comparison of Measured, Calculated and Best Estimate Reaction Rates at the Surveillance Capsule Center ............................................................................... 6-28

vi
LIST OF TABLES (Cont.)
Table 6-11 Best Estimate Neutron Energy Spectrum at the Center of Surveillance Capsules - C apsule U .................................................................................................. 6-30 - C apsule X ................................................................................................... 6-31 - C apsule Y ................................................................................................... 6-32 - C apsule V .................................................................................................. 6-33
Table 6-12 Comparison of Calculated and Best Estimate Integrated Neutron Exposure of Diablo Canyon Unit 2 Surveillance Capsules U, X, Y and V .................. 6-34
Table 6-13 Azimuthal Variation of the Neutron Exposure Projections on the Reactor Vessel Clad/Base Metal Interface at Core Midplane ................................................................ 6-35
Table 6-14 Neutron Exposure Values Within the Diablo Canyon Unit 2 Reactor Vessel .............. 6-37
Table 6-15 Updated Lead Factors for Diablo Canyon Unit 2 Surveillance Capsules ..................... 6-41
Table 7-1 Diablo Canyon Unit 2 Reactor Vessel Surveillance Capsule Withdrawal Schedule ...... 7-1

vii
LIST OF FIGURES
Figure 4-1 Arrangement of Surveillance Capsules in the Diablo Canyon Unit 2 Reactor Vessel ... 4-7
Figure 4-2 Capsule V Diagram Showing the Location of Specimens, Thermal M onitors, and D osim eters ............................................................................................... 4-8
Figure 5-1 Charpy V-Notch Impact Energy vs. Temperature for Diablo Canyon Unit 2 Reactor Vessel Intermediate Shell Plate B5454-1 (Longitudinal Orientation) .......................... 5-17
Figure 5-2 Charpy V-Notch Lateral Expansion vs. Temperature for Diablo Canyon Unit 2 Reactor Vessel Intermediate Shell Plate B5454-1 (Longitudinal Orientation) .......................... 5-18
Figure 5-3 Charpy V-Notch Percent Shear vs. Temperature for Diablo Canyon Unit 2 Reactor Vessel Intermediate Shell Plate B5454-1 (Longitudinal Orientation) .......................... 5-19
Figure 5-4 Charpy V-Notch Impact Energy vs. Temperature for Diablo Canyon Unit 2 Reactor Vessel Intermediate Shell Plate B5454-1 (Transverse Orientation) ............................. 5-20
Figure 5-5 Charpy V-Notch Lateral Expansion vs. Temperature for Diablo Canyon Unit 2 Reactor Vessel Intermediate Shell Plate B5454-1 (Transverse Orientation) ............... 5-21
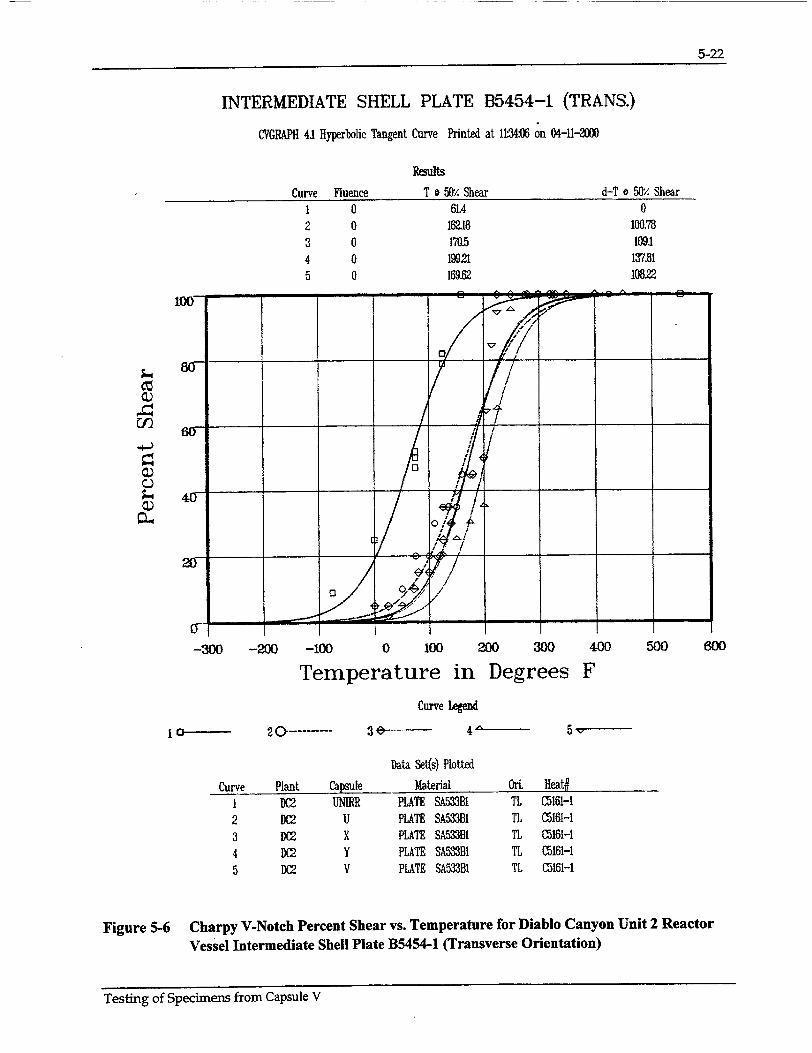
Figure 5-6 Charpy V-Notch Percent Shear vs. Temperature for Diablo Canyon Unit 2 Reactor Vessel Intermediate Shell Plate B5454-1 (Transverse Orientation) ............................. 5-22
Figure 5-7 Charpy V-Notch Impact Energy vs. Temperature for Diablo Canyon Unit 2 Reactor V essel W eld M etal ........................................................................................... 5-23
Figure 5-8 Charpy V-Notch Lateral Expansion vs. Temperature for Diablo Canyon Unit 2 Reactor Vessel W eld M etal ........................................................................................... 5-24
Figure 5-9 Charpy V-Notch Percent Shear vs. Temperature for Diablo Canyon Unit 2 Reactor V essel W eld M etal ........................................................................................................ 5-25
Figure 5- 10 Charpy V-Notch Impact Energy vs. Temperature for Diablo Canyon Unit 2 Reactor Vessel Heat-Affected-Zone M aterial ............................................................................ 5-26
Figure 5-11 Charpy V-Notch Lateral Expansion vs. Temperature for Diablo Canyon Unit 2 Reactor Vessel Heat-Affected-Zone Material ............................................................... 5-27
Figure 5-12 Charpy V-Notch Percent Shear vs. Temperature for Diablo Canyon Unit 2 Reactor Vessel Heat-Affected-Zone M aterial ............................................................................ 5-28
Figure 5-13 Charpy Impact Specimen Fracture Surfaces for Diablo Canyon Unit 2 Reactor Vessel Intermediate Shell Plate B5454-1 (Longitudinal Orientation) .......................... 5-29

viii
Figure 5-14
Figure 5-15
Figure 5-16
Figure 5-17
Figure 5-18
Figure 5-19
Figure 5-20
Figure 5-21
Figure 5-22
Figure 5-23
Figure 5-24
Figure 5-25
Figure 5-26
Figure 5-27
Figure 5-28
LIST OF FIGURES (Cont.)
Charpy Impact Specimen Fracture Surfaces for Diablo Canyon Unit 2 Reactor Vessel Intermediate Shell Plate B5454-1 (Transverse Orientation) ......................................... 5-30
Charpy Impact Specimen Fracture Surfaces for Diablo Canyon Unit 2 Reactor Vessel W eld M etal ................................................................................................................... 5-3 1
Charpy Impact Specimen Fracture Surfaces for Diablo Canyon Unit 2 Reactor Vessel Heat-Affected-Zone M etal ............................................................................................ 5-32
Tensile Properties for Diablo Canyon Unit 2 Reactor Vessel Intermediate Shell Plate B5454-1 (Longitudinal Orientation) ............................................................................. 5-33
Tensile Properties for Diablo Canyon Unit 2 Reactor Vessel Intermediate Shell Plate B5454-1 (Transverse Orientation) ................................................................................ 5-34
Tensile Properties for Diablo Canyon Unit 2 Reactor Vessel Weld Metal .................. 5-35
Fractured Tensile Specimens from Diablo Canyon Unit 2 Reactor Vessel Intermediate Shell Plate B5454-1 (Longitudinal Orientation) ..................................... 5-36
Fractured Tensile Specimens from Diablo Canyon Unit 2 Reactor Vessel Intermediate Shell Plate B5454-1 (Transverse Orientation) ......................................... 5-37
Fractured Tensile Specimens from Diablo Canyon Unit 2 Reactor Vessel W eld M etal .................................................................................................................... 5-38
Engineering Stress-Strain Curves for Intermediate Shell Plate B5454-1 Tensile Specimens PL4 and PL5 (Longitudinal Orientation) ....................................... 5-39
Engineering Stress-Strain Curve for Intermediate Shell Plate B5454-1 Tensile Specimen PL6 (Longitudinal Orientation) ....................................................... 5-40
Engineering Stress-Strain Curves for Intermediate Shell Plate B5454-1 Tensile Specimens PT4 and PT5 (Transverse Orientation) .......................................... 5-41
Engineering Stress-Strain Curve for Intermediate Shell Plate B5454-1 Tensile Specimen PT6 (Transverse Orientation) .......................................................... 5-42
Engineering Stress-Strain Curves for Weld Metal Tensile Specimens PW 4 and PW 5 ............................................................................................................... 5-43
Engineering Stress-Strain Curve for Weld Metal Tensile Specimen PW 6 ............................................................................................... 5-44

ix
Figure 6-1 Plan View of a Dual Reactor Vessel Surveillance Capsule ................................... 6-11

x
PREFACE
This report has been technically reviewed and verified by:
Reviewer:
Sections 1 through 5, 7, 8, Appendices A, B and C
Section 6
E. Terek _ _
R. K. Disney n

xi
EXECUTIVE SUMMARY
The purpose of this report is to document the results of the testing of surveillance Capsule V from Diablo Canyon Unit 2. Capsule V was removed at 11.49 EFPY and post irradiation mechanical tests of the Charpy V-notch and tensile specimens was performed. A fluence evaluation utilizing the recently released neutron transport and dosimetry cross-section libraries derived from the ENDF/B-VI data base. Capsule V received a fluence of 2.41 x 10¹⁹ n/cm2 after irradiation to 11.49 EFPY. The peak clad/base metal interface vessel fluence after 11.49 EFPY of plant operation was 5.23 x 10¹⁸ n/cm2 . This
evaluation lead to the following conclusions: Specimen results are behaving in accordance with predictions, the surveillance program meets the regulatory criteria for credibility, and capsule V is the last planned capsule to be evaluated in the Diablo Canyon Unit 2 surveillance program. A brief summary of the Charpy V-notch testing can be found in Section 1. All Charpy V-notch data was plotted using a symmetric hyperbolic tangent curve fitting program.

i-i
1 SUMMARY OF RESULTS
The analysis of the reactor vessel materials contained in surveillance Capsule V, the fourth capsule to be removed from the Diablo Canyon Unit 2 reactor pressure vessel, led to the following conclusions:
The Charpy V-notch data presented in WCAP-8783 [3], WCAP- 11851 [4] and WCAP-12811 [5]
and WCAP-14363 [6] were based on Charpy curves using a hyperbolic tangent curve-fitting routine. The only "hand fit" curves in the Diablo Canyon Unit 2 surveillance program were unirradiated data curve fits done by W in WCAP-8783. The results presented in this report are based on a re-plot of all capsule data using CVGRAPH, Version 4.1. which is a symmetric hyperbolic tangent curve-fitting program. Appendix B presents a comparison of the Charpy VNotch test results for each capsule based on previous fit vs. symmetric hyperbolic tangent fit. Appendix C presents the CVGRAPH, Version 4.1, Charpy V-notch plots and the program input data.
* Capsule V received an average fast neutron fluence (E> 1.0 MeV) of 2.41 x 10¹⁹ n/cm 2 after 11.49 effective full power years (EFPY) of plant operation.
* Irradiation of the reactor vessel intermediate shell plate B5454-1 (heat number C5161-1) Charpy specimens, oriented with the longitudinal axis of the specimen parallel to the major working direction (longitudinal orientation), resulted in an irradiated 30 ft-lb transition temperature of 129.9°F and an irradiated 50 ft-lb transition temperature of 162.3°F. This results in a 30 ft-lb transition temperature increase of 123.4'F and a 50 ft-lb transition temperature increase of 129.9'F for the longitudinal oriented specimens.
* Irradiation of the reactor vessel intermediate shell plate B5454-1 (heat number C5161-1) Charpy specimens, oriented with the longitudinal axis of the specimen perpendicular to the major working direction of the plate (transverse orientation), resulted in an irradiated 30 ft-lb transition temperature of 138.7°F and an irradiated 50 ft-lb transition temperature of 187.1'F. This results in a 30 ft-lb transition temperature increase of 112.9'F and a 50 ft-lb transition temperature increase of 1 14.3°F for transverse oriented specimens.
* Irradiation of the weld metal (heat number 12008/21935) Charpy specimens resulted in an irradiated 30 ft-lb transition temperature of 212.0°F and an irradiated 50 ft-lb transition temperature of 242.40F. This results in a 30 ft-lb transition temperature increase of 224.5'F and a 50 ft-lb transition temperature increase of 227.8'F.
* Irradiation of the weld Heat-Affected-Zone (HAZ) metal Charpy specimens resulted in an irradiated 30 ft-lb transition temperature of 64.1 OF and an irradiated 50 ft-lb transition temperature of 161.5'F. This results in a 30 ft-lb transition temperature increase of 291.5'F and a 50 ft-lb transition temperature increase of 313.8'F.
Summary of Results
1-2
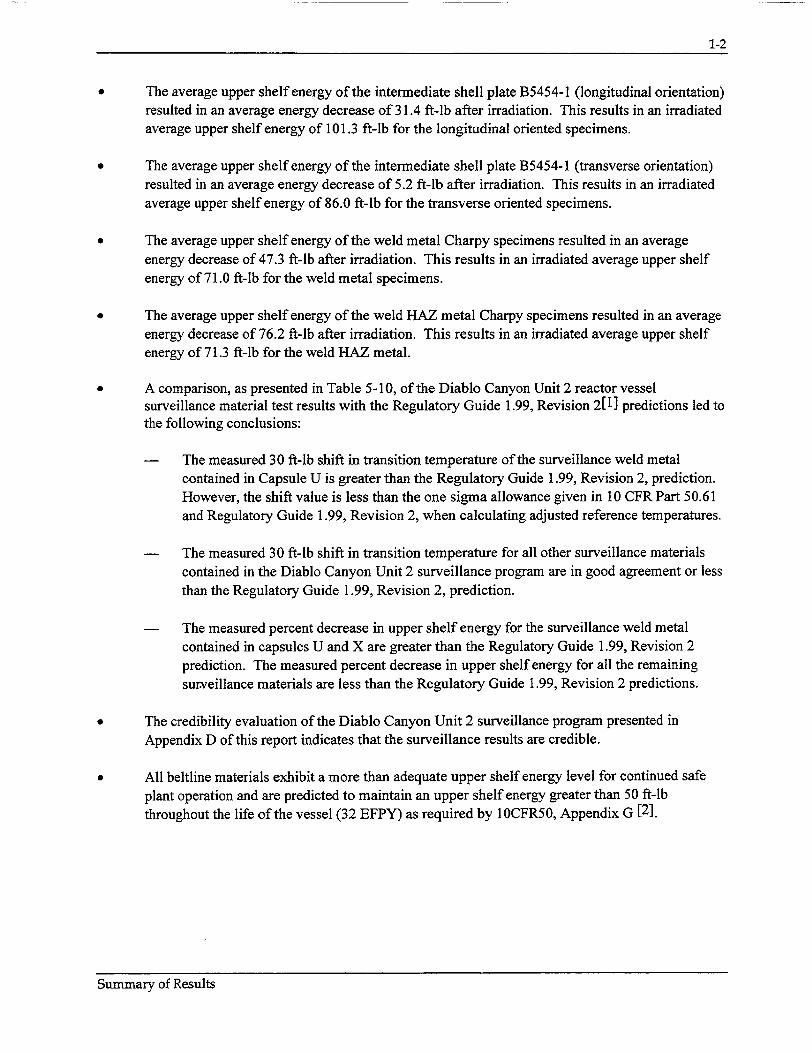
The average upper shelf energy of the intermediate shell plate B5454-1 (longitudinal orientation) resulted in an average energy decrease of 31.4 ft-lb after irradiation. This results in an irradiated average upper shelf energy of 101.3 ft-lb for the longitudinal oriented specimens.
* The average upper shelf energy of the intermediate shell plate B5454-I (transverse orientation) resulted in an average energy decrease of 5.2 ft-lb after irradiation. This results in an irradiated average upper shelf energy of 86.0 ft-lb for the transverse oriented specimens.
* The average upper shelf energy of the weld metal Charpy specimens resulted in an average energy decrease of 47.3 ft-lb after irradiation. This results in an irradiated average upper shelf energy of 71.0 ft-lb for the weld metal specimens.
0 The average upper shelf energy of the weld HAZ metal Charpy specimens resulted in an average energy decrease of 76.2 ft-lb after irradiation. This results in an irradiated average upper shelf energy of 71.3 ft-lb for the weld HAZ metal.
* A comparison, as presented in Table 5-10, of the Diablo Canyon Unit 2 reactor vessel surveillance material test results with the Regulatory Guide 1.99, Revision 2[1] predictions led to the following conclusions:
- The measured 30 ft-lb shift in transition temperature of the surveillance weld metal contained in Capsule U is greater than the Regulatory Guide 1.99, Revision 2, prediction. However, the shift value is less than the one sigma allowance given in 10 CFR Part 50.61 and Regulatory Guide 1.99, Revision 2, when calculating adjusted reference temperatures.
- The measured 30 ft-lb shift in transition temperature for all other surveillance materials contained in the Diablo Canyon Unit 2 surveillance program are in good agreement or less than the Regulatory Guide 1.99, Revision 2, prediction.
- The measured percent decrease in upper shelf energy for the surveillance weld metal contained in capsules U and X are greater than the Regulatory Guide 1.99, Revision 2 prediction. The measured percent decrease in upper shelf energy for all the remaining surveillance materials are less than the Regulatory Guide 1.99, Revision 2 predictions.
The credibility evaluation of the Diablo Canyon Unit 2 surveillance program presented in Appendix D of this report indicates that the surveillance results are credible.
All beltline materials exhibit a more than adequate upper shelf energy level for continued safe plant operation and are predicted to maintain an upper shelf energy greater than 50 ft-lb throughout the life of the vessel (32 EFPY) as required by 1 OCFR50, Appendix G [2].
Summary of Results

1-3
The calculated and best estimate end-of-license (32 EFPY) neutron fluence (E> 1.0 MeV) at the core midplane for the Diablo Canyon Unit 2 reactor vessel using the Regulatory Guide 1.99, Revision 2 attenuation formula (i.e., Equation #3 in the guide) are as follows:
Calculated:
Best Estimate:
Vessel inner radius* = 1.40 x 10¹⁹ n/cm 2
Vessel 1/4 thickness = 8.34 x 10¹⁸ n/cm 2
Vessel 3/4 thickness = 2.96 x 10¹⁸ n/cm2
Vessel inner radius* = 1.28 x 10¹⁹ n/cm2
Vessel 1/4 thickness = 7.63 x 10¹⁸ n/cm2
Vessel 3/4 thickness = 2.71 x 10¹⁸ n/cm 2
*Clad/base metal interface
Summary of Results

2-1
2 INTRODUCTION
This report presents the results of the examination of Capsule V, the fourth capsule removed from the reactor in the continuing surveillance program which monitors the effects of neutron irradiation on the Pacific Gas and Electric Company Diablo Canyon Unit 2 reactor pressure vessel materials under actual operating conditions.
The surveillance program for the Pacific Gas and Electric Company Diablo Canyon Unit 2 reactor pressure vessel materials was designed and recommended by the Westinghouse Electric Corporation. A description of the surveillance program and the pre-irradiation mechanical properties of the reactor vessel materials are presented in WCAP-8783, "Pacific Gas and Electric Company Diablo Canyon Unit No. 2 Reactor Vessel Radiation Surveillance Program" [31. The surveillance program was planned to cover the 40-year design life of the reactor pressure vessel and was based on ASTM E185-73, "Standard Recommended Practice for Surveillance Tests for Nuclear Reactor Vessels". Capsule V was removed from the reactor after 11.49 EFPY of exposure and shipped to the Westinghouse Science and Technology Center Hot Cell Facility, where the post-irradiation mechanical testing of the Charpy V-notch impact and tensile surveillance specimens was performed.
The Charpy V-notch data presented in WCAP-8783 [3], WCAP- 11851 [4], WCAP- 12811 [5] and WCAP-14363 [6] were based on a combination of hand-fit Charpy curves using engineering judgment and hyperbolic tangent curve-fitting. The only "hand fit" curves in the Diablo Canyon Unit 2 surveillance program were unirradiated data curve fits done byW in WCAP-8783. The results presented in this report are based on a re-plot of all capsule data using CVGRAPH, Version 4.1, which is a symmetric hyperbolic tangent curve-fitting program. Appendix B presents a comparison of the Charpy V-Notch test results of previous curve fits vs. the symmetric hyperbolic tangent fit. Appendix C presents the CVGRAPH, Version 4.1, Charpy V-notch plots and the program input data.
Introduction

3-1
3 BACKGROUND
The ability of the large steel pressure vessel containing the reactor core and its primary coolant to resist
fracture constitutes an important factor in ensuring safety in the nuclear industry. The beltline region of the reactor pressure vessel is the most critical region of the vessel because it is subjected to significant fast neutron bombardment. The overall effects of fast neutron irradiation on the mechanical properties of
low alloy, ferritic pressure vessel steels such as SA533 Grade B Class I (base material of the Diablo
Canyon Unit 2 reactor pressure vessel beltline) are well documented in the literature. Generally, low alloy ferritic materials show an increase in hardness and tensile properties and a decrease in ductility and toughness during high-energy irradiation.
A method for ensuring the integrity of reactor pressure vessels has been presented in "Fracture Toughness Criteria for Protection Against Failure," Appendix G to Section XI of the ASME Boiler and Pressure Vessel Code [7]. The method uses fracture mechanics concepts and is based on the reference nil-ductility transition temperature (RTNDT).
RTNDT is defined as the greater of either the drop weight nil-ductility transition temperature (NDTT per ASTM E-208 [8]) or the temperature 60*F less than the 50 ft-lb (and 35-mil lateral expansion) temperature as determined from Charpy specimens oriented perpendicular (Transverse) to the major working direction of the plate. The RTNDT of a given material is used to index that material to a
reference stress intensity factor curve (KIc curve) which appears in Appendix G to the ASME Code[ 7].
The KIc curve is a lower bound of static fracture toughness results obtained from several heats of pressure vessel steel. When a given material is indexed to the KIc curve, allowable stress intensity factors can be obtained for this material as a function of temperature. Allowable operating limits can then
be determined using these allowable stress intensity factors.
RTNDT and, in turn, the operating limits of nuclear power plants can be adjusted to account for the effects of radiation on the reactor vessel material properties. The changes in mechanical properties of a
given reactor pressure vessel steel, due to irradiation, can be monitored by a reactor vessel surveillance
program, such as the Diablo Canyon Unit 2 reactor vessel radiation surveillance program [3], in which a
surveillance capsule is periodically removed from the operating nuclear reactor and the encapsulated specimens tested. The increase in the average Charpy V-notch 30 ft-lb temperature (ARTNDT) due to
irradiation is added to the initial RTNDT, along with a margin (M) to cover uncertainties, to adjust the
RTNDT (ART) for radiation embrittlement. This ART (RTNDT initial + M + ARTNDT) is used to index the material to the KIc curve and, in turn, to set operating limits for the nuclear power plant that take into account the effects of irradiation on the reactor vessel materials.
Background

4-1
4 DESCRIPTION OF PROGRAM
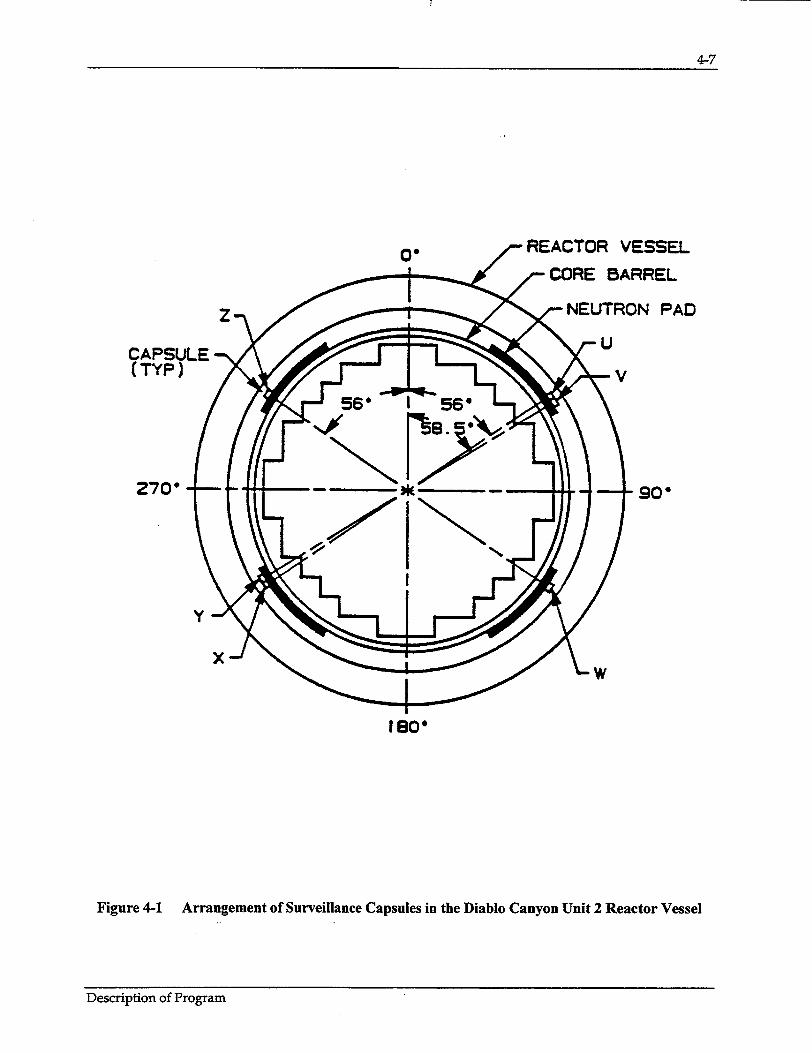
Six surveillance capsules for monitoring the effects of neutron exposure on the Diablo Canyon Unit 2 reactor pressure vessel core region (beltline) materials were inserted in the reactor vessel prior to initial plant start-up. The six capsules were positioned in the reactor vessel between the neutron pads and the vessel wall as shown in Figure 4-1. The vertical center of the capsules is opposite the vertical center of the core.
Capsule V was removed after 11.49 effective full power years (EFPY) of plant operation. This capsule contained Charpy V-notch, tensile, and 1/2T-CT fracture mechanics specimens made from intermediate shell plate B5454-1 (heat number C5161-1) and submerged arc weld metal fabricated with the same weld wire heat 12008/21935 and Linde 1092 flux lot as used in the reactor vessel intermediate shell
longitudinal weld seams. In addition, this capsule contained Charpy V-notch specimens from the weld
Heat-Affected-Zone (HAZ) material and one plate B5454-1 bend bar specimen.
Test material obtained from the Intermediate Shell Plate (after the thermal heat treatment and forming of the plate) was taken at least one plate thickness (9 5/8 inches) from the quenched edges of the plate. All
test specimens were machined from the 1/4 thickness location of the plate after performing a simulated post-weld stress-relieving treatment. Specimens were machined from weld metal and heat-affected-zone metal from a stress-relieved weldment joining sections of two intermediate shell plates. All heataffected-zone specimens were obtained from the weld heat-affected-zone of plate B5454- 1.
Charpy V-notch impact specimens from intermediate shell plate B5454-1 were machined both in the longitudinal orientation (longitudinal axis of the specimen parallel to the major rolling direction) and
transverse orientation (longitudinal axis of the specimen perpendicular to the major rolling direction). The core region weld Charpy impact specimens were machined from the weldment such that the long
dimension of each Charpy specimen was perpendicular to the weld direction. The notch of the weld
metal Charpy specimens was machined such that the direction of crack propagation in the specimen was in the welding direction.
Capsule V also contained one bend bar specimen from intermediate shell plate B5454-1, machined such that the simulated crack in the specimen would propagate in the rolling direction of the plate. The bend
bar specimen was fatigue pre-cracked according to ASTM E399.
Tensile specimens from intermediate shell plate B5454-1 were machined in both the longitudinal and
transverse orientation. Tensile specimens from the weld metal were oriented with the long dimension of the specimen perpendicular to the weld direction.
Compact tension test specimens from intermediate shell plate B5454-1 were machined in both the longitudinal and transverse orientations. Compact tension test specimens from the weld metal were machined perpendicular to the weld direction with the notch oriented in the direction of the weld. The compact tension specimens were fatigue pre-cracked according to ASTM E399.
Description of Program

4-2
The heat treatment of the surveillance materials is presented in Table 4-1. The chemical composition of the unirradiated surveillance material [3] is presented in Table 4-2. No chemical analyses were performed for the surveillance materials in capsule V. Therefore, the best estimate copper and nickel weight percent values for the surveillance materials where based on previous data and are presented in Tables 4-3 and 4-4.
Capsule V contained dosimeter wires of pure copper, iron, nickel, and aluminum 0.15 weight percent cobalt (cadmium-shielded and unshielded). In addition, cadmium shielded fission monitors of neptunium (Np2 37) and uranium (U2 3 8) were placed in the capsule to measure the integrated flux at specific neutron energy levels.
The capsule contained thermal monitors made from two low-melting-point eutectic alloys and sealed in Pyrex tubes. These thermal monitors were used to define the maximum temperature attained by the test specimens during irradiation. The composition of the two eutectic alloys and their melting points are as follows:
2.5% Ag, 97.5% Pb Melting Point: 579°F (304'C)
1.5% Ag, 0.75% Sn, 97.5% Pb Melting Point: 590'F (310 0 C)
The arrangement of the various mechanical specimens, dosimeters and thermal monitors contained in Capsule V is shown in Figure 4-2.
Description of Program

4-3
Description of Program
Table 4-1 Heat Treatment History of the Diablo Canyon Unit 2 Reactor Vessel Surveillance Materials [3]
Material Temperature (*F) Time (hrs.) Coolant
Intermediate Shell Plate 1550- 1650 4 Water Quench
B5454-1 1225 ± 25 4 Air Cool
1150 ± 25 40 Furnace Cool
Weld Metal (12008/21935) 1150 ± 25 40 Furnace Cool

Table 4-2 Chemical Composition (wt%) of the Diablo
Canyon Unit 2 Reactor Vessel Surveillance
Material (Unirradiated)[ 3 ]
Element Intermediate Shell Plate Weld Metal (
B5454-1 I Analysis)
SAnalysis)
C 0.23 0.13
Mn 1.28 1.32
P 0.012 0.017
S 0.010 0.010
Si 0.22 0.22
Ni 0.67 0.83
Mo 0.43 0.47
Cr 0.071 0.031
Cu 0.15 0.22
Al 0.031 0.009
Co 0.002 0.012
V 0.001 0.01
Sn 0.010 0.010
N 0.008 0.008
Notes:
a. Surveillance weldment made from sections of plate B5454-1
and adjoining intermediate shell plate B5454-2 using weld
wire representative of that used in the original fabrication.
Description of Program
4-4

4-5
* The surveillance weld was made with a tandem wire submerged arc
weld process using the same weld wires Heat 12008 and 21935 and Linde 1092 Flux Lot as the beltline region reactor vessel intermediate shell longitudinal weld seams. Linde 1092 Flux lot 3869 was used to fabricate the surveillance weld and the intermediate shell longitudinal weld seams.
The best estimate average Cu & Ni weight percents presented in Table 4-3 do not match those presented in CE Owners Group Report, CE NPSD-1039, Rev. 2 (final report). CE NPSD-1039, Rev. 2, included Cu & Ni weight percent values from WCAP-10754 which is a Diablo Canyon Unit 1 report and does not provide any chemistry values related to the Unit 2 weld metal. In addition, when the values are rounded to two decimal points, the weight percent values are identical with or without the WCAP- 10754 values included. Hence, the values reported by CE from WCAP- 10754 were omitted here.
Description of Program
Table 4-3 Best Estimate Chemical Composition for Surveillance Weld Metal* (heat number 12008/21935)
Reference Cu Ni
(wt %) (wt %)
WCAP-8783 [3] 0.22 0.83
WCAP-11851 [41 0.219 0.86
WCAP-11851 [4] 0.212 0.88
WCAP-11851 [4] 0.213 0.90
WCAP-12811 [51 0.225 0.875
WCAP-12811 [5] 0.213 0.856
WCAP-12811 [5] 0.225 0.877
WCAP-14363 [6] 0.196 0.763
WCAP-14363 [6] 0.240 0.958
WCAP-14363 [6] 0.230 0.910
Best Estimate Average 0.2193 0.8709

4-6
Based on the data provided in Table 4-3 of this report, the best estimate copper and nickel weight percent
values used for the surveillance weld in all calculations documented in this report are as follows:
Cu wt. % = 0.22, and
Niwt.% = 0.87
Based on the data provided in Table 4-4 of this report, the best estimate copper and nickel weight percent
values used for the intermediate shell plate B5454-1 (Heat Number C5161-1) in all calculations
documented in this report are as follows:
Cu wt.% = 0.14, and
Niwt.% = 0.65
Description of Program
Table 4-4 Best Estimate Chemical Composition for Intermediate Shell Plate B5454-1 Surveillance Material
Reference Cu Ni (Wt %) (wt %)
WCAP-8783 [3] 0.15 0.67
WCAP- 11851 [4] 0.134 0.653
WCAP-12811 [5] 0.137 0.656
WCAP-14363 [6] 0.137 0.668
Material Cert.[46] - - 0.62
Lukens Steel Co. 0.15
Letter[4 7]
Best Estimate Average 0.1416 0.6534
4-7
REACTOR VESSEL
/-CORE BARREL
%-NEUTRON PAD
CAPSULE-• /dF [-I- "' (TYP) V
56 • 56"
2700 SO
1I00
w
Figure 4-1 Arrangement of Surveillance Capsules in the Diablo Canyon Unit 2 Reactor Vessel
Description of Program

4-8
LEGEND:
PL- PLATE B5454-1 (LONGITUDINAL)
PT - PLATE B5454-1 (TRANSVERSE)
PW - WELD METAL
PH - HEAT-AFFECTED-ZONE MATERIAL
Np 2 3 7
SU238 I.BEND BAR TENSILES
COMPACT COMPACT TENSION TENSION
Cu
Fe
5790F MONITOR
CHARPY
".PH3
P2PH29
M8pm
~III~~
r
r rotr-I
i-i ;III II F III ~I I
! ., ,i I
COMPACT COMPACT CHARPY CHARPY TENSION TENSION
Al-.45%Co
- Al--.15%Co (Cd)
CHARPY
Cu
Fe
5900 F MONITOR
- Ni
CHARPY DOSIMETER
PI 1I8,
PWI7 17 277
PWi 16
llguaAl
&- J .l=i r1t -t riC-1 A
II, !Ni 11,4 1
"TENSILE CHARPY
PT3 PIL30
PT9PL29
CHARPY CHARPY CHARPY CHARPY
PT22JPL22JTIS PL19 PTIG L1
Cu
Fe-
-. 15%Co (Cd) 5790F MONITOR
I If II I
�4 Ig gi I.. gig gi I 11111 I �gI i I�I U he a-I I-. � -1 lilt �4
lit II I �hi gI g
COMPACT COMPACT TENSION TENSION
-A Al-.15%Co
A1-.15%Co (Cd)
Ni
CENTER REGION OF VESSELTO TOP OF VESSEL TO BOTTOM OF VESSEL
Figure 4-2 Capsule V Diagram Showing the Location of Specimens, Thermal Monitors, and Dosimeters
Description of Program
TENSILES
In

5-1
5 TESTING OF SPECIMENS FROM CAPSULE V
5.1 OVERVIEW
The post-irradiation mechanical testing of the Charpy V-notch impact specimens and tensile specimens was performed in the Remote Metallographic Facility (RMF) at the Westinghouse Science and
Technology Center. Testing was performed in accordance with I OCFR50, Appendices G and H[2 ], ASTM Specification E185-8219], and Westinghouse Procedure RMF 8402, Revision 2 as modified by Westinghouse RMF Procedures 8102, Revision 1, and 8103, Revision 1.
Upon receipt of the capsule at the hot cell laboratory, the specimens and spacer blocks were carefully removed, inspected for identification number, and checked against the master list in WCAP-8783 [3]. No
discrepancies were found.
Examination of the two low-melting point 5797F (304*C) and 590'F (310"C) eutectic alloys indicated no
melting of either type of thermal monitor. Based on this examination, the maximum temperature to
which the test specimens were exposed was less than 5797F (304'C).
The Charpy impact tests were performed per ASTM Specification E23-98[1 01 and RMF Procedure 8103, Revision 1, on a Tinius-Olsen Model 74, 358J machine. The tup (striker) of the Charpy impact test
machine is instrumented with a GRC 930-I instrumentation system, feeding information into an IBM
compatible computer. With this system, load-time and energy-time signals can be recorded in addition to
the standard measurement of Charpy energy (ED). From the load-time curve (Appendix A), the load of
general yielding (PGY), the time to general yielding (tGy), the maximum load (PM), and the time to
maximum load (tM) can be determined. Under some test conditions, a sharp drop in load indicative of
fast fracture was observed. The load at which fast fracture was initiated is identified as the fast fracture
load (PF), and the load at which fast fracture terminated is identified as the arrest load (PA).
The energy at maximum load (EM) was determined by comparing the energy-time record and the load
time record. The energy at maximum load is approximately equivalent to the energy required to initiate a
crack in the specimen. Therefore, the propagation energy for the crack (Ep) is the difference between the
total energy to fracture (ED) and the energy at maximum load (EM).
The yield stress (cy) was calculated from the three-point bend formula having the following expression:
ry = (PGy * L,) /[B * (W_-a)2 * C1 1
where: L = distance between the specimen supports in the impact machine B = the width of the specimen measured parallel to the notch W = height of the specimen, measured perpendicularly to the notch a = notch depth
Testing of Specimens from Capsule V

5-2
The constant C is dependent on the notch flank angle (4)), notch root radius (p) and the type of loading (i.e., pure bending or three-point bending). In three-point bending, for a Charpy specimen in which 4) =450 and p =0.010 inch, Equation 1 is valid with C = 1.21. Therefore, (for L =4W),
OY (PGy* L) /[B * (W-a)2 1.21] (3.33 * PGy* W) /[B ( W-a)2] (2)
For the Charpy specimen, B = 0.394 inch, W = 0.394 inch and a = 0.079 inch. Equation 2 then reduces to:
o, = 33.3 * PGY (3)
where ay is in units of psi and PGY is in units of lbs. The flow stress was calculated from the average of the yield and maximum loads, also using the three-point bend formula.
The symbol A in columns 4, 5, and 6 of Tables 5-5 through 5-8 is the cross-section area under the notch of the Charpy specimens:
A = B *(W - a )=0.1241 sq.in. (4)
Percent shear was determined from post-fracture photographs using the ratio-of-areas methods in compliance with ASTM Specification A370-97[11 ].. The lateral expansion was measured using a dial gage rig similar to that shown in the same specification.
Tensile tests were performed on a 20,000-pound Instron, split-console test machine (Model 1115) per ASTM Specification E8-9911 2 ] and E21-92[ 13], and WMF Procedure 8102, Revision 1. All pull rods, grips, and pins were made of Inconel 718. The upper pull rod was connected through a universal joint to improve axiality of loading. The tests were conducted at a constant crosshead speed of 0.05 inches per minute throughout the test.
Extension measurements were made with a linear variable displacement transducer extensometer. The extensometer knife edges were spring-loaded to the specimen and operated through specimen failure. The extensometer gage length was 1.00 inch. The extensometer is rated as Class B-2 per ASTM E83-96114].
Elevated test temperatures were obtained with a three-zone electric resistance split-tube furnace with a 9-inch hot zone. All tests were conducted in air. Because of the difficulty in remotely attaching a thermocouple directly to the specimen, the following procedure was used to monitor specimen temperatures. Chromel-Alumel thermocouples were positioned at the center and at each end of the gage section of a dummy specimen and in each tensile machine griper. In the test configuration, with a slight load on the specimen, a plot of specimen temperature versus upper and lower tensile machine griper and controller temperatures was developed over the range from room temperature to 5500F. During the actual testing, the grip temperatures were used to obtain desired specimen temperatures. Experiments have indicated that this method is accurate to +2°F.
The yield load, ultimate load, fracture load, total elongation, and uniform elongation were determined directly from the load-extension curve. The yield strength, ultimate strength, and fracture strength were
Testing of Specimens from Capsule V

5-3
calculated using the original cross-sectional area. The final diameter and final gage length were determined from post-fracture photographs. The fracture area used to calculate the fracture stress (true stress at fracture) and percent reduction in area was computed using the final diameter measurement.
5.2 CHARPY V-NOTCH IMPACT TEST RESULTS
The results of the Charpy V-notch impact tests performed on the various materials contained in Capsule V, which received a fluence of 2.41 x 10¹⁹ n/cm2 (E> 1.0 MeV) in 11.49 EFPY of operation, are presented in Tables 5-1 through 5-8 and are compared with unirradiated results[ 31 as shown in Figures 51 through 5-12.
The transition temperature increases and upper shelf energy decreases for the Capsule V materials are summarized in Table 5-9 and led to the following results:
Irradiation of the reactor vessel Intermediate Shell Plate B5454-I Charpy specimens, oriented with the longitudinal axis of the specimen parallel to the major working direction (longitudinal orientation) resulted in an irradiated 30 ft-lb transition temperature of 129.9'F and an irradiated 50 ft-lb transition temperature of 162.3°F. This results in a 30 ft-lb transition temperature increase of 123.4°F and a 50 ft-lb transition temperature increase of 129.9*F for the longitudinal oriented specimens.
Irradiation of the reactor vessel Intermediate Shell Plate B5454-1 Charpy specimens, oriented with the longitudinal axis of the specimen perpendicular to the major working direction of the plate (transverse orientation) resulted in an irradiated 30 ft-lb transition temperature of 138.7°F and an irradiated 50 ft-lb transition temperature of 187.1°F. This results in a 30 ft-lb transition temperature increase of 112.9°F and a 50 ft-lb transition temperature increase of 114.3°F for transverse oriented specimens.
Irradiation of the weld metal Charpy specimens resulted in an irradiated 30 ft-lb transition temperature of 212.0°F and an irradiated 50 ft-lb transition temperature of 242.40F. This results in a 30 ft-lb transition temperature increase of 224.50F and a 50 ft-lb transition temperature increase of 227.8'F.
Irradiation of the weld Heat-Affected-Zone (HAZ) metal Charpy specimens resulted in an irradiated 30 ft-lb transition temperature of 64. 1°F and an irradiated 50 ft-lb transition temperature of 161.5 0F. This results in a 30 ft-lb transition temperature increase of 291.5°F and a 50 ft-lb transition temperature increase of 313.8°F.
The average upper shelf energy of the Intermediate Shell Plate B5454-1 (longitudinal orientation) resulted in an average energy decrease of 31.4 ft-lb after irradiation. This results in an irradiated average upper shelf energy of 101.3 ft-lb for the longitudinal oriented specimens.
The average upper shelf energy of the Intermediate Shell Plate B5454-1 (transverse orientation) resulted in an average energy decrease of 5.2 ft-lb after irradiation. This results in an irradiated average upper shelf energy of 86.0 ft-lb for the transverse oriented specimens.
Testing of Specimens from Capsule V
5-4
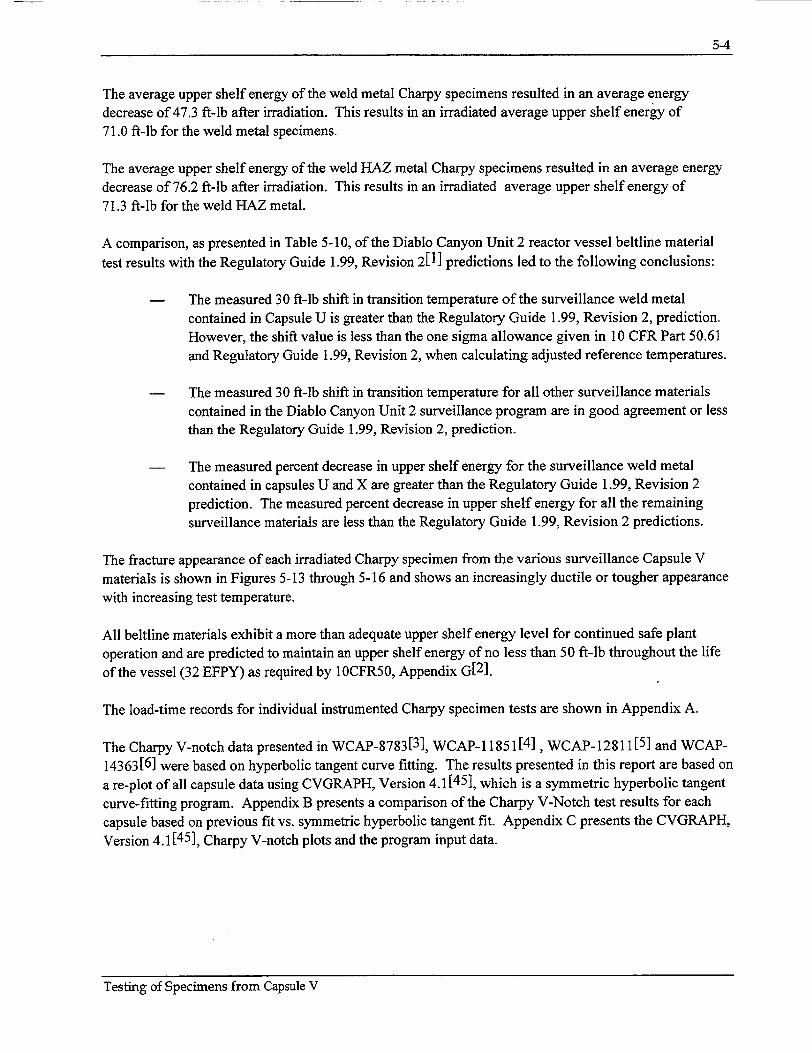
The average upper shelf energy of the weld metal Charpy specimens resulted in an average energy decrease of 47.3 ft-lb after irradiation. This results in an irradiated average upper shelf energy of 71.0 ft-lb for the weld metal specimens.
The average upper shelf energy of the weld HAZ metal Charpy specimens resulted in an average energy decrease of 76.2 ft-lb after irradiation. This results in an irradiated average upper shelf energy of 71.3 ft-lb for the weld HAZ metal.
A comparison, as presented in Table 5-10, of the Diablo Canyon Unit 2 reactor vessel beltline material
test results with the Regulatory Guide 1.99, Revision 2[1] predictions led to the following conclusions:
- The measured 30 ft-lb shift in transition temperature of the surveillance weld metal contained in Capsule U is greater than the Regulatory Guide 1.99, Revision 2, prediction. However, the shift value is less than the one sigma allowance given in 10 CFR Part 50.61 and Regulatory Guide 1.99, Revision 2, when calculating adjusted reference temperatures.
- The measured 30 ft-lb shift in transition temperature for all other surveillance materials contained in the Diablo Canyon Unit 2 surveillance program are in good agreement or less than the Regulatory Guide 1.99, Revision 2, prediction.
- The measured percent decrease in upper shelf energy for the surveillance weld metal contained in capsules U and X are greater than the Regulatory Guide 1.99, Revision 2 prediction. The measured percent decrease in upper shelf energy for all the remaining surveillance materials are less than the Regulatory Guide 1.99, Revision 2 predictions.
The fracture appearance of each irradiated Charpy specimen from the various surveillance Capsule V materials is shown in Figures 5-13 through 5-16 and shows an increasingly ductile or tougher appearance with increasing test temperature.
All beltline materials exhibit a more than adequate upper shelf energy level for continued safe plant operation and are predicted to maintain an upper shelf energy of no less than 50 ft-lb throughout the life of the vessel (32 EFPY) as required by 1OCFR50, Appendix G[2 ].
The load-time records for individual instrumented Charpy specimen tests are shown in Appendix A.
The Charpy V-notch data presented in WCAP-8783 [3], WCAP- 11851 [4], WCAP- 12811 [5] and WCAP
14363[6] were based on hyperbolic tangent curve fitting. The results presented in this report are based on a re-plot of all capsule data using CVGRAPH, Version 4.1 [45], which is a symmetric hyperbolic tangent curve-fitting program. Appendix B presents a comparison of the Charpy V-Notch test results for each capsule based on previous fit vs. symmetric hyperbolic tangent fit. Appendix C presents the CVGRAPH, Version 4.1[45], Charpy V-notch plots and the program input data.
Testing of Specimens from Capsule V

5-5
5.3 TENSILE TEST RESULTS
The results of the tensile tests performed on the various materials contained in Capsule V irradiated to 2.41 x 10¹⁹ n/cm2 (E> 1.0 MeV) are presented in Table 5-11 and are compared with unirradiated results[3] as shown in Figures 5-17 through 5-19.
The results of the tensile tests performed on the Intermediate Shell Plate B5454-1 (longitudinal orientation) indicated that irradiation to 2.41 x 10¹⁹ n/cm 2 (E> 1.0 MeV) caused approximately a 17 to 20 ksi increase in the 0.2 percent offset yield strength and approximately a 12 to 17 ksi increase in the ultimate tensile strength when compared to unirradiated data[3 ] (Figure 5-17).
The results of the tensile tests performed on the Intermediate Shell Plate B5454-1 (transverse orientation) indicated that irradiation to 2.41 x 10¹⁹ n/cm2 (E> 1.0 MeV) caused an approximate increase of 12 to 19 ksi in the 0.2 percent offset yield strength and approximately a 14 to 18 ksi increase in the ultimate tensile strength when compared to unirradiated data 13] (Figure 5-18).
The results of the tensile tests performed on the surveillance weld metal indicated that irradiation to 2.41 x 10¹⁹ n/cm2 (E> 1.0 MeV) caused approximately a 25 to 30 ksi increase in the 0.2 percent offset yield strength and approximately a 20 to 26 ksi increase in the ultimate tensile strength when compared to unirradiated data[3 ] (Figure 5-19).
The fractured tensile specimens for the Intermediate Shell Plate B5454-1 material are shown in Figures 520 and 5-21, while the fractured tensile specimens for the surveillance weld metal are shown in Figure 522. The engineering stress-strain curves for the tensile tests are shown in Figures 5-23 through 5-28.
5.4 1/2T COMPACT TENSION AND BEND BAR SPECIMEN TESTS
Per the surveillance capsule testing contract, the 1/2T Compact Tension and Bend Bar Specimens were not tested and are being stored at the Westinghouse Science and Technology Center Hot Cell facility.
Testing of Specimens from Capsule V

5-6
Table 5-1 Charpy V-notch Data for the Diablo Canyon Unit 2 Intermediate Shell Plate B5454-1
Irradiated to a Fluence of 2.41 x 10'9 n/cm2 (E> 1.0 MeV) (Longitudinal Orientation)
Sample Temperature Impact Energy Lateral Expansion Shear
Number OF °C ft-lbs Joules mils mm %
PL17 0 -18 4 5 0 0.00 2
PL16 50 10 8 11 3 0.08 5
PL20 100 38 13 18 8 0.20 15
PL30 115 46 31 42 22 0.56 20
PL18 125 52 28 38 20 0.51 20
PL25 130 54 27 37 19 0.48 25
PL19 140 60 48 65 27 0.69 35
PL24 150 66 42 57 27 0.69 40
PL29 175 79 43 58 31 0.79 35
PL28 200 93 54 73 39 0.99 50
PL27 215 102 83 113 60 1.52 75
PL22 225 107 104 141 69 1.75 100
PL23 250 121 112 152 75 1.91 100
PL21 300 149 88 119 64 1.63 100
PL26 350 177 101 137 74 1.88 100
Testing of Specimens from Capsule V

5-7
Table 5-2 Charpy V-notch Data for the Diablo Canyon Unit 2 Intermediate Shell Plate B5454-1 Irradiated to a Fluence of 2.41 x 10¹⁹ n/cm2 (E> 1.0 MeV) (Transverse Orientation)
Sample Temperature Impact Energy Lateral Expansion Shear
Number OF 0C ft-lbs Joules mils mm %
PT23 25 -4 8 11 2 0.05 2
PT28 72 22 13 18 8 0.20 10
PT19 100 38 17 23 11 0.28 15
PT21 115 46 28 38 20 0.51 20
PT26 125 52 32 43 18 0.46 35
PT20 150 66 37 50 29 0.74 40
PT16 175 79 36 49 24 0.61 45
PT25 200 93 41 56 31 0.79 50
PT29 205 96 47 64 37 0.94 65
PT22 215 102 68 92 50 1.27 85
PT24 225 107 74 100 52 1.32 95
PT18 275 135 81 110 63 1.60 100
PT27 285 141 83 113 61 1.55 100
PT17 325 163 90 122 65 1.65 100
PT30 350 177 90 122 64 1.63 100
Testing of Specimens from Capsule V

5-8
Table 5-3 Charpy V-notch Data for the Diablo Canyon Unit 2 Surveillance Weld Metal Irradiated to a Fluence of 2.41 x 10¹⁹ n/cm 2 (E> 1.0 MeV)
Sample Temperature Impact Energy Lateral Expansion Shear
Number OF °C ft-lbs Joules mils mm %
PW24 72 22 6 8 0 0.00 5
PW20 125 52 13 18 6 0.15 15
PW29 175 79 16 22 8 0.20 15
PW28 185 85 17 23 16 0.41 30
PW16 200 93 17 23 14 0.36 25
PW25 205 96 19 26 18 0.46 35
PW22 215 102 43 58 30 0.76 60
PW27 225 107 34 46 23 0.58 40
PW17 240 116 43 58 32 0.81 60
PW19 250 121 63 85 43 1.09 95
PW30 255 124 51 69 39 0.99 85
PW21 275 135 72 98 52 1.32 95
PW26 295 146 64 87 50 1.27 100
PW23 325 163 74 100 52 1.32 100
PW18 400 204 68 92 52 1.32 100
Testing of Specimens from Capsule V

5-9
Table 5-4 Charpy V-notch Data for the Diablo Canyon Unit 2 Heat Affected Zone Material Irradiated to a Fluence of 2.41 x 10i9 n/cm2 (E> 1.0 MeV)
Sample Temperature Impact Energy Lateral Expansion Shear
Number OF °C Ft-lbs Joules mils mm %
PH25 -50 -46 7 9 0 0.00 10
PH22 0 -18 17 23 8 0.20 15
PH29 0 -18 14 19 4 0.10 15
PH28 25 -4 26 35 15 0.38 40
PH19 50 10 48 65 29 0.74 60
PH20 72 22 28 38 15 0.38 45
PHI7 90 32 26 35 22 0.56 60
PH116 100 38 34 46 31 0.79 70
PH21 125 52 47 64 33 0.84 55
PH24 150 66 49 66 39 0.99 75
PH27 175 79 52 71 42 1.07 75
PH30 200 93 43 58 30 0.76 65
PH23 250 121 68 92 54 1.37 100
PH26 300 149 76 103 60 1.52 100
PH18 350 177 70 95 61 1.55 100
Testing of Specimens from Capsule V
5-10
Table 5-5 Instrumented Charpy Impact Test Results for the Diablo Canyon Unit 2 Intermediate Shell Plate B5454-1 Irradiated to a Fluence of 2.41 x 10¹⁹ n/cm 2 (E>1.0 MeV) (Longitudinal Orientation)
Normalized Energies
(ft-lb/in2)
Charpy Yield Time to Time to Fast Test Energy Load PGy Yield tG Max. Max. Fract. Arrest Yield Flow
Sample Temp. ED Charpy Max. Prop. (Ib) (msec) Load PM tM Load PF Load PA Stress Sy Stress
No. (OF) (ft-lb) E,/A EM/A Ep/A (Ib) (msec) (Ib) (Ib) (ksi) (ksi)
PL17 0 4 32 15 17 1893 0.12 1897 0.12 1893 0 63 63
PL16 50 8 64 32 32 3264 0.16 3268 0.16 3264 0 109 109
PL20 100 13 105 48 57 3509 0.17 3686 0.20 3686 0 117 120
PL30 115 31 250 176 73 3560 0.17 4166 0.44 4142 0 119 129
PL18 125 28 226 155 71 3558 0.17 4043 0.40 3891 0 118 127
PL25 130 27 218 130 87 3559 0.17 3971 0.36 3953 583 119 125
PL19 140 48 387 222 165 3506 0.17 4293 0.53 4241 461 117 130
PL24 150 42 338 217 121 3444 0.17 4164 0.53 4009 0 115 127
PL29 175 43 346 213 134 3453 0.17 4109 0.52 4023 427 115 126
PL28 200 54 435 285 151 3381 0.17 4075 0.67 4018 1281 113 124
PL27 215 83 669 290 379 3439 0.17 4226 0.66 3972 2683 115 128
PL22 225 104 838 290 548 3400 0.17 4225 0.66 N/A N/A 113 127
PL23 250 112 902 285 617 3392 0.17 4179 0.65 N/A N/A 113 126
PL21 300 88 709 197 512 3235 0.17 3746 0.52 N/A N/A 108 116
PL26 350 101 814 277 537 3181 0.17 3958 0.67 N/A N/A 106 119
Testing of Specimens from Capsule V

5-11
Table 5-6 Instrumented Charpy Impact Test Results for the Diablo Canyon Unit 2 Intermediate Shell Plate B5454-1 Irradiated to a Fluence of 2.41 x 10¹⁹ n/cm 2 (E>1.0 MeV) (Transverse Orientation)
Normalized Energies
(ft-lb/in2)
Charpy Yield Time to Time to Fast
Test Energy Load PGY Yield tGy Max. Max. Fract. Arrest Yield Flow
Sample Temp. E, Charpy Max. Prop. (Ib) (msec) Load PM tM Load P, Load P, Stress S, Stress
No. (OF) (ft-lb) ED/A EM/A Ep/A (Ib) (msec) (Ib) (Ib) (ksi) (ksi)
PT23 25 8 64 32 32 3319 0.16 3325 0.16 3319 0 111 111
PT28 72 13 105 48 56 3745 0.17 3875 0.19 3867 0 125 127
PT19 100 17 137 54 83 3529 0.17 3774 0.21 3774 400 118 122
PT21 115 28 226 165 61 3477 0.17 4046 0.43 3945 0 116 125
PT26 125 32 258 158 100 3441 0.17 3970 0.42 3880 459 115 123
PT20 150 37 298 182 116 3478 0.17 4068 0.46 4026 776 116 126
PT16 175 36 290 147 143 3379 0.17 3902 0.40 3864 1261 113 121
PT25 200 41 330 172 158 3327 0.17 3965 0.45 3945 1751 111 121
PT29 205 47 379 207 172 3342 0.17 3993 0.52 3834 1138 111 122
PT22 215 68 548 211 337 3409 0.17 4182 0.52 3580 2459 114 126
PT24 225 74 596 189 407 3443 0.17 4023 0.48 3145 2398 115 124
PT18 275 81 653 199 454 3209 0.17 3885 0.52 N/A N/A 107 118
PT27 285 83 669 205 464 3310 0.17 4059 0.51 N/A N/A 110 123
PT17 325 90 725 276 449 3167 0.17 3942 0.68 N/A N/A 105 118
PT27 350 90 725 200 526 3216 0.17 3924 0.52 N/A N/A 107 119
Testing of Specimens from Capsule V

5-12
Table 5-7 Instrumented Charpy Impact Test Results for the Diablo Canyon Unit 2 Surveillance Weld Metal
Irradiated to a Fluence of 2.41 x 10'9 n/cm 2 (E>1.0 MeV)
Normalized Energies
(ft-lb/in2)
Charpy Yield Time to Time to Fast
Test Energy Load P(; Yield tcy Max. Max. Fract. Arrest Yield Flow
Sample Temp. E, Charpy Max. Prop. (Ib) (msec) Load PM tM Load PF Load PA Stress S. Stress
No. (OF) ED/A EM/A Ep/A (Ib) (msec) (Ib) (Ib) (ksi) (ksi)
PW24 72 6 48 22 27 2558 0.13 2560 0.14 2558 0 85 85
PW20 125 13 105 51 53 3698 0.17 3955 0.20 3937 0 123 127
PW29 175 16 129 62 67 3630 0.17 3964 0.22 3950 0 121 126
PW28 185 17 137 46 91 3618 0.17 3713 0.19 3709 1079 120 122
PW16 200 17 137 61 76 3555 0.17 3880 0.22 3838 419 118 124
PW25 205 19 153 55 98 3555 0.17 3823 0.21 3789 1237 118 123
PW22 215 43 346 192 154 3574 0.17 4238 0.47 4178 1989 119 130
PW27 225 34 274 135 139 3607 0.17 4051 0.36 4049 1524 120 128
PW17 240 43 346 159 187 3590 0.17 4143 0.41 4021 2327 120 129
PW19 250 63 508 197 311 3533 0.17 4016 0.49 3764 2978 118 126
PW30 255 51 411 181 230 3508 0.17 4187 0.45 4029 2860 117 128
PW21 275 72 580 204 376 3526 0.17 4139 0.49 3855 3361 117 128
PW26 295 64 516 201 315 3606 0.17 4239 0.48 3875 3159 120 131
PW23 325 74 596 207 390 3449 0.17 4110 0.51 N/A N/A 115 126
PW18 400 68 548 194 354 3298 0.17 3946 0.50 N/A N/A 110 121
Testing of Specimens from Capsule V

5-13
Table 5-8 Instrumented Charpy Impact Test Results for the Diablo Canyon Unit 2 Heat-Affected-Zone (HAZ) Metal Irradiated to a Fluence of 2.41 x 10'9 n/cm2 (E>1.0 MeV)
Normalized Energies
(ft-lb/in2)
Charpy Yield Time to Time to Fast
Test Energy Load PGV Yield trv Max. Max. Fract. Arrest Yield Flow
Sample Temp. ED Charpy Max. Prop. (Ib) (msec) Load PM tM Load PF Load Stress S. Stress
No. (OF) (ft-lb) E0/A EM/A Ep/A (Ib) (msec) (Ib) PA (Ib) (ksi) (ksi)
PH25 -50 7 56 24 32 2863 0.15 2879 0.14 2863 0 95 96
PH22 0 17 137 66 71 4079 0.17 4433 0.22 4151 0 136 142
PH29 0 14 113 50 63 4042 0.17 4199 0.19 4187 0 135 137
PH28 25 26 209 66 144 3865 0.17 4239 0.22 4110 474 129 135
PHI9 50 48 387 233 154 3827 0.17 4488 0.52 4389 1308 127 138
PH20 72 28 226 63 163 3946 0.17 4299 0.21 4152 1796 131 137
PH17 90 26 209 62 148 3761 0.17 4089 0.22 3937 1540 125 131
PH16 100 34 274 61 213 3698 0.17 3998 0.22 3894 1979 123 128
PH21 125 47 379 222 157 3675 0.17 4365 0.52 4216 2046 122 134
PH24 150 49 395 168 227 3660 0.17 4053 0.43 4023 2569 122 128
PH27 175 52 419 190 229 3517 0.17 4126 0.47 4108 2761 117 127
PH30 200 43 346 175 171 3538 0.17 4079 0.44 3959 2147 118 127
PH23 250 68 548 191 357 3425 0.17 4061 0.48 N/A N/A 114 125
PH26 300 76 612 206 407 3246 0.17 4047 0.52 N/A N/A 108 121
PH18 350 70 564 192 372 3320 0.17 3913 0.49 N/A N/A 111 120
Testing of Specimens from Capsule V

5-14
"Average" is defined as the value read from the curve fit through the data points of the Charpy tests (see Figures 5-1, 5-4, 5-7 and 5-10).
"Average" is defined as the value read from the curve fit through the data points of the Charpy tests (see Figures 5-2, 5-5, 5-8 and 5-11)
Any difference in unirradiated properties reported in this Table in comparison to WCAP-8783, 11851, 12811 and 14363, are due to now using a symmetric hyperbolic tangent curve fitting of the Charpy data versus the method used in the previous analyses. See Appendix B.
Testing of Specimens from Capsule V
Table 5-9 Effect of Irradiation to 2.41 x 10¹⁹ n/cm 2 (E>1.0 MeV) on the Capsule V Notch Toughness Properties of the Diablo Canyon Unit 2 Reactor Vessel Surveillance Materials(c)
Average 30 (ft-lb)(a) Average 35 mil LateralMb) Average 50 ft-lb(a) Average Energy Absorptiont a)
Material Transition Temperature (0F) Expansion Temperature (0F) Transition Temperature (*F) at Full Shear (ft-lb)
Unirradiated Irradiated AT Unirradiated Irradiated AT Unirradiated Irradiated AT Unirradiated Irradiated AT
Intermediate Shell 6.5 129.9 123.4 18.1 166.4 148.3 32.4 162.3 129.9 132.7 101.3 -31.4
Plate B5454-1
(Longitudinal)
Intermediate Shell 25.8 138.7 112.9 54.4 186.3 131.9 72.8 187.1 114.3 91.2 86.0 -5.2
Plate B5454-1
(Transverse)
Weld Metal -12.5 212.0 224.5 -0.7 239.2 239.9 14.6 242.4 227.8 118.3 71.0 -47.3
HAZ Metal -227.4 64.1 291.5 -190.1 148.9 339.0 -152.3 161.5 313.8 147.5 71.3 -76.2
a.
b.
C.

5-15
Notes: (a) Based on Regulatory Guide 1.99, Revision 2, methodology using the mean weight percent values of copper
and nickel of the surveillance material.
(b) Calculated using measured Charpy data plotted using CVGRAPH, Version 4.1 (See Appendix C)
(c) Values are based on the definition of upper shelf energy given in ASTM El 85-82.
(d) The fluence values presented here are the calculated fluence values not the best estimate. For best estimate values see Section 6 of this report.
Testing of Specimens from Capsule V
Table 5-10 Comparison of the Diablo Canyon Unit 2 Surveillance Material 30 ft-lb Transition Temperature Shifts and Upper Shelf Energy Decreases with Regulatory Guide 1.99, Revision 2, Predictions
30 ft-lb Transition Upper Shelf Energy Temperature Shift Decrease
Material Capsule Fluence(d) Predicted Measured Predicted Measured (x 1019 n/cm2) (0F) (a) (OF) (b) (OF) (a) (%)(C)
Inter. Shell Plate U 0.338 71.0 65.4 18 11
B5454-1 X 0.919 98.9 100.1 22 20
(Lniuia)y 1.55 113.6 111.6 25 18
V 2.41 125.3 123.4 28 24
Inter. Shell Plate U 0.338 71.0 73.3 18 0
B5454-1 X 0.919 98.9 99.5 22 12
(Transverse) Y 1.55 113.6 111.6 25 7
V 2.41 125.3 112.9 28 6
Weld Metal U 0.338 148.1 173.0 28 31
X 0.919 206.1 203.2 35 38
Y 1.55 236.8 211.4 40 40
V 2.41 261.3 224.5 44 40
HAZ Metal U 0.338 -- 234.4 -- 41
X 0.919 -- 253.5 -- 31
y 1.55 -- 257.7 -- 40
V 2.41 -- 291.5 -- 52

5-16
Testing of Specimens from Capsule V
Table 5-11 Tensile Properties of the Diablo Canyon Unit 2 Capsule V Reactor Vessel Surveillance Materials Irradiated to 2.41 x 10'9 n/cm2 (E > 1.0
MeV)
Material Sample Test 0.2% Ultimate Fracture Fracture Fracture Uniform Total Reduction
Number Temp. Yield Strength Load Stress Strength Elongation Elongation in Area
(OF) Strength (ksi) (kip) (ksi) (ksi) (%) (%) (%)
(ksi) I
Intermediate Shell PL4 140 79.5 98.4 3.35 182.0 68.2 11.6 23.6 62
Plate B5454-1 PL5 200 77.4 95.9 3.30 175.3 67.2 11.2 23.0 62
(Longitudinal) PL6 550 71.3 94.2 3.46 161.8 70.5 10.4 21.0 56
PT4 140 80.5 99.2 3.79 177.3 77.2 11.4 21.6 56 Intermediate Shell PT5 200 77.4 96.0 3.73 174.3 75.9 10.3 19.9 56 Plate B5445-1 PT6 550 72.3 94.3 3.67 175.0 74.7 10.4 19.5 57 (Transverse)
PW4 205 90.7 102.8 3.35 174.2 68.2 11.3 23.4 61 Weld Metal PW5 255 88.6 100.8 3.44 186.9 70.1 11.5 21.9 62
PW6 550 82.5 98.3 3.61 168.7 73.5 9.5 19.5 56

5-17
INTERMEDIATE SHELL PLATE B5454-1 (LONG.)
CVGRAPH 41 Hyperbolic Tangent Curve Printed at 10-27:27 on 04-11-2000
Results
Curve Fluence 1SE d-ISE USE d-USE T o 30 d-T * 30 T o 50 d-T o 50 1 0 219 0 13269 0 65 0 338 0 2 0 2.19 0 1183 -1439 7L89 6539 116.6 83.77 3 0 219 0 10U -2 106.56 100.06 150.79 11&41 4 0 219 0 1085 -2419 11.08 11158 1511 11&71 5 0 219 0 10125 -31.44 129.93 123.43 16-34 129.96
-300 -200 -100 0 100 200 300 400 500 600
Temperature in Degrees F
Curve Legend
10 2 ........ 3 0 4 5--
Data Set(s) Plotted
Curve Plant Capsule 1 DC2 UNIRR2 3 4 5
DC2 DC2 DC2 DC2
U x Y V
Material PLATE SA533BI PLATE SA533BI PLATE SA3BI PLATE SAS33BI PLATE SAM33BI
Ori. Heat1 LT C5161-1 LT C5161-1 LT C5161-1 LT C5161-1 LT 0561-1
Figure 5-1 Charpy V-Notch Impact Energy vs. Temperature for Diablo Canyon Unit 2 Reactor
Vessel Intermediate Shell Plate B5454-1 (Longitudinal Orientation)
Testing of Specimens from Capsule V
�I2
Q

5-18
INTERMEDIATE SHELL PLATE B5454-1 (LONG.)
CYGRAPH 4.1 Hlyperbolic Tangent Curve Printed at 145123 on 04-11-2000
Results
Curve Fluence USE d-USE T * LE35 d-T o LE35
1 0 89 0 1811 0
2 0 87B5 -1M4 9329 7518
3 0 8884 -16 134.97 11686
4 0 88.77 -22 14413 126.01
5 0 75.04 -13.9 16625 14824
-300 -200 -100 0 100 200 300 400 500 600
Temperature in Degrees F
10o-- 20----...
Curve legend
30 - 4 -
Data Set(s) Plotted
Curve Plant Capsule Material O(i. Heat#
1 DC2 UNIRR PLATE SA533BI LT (5161-1
2 DC2 U PLATE SA533BI LT C5161-1
3 D(2 X PLATE SA5D3BI LT (5161-1
4 D12 Y PLATE S=13BI LT C5161-1
5 11(2 V PLATE SA533BI LT C5161-1
Charpy V-Notch Lateral Expansion vs. Temperature for Diablo Canyon Unit 2
Reactor Vessel Intermediate Shell Plate B5454-1 (Longitudinal Orientation)
Testing of Specimens from Capsule V
Cz2
Sý
Figure 5-2

5-19
INTERMEDJIATE SHELL PLATE B5454-1 (LONG.)
CVGRAPH 4.1 Hyperbolic Tangent Curve Printed at 1100:04 on 04-11-2000
Results
Curve 1 2 :1 4 5
Fluence 0 0 0 0 0
T o / Shear 46.87 142.66 145.31 18843 173.43
d-T o 50/. Shear 0
95.78 98.44 14156 2.56
-300 -200 -100 0 100 200 300 400 500 6W0
Temperature in Degrees F
Curve Legend
Io-
Data Set(s) Plotted
Plant Capsule Material D(2 UNIRR PLATE SAW3B 1X2 U PLATE SA533BI DC2 X PLATE SA533B1 DC2 Y PLATE SA533BI D(2 V PLATE SAWBI
Orin LT LT LT LT LT
Heat# C5161-1 C5161-1 C5161-1 C5161-1 C5161-1
Figure 5-3 Charpy V-Notch Percent Shear vs. Temperature for Diablo Canyon Unit 2 Reactor
Vessel Intermediate Shell Plate B5454-1 (Longitudinal Orientation)
Testing of Specimens from Capsule V
4)
Curve 1 2 3 4 5
5-19

5-20
INTERMEDIATE SHELL PLATE B5454-1 (TRANS.)
CVCGAPH 41 Hyperbolic Tangent Curve Printed at 1115:47 on 04-11-200
Results
Curve Fluence LSE d-LSE USE d-USE T o 30 d-T o 30 T o 50 d-T o 50
1 0 2.19 0 919 0 25.2 0 72.81 0
2 0 2.19 0 935 V 9913 732 146.86 73.5
3 0 2.19 0 80 -1119 12525 99.52 170.61 97.79
4 0 2.19 0 85 -. 19 137.42 11159 18424 111.52
5 0 219 0 86 -519 138.73 ll2M 187.07 11426
7150
So0
z
-30O -200 -100 0 100 200 300 400
Temperature in Degrees F500 600
Curve L
10- 20-- 3 -- 4- 5V
Data Set(s) Plotted
Curve Plant Capsule Material 01. Heat#
I 9(2 UNIRR PLATE SA BI TL C5161-1
2 DC2 U PLATE SA533BI TL C5161-1
3 I(2 X PLATE SAS,3BI TL C5161-1
4 D(2 Y PLATE SAS3BI TL (5161-1
5 9(2 V PLATE SA533BI TL C5161-1
Figure 5-4 Charpy V-Notch Impact Energy vs. Temperature for Diablo Canyon Unit 2 Reactor
Vessel Intermediate Shell Plate B5454-1 (Transverse Orientation)
Testing of Specimens from Capsule V

5-21
INTERMEDIATE SHELL PLATE B5454-1 (TRANS.)
CVGRAPIH 41 Hyperbolic Tangent Curve Printed at 145959 on 04-11-2000
Results
Curve Fluence USE d-USE T o LE35 d-T * LE35
1 0 771 0 54.42 0
2 0 78.06 .95 11557 6115
3 0 7277 -4.32 14921 94.78
4 0 7216 -4.94 1616 107.74
5 0 70.01 -7.09 1631 131.9
-300 -200 -100 0 100 200 300 400 5W 600
Temperature in Degrees F
Curve Legend
30--- 4- 5V -
Data Set(s) Plotted
Curve Plant Capsule Material Ori Heatq
I DC2 UNIMR PLATE SA5S3B1 TL C5161-l
2 D(2 U PLATE SA533B1 TL C5161-l
3 DC2 X PLATE SA533BI TL C5161-I
4 1X2 Y PLATE SA533B1 L C5161-1
5 DC2 V PLATE SASWBI TL C5161-1
Figure 5-5 Charpy V-Notch Lateral Expansion vs. Temperature for Diablo Canyon Unit 2
Reactor Vessel Intermediate Shell Plate B5454-1 (Transverse Orientation)
Testing of Specimens from Capsule V
U2 1J--
to 2(>-------
5-72
INTERMEDIATE SHELL PLATE B5454-1 (TRANS.)
CVGRP2H 41 Hyperbolic Tangent Curve Printed at 11:34.% on 04-11-2900
meults
Curve 1 2 3 4 5
Fluence 0 0 0 0 0
T * W1x Shear 6L4
170.5 19921 169.62
d-T o 5W/. Shear 0
100.78 1091
137.81 108&2
-300 -200 -100 0 100 200 300 400 500 600
Temperature in Degrees F
Curve legend
i0 20"----- -.... 35 .. 4"
Data Setqs) Plotted
Capsule UNIRR
U x Y V
Material PLATE SA533BI PLATE SA533BI PLATE SA533B1 PLATE SA533BI PLATE SA533BI
Orn TL TL TL TL TL
Heat# C5161-1 C5161-1 (5161-1 05161-I C5161-1
Charpy V-Notch Percent Shear vs. Temperature for Diablo Canyon Unit 2 Reactor
Vessel Intermediate Shell Plate B5454-1 (Transverse Orientation)
Testing of Specimens from Capsule V
C~)
Curve 1 2 3 4 5
Plant
DC2 D(2 DC2
Figure 5-6
5-22

5-23
SURVEILLANCE PROGRAM WELD METAL
CVGRAPH 41 Hyperbolic Tangent Curve Printed at 14181 on 04-11-2000
Remuts
Curve Fluence LSE d-ISE USE d-USE T o 30 d-T o 30 T o 50 d-T 50
1 0 2.19 0 li3 0 -12.5 0 14.6 0
2 0 219 0 82 -363 160.48 172.99 214.04 199.43
3 0 2.19 0 73.19 -45J 190.72 20323 22861 214
4 0 2.19 0 71 -473 198.8 211.39 256.76 242.15
5 0 2.19 0 71 -47.3 21197 224.47 242.35 227.74
-300 -200 -100 0 100 200 300 400 500 600
Temperature in Degrees F
Ceve tegend
1O"- 20----- 30 4 - 5v
Curve Plant Capsule I IC2 UNIRR 2 DI2 U 3 I}2 X 4 IC2 Y 5 DC2 V
Data Set(s) Plotted Material
WELD WED SA533BI WELD SA533BI
WELD WELD
Figure 5-7 Charpy V-Notch Impact Energy vs. Temperature for Diablo Canyon Unit 2 Reactor
Vessel Weld Metal
Testing of Specimens from Capsule V
L)
T 4-,
0
Ori Heat#120/21935 1200/2193
M/200/135 2008/21M
10/21935
Material

5-24
SURVEILLANCE PROGRAM WELD METAL
CVGRAPH 4.1 Hyperbolic Tangent Curve Printed at 15%.46 on 04-11-2000
1mllts
Curve 1
2 3 4 5
Fluence 0 0 0 0 0
USE 9.11
757
636 5=8
d-USE 0
-1522
-1&54 -275
-3729
T o LE35 -.7
170.47 212.02 23&816 23919
d-T o LE35 0
1718 212.72
239H
-300 -200 -100 0 100 200 300 400 500 600
Temperature in Degrees F
Carve ILgend __ -- 4- . 5v
Data Set(s) Plotted
Material WELD
WEDSA533B1 WELD SA533BI
WELD WELD
OrL Heat# M30/21935 M20/21935 M208/210
0/21935 M20/21935
Figure 5-8 Charpy V-Notch Lateral Expansion vs. Temperature for Diablo Canyon Unit 2
Reactor Vessel Weld Metal
Testing of Specimens from Capsule V
0-4
103-
Curve i
2 3 4 5
Plant DC2 D(2 DC2 DC2
Capsule UNIRR
U X Y V
5-24

5-25
SURVEILLANCE PROGRAM WELt) METAL
CVGRAPH 41 Hyperbolic Tangent Curve Printed at 12E46 on 04-11-2000
Results
T o W/. Shear 23.43 17519 19.77
217.96
d-T * 5Wx Shear
151.75 169.33 20624 194.53
-300 -200 -100 0 100 200 300 400 5W0 6•0
Temperature in Degrees F
Curve legend
10-
Data Set(s) Plotted
Curve Plant Capsule I I)2 UNIRR2 3 4 5
DC2 I)(2
U x Y V
Material WELD
WELD SA5W3B1 WELD SASBI
WELD WELD
Oni Heat# 12008/21935 12M /21935
M20/21935 M20/2103 M20/21935
Figure 5-9 Charpy V-Notch Percent Shear vs Temperature for Diablo Canyon Unit 2 Reactor
Vessel Weld Metal
Testing of Specimens from Capsule V
Curve 1 2 3 4 5
Fluence 0 0 0 0 0
a)
r']
V
P)
5-25
2( 0 .........- 30 . . ... 4 - 5 , . ...

5-26
HEAT AFFECTED ZONE
CVGRPH 4.1 Hyperbolic Tangent Curve Printed at 12.42 on 04-11-2000
Results
Curve Fluence ISE d-LSE USE d-USE T o 30 d-T * 30 T * 50 d-T *5
1 0 219 0 1475 0 -27.43 0 -15227 0
2 0 219 0 863 -6119 699 234.43 10217 254.45
3 0 219 0 10119 -46.3 2&09 253.2 9619 24&47
4 0 2.19 0 8819 -59.3 30,3 257.74 102.43 254.71
5 0 2.19 0 713 -7619 64.07 29L5 161.48 313.76
Ot2
U.)
z.
-300 -200 -100 0 100 200 300 400 500 600
Temperature in Degrees F Curve legend
I o- 20 2 3 . . 4 ^- 5v
Data Set(s) Plotted
Curve Plant Capsule Material Ori. Heat#
I X2 UNIRR HEAT AFIFD ZONE SA533BI C5161-1
2 DC2 U HEAT ANFD ZONE SA533BI C5161-1
3 IC2 X HEAT AFD ZONE SA533B1 C516t-1
4 DC2 Y HEAT AFFD ZONE (5161-1
5 1X2 Y HEAT AFFD ZONE (5161-1
Figure 5-10 Charpy V-Notch Impact Energy vs. Temperature for Diablo Canyon Unit 2 Reactor
Vessel Heat-Affected-Zone Material
Testing of Specimens from Capsule V

HEAT AFFECTED ZONE
CVGPAPH 41 Hyperbolic Tangent Curve Printed at 15:471A1 on 04-11-2000
Results
Curve Fluence USE d-USE T o LES5 d-T * LE5 1 0 112.73 0 -190.2 0 2 0 75B9 -38.84 59.02 24914 3 0 8865 -24.08 69.99 26011 4 0 6832 -44.41 8216 Zw.29 5 0 64.8 -47.93 148.9 339.02
- - - - - -- '-
02a:
15Wý
-300 -200 -100 0 100 200 300 400 500 600
Temperature in Degrees F
Curve legend
10- 20------- 3e---.. 4- - 5 . .
Data Set(s) Plotted 11~triMI
1 2 3 4 5
DC(2 DC2 DC2
DC2
UNIRR U X Y V
HEAT AFFD ZONE SA533BI HEAT AFFD ZONE SA533BI HEAT AFFD ZONE SA533BI
HEAT AFFD ZONE HEAT AFFI) ZONE
Orn HeatsC5161-1 C5161-1 C5161-1 05161-1 C5161-1
Charpy V-Notch Lateral Expansion vs. Temperature for Diablo Canyon Unit 2
Reactor Vessel Heat-Affected-Zone Material
Testing of Specimens from Capsule V
5-27
U) P-=,,
Q)
Figure 5-11
r",-. Plant ramile Material OrL HeadP,,•€* P]•nf f'..•'p•n lip

5-28
HEAT AFFECTED ZONE
CVGRAPH 41 Hyperbolic Tangent Curve Printed at 1MiO on 04-11-2000
Results
Fluence 0 0 0 0 0
T * 5a/ Shear -80.46
3767 89.64 89.53 76.4
d-T * 50"/. Shear 0
11813 1701
169.99 156B6
-300 -200 -100 0 100 200 300 400 5W0 600
Temperature in Degrees F
Curve leend
to-
Capsule UNIRR
U x Y V
Data Set(s) Plotted
Material HEAT AFFD ZONE SA533BI HEAT AFFD ZONE SA=B8 HEAT AFFD ZONE SAM33BI
HEAT AFFD ZONE HEAT AFFD ZONE
Or. Heat# C5161-1
C5161-1 C5161-1 C5161-1 C5161-1
Figure 5-12 Charpy V-Notch Percent Shear vs. Temperature for Diablo Canyon Unit 2 Reactor Vessel Heat-Affected-Zone Material
Testing of Specimens from Capsule V
Curve 1
2 3 4 5
a) Cr1
a) a) a.)
Curve 1
2 3 4 5
Plant
DC2 DC2
DC2 DC2
5-28

5-29
PL17, 0F
PL25, 130°F
PL27, 215°F
PL16,50°F
PL19, 140°F
PL22, 225°F
PL20, 100-F
PL24, 150°F
PL23, 2500 F
PL30, 115 0 F
PL29, 175°F
PL21, 300-F
PL18, 125°F
PL28, 200°F
PL26, 350°F
Figure 5-13 Charpy Impact Specimen Fracture Surfaces for Diablo Canyon Unit 2 Reactor Vessel Intermediate Shell Plate B5454-1 (Longitudinal Orientation)
Testing of Specimens from Capsule V

5-30
PT23, 25°F
PT20, 150°F
PT28, 72°F
PT16, 1750F
PT19, 100°F
PT25, 200°F
PT21, 115°F
PT29, 205°F
PT26, 125°F
PT22, 215°F
PT24, 225°F PT18, 275°F PT27, 285°F PT17, 325°F PT30, 350°F
Figure 5-14 Charpy Impact Specimen Fracture Surfaces for Diablo Canyon Unit 2 Reactor Vessel Intermediate Shell Plate B5454-1 (Transverse Orientation)
Testing of Specimens from Capsule V

5-31
PW24, 72°F
PW25, 205°F
PW30,255°F
PW20, 125°F
PW22, 215°F
PW21,275°F
PW29,175°F
PW27, 225°F
PW26,295°F
PW28,185°F
PW17,240°F
PW23,325°F
PW16, 200°F
PW19, 250°F
PW18,400°F
Figure 5-15 Charpy Impact Specimen Fracture Surfaces for Diablo Canyon Unit 2 Reactor Vessel Weld Metal
Testing of Specimens from Capsule V

5-32
PH25, -50°F PH22, 0F PH29, 0F PH28, 25°F PH19,50°F
PH20, 72°F
PH27,175°F
PH17,90°F
PH30, 200°F
PH16, 100°F
PH23, 250°F
PH21,125°F
PH26, 300°F
PH24, 150°F
PH18,350°F
Figure 5-16 Charpy Impact Specimen Fracture Surfaces for Diablo Canyon Unit 2 Reactor Vessel Heat-Affected-Zone Metal
Testing of Specimens from Capsule V

(0) 0 50 100 150 200 250
LEGEND: o UNIRRADIATED * IRRADIATED TO A FLUENCE OF 2.41 X 10¹⁹ n/cm2 (E>1.0MeV),
0 100 200 300 400
TEMPERATURE (OF)
Figure 5-17 Tensile Properties for Diablo Canyon Unit 2 Reactor Vessel Intermediate Shell Plate
B5454-1 (Longitudinal Orientation)
Testing of Specimens from Capsule V
120
110
5-33
300
800
700
.Q. Mx
&C4
ICJ w-
I I I I I I I
ULTIMATE TENSILE STRENGTH 0
0.2% YIELD STRENGTH
---- 8
100
90
80
70
60
50
40
600a 0� z
500
1400
300
I'-4 -J '-4
C.)
80
70
60
50
40
30
20
8REDUCTION IN AREA
_ • TOTAL ELONGATION
-UR - EN-TO
UNIFORM ELONGATION I I I I I
500 600

5-34
(0C) 0 50 100 150 200 250 300
I
o ULTIMATE TENSILE STRENGTH
Nq VIFI l RT =fN(ZT1f4
120
110
100
90
80
70
60
50
40
I 800
700
600
500
400
300
azC
LEGEND: o UNIRRADIATED * IRRADIATED TO A FLUENCE OF 2.41 X 10¹⁹ nf/cm2 (E>1.0MeV)
0 100 200 300 400 500 600
TE•MTTRE (°F)
Tensile Properties for Diablo Canyon Unit 2 Reactor Vessel Intermediate Shell Plate
B5454-1 (Transverse Orientation)
Testing of Specimens from Capsule V
0 0
I= 1A,
80
70
60
50
40
30
P '-
F--
REDUCTION IN AREA
0. .
0
A_ TOTAL ELONGATION
UNIFORM ELONGATION S , II I
20
10
0
Figure 5-18
I I I- 5-34i I
7 -

0 50
(C) 100 150
iI I 0202 YIELD STRENGTH
0
0 0A0 , --
200 250 300
LEGEND: 0 UNIRRADIATED 0 IRRADIATED TO A FLUENCE OF 2.41 X 10 n/cM2 (E>I.OMeV)
100 200 300 400
"IT EMPERATU• (OF)
Figure 5-19 Tensile Properties for Diablo Canyon Unit 2 Reactor Vessel Weld Metal
Testing of Specimens from Capsule V
5-35
I I I I ULTIMATE TENSILE STRENGTH
120
100
90
80
70
60
50
40
w 0:
i
C#
800
700
co
500
400
300
.i,,-,J
I,--
80
70
60
50
40
30
20
10
0
REDUCTION IN AREA
TOTAL ELONGATION
UNIFORM ELONGATION I I I I i0 500 600
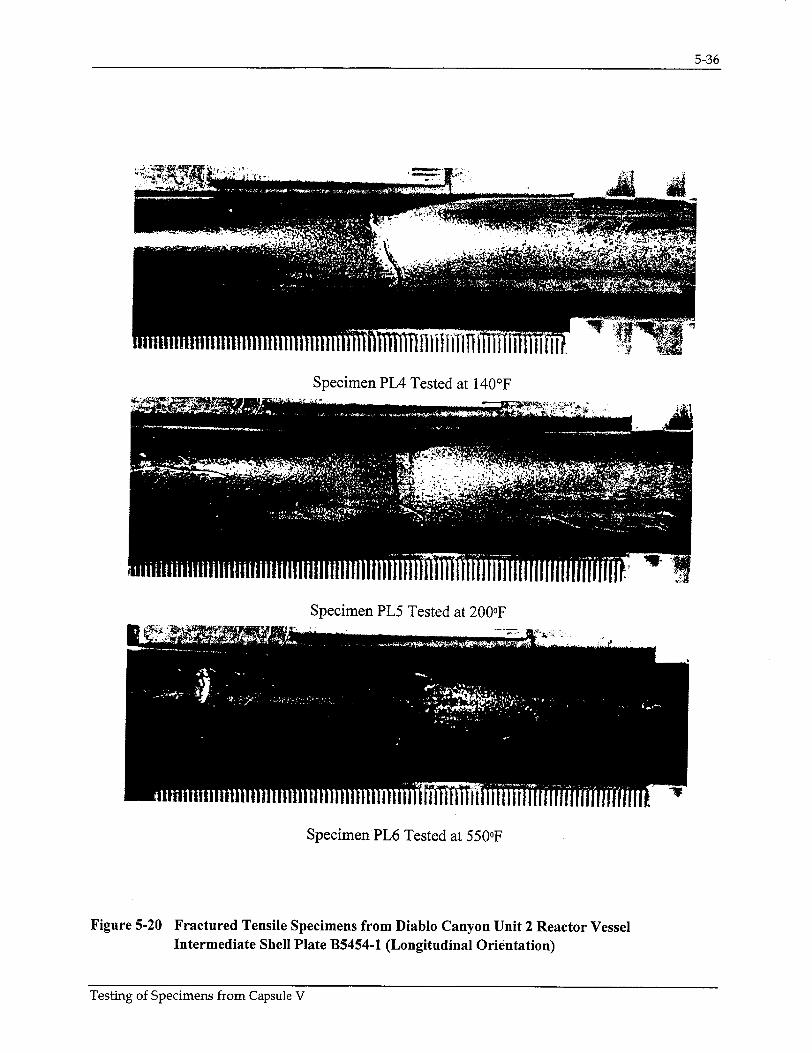
5-36
Specimen PL4 Tested at 140'F
Specimen PL5 Tested at 200OF
Specimen PL6 Tested at 550oF
Figure 5-20 Fractured Tensile Specimens from Diablo Canyon Unit 2 Reactor Vessel Intermediate Shell Plate B5454-1 (Longitudinal Orientation)
Testing of Specimens from Capsule V

5-37
Specimen PT4 Tested at 140oF
Specimen PT5 Tested at 250oF
Specimen PT6 Tested at 550OF
Figure 5-21 Fractured Tensile Specimens from Diablo Canyon Unit 2 Reactor Vessel Intermediate Shell Plate B5454-1 (Transverse Orientation)
Testing of Specimens from Capsule V

5-38
Specimen PW4 Tested at 205oF
Specimen PW5 Tested at 255oF
Specimen PW6 Tested at 550oF
Figure 5-22 Fractured Tensile Specimens from Diablo Canyon Unit 2 Reactor Vessel Weld Metal
Testing of Specimens from Capsule V

5-39
STRESS-STRAIN CURVE DIABLO CANYON UNIT 2 "V" CAPSULE
PL4 140 F
0.05 0.1 0.15 0.2 0.25
STRAIN, ININ
0.3
STRESS-STRAIN CURVE DIABLO CANYON UNIT 2 "V* CAPSULE
PL 5 200 F
0.05 0.1 0.15 0.2 0.25
STRAIN, IN/IN
Figure 5-23 Engineering Stress-Strain Curves for Intermediate Shell Plate B5454-1 Tensile
Specimens PL4 and PL5 (Longitudinal Orientation)
Testing of Specimens from Capsule V
100
90
80
70
60
50
40
30
20
10
0
c6 U,
I0:
0
100
90
80
70
60
50
40
30
20
10
0
Ur iii
U,
0 0.3

5-40
STRESS-STRAIN CURVE DIABLO CANYON UNIT 2 "V" CAPSULE
PL6 550 F
0.1 0.15 STRAIN, INIIN
0.2 0.25 0.3
Engineering Stress-Strain Curve for Intermediate Shell Plate B5454-1 Tensile Specimen PL6 (Longitudinal Orientation)
Testing of Specimens from Capsule V
100
90
80
70
60
50
40
30
20
10
0
C6 w,
0 0.05
Figure 5-24

5-41
STRESS-STRAIN CURVE DIABLO CANYON UNIT 2 "V" CAPSULE
PT 4 140F
0.05 0.1 0.15 0.2 0.25
STRAIN, IN/IN
0.3
STRESS-STRAIN CURVE DIABLO CANYON UNIT 2 "V" CAPSULE
PT 5 250 F
0.05 0.1 0.15 0.2 0.25
STRAIN, IN/IN
Figure 5-25 Engineering Stress-Strain Curves for Intermediate Shell Plate B5454-1 Tensile Specimens PT4 and PT5 (Transverse Orientation)
Testing of Specimens from Capsule V
LU
c-
100
90
80
70
60
50
40
30
20
10
00
100
90
80
70
60
50
40
30
20
10
0
kto
Ir
(0
0 0.3

5-42
STRESS-STRAIN CURVE DIABLO CANYON UNIT 2 "V" CAPSULE
PT 6 550 F
0.05 0.1 0.15 0.2 0.25
STRAIN, IN/IN0.3
Engineering Stress-Strain Curve for Intermediate Shell Plate B5454-1 Tensile Specimen PT6 (Transverse Orientation)
Testing of Specimens from Capsule V
100
90
80
70
60
50
40
30
20
10
0
4,1
0
Figure 5-26

5-43
STRESS-STRAIN CURVE DIABLO CANYON UNIT 2 '"V CAPSULE
PW4 205 F
0.05 0.1 0.15 0.2 0.25
STRAIN. IN/N
0.3
STRESS-STRAIN CURVE DIABLO CANYON UNIT 2 V CAPSULE
100
80
(6 60 ci0 DU
co 40
20
00
PW 5 255 F
0.05 0.1 0.15 0.2 0.25
STRAIN, INIIN
0.3
Figure 5-27 Engineering Stress-Strain Curves for Weld Metal Tensile Specimens PW4 and PW5
Testing of Specimens from Capsule V
100
i,, I-
80
60
40
20
00

5-44
STRESS-STRAIN CURVE DIABLO CANYON UNIT 2 "V" CAPSULE
PW6 550 F
0.1 0.15 STRAIN, INIIN
0.20.25 0.3
Figure 5-28 Engineering Stress-Strain Curve for Weld Metal Tensile Specimen PW6
Testing of Specimens from Capsule V
100 90
80
70o
60 S50 LU
i-40 a,
30 20
10
00 0.05 0.25 0.3

6-1
6 RADIATION ANALYSIS AND NEUTRON DOSIMETRY
6.1 Introduction
Knowledge of the neutron environment within the reactor vessel and surveillance capsule geometry is
required as an integral part of LWR reactor vessel surveillance programs for two reasons. First, in order
to interpret the neutron radiation induced material property changes observed in the test specimens, the
neutron environment (energy spectrum, flux, fluence) to which the test specimens were exposed must be
known. Second, in order to relate the changes observed in the test specimens to the present and future
condition of the reactor vessel, a relationship must be established between the neutron environment at
various positions within the reactor vessel and that experienced by the test specimens. The former
requirement is normally met by employing a combination of rigorous analytical techniques and
measurements obtained with passive neutron flux monitors contained in each of the surveillance capsules.
The latter information is generally derived solely from analysis.
The use of fast neutron fluence (E > 1.0 MeV) to correlate measured material property changes to the
neutron exposure of the material has traditionally been accepted for development of damage trend curves
as well as for the implementation of trend curve data to assess vessel condition. In recent years, however,
it has been suggested that an exposure model that accounts for differences in neutron energy spectra
between surveillance capsule locations and positions within the vessel wall could lead to an improvement
in the uncertainties associated with damage trend curves as well as to a more accurate evaluation of
damage gradients through the reactor vessel wall.
Because of this potential shift away from a threshold fluence toward an energy dependent damage
function for data correlation, ASTM Standard Practice E853, "Analysis and Interpretation of Light-Water
Reactor Surveillance Results," recommends reporting displacements per iron atom (dpa) along with
fluence (E > 1.0 MeV) to provide a data base for future reference. The energy dependent dpa function to
be used for this evaluation is specified in ASTM Standard Practice E693, "Characterizing Neutron
Exposures in Iron and Low Alloy Steels in Terms of Displacements per Atom." The application of the
dpa parameter to the assessment of embrittlement gradients through the thickness of the reactor vessel
wall has already been promulgated in Revision 2 to Regulatory Guide 1.99, "Radiation Embrittlement of
Reactor Vessel Materials."
This section provides the results of the neutron dosimetry evaluations performed in conjunction with the
analysis of test specimens contained in surveillance Capsules U, X, Y, and V which were withdrawn at
various intervals during the first nine fuel cycles. This evaluation is based on current state-of-the-art
methodology and nuclear data including neutron transport and dosimetry cross-section libraries derived
from the ENDF/B-VI data base. This report provides a consistent up-to-date neutron exposure data base
for use in evaluating the material properties of the Diablo Canyon Unit 2 reactor vessel.
In each capsule dosimetry evaluation, fast neutron exposure parameters in terms of neutron fluence
(E > 1.0 MeV), neutron fluence (E > 0.1 MeV), and iron atom displacements (dpa) are established for the
capsule irradiation history. The analytical formalism relating the measured capsule exposure to the
exposure of the vessel wall is described and used to project the integrated exposure of the vessel wall.
Testing of Specimens from Capsule V

6-2
Also, uncertainties associated with the derived exposure parameters at the surveillance capsules and with
the projected exposure of the reactor vessel are provided.
All of the calculations and dosimetry evaluations presented in this section have been based on the latest
available nuclear cross-section data derived from ENDF/B-VI and the latest available calculational tools and are consistent with the requirements of Draft Regulatory Guide DG- 1053, "Calculational and Dosimetry Methods for Determining Pressure Vessel Neutron Fluence." Additionally, the methods used to develop the best estimate pressure vessel fluence are consistent with the NRC approved methodology
described in WCAP- 14040-NP-A, "Methodology Used to Develop Cold Overpressure Mitigating System Setpoints and RCS Heatup and Cooldown Limit Curves," January 1996.
6.2 Discrete Ordinates Analysis
A plan view of the reactor geometry at the core midplane is shown in Figure 4-1. Six irradiation capsules
attached to the neutron pads are included in the reactor design to constitute the reactor vessel surveillance
program. The capsules are located at azimuthal angles of 560, 58.50, 1240, 2360, 238.5', and 3040
relative to the core cardinal axis as shown in Figure 4-1.
A plan view of a dual surveillance capsule holder attached to the neutron pad is shown in Figure 6-1. The
stainless steel specimen containers are 1.182 by 1-inch and approximately 56 inches in height. The
containers are positioned axially such that the test specimens are centered on the core midplane, thus
spanning the central 5 feet of the 12-foot high reactor core.
From a neutronic standpoint, the surveillance capsules and associated support structures are significant.
The presence of these materials has a marked effect on both the spatial distribution of neutron flux and
the neutron energy spectrum in the water annulus between the neutron pad and the reactor vessel. In
order to determine the neutron environment at the test specimen location, the capsules themselves must be included in the analytical model.
In performing the fast neutron exposure evaluations for the Diablo Canyon Unit 2 surveillance capsules and reactor vessel, plant specific forward transport calculations were carried out using the following
three-dimensional flux synthesis technique:
q0(r,0,z) = i(r,0) * qI(r,z)
0b(r)
where 4(r,0,z) is the synthesized three-dimensional neutron flux distribution, 4(r,O) is the transport
solution in r,O geometry, ý(r,z) is the two-dimensional solution for a cylindrical reactor model using the actual axial core power distribution, and ý(r) is the one-dimensional solution for a cylindrical reactor
model using the same source per unit height as that used in the r,e two-dimensional calculation.
Testing of Specimens from Capsule V

6-3
For the Diablo Canyon Unit 2 analysis, all of the transport calculations were carried out using the DORT two-dimensional discrete ordinates code Version 3.1 [151 and the BUGLE-96 cross-section library[ 16]. The BUGLE-96 library provides a 67 group coupled neutron-gamma ray cross-section data set produced specifically for light water reactor application. In these analyses, anisotropic scattering was treated with a P5 legendre expansion and the angular discretization was modeled with an S 16 order of angular quadrature.
The reactor core power distributions used in the plant specific transport calculations were taken from the fuel cycle design data for Diablo Canyon Unit 2[18 through 26]. In performing the analyses, the spatial variation of the neutron source was obtained from a bumup weighted average of the respective power distributions from each of the individual fuel cycles. The energy distribution of the source was based on an appropriate fission split for uranium and plutonium isotopes;and, from that fission split, composite values of energy release per fission, neutron yield per fission, and fission spectrum were determined.
The absolute cycle-specific data from the synthesized transport results provided the means to:
1. Evaluate neutron dosimetry obtained from surveillance capsules,
2. Relate dosimetry results to key locations at the inner radius and through the thickness of the reactor vessel wall,
3. Enable a direct comparison of analytical prediction with measurement, and
4. Establish a mechanism for projection of reactor vessel exposure as the design of each new fuel cycle evolves.
Selected results from the neutron transport analyses are provided in Tables 6-1 through 6-5. The data listed in these tables establish the means for absolute comparisons of analysis and measurement for the Capsules U, X, Y, and V irradiation periods and provide the means to correlate dosimetry results with the corresponding exposure of the reactor vessel wall.
In Table 6-1, the calculated exposure parameters [ý(E > 1.0 MeV), 4(E > 0.1 MeV), and dpa/sec] are given at the geometric center of the two azimuthally symmetric surveillance capsule positions (31.5', corresponding to the 58.5, and 238.5 degree locations and 340, corresponding to the 56, 124, 236, and 304 degree locations). The plant-specific data are meant to establish the absolute comparison of measurement with analysis. Similar data are given in Table 6-2 for the reactor vessel inner radius. Again, the three pertinent exposure parameters are listed. It is important to note that the data for the vessel inner radius were taken at the clad/base metal interface, and, thus, represent the maximum predicted exposure levels of the vessel plates and welds.
Radial gradient information applicable to 4(E > 1.0 MeV), ý(E > 0.1 MeV), and dpa/sec is given in Tables 6-3, 6-4, and 6-5, respectively. The data are presented on a relative basis for each exposure parameter at several azimuthal locations. Exposure distributions through the vessel wall may be obtained by normalizing the calculated or projected exposure at the vessel inner radius to the gradient data listed in Tables 6-3 through 6-5.
Testing of Specimens from Capsule V

6-4
For example, the neutron flux 4(E > 1.0 MeV) at the ¼T depth in the reactor vessel wall along the 00 azimuth is given by:
011/4r (00) = q0(220.35, 00) F(225.87, 00)
where:
,/¼T(0 °) = Projected neutron flux at the ¼T position on the 00 azimuth.
*(220.35,0o) = Projected or calculated neutron flux at the vessel inner radius on the 0' azimuth.
F(225.87,00) = Ratio of the neutron flux at the ¼T position to the flux at the vessel inner radius
for the 00 azimuth. This data is obtained from Table 6-3.
Similar expressions apply for exposure parameters expressed in terms of (E > 0.1 MeV) and dpalsec
where the attenuation function F is obtained from Tables 6-4 and 6-5, respectively.
6.3 Neutron Dosimetry
The passive neutron sensors included in the Diablo Canyon Unit 2 surveillance program are listed in
Table 6-6. Also given in Table 6-6 are the primary nuclear reactions and associated nuclear constants that
were used in the evaluation of the neutron energy spectrum within the surveillance capsules and in the
subsequent determination of the various exposure parameters of interest [4O(E > 1.0 MeV),
O(E > 0.1 MeV), dpa/sec]. The relative locations of the neutron sensors within the capsules are shown in
Figure 4-2. The iron, nickel, copper, and cobalt-aluminum monitors, in wire form, were placed in holes
drilled in spacers at several axial levels within the capsules. The cadmium shielded uranium and
neptunium fission monitors were accommodated within the dosimeter block located near the center of the
capsule.
The use of passive monitors such as those listed in Table 6-6 does not yield a direct measure of the
energy dependent neutron flux at the point of interest. Rather, the activation or fission process is a
measure of the integrated effect that the time and energy dependent neutron flux has on the target
material over the course of the irradiation period. An accurate assessment of the average neutron flux
level incident on the various monitors may be derived from the activation measurements only if the
irradiation parameters are well known. In particular, the following variables are of interest:
"* The measured specific activity of each monitor,
"* The physical characteristics of each monitor,
"* The operating history of the reactor,
"* The energy response of each monitor, and
"* The neutron energy spectrum at the monitor location.
Testing of Specimens from Capsule V

6-5
The specific activity of each of the neutron monitors was determined using established ASTM
procedures[ 2 7 through 40]. Following sample preparation and weighing, the activity of each monitor was
determined by means of a high resolution gamma spectrometer. The irradiation history of the Diablo
Canyon Unit 2 reactor was obtained from data reported in NUREG-0020, "Licensed Operating Reactors
Status Summary Report," and in the Nucleonics Week Data Sheets for the first nine cycles of operation.
The irradiation history applicable to the exposure of Capsules U, X, Y, and V is given in Table 6-7.
Having the measured specific activities, the physical characteristics of the sensors, and the operating
history of the reactor, reaction rates referenced to full-power operation were determined from the
following equation:
A
No F Y X C1 [1- eA tj [ Pref
where:
R Reaction rate averaged over the irradiation period and referenced to operation at a core
power level of Pref (rps/nucleus).
A = Measured specific activity (dps/gm).
No = Number of target element atoms per gram of sensor.
F = Weight fraction of the target isotope in the sensor material.
Y = Number of product atoms produced per reaction.
Pj = Average core power level during irradiation period j (MW).
Pref = Maximum or reference power level of the reactor (MW).
Cj= Calculated ratio of 4(E > 1.0 MeV) during irradiation period j to the time weighted average
4(E > 1.0 MeV) over the entire irradiation period.
X = Decay constant of the product isotope (1/sec).
tj = Length of irradiation period j (sec).
td = Decay time following irradiation period j (sec).
and the summation is carried out over the total number of monthly intervals comprising the irradiation
period.
Testing of Specimens from Capsule V

6-6
In the equation describing the reaction rate calculation, the ratio [Pj]/[Pref] accounts for month-by-month variation of reactor core power level within any given fuel cycle as well as over multiple fuel cycles. The ratio Cj, which can be calculated for each fuel cycle using the transport technology discussed in Section 6.2, accounts for the change in sensor reaction rates caused by variations in flux level induced by changes in core spatial power distributions from fuel cycle to fuel cycle. For a single cycle irradiation, Cj is normally taken to be 1.0. However, for multiple-cycle irradiations, particularly those employing low leakage fuel management, the additional Cj term must be employed. The impact of changing flux levels for constant power operation can be quite significant for sensor sets that have been irradiated for many cycles in a reactor that has transitioned from non-low leakage to low leakage fuel management or for sensor sets contained in surveillance capsules that have been moved from one capsule location to another.
For the irradiation history of Capsules U, X, Y, and V, the flux level term in the reaction rate calculations was set to 1.0 for Capsule U only. Measured and saturated reaction product specific activities as well as the derived full power reaction rates are listed in Table 6-8. The reaction rates of the 2 3 8U sensors provided in Table 6-8 include corrections for 23 5U impurities, plutonium build-in, and gamma ray induced fissions. Corrections for gamma ray induced fissions were also included in the reaction rates for the 2 37Np sensors.
Values of key fast neutron exposure parameters were derived from the measured reaction rates using the FERRET least squares adjustment code [41]. The FERRET approach used the measured reaction rate data, sensor reaction cross-sections, and the calculated spectrum as input and proceeded to adjust the group fluxes to produce a best fit (in a least squares sense) within the constraints of the parameter uncertainties. The best estimate exposure parameters, along with the associated uncertainties, were then obtained from the best estimate spectrum.
In the FERRET evaluations, a log-normal least squares algorithm weights both the a priori values and the measured data in accordance with the assigned uncertainties and correlations. In general, the measured values,f, are linearly related to the flux, ý, by some response matrix, A:
fft.a) .= s O~a4 -
where i indexes the measured values belonging to a single data set s, g designates the energy group, and cx delineates spectra that may be simultaneously adjusted. For example,
R, = I cg Og g
relates a set of measured reaction rates, Ri, to a single spectrum, 4 g, by the multi-group reaction crosssection, Orig. The log-normal approach automatically accounts for the physical constraint of positive fluxes, even with large assigned uncertainties.
In the least squares adjustment, the continuous quantities (i.e., neutron spectra and cross-sections) were approximated in a multi-group format consisting of 53 energy groups. The calculated spectrum was converted to the FERRET 53 group structure using the SAND-II code[ 42]. This procedure was carried out by first expanding the 47 group calculated spectrum into the SAND-II 620 group structure using a
Testing of Specimens from Capsule V

6-7
SPLINE interpolation procedure in regions where group boundaries do not coincide. The 620 point
spectrum was then re-collapsed into the group structure used in FERRET.
The sensor set reaction cross-sections, obtained from the ENDF/B-VI dosimetry file[43 ], were also
collapsed into the 53 energy group structure using the SAND-II code. In this instance, the calculated
spectrum, as expanded to 620 groups, was employed as a weighting function in the cross-section
collapsing procedure. Reaction cross-section uncertainties in the form of a 53 x 53 covariance matrix for
each sensor reaction were also constructed from the information contained on the ENDF/B-VI data files.
These matrices included energy group to energy group uncertainty correlations for each of the individual
reactions. However, correlations between cross-sections for different sensor reactions were not included.
The omission of this additional uncertainty information does not significantly impact the results of the
adjustment.
The calculated neutron spectrum input to the FERRET evaluation was taken from the center of the
surveillance capsule. While the 53 x 53 group covariance matrices applicable to the sensor reaction
cross-sections were developed from the ENDF/B-VI data files, the covariance matrix for the input trial
spectrum was constructed from the following relation:
Mgg = Rn + Rg RgP 1
where Rn specifies an overall fractional normalization uncertainty (i.e., complete correlation) for the set
of values. The fractional uncertainties, Rg, specify additional random uncertainties for group g that are
correlated with a correlation matrix given by:
Pgg, = [- 01Sg + 0 eH
where:
(g-g'/f H 2 Y,2
The first term in the correlation matrix equation specifies purely random uncertainties, while the second
term describes short range correlations over a group range y (0 specifies the strength of the latter term).
The value of 8 is 1 when g = g' and 0 otherwise. For the calculated spectra used in the current
evaluations, a short range correlation of ' = 6 groups was used. This choice implies that neighboring
groups are strongly correlated when 0 is close to 1. Strong long-range correlations (or anti-correlations)
were justified based on information presented by R. E. Maerker[4 3 ]. The uncertainties associated with
the measured reaction rates included both statistical (counting) and systematic components. The
systematic component of the overall uncertainty accounts for counter efficiency, counter calibrations,
irradiation history corrections, and corrections for competing reactions in the individual sensors.
Results of the FERRET evaluation of the Capsules U, X, Y and V dosimetry are given in Table 6-9. The
data summarized in this table include fast neutron exposure evaluations in terms of D(E > 1.0 MeV),
(D(E > 0.1 MeV), and dpa. In general, excellent results were achieved in the fits of the best estimate
spectra to the individual measured reaction rates. The measured, calculated and best estimate reaction
Testing of Specimens from Capsule V

6-8
rates for each reaction are given in Table 6-10. An examination of Table 6-10 shows that, in all cases, reaction rates calculated with the best estimate spectra match the measured reaction rates to better than 6%. The best estimate spectra from the least squares evaluation is given in Table 6-11 in the FERRET 53 energy group structure.
In Table 6-12, absolute comparisons of the best estimate and calculated fluence at the center of Capsules U, X, Y, and V are presented. The results for the Capsules U, X, Y, and V dosimetry evaluation [average BE/C ratio of 0.93 for 1'(E > 1.0 MeV)] are consistent with results obtained from similar evaluations of dosimetry from other reactors using methodologies based on ENDF/B-VI cross-sections.
6.4 Projections of Reactor Vessel Exposure
The best estimate exposure of the Diablo Canyon Unit 2 reactor vessel was developed using a combination of absolute plant specific transport calculations and all available in-vessel and ex-vessel plant specific measurement data. In the case of Diablo canyon Unit 2, this measurement data base is considerable, including four in-vessel surveillance capsules and 24 sets of measurements obtained in the reactor cavity.
Combining this measurement data base with the plant-specific calculations, the best estimate vessel exposure is obtained from the following relationship:
(D~Best, = K COlc.ý
where:
(Best Est. = The best estimate fast neutron exposure at the location of interest.
K = The plant specific best estimate/calculation (BE/C) bias factor derived from the surveillance capsule and reactor cavity dosimetry data.
(Calc. = The absolute calculated fast neutron exposure at the location of interest.
The approach defined in the above equation is based on the premise that the measurement data represent the most accurate plant-specific information available at the locations of the dosimetry; and further, that the use of the measurement data on a plant-specific basis essentially removes biases present in the analytical approach and mitigates the uncertainties that would result from the use of analysis alone.
That is, at the measurement points the uncertainty in the best estimate exposure is dominated by the uncertainties in the measurement process. At locations within the reactor vessel wall, additional uncertainty is incurred due to the analytically determined relative ratios among the various measurement points and locations within the reactor vessel wall.
For Diablo Canyon Unit 2, the derived plant specific bias factors from internal surveillance capsule irradiations were 0.93, 0.96, and 0.95 for D(E > 1.0 MeV), (D(E > 0.1 MeV), and dpa, respectively. Corresponding bias factors obtained from comparisons with the 24 ex-vessel dosimetry sets irradiated over the first six operating fuel cycles were 0.90, 0.92, and 0.91 for 4'(E > 1.0 MeV), 1(E > 0.1 MeV),
Testing of Specimens from Capsule V

6-9
and dpa, respectively. The bias factors determined from the in-vessel and ex-vessel irradiations are in excellent agreement. Bias factors of this magnitude developed with BUGLE-96 are fully consistent with experience using the ENDF/B-VI based cross-section library.
Treating the in-vessel and ex-vessel comparisons as separate and equal populations results in plant averaged bias factors of 0.92, 0.94, and 0.93 for D(E > 1.0 MeV), (D(E > 0.1 MeV), and dpa, respectively. These average bias factors were used in the determination of the best estimate neutron exposure of the Diablo Canyon Unit 2 reactor pressure vessel.
The use of the bias factors derived from the measurement data base acts to remove plant-specific biases associated with the definition of the core source, actual versus assumed reactor dimensions, and operational variations in water density within the reactor. As a result, the overall uncertainty in the best estimate exposure projections within the vessel wall depends on the individual uncertainties in the measurement process, the uncertainty in the dosimetry location, and in the uncertainty in the calculated ratio of the neutron exposure at the point of interest to that at the measurement location.
The uncertainty in the derived neutron flux for an individual measurement is obtained directly from the results of a least-squares evaluation of dosimetry data. The least-squares approach combines individual uncertainty in the calculated neutron energy spectrum, the uncertainties in dosimetry cross-sections, and the uncertainties in measured foil specific activities to produce a net uncertainty in the derived neutron flux at the measurement point. The associated uncertainty in the plant specific bias factor, K, derived from the BE/C data base, in turn, depends on the total number of available measurements as well as on the uncertainty of each measurement.
In developing the overall uncertainty associated with the reactor vessel exposure, the positioning uncertainties for dosimetry are taken from parametric studies of sensor position performed as part a series of analytical sensitivity studies included in the qualification of the methodology. The uncertainties in the exposure ratios relating dosimetry results to positions within the vessel wall are again based on the analytical sensitivity studies of the vessel thickness tolerance, downcomer water density variations, and vessel inner radius tolerance. Thus, this portion of the overall uncertainty is controlled entirely by dimensional tolerances associated with the reactor design and by the operational characteristics of the reactor.
The net uncertainty in the bias factor, K, is combined with the uncertainty from the analytical sensitivity study to define the overall fluence uncertainty at the reactor vessel wall. In the case of Diablo Canyon Unit 2, the derived uncertainties in the bias factor, K, and the additional uncertainty from the analytical sensitivity studies combine to yield a net uncertainty of+ 8.9%
Based on this best-estimate approach, neutron exposure projections at key locations on the reactor vessel inner radius are given in Table 6-13; furthermore, calculated neutron exposure projections are also provided for comparison purposes. Along with the current 11.49 EFPY exposure, projections are also provided for exposure periods of 16, 32, and 54 EFPY. Projections for future operation were based on the assumption that the Cycles 5 through 9 exposure rates based on low leakage fuel management would continue to be applicable throughout plant life.
Testing of Specimens from Capsule V

6-10
In the derivation of best estimate and calculated exposure gradients within the reactor vessel wall for the
Diablo Canyon Unit 2 reactor vessel, exposure projections to 16, 32, and 54 EFPY were also employed.
Data based on both a 4D(E > 1.0 MeV) slope and a plant-specific dpa slope through the vessel wall are
provided in Table 6-14. Per Regulatory Guide 1.99, the calculated attenuation based on displacements per
atom (dpa) can be used in place of the exponential equation provided in the guide. The values of "equivalent" fluence based on the dpa attenuation slope provided in Table 6-14 are suitable for this
purpose.
In order to assess RTNDT versus fluence curves, dpa equivalent fast neutron fluence levels for the ¼AT
and 3/4T positions were defined by the relations:
= 0 (07) dpa(AT) and 0(31T) = 0(O7) dpa(O4T)
dpa(O7) dpa(07)
Using this approach results in the dpa equivalent fluence values listed in Table 6-14.
In Table 6-15, updated lead factors are listed for each of the Diablo canyon Unit 2 surveillance capsules.
Testing of Specimens from Capsule V

6-11
Figure 6-1
Plan View Of A Dual Reactor Vessel Surveillance Capsule
Testing of Specimens from Capsule V
(TYPICAL.
ye\
-- !1 .62S IN.

6-12
Table 6-1
Calculated Fast Neutron Exposure Rates And Iron Atom
Displacement Rates At The Surveillance Capsule Center
4(E > 1.0 MeV) (n/cm2 -sec)
Dual Capsule Positions
31.50 34.00
9.19E+10 1.07E+1I
7.83E+10 9.15E+10
7.20E+10 8.22E+ 10
6.23E+10 7.05E+10
6.09E+10 7.03E+10
6.08E+10 7.04E+ 10
5.97E+ 10 6.84E+ 10
6.01E+10 6.81E+10
6.31E+10 7.27E+ 10
ý(E > 0.1 MeV) (nrcm 2 -sec)
Dual Capsule Positions
31.50 34.00
4.06E+11 4.89E+11
3.46E+1 1 4.17E+1 1
3.18E+ 11 3.74E+11
2.75E+11 3.21E+11
2.69E+11 3.20E+11
2.68E+1 1 3.21E+11
2.63E+11 3.11E+ 1I
2.65E+11 3.1OE+l 1
2.79E+11 3.31E+1I
Cycle No.
1
2
3
4
5
6
7
8
9
Cycle No.
1
2
3
4
5
6
7
8
9
Testing of Specimens from Capsule V
Single Capsule
34.00
1.09E+ 11
9.30E+ 10
8.35E+10
7.16E+ 10
7.13E+10
7.15E+10
6.94E+10
6.91E+10
7.38E+10
Single Capsule
34.00
5.15E+1 1
4.39E+1I
3.95E+11
3.38E+ 1I
3.37E+11
3.38E+ I1
3.28E+1 1
3.27E+1 1
3.49E+1 1

6-13
Table 6-1 cont'd
Calculated Fast Neutron Exposure Rates And Iron Atom
Displacement Rates At The Surveillance Capsule Center
Iron Atom Displacement Rate (dpa/sec)
Dual Capsule Positions Single Capsule
31.50 34.00 34.00
1.76E-10 2.09E-10 2.17E-10
1.50E-10 1.78E-10 1.85E-10
1.38E-10 1.60E- 10 1.66E-10
1.20E- 10 1.37E-10 1.42E- 10
1.17E-10 1.37E-10 1.42E-10
1.17E-10 1.37E-10 1.42E-10
1.15E-10 1.33E-10 1.38E-10
1.15E-10 1.33E-10 1.37E-10
1.21E-10 1.42E- 10 1.47E- 10
Testing of Specimens from Capsule V
Cycle No.
1
2
3
4
5
6
7
8
9

6-14
Table 6-2
Calculated Azimuthal Variation Of Fast Neutron Exposure Rates
And Iron Atom Displacement Rates At The Reactor Vessel
Clad/Base Metal Interface
ý(E > 1.0 MeV)
150
1.71E+10
1.28E+10
1.10E+10
1.30E+10
1.12E+ 10
1.14E+ 10
1.15E+10
1.20E+10
1.19E+ 10
4b(E > 0.1 MeV)
150
3.64E+10
2.71E+10
2.52E+10
3.15E+ 10
2.38E+10
2.41E+10
2.43E+ 10
2.53E+10
2.53E+10
(n/cm2 -sec)
300
1.70E+10
1.42E+ 10
1.31E+10
1.22E+10
1.13E+10
1.13E+10
1.13E+10
1.15E+10
1.18E+10
(n/cm2-sec)
300
3.89E+10
3.23E+10
2.95E+10
2.78E+10
2.58E+10
2.58E+10
2.55E+10
2.61E+10
2.69E+ 10
Testing of Specimens from Capsule V
Cycle No.
1
2
3
4
5
6
7
8
9
Cycle No.
1
2
3
4
5
6
7
8
9
00
1.12E+ 10
8.44E+09
8.14E+09
8.53E+09
7.13E+09
7.44E+09
7.76E+09
7.98E+09
8.16E+09
00
2.35E+10
1.75E+10
1.71E+10
1.80E+10
1.50E+10
1.56E+10
1.63E+10
1.68E+10
1.71E+10
450
2.04E+ 10
1.72E+10
1.45E+10
1.37E+10
1.36E+10
1.37E+10
1.31E+10
1.30E+10
1.40E+10
450
5.11 E+10
4.28E+10
3.61 E+ 10
3.40E+ 10
3.36E+10
3.39E+10
3.24E+10
3.21E+10
3.46E+ 10

6-15
Table 6-2 cont'd
Calculated Azimuthal Variation Of Fast Neutron Exposure Rates
And Iron Atom Displacement Rates At The Reactor Vessel
Clad/Base Metal Interface
Iron Atom Displacement Rate (dpa/sec)
Cycle No. 00 150 30° 450
1 1.74E-11 2.63E-11 2.65E- 11 3.23E-11
2 1.29E-11 1.97E-11 2.21E- 11 2.71E-11
3 1.27E-11 1.83E-11 2.04E- 11 2.29E-11
4 1.33E-11 2.29E- 11 1.91E- 11 2.16E-11
5 1.11E-11 1.73E- 11 1.77E- 11 2.14E- 11
6 1.16E- 11 1.76E-11 1.77E- 11 2.16E- 11
7 1.21E-11 1.77E- 11 1.76E- 11 2.06E-11
8 1.24E- 11 1.84E- 11 1.80E- 11 2.05E-11
9 1.27E- 11 1.84E- 11 1.84E- 11 2.21E-11
Testing of Specimens from Capsule V

6-16
Table 6-3
Relative Radial Distribution Of 4(E > 1.0 MeV)
Within The Reactor Vessel Wall
Azimuthal Angle
00
1.000
0.564
0.276
0.130
0.060
Note: Base Metal Inner Radius =
Base Metal '/T
Base Metal ½/2T
Base Metal /T =
Base Metal Outer Radius =
150
1.000
0.559
0.272
0.127
0.057
300
1.000
0.562
0.276
0.130
0.060
450
1.000
0.551
0.263
0.120
0.053
220.35 cm
225.87 cm
231.39 cm
236.90 cm
242.42 cm
Testing of Specimens from Capsule V
Radius
(CM)
220.35
225.87
231.39
236.90
242.42

6-17
Table 6-4
Relative Radial Distribution Of ý(E > 0.1 MeV)
Within The Reactor Vessel Wall
Azimuthal Angle
00
1.000
0.876
0.655
0.450
0.276
Note: Base Metal Inner Radius =
Base Metal ¼/T
Base Metal 'AT
Base Metal 3¾T
Base Metal Outer Radius =
150
1.000
0.861
0.637
0.435
0.260
300
1.000
0.876
0.659
0.457
0.279
450
1.000
0.844
0.611
0.404
0.227
220.35 cm
225.87 cm
231.39 cm
236.90 cm
242.42 cm
Testing of Specimens from Capsule V
Radius
(CM)
220.35
225.87
231.39
236.90
242.42

6-18
Table 6-5
Relative Radial Distribution Of dpa/sec
Within The Reactor Vessel Wall
Azimuthal Angle00
1.000
0.638
0.385
0.230
0.132
Note: Base Metal Inner Radius =
Base Metal ¼T =
Base Metal '½T
Base Metal ¾T =
Base Metal Outer Radius =
150
1.000
0.634
0.380
0.226
0.127
300
1.000
0.651
0.402
0.245
0.142
450
1.000
0.643
0.389
0.229
0.123
220.35 cm
225.87 cm
231.39 cm
236.90 cm
242.42 cm
Testing of Specimens from Capsule V
Radius
(cm)
220.35
225.87
231.39
236.90
242.42

6-19
Table 6-6
Nuclear Parameters Used In The Evaluation Of Neutron Sensors
Monitor
Material
Copper
Iron
Nickel
Uranium-238
Neptunium-237
Cobalt-Al
Reaction of
Interest 63 Cu (n,a) 54 Fe (n,p) 5 8Ni (n,p) 2 3 8U (n,f) 23 7Np (n,f)
59 Co (n,'y)
Target Atom
Fraction
0.6917
0.0585
0.6808
0.9996
1.0000
0.0015
Response
Range
E > 4.7 MeV
E > 1.0 MeV
E > 1.0 MeV
E > 0.4 MeV
E > 0.08 MeV
non-threshold
Product Half-life
5.271 y
312.3 d
70.82 d
30.07 y
30.07 y
5.271 y
Note: 238U and 2 3 7Np monitors are cadmium shielded.
Testing of Specimens from Capsule V
Fission
Yield (%_)
6.02
6.17
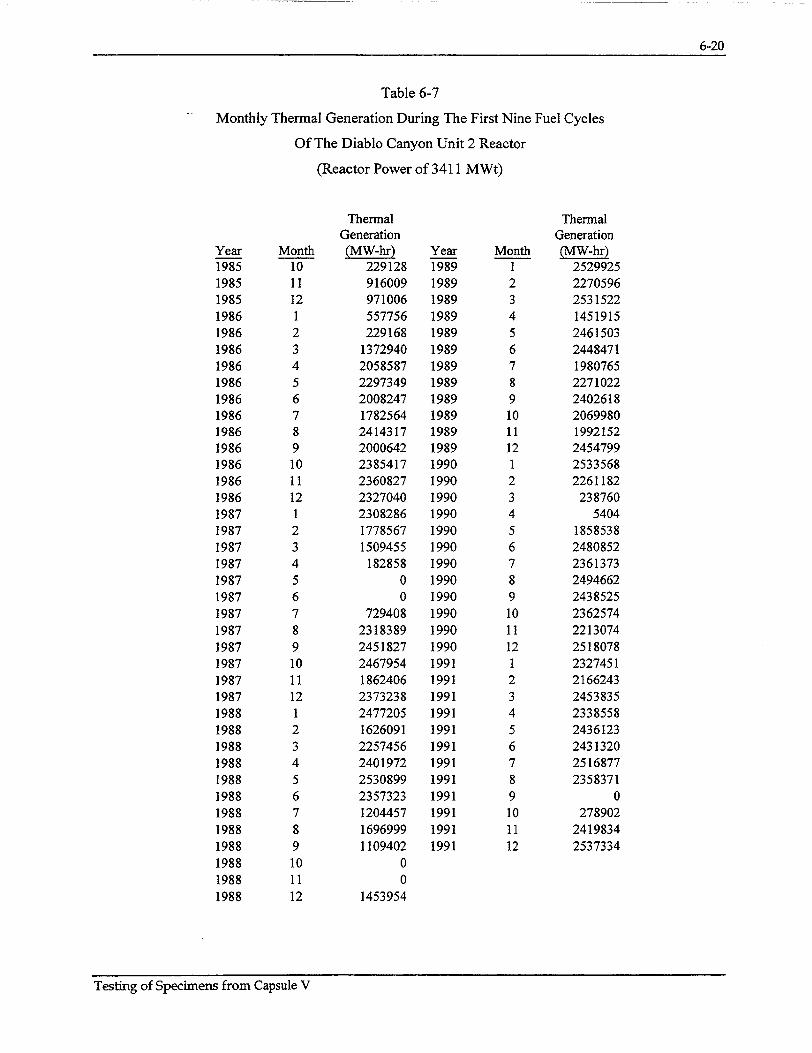
6-20
Table 6-7
Monthly Thermal Generation During The First Nine Fuel Cycles
Of The Diablo Canyon Unit 2 Reactor
(Reactor Power of 3411 MWt)
Thermal Thermal Generation Generation
Year Month (MW-hr) Year Month (MW-hr) 1985 10 229128 1989 1 2529925 1985 11 916009 1989 2 2270596 1985 12 971006 1989 3 2531522 1986 1 557756 1989 4 1451915 1986 2 229168 1989 5 2461503 1986 3 1372940 1989 6 2448471 1986 4 2058587 1989 7 1980765 1986 5 2297349 1989 8 2271022 1986 6 2008247 1989 9 2402618 1986 7 1782564 1989 10 2069980 1986 8 2414317 1989 11 1992152 1986 9 2000642 1989 12 2454799 1986 10 2385417 1990 1 2533568 1986 11 2360827 1990 2 2261182 1986 12 2327040 1990 3 238760 1987 1 2308286 1990 4 5404 1987 2 1778567 1990 5 1858538 1987 3 1509455 1990 6 2480852 1987 4 182858 1990 7 2361373 1987 5 0 1990 8 2494662 1987 6 0 1990 9 2438525 1987 7 729408 1990 10 2362574 1987 8 2318389 1990 11 2213074 1987 9 2451827 1990 12 2518078 1987 10 2467954 1991 1 2327451 1987 11 1862406 1991 2 2166243 1987 12 2373238 1991 3 2453835 1988 1 2477205 1991 4 2338558 1988 2 1626091 1991 5 2436123 1988 3 2257456 1991 6 2431320 1988 4 2401972 1991 7 2516877 1988 5 2530899 1991 8 2358371 1988 6 2357323 1991 9 0 1988 7 1204457 1991 10 278902 1988 8 1696999 1991 11 2419834 1988 9 1109402 1991 12 2537334 1988 10 0 1988 11 0 1988 12 1453954
Testing of Specimens from Capsule V

6-21
Table 6-7 cont'd
Monthly Thermal Generation During The First Nine Fuel Cycles
Of The Diablo Canyon Unit 2 Reactor
(Reactor Power of 3411 MWt)
Year 1992 1992 1992 1992 1992 1992 1992 1992 1992 1992 1992 1992 1993 1993 1993 1993 1993 1993 1993 1993 1993 1993 1993 1993 1994 1994 1994 1994 1994 1994 1994 1994 1994 1994 1994 1994
Month 1 2 3 4 5 6 7 8 9 10 11 12 1 2 3 4 5 6 7 8 9 10 11 12 1 2 3 4 5 6 7 8 9 10 11 12
Thermal Generation (MW-hr)
2515214 2331904 2007919 2454447 2535697 2416838 2535598 2330087 2454095 2535173 2419114 2534755 2420178 2096545 372137
0 2210729 2453399 2537228 2535680 2453620 2536310 2420604 2378469 2515705 2275091 2107924 1711048 2536908 2453677 2534657 2536515 1869962 101187
2439266 1712096
Year 1995 1995 1995 1995 1995 1995 1995 1995 1995 1995 1995 1995 1996 1996 1996 1996 1996 1996 1996 1996 1996 1996 1996 1996 1997 1997 1997 1997 1997 1997 1997 1997 1997 1997 1997 1997
Month 1 2 3 4 5 6 7 8 9 10 11 12 1 2 3 4 5 6 7 8 9 10 11 12 1 2 3 4 5 6 7 8 9 10 11 12
Thermal Generation (MW-hr) 2213840 2287785 2520694 2432979 2517401 2356238 2522350 2417984 1715928 2255827 2388253 2055629 2516315 2351050 2513809 408706 365561
2463874 2534046 1749697 2474561 2549613 2438577 2557038 2546470 2248837 2342180 1693416 2545003 2445582 2104660 2436482 2202464 2338228 2458276 2539974
Testing of Specimens from Capsule V
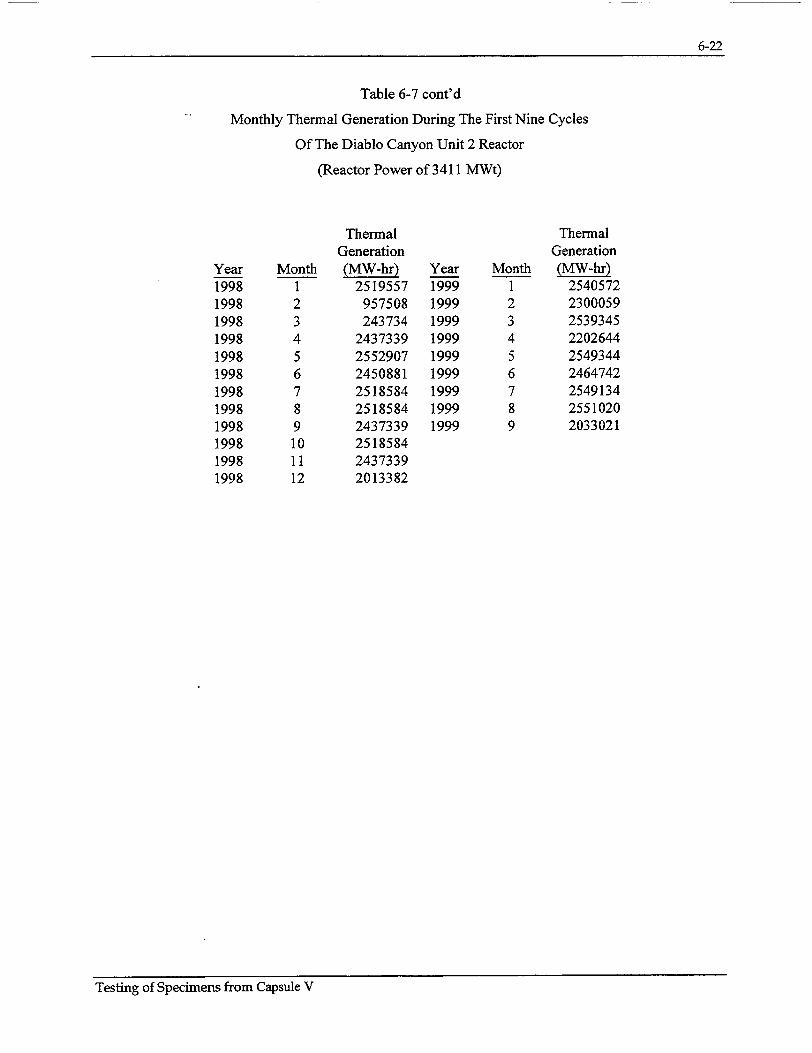
6-22
Table 6-7 cont'd
Monthly Thermal Generation During The First Nine Cycles
Of The Diablo Canyon Unit 2 Reactor
(Reactor Power of 3411 MWt)
Year 1998 1998 1998 1998 1998 1998 1998 1998 1998 1998 1998 1998
Month 1 2 3 4 5 6 7 8 9 10 11 12
Thermal Generation (MW-hr)
2519557 957508 243734
2437339 2552907 2450881 2518584 2518584 2437339 2518584 2437339 2013382
Year 1999 1999 1999 1999 1999 1999 1999 1999 1999
Month 1 2 3 4 5 6 7 8 9
Thermal Generation (MW-hr)
2540572 2300059 2539345 2202644 2549344 2464742 2549134 2551020 2033021
Testing of Specimens from Capsule V

6-23
Table 6-8
Measured Sensor Activities And Reaction Rates
Surveillance Capsule U
Reaction
63 Cu (n,cL) 6 0Co
54 Fe (n,p) 54 Mn
58Ni (n,p) 5 8Co
59 Co (ny) 60 Co
5 9Co (ny') 60 Co (Cd)
238U (n,f) 13 7Cs
23 7Np (n,f) 13 7 Cs
Location
Top Middle Bottom
Top Middle Bottom
Top Middle Bottom
Top Top
Middle Middle Bottom Bottom
Top
Middle Bottom
Middle Including 2 3 5U,
Middle
Measured Activity (dps/gm)
3.910E+04 4.130E+04 4.040E+04
1.130E+06 1.210E+06 1.180E+06
5.430E+06 5.620E+06 5.790E+06
1.OOOE+07 1.080E+07 1.060E+07 8.580E+06 1.070E+07 9.160E+06
5.710E+06
5.380E+06 5.720E+06
1.370E+05
Saturated Activity (dps/gm)
3.500E+05 3.697E+05 3.617E+05
3.546E+06 3.797E+06 3.703E+06
5.537E+07 5.731E+07 5.904E+07
8.952E+07 9.669E+07 9.489E+07 7.681E+07 9.579E+07 8.200E+07
5.112E+07
4.816E+07 5.121E+07
6.153E+062 39Pu, and yfission corrections
1.370E+06 Including y,fission correction
6.153E+07
Testing of Specimens from Capsule V
Reaction Rate
(rps/atom)
5.340E- 17 5.640E- 17 5.518E-17
5.621E-15 6.019E-15 5.870E- 15
7.927E- 15 8.204E- 15 8.452E-15
5.841E-12 6.308E-12 6.191E-12 5.011E-12 6.249E- 12 5.350E-12
3.335E-12
3.142E- 12 3.341E-12
4.040E-14 3.393E-14
3.925E-13 3.885E-13

6-24
Table 6-8 cont'd
Measured Sensor Activities And Reaction Rates
Surveillance Capsule X
Reaction
6 3 Cu (n,a) 6 0Co
54 Fe (n,p) 54Mn
5 8Ni (n,p) 5 8Co
59 Co (n,y) 6 0Co
5 9 Co (n,y) 60 Co (Cd)
238U (n,f) 137Cs
2 3 7Np (n,f) 137 Cs
Location
Top Bottom
Top Middle Bottom
Top Middle Bottom
Top Top
Middle Middle Bottom Bottom
Top
Middle Bottom
Middle
Measured Activity (dps/gm)
8.850E+04 9.230E+04
1.410E+06 1.490E+06 1.480E+06
7.230E+06 7.640E+06 7.570E+06
1.990E+07 2.350E+07 2.160E+07 1.730E+07 2.270E+07 1.960E+07
1.210E+07
1. 120E+07 1.200E+07
3.500E+05Including 2 35U, 2 39 pu, and yfission corrections
Middle 3.130E+06 Including y,fission correction
Testing of Specimens from Capsule V
Saturated Activity
(dps/gm)
3.007E+05 3.136E+05
2.842E+06 3.003E+06 2.983E+06
4.474E+07 4.727E+07 4.684E+07
6.762E+07 7.985E+07 7.339E+07 5.878E+07 7.713E+07 6.660E+07
4.11 1E+07
3.806E+07 4.077E+07
5.187E+06
Reaction Rate
(rps/atom)
4.588E-17 4.784E- 17
4.505E- 15 4.760E- 15 4.728E-15
6.404E- 15 6.767E-15 6.705E-15
4.411E-12 5.210E-12 4.788E-12 3.835E-12 5.032E-12 4.345E-12
2.682E-12
2.483E-12 2.660E-12
3.406E-14 2.790E- 14
2.959E-13 2.929E-13
4.639E+07

6-25
Table 6-8 con't
Measured Sensor Activities And Reaction Rates
Surveillance Capsule Y
Reaction
6 3Cu (n,a) 6 0Co
54Fe (n,p) 54 Mn
5 8Ni (n,p) 5 8Co
5 9Co (n,y) 60 Co
5 9Co (n,y) 60 Co (Cd)
238U (n,f) 13 7Cs
2 37Np (n,f) 137 Cs
Location
Top Middle Bottom
Top Middle Bottom
Top Middle Bottom
Top Top
Middle Middle Bottom Bottom
Top
Middle Bottom
Measured Activity (dps/gm)
1.280E+05 1.380E+05 1.340E+05
1.320E+06 1.440E+06 1.410E+06
8.2103E+06 8.790E+06 8.960E+06
2.390E+07 2.800E+07 2.150E+07 2.480E+07 2.600E+07 2.260E+07
1.480E+07
1.370E+07 1.440E+07
Saturated Activity (dps/gm)
2.477E+05 2.671E+05 2.593E+05
2.225E+06 2.427E+06 2.377E+06
3.5 1OE+07 3.758E+07 3.830E+07
4.626E+07 5.419E+07 4.161E+07 4.800E+07 5.032E+07 4.374E+07
2.864E+07
2.65 1E+07 2.787E+07
Middle 5.330E+05 3.676E+06 Including 2 35U, 2 39pu, and ,,fission corrections
Middle 4.070E+06 Including yfission correction
2.807E+07
Testing of Specimens from Capsule V
Reaction Rate
(rps/atom)
3.779E-17 4.074E- 17 3.956E-17
3.527E-15 3.847E- 15 3.767E-15
5.024E-15 5.379E-15 5.483E-15
3.018E-12 3.535E-12 2.715E-12 3.131E-12 3.283E-12 2.854E-12
1.869E-12
1.730E-12 1.818E-12
2.414E-14 1.901E-14
1.791E-13 1.773E-13

6-26
Table 6-8 con't
Measured Sensor Activities And Reaction Rates
Surveillance Capsule V
Reaction
63 Cu (n,xc) 60Co
54 Fe (n,p) 54Mn
5 8Ni (n,p) 5 8Co
59 Co (n,y) 60Co
59 Co (n,y') 60 Co (Cd)
2 38U (n,f) 137 Cs
2 3 7Np (n,f) 137 Cs
Location
Top Middle Bottom
Top Middle Bottom
Top Middle Bottom
Top Top
Middle Middle Bottom Bottom
Top
Middle Bottom
Measured Activity (dps/gm)
1.580E+05 1.680E+05 1.630E+05
1.550E+06 1.640E+06 1.620E+06
1.150E+07 1.270E+07 1.240E+07
2.650E+07 3.340E+07 2.570E+07 3.120E+07 3.330E+07 2.740E+07
1.850E+07
1.730E+07 1.870E+07
Saturated Activity (dps/gm)
2.344E+05 2.492E+05 2.418E+05
2.153E+06 2.278E+06 2.250E+06
3.311 E+07 3.656E+07 3.570E+07
3.931 E+07 4.955E+07 3.812E+07 4.628E+07 4.940E+07 4.064E+07
2.744E+07
2.566E+07 2.774E+07
Middle 1.070E+06 4.743E+06 Including 2 3 5U, 23 9 pu, and 'y,fission corrections
Middle 6.800E+06 3.014E+07 Including y,fission correction
Reaction Rate
(rps/atom)
3.576E-17 3.802E-1 7 3.689E-1 7
3.413E-1 5 3.611E-15 3.567E-1 5
4.740E-15 5.234E-1 5 5.111E-15
2.565E-1 2 3.232E-1 2 2.487E-1 2 3.019E-12 3.223E-1 2 2.652E-1 2
1.790E-1 2
1.674E-12 1.810E-12
3.114E-14 2.393E-14
1.923E-13 1.903E-13
Testing of Specimens from Capsule V

6-27
Table 6-9
Summary Of Neutron Dosimetry Results
Surveillance Capsules U, X, Y, and V
Best Estimate Flux and Fluence for Capsule U
Quantity 4 (E > 1.0 MeV) 4 (E > 0.1 MeV)
dpa/sec S(E < 0.414 eV)
Flux [n/cm2 -sec] 1.083E+1 1 5.145E+1 1 2.172E- 10 1.072E+ 11
Quantity D (E > 1.0 MeV) D (E > 0. 1 MeV)
dpa (D (E < 0.414 eV)
Best Estimate Flux and Fluence for Capsule X
Quantity 'b (E > 1.0 MeV) 4(E > 0.1 MeV)
dpa/sec 4i(E < 0.414 eV)
Flux [n/cm 2 -sec] 9.376E+ 10 4.247E+ 1I 1.825E-10 5.863E+10
Quantity D (E > 1.0 MeV) (D (E > 0. 1 MeV)
dpa (D (E < 0.414 eV)
Best Estimate Flux and Fluence for Capsule Y
Quantity 4(E > 1.0 MeV) 4'(E > 0.1 MeV)
dpa/sec 4(E < 0.414 eV)
Flux [n/cm 2 -sec] 7.008E+10 3.069E+1 I 1.342E-10 4.265E+10
Quantity (D (E > 1.0 MeV) S(E > 0.1 MeV)
dpa S(E < 0.414 eV)
Best Estimate Flux and Fluence for Capsule V
Quantity 4(E > 1.0 MeV) F(E > 0.1 MeV)
dpa/sec 4(E < 0.414 eV)
Flux [n/cm2 -sec] 6.669E+ 10 2.916E+1 1 1.276E-10
4.047E+10
Quantity (D (E > 1.0 MeV) (D (E > 0. 1 MeV)
dpa (D (E < 0.414 eV)
Testing of Specimens from Capsule V
Fluence rn/cm 2]
3.394E+18 1.612E+19 6.807E-03 3.360E+1 8
la Uncertainty
6% 10% 8% 15%
Fluence [n/cm 2]
8.413E+1 8 3.982E+19 1.687E-02 8.261E+18
la Uncertainty
6% 10% 8% 16%
Fluence [n/cm2]
1.337E+19 5.919E+19 2.593E-02 1.213E+19
la Uncertainty
6% 10% 8% 16%
Fluence [n/cm2]
2.288E+19 1.022E+20 4.433E-02 1.730E+19
lcy Uncertainty
6% 10% 8%
17%

6-28
Table 6-10
Comparison Of Measured, Calculated, And Best Estimate
Reaction Rates At The Surveillance Capsule Center
Surveillance Capsule U
Reaction 63 Cu (n,o) 54 Fe (n,p) 5 8Ni (n,p) 238U (n,f)
(Cd) 23 7Np (n,f)
(Cd) 59 Co (n,y)
5 9 Co (n,y) (Cd)
Measured 5.50E-17 5.84E-15 8.19E- 15 3.39E-14
Calculated 5.23E-17 6.06E-15 8.55E-15 3.36E-14
Best Estimate 5.36E-17 5.96E-15 8.39E-15 3.34E-14
3.88E-13 3.40E-13 3.66E-13
5.82E-12 4.97E-12 5.73E-12 3.27E-12 3.46E-12 3.32E-12
Surveillance Capsule X
Reaction 63 Cu (n,a) 5 4Fe (n,p) 5 8Ni (n,p) 238U (n,f)
(Cd) 23 7Np (n,f)
(Cd) 59 Co (n,y)
59 Co (n,y) (Cd)
Measured 4.69E-17 4.66E- 15 6.62E-15 2.79E-14
Calculated 4.66E-17 5.33E-15 7.51E-15 2.93E-14
Best Estimate 4.52E- 17 4.83E- 15 6.80E-15 2.67E-14
2.93E-13 2.93E-13 2.83E-13
4.60E-12 2.61E-12
4.26E-12 4.53E-12 2.97E-12 2.64E-12
BE / Meas BE/ Calc 0.97 0.97 1.04 0.91 1.03 0.91 0.96 0.91
0.96
0.98 1.01
0.96
1.06 0.89
Surveillance Capsule Y
Reaction 63 Cu (n,o) 54 Fe (n,p) 5 8Ni (n,p) 238U (n,f)
(Cd) 2 3 7Np (n,f)
(Cd) 5 9Co (n,y)
5 9Co (n,y) (Cd)
Measured 3.94E- 17 3.71E-15 5.29E-15 1.90E-14
Calculated 3.85E-17 4.20E-15 5.88E-15 2.23E- 14
Best Estimate 3.81E-17 3.80E- 15 5.31E-15 1.95E-14
1.77E-13 2.15E-13 1.81E-13
3.09E-12 3.08E-12 3.05E-12 1.81E-12 2.15E-12 1.83E-12
Testing of Specimens from Capsule V
BE / Meas 0.98 1.02 1.02 0.98
0.94
0.98 1.01
BE/ Calc 1.02 0.98 0.98 0.99
1.08
1.15 0.96
Meas/Calc 1.05 0.96 0.96 1.01
1.14
1.17 0.94
Meas/Calc 1.01 0.87 0.88 0.95
1.00
1.08 0.88
BE / Meas 0.97 1.02 1.00 1.03
1.02
0.99 1.01
BE/ Calc 0.99 0.91 0.90 0.87
0.84
0.99 0.85
Meas/Calc 1.02 0.88 0.90 0.85
0.82
1.00 0.84

6-29
Table 6-10 (continued)
Comparison Of Measured, Calculated, And Best Estimate
Reaction Rates At The Surveillance Capsule Center
Reaction 63 Cu (n,cc) 5 4Fe (n,p) 5 8Ni (n,p) 2 38U (n,f)
(Cd) 2 3 7Np (n,f)
(Cd) 59 Co (n,y)
59 Co (n,y) (Cd)
Measured
3.69E-17
3.53E-15
5.03E-15
2.39E-14
Calcu
3.69E
4.01E
5.611
2.121
Surveillance Capsule V
Best
lated Estimate
,-47 3.57E-17
,-15 3.70E-15
-15 5.19E-15
:-14 2.01E-14
1.90E-13 2.05E-13 1.94E-13
2.86E-12
1.76E-12
2.93E-12
2.04E-12
2.84E-12
1.78E-12
Testing of Specimens from Capsule V
3E / Meas
0.97
1.05
1.03
0.84
1.02
0.99
1.01
BE/ Calc
0.97
0.92
0.93
0.95
0.94
0.97
0.87
Meas/Calc
1.00
0.88
0.90
1.13
0.93
0.98
0.86

6-30
Table 6-11
Best Estimate Neutron Energy Spectrum At The
Center Of Surveillance Capsules
Capsule U
Group # 1
2 3 4 5 6 7 8 9 10 11 12 13 14 15 16 17 18 19 20 21 22 23 24 25 26 27
Energy (MeV)
1.73E+01 1.49E+0 I 1.35E+01 1.1 6E+0 1 1.00E+01 8.61E+00 7.41E+00 6.07E+00 4.97E+00 3.68E+00 2.87E+00 2.23E+00 1.74E+00 1.35E+00 1.11 E+00 8.21E-01 6.39E-01 4.98E-0 1 3.88E-01 3.02E-0 1 1.83E-01 1.11E-01 6.74E-02 4.09E-02 2.55E-02 1.99E-02 1.50E-02
Flux (n/cm2 -sec) 6.691E+06 1.438E+07 5.330E+07 1.477E+08 3.431E+08 6.028E+08 1.454E+09 2.259E+09 4.770E+09 5.772E+09 1.145E+10 1.592E+10 2.254E+10 2.597E+10 4.971E+10 5.474E+ 10 6.358E+10 4.106E+10 6.356E+10 7.002E+10 7.091E+10 4.583E+10 4.306E+10 2.303E+10 2.649E+10 1.308E+10 2.507E+10
Energy (MeV)
9.12E-03 5.53E-03 3.36E-03 2.84E-03 2.40E-03 2.04E-03 1.23E-03 7.49E-04 4.54E-04 2.75E-04 1.67E-04 1.01E-04 6.14E-05 3.73E-05 2.26E-05 1.37E-05 8.32E-06 5.04E-06 3.06E-06 1.86E-06 1.13E-06 6.83E-07 4.14E-07 2.51E-07 1.52E-07 9.24E-08
Flux (n/cm2 -sec) 2.802E+10 2.862E+ 10 8.926E+09 8.787E+09 8.757E+09 2.617E+10 2.604E+10 2.576E+10 2.063E+10 2.268E+10 2.375E+10 2.450E+10 2.442E+ 10 2.408E+ 10 2.348E+10 2.267E+10 2.141E+10 1.982E+10 1.906E+10 1.789E+10 1.104E+ 10 1.364E+10 2.050E+10 1.971E+10 1.848E+10 4.850E+10
Note: Tabulated energy levels represent the upper energy in each group.
Testing of Specimens from Capsule V
Group # 28 29 30 31 32 33 34 35 36 37 38 39 40 41 42 43 44 45 46 47 48 49 50 51 52 53

6-31
Table 6-11 cont'd
Best Estimate Neutron Energy Spectrum At The
Center Of Surveillance Capsules
Capsule X
Group # 1 2 3 4 5 6 7 8 9 10 11 12 13 14 15 16 17 18 19 20 21 22 23 24 25 26 27
Energy (MeV)
1.73E+01 1.49E+01 1.35E+01 1.16E+01 1.00E+01 8.61E+00 7.41E+00 6.07E+00 4.97E+00 3.68E+00 2.87E+00 2.23E+00 1.74E+00 1.35E+00 1.11E+00 8.21 E-0 1 6.39E-01 4.98E-01 3.88E-01 3.02E-01 1.83E-01 1.11E-01 6.74E-02 4.09E-02 2.55E-02 1.99E-02 1.50E-02
Flux (n/cm2 -sec) 5.813E+06 1.246E+07 4.581E+07 1.261E+08 2.912E+08 5.068E+08 1.213E+09 1.859E+09 3.862E+09 4.624E+09 9.128E+09 1.262E+10 1.779E+10 2.040E+10 3.893E+10 4.285E+10 4.984E+10 3.230E+10 5.015E+10 5.547E+10 5.638E+10 3.658E+10 3.448E+ 10 1.850E+10 2.132E+ 10 1.057E+10 2.029E+10
Energy (MeV)
2.269E+ 10 2.318E+10 7.23 1E+09 7.117E+09 7.088E+09 2.116E+10 2.101E+10 2.075E+10 1.658E+10 1.818E+10 1.888E+10 1.962E+10 1.956E+10 1.932E+10 1.887E+10 1.825E+10 1.726E+10 1.599E+10 1.539E+10 1.445E+10 8.922E+09 1.094E+ 10 1.635E+10 1.562E+10 1.458E+10 3.770E+ 10
Flux (n/cm 2-sec) 1.97E+10 2.OOE+ 10 6.24E+09 6.13E+09 6.07E+09 1.80E+10 1.77E+10 1.73E+10 1.37E+10 1.48E+10 1.48E+10 1.60E+10 1.60E+10 1.59E+10 1.57E+10 1.53E+10 1.46E+10 1.36E+10 1.31E+10 1.24E+10 7.65E+09 9.40E+09 1.43E+10 1.38E+10 1.29E+10 3.36E+10
Note: Tabulated energy levels represent the upper energy in each group.
Testing of Specimens from Capsule V
Group # 28 29 30 31 32 33 34 35 36 37 38 39 40 41 42 43 44 45 46 47 48 49 50 51 52 53
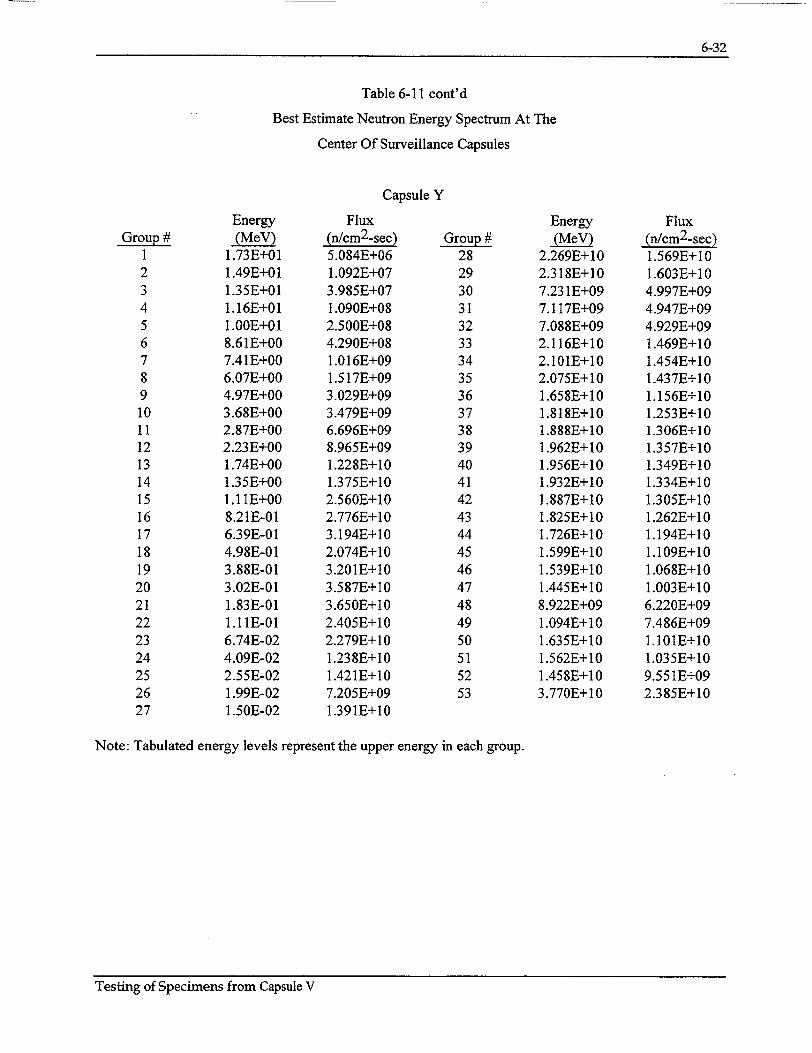
6-32
Table 6-11 cont'd
Best Estimate Neutron Energy Spectrum At The
Center Of Surveillance Capsules
Capsule Y
Group # 1 2 3 4 5 6 7 8 9 10 11 12 13 14 15 16 17 18 19 20 21 22 23 24 25 26 27
Energy
1.73E+01 1.49E+01 1.35E+01 1.16E+01 1.00E+01 8.6 1E+00 7.4 1E+00 6.07E+00 4.97E+00 3.68E+00 2.87E+00 2.23E+00 1.74E+00 1.35E+00 1.I1E+00 8.21E-01 6.39E-01 4.98E-01 3.88E-01 3.02E-01 1.83E-01 1.11E-01 6.74E-02 4.09E-02 2.55E-02 1.99E-02 1.50E-02
Flux (n/cm 2-sec) 5.084E+06 1.092E+07 3.985E+07 1.090E+08 2.500E+08 4.290E+08 1.016E+09 1.517E+09 3.029E+09 3.479E+09 6.696E+09 8.965E+09 1.228E+10 1.375E+10 2.560E+10 2.776E+10 3.194E+10 2.074E+10 3.201E+10 3.587E+10 3.650E+10 2.405E+ 10 2.279E+ 10 1.238E+10 1.421E+10 7.205E+09 1.391E+10
Energy (MeV)
2.269E+10 2.318E+10 7.231E+09 7.117E+09 7.088E+09 2.116E+10 2.101E+10 2.075E+10 1.658E+ 10 1.818E+10 1.888E+10 1.962E+10 1.956E+10 1.932E+10 1.887E+10 1.825E+10 1.726E+10 1.599E+10 1.539E+10 1.445E+ 10 8.922E+09 1.094E+ 10 1.635E+ 10 1.562E+10 1.458E+10 3.770E+10
Flux (n/cm2 -sec) 1.569E+ 10 1.603E+10 4.997E+09 4.947E+09 4.929E+09 1.469E+10 1.454E+10 1.437E+ 10 1.156E+10 1.253E+10 1.306E+ 10 1.357E+10 1.349E+ 10 1.334E+ 10 1.305E+10 1.262E+10 1.194E+10 1.109E+10 1.068E+10 1.003E+10 6.220E+09 7.486E+09 1.101E+10 1.035E+10 9.551E+09 2.385E+10
Note: Tabulated energy levels represent the upper energy in each group.
Testing of Specimens from Capsule V
Group # 28 29 30 31 32 33 34 35 36 37 38 39 40 41 42 43 44 45 46 47 48 49 50 51 52 53

I "
6-33
Table 6-11 cont'd
Best Estimate Neutron Energy Spectrum At The
Center Of Surveillance Capsules
Capsule V
Group # 1 2 3 4 5 6 7 8 9 10 11 12 13 14 15 16 17 18 19 20 21 22 23 24 25 26 27
Energy (MeV)
1.73E+01 1.49E+01 1.35E+01 1.16E+01 1.00E+01 8.61E+00 7.41E+00 6.07E+00 4.97E+00 3.68E+00 2.87E+00 2.23E+00 1.74E+00 1.35E+00 1.11E+00 8.21E-01 6.39E-01 4.98E-01 3.88E-01 3.02E-01 1.83E-01 1.11E-01 6.74E-02 4.09E-02 2.55E-02 1.99E-02 1.50E-02
Flux (n/cm2 -sec) 4.735E+06 1.012E+07 3.675E+07 1.004E+08 2.315E+08 4.004E+08 9.601E+08 1.454E+09 2.954E+09 3.477E+09 6.874E+09 9.444E+09 1.316E+10 1.479E+10 2.772E+ 10 3.008E+1 0 3.449E+10 2.225E+ 10 3.402E+10 3.769E+10 3.790E+10 2.468E+ 10 2.312E+10 1.244E+10 1.417E+10 7.137E+09 1.372E+10
Note: Tabulated energy levels represent the upper energy in each group.
Testing of Specimens from Capsule V
Energy (MeV)
2.269E+ 10 2.318E+10 7.23 1E+09 7.117E+09 7.088E+09 2.116E+10 2.101E+10 2.075E+10 1.658E+10 1.818E+10 1.888E+10 1.962E+10 1.956E+10 1.932E+10 1.887E+10 1.825E+10 1.726E+10 1.599E+10 1.539E+10 1.445E+10 8.922E+09 1.094E+10 1.635E+10 1.562E+10 1.458E+10 3.770E+10
Group # 28 29 30 31 32 33 34 35 36 37 38 39 40 41 42 43 44 45 46 47 48 49 50 51 52 53
Flux (n/cm 2 -sec) 1.541E+10 1.570E+-10 4.887E+09 4.835E+09 4.813E+09 1.434E+10 1.420E+ 10 1.402E+ 10 1.127E+10 1.220E+ 10 1.271E+10 1.320E+ 10 1.3 11E+10 1.296E+ 10 1.267E+ 10 1.224E+ 10 1.157E+10 1.072E+ 10 1.03 1E+10 9.676E+09 5.990E+09 7.013EE+09 1.008E+10 9.277E+09 8.427E+09 2.012E+10

6-34
Table 6-12
"Comparison Of Calculated And Best Estimate Integrated Neutron
Exposure Of Diablo Canyon Unit 2 Surveillance Capsules U, X, Y, and V
CAPSULE U
'I(E > 1.0 MeV) [n/cm2 ] (D(E> 0.1 MeV) [n/cm2 ] Dpa
Calculated 3.38E+18 1.55E+19 6.62E-03
Best Estimate 3.39E+18 1.61E+19 6.81 E-03
CAPSULE X
1'(E > 1.0 MeV) [n/cm2 ] D(E > 0.1 MeV) [n/cm 2 ] Dpa
Calculated 9.19E+18 4.16E+19 1.79E-02
Best Estimate 8.41E+18 3.98E+19 1.69E-02
CAPSULE Y
D(E > 1.0 MeV) [n/cm2] D(E > 0.1 MeV) [n/cm2] dpa
Calculated 1.55E+19 6.80E+19 2.97E-02
Best Estimate 1.34E+19 5.92E+19 2.59E-02
CAPSULE V
D(E > 1.0 MeV) [nlcm 2] c1(E > 0.1 MeV) [n/cm 2]
dpa
Calculated 2.41 E+19 1.05E+20 4.61 E-02
Best Estimate 2.29E+19 1.02E+20 4.43E-02
AVERAGE BE/C RATIOS
D(E > 1.0 MeV) D(E > 0.1 MeV) dpa
Testing of Specimens from Capsule V
BE/C 1.00 1.04 1.03
BE/C 0.91 0.96 0.94
BE/C 0.86 0.87 0.87
BE/C 0.95 0.97 0.96
[n/cm 2 ] [n/cm 2 ]
BE/C 0.93 0.96 0.95

6-35
Table 6-13
Azimuthal Variations Of The Maximum Neutron Exposure Projections
On The Reactor Vessel Clad/Base Metal Interface
Best Estimate
1.02 EFPY E>1.0 MeV E>0.1 MeV
Dpa
2.05 EFPY E>1.0 MeV E>0.1 MeV
Dpa
4.43 EFPY E>1.0 MeV E>0.1 MeV
Dpa
7.08 EFPY E>1.0 MeV E>0.1 MeV
Dpa
11.49 EFPY E>1.0 MeV E>0.1 MeV
Dpa
16 EFPY E>1.0 MeV E>0.1 MeV
Dpa
32 EFPY E>1.0 MeV E>0.1 MeV
Dpa
54 EFPY E>1.0 MeV E>0.1 MeV
dpa
00
3.29E+17 7.07E+17 5.18E-04
5.66E+17 1.22E+ 18 8.92E-04
1.14E+18 2.45E+ 18 1.80E-03
1.70E+18 3.65E+18 2.68E-03
2.72E+18 5.84E+18 4.29E-03
3.74E+18 8.03E+ 18 5.90E-03
7.32E+18 1.57E+19 1.16E-02
1.22E+19 2.63E+19 1.93E-02
150
5.04E+17 1.09E+18 7.86E-04
8.68E+17 1.88E+18 1.36E-03
1.79E+ 18 3.89E+18 2.80E-03
2.67E+18 5.77E+ 18 4.16E-03
4.18E+ 18 9.04E+ 18 6.53E-03
5.72E+ 18 1.24E+19 8.93E-03
1.1 1E+19 2.40E+19 1.74E-02
1.85E+19 4.01E+19 2.90E-02
30o1a]
5.OOE+17 1.17E+ 18 7.90E-04
9.04E+17 2.11E+18 1.43E-03
1.77E+18 4.12E+18 2.80E-03
2.65E+18 6.14E+ 18 4.18E-03
4.13E+18 9.57E+ 18 6.52E-03
5.64E+ 18 1.31E+19 8.92E-03
1.10E+19 2.54E+19 1.73E-02
1.83E+19 4.24E1+19 2.89E-02
450
6.01E+17 1.53E+18 9.63E-04
1.09E+18 2.78E+ 18 1.75E-03
2.06E+18 5.24E+18 3.30E-03
3.1 IE+18 7.89E+18 4.98E-03
4.81E+18 1.22E+19 7.71E-03
6.59E+18 1.67E+19 1.06E-02
1.28E+ 19 3.25E+19 2.05E-02
2.14E+19 5.42E+ 19 3.43E-02
Note: a) Maximum neutron exposure projection reported for 30* vessel location representing the octant containing the
15.0' neutron pad span.
Testing of Specimens from Capsule V

6-36
Table 6-13 cont'd Azimuthal Variations Of The Maximum Neutron Exposure Projections
On The Reactor Vessel Clad/Base Metal Interface
Calculated
1.02 EFPY E>1.0 MeV E>0. I MeV
Dpa
2.05 EFPY E>1.0 MeV E>0.1 MeV
Dpa
4.43 EFPY E>1.0 MeV E>0.1 MeV
Dpa
7.08 EFPY E>1.0 MeV E>0. 1 MeV
Dpa
11.49 EFPY E>1.0 MeV E>0. I MeV
Dpa
16 EFPY
E>I.0 MeV E>0.1 MeV
Dpa
32 EFPY
E>1.0 MeV
E>0. I MeV Dpa
54 EFPY
E>1.0 MeV E>0.1 MeV
Dpa
00
3.57E+17 7.53E+17 5.55E-04
6.15E+17
1.30E+18 9.56E-04
1.24E+18 2.61E+18 1.93E-03
1.85E+18 3.89E+18 2.88E-03
2.96E+ 18 6.22E+18 4.60E-03
4.07E+18 8.55E+18 6.33E-03
7.96E+ 18 1.67E+19 1.24E-02
1.33E+19 2.80E+19 2.07E-02
150
5.47E+ 17 1. 16E+ 18
8.42E-04
9.44E+ 17 2.01E+18 1.45E-03
1.95E+18 4.14E+18 3.00E-03
2.90E+18 6.14E+18 4.46E-03
4.54E+18 9.62E+ 18 7.OOE-03
6.11E+18 1.32E+19
9.58E-03
1.20E+19 2.56E+19 1.86E-02
2.01E+19 4.27E+19 3.11 E-02
30°[a]
5.43E+17 1.24E+18
8.47E-04
9.83E+17 2.25E+18 1.53E-03
1.93E+18
4.38E+18 3.01E-03
2.88E+18
6.54E+18 4.48E-03
4.48E+18 1.02E+19
6.99E-03
6.14E+18 1.39E+19 9.57E-03
1.19E+ 19 2.71E+19
1.86E-02
1.99E+19 4.52E+19
3.1OE-02
450
6.54E+ 17 1.63E+18 1.03E-03
1.19E+18 2.96E+18 1.88E-03
2.24E+ 18 5.57E+18 3.54E-03
3.3 8E+ 18 8.40E+ 18 5.34E-03
5.23E+18 1.30E+19 8.26E-03
7.17E+18 1.78E+19 1.13E-02
1.40E+19 3.46E+ 19
2.20E-02
2.33E+19 5.77E+19 3.68E-02
Note: a) Maximum neutron exposure projection reported for 30' vessel location representing the octant containing the
15.00 neutron pad span.
Testing of Specimens from Capsule V

6-37
Table 6-14
Maximum Neutron Exposure Values Within The Diablo Canyon Unit 2 Reactor Vessel
Best Estimate Fluence (n/cm 2) Based on E > 1.0 MeV Slope[a]
00 150 3 0o[b] 4501.02 EFPY
Surface ¼AT %¾T
2.05 EFPY
Surface
34T
4.43 EFPY Surface
"AT 3/T
7.08 EFPY Surface
"AT %¾T
11.49 EFPY Surface
¼4T
%/T
16 EFPY Surface
V4T
/4T
32 EFPY Surface
14 T %¾T
54 EFPY Surface
'AT %¾T
3.29E+17 1.85E+17 4.27E+16
5.66E+17 3.19E+17 7.35E+16
1. 14E+ 18 6.42E+17 1.48E+17
1.70E+18 9.59E+17 2.21E+17
2.72E+18
1.52E+18 3.54E+17
3.74E+ 18 2.1 IE+18 4.86E+17
7.32E+18 4.13E+18 9.52E+17
1.22E+19 6.91E+18 1.59E+18
5.04E+ 17 2.82E+17 6.40E+16
8.68E+17 4.85E+17
1.10E+17
1.79E+18 1.OOE+18 2.28E+17
2.67E+ 18 1.49E+18 3.39E+ 17
4.18E+18 2.34E+18 5.31E+17
5.72E+ 18 3.20E+ 18 7.26E+17
1.11 E+ 19 6.21E+18 1.41E+17
1.85E+19 1.04E+19 2.35E+18
5.OOE+17 2.81E+17
6.50E+16
9.04E+ 17 5.08E+ 17
1.18E+ 17
1.77E+18 9.97E+17 2.31E+17
2.65E+18 1.49E+18 3.44E+ 17
4.13E+18 2.32E+ 18 5.36E+17
5.64E+18 3.17E+ 18 7.34E+17
1.1OE+19
6.16E+18 1.43E+17
1.83E+19 1.03E+19 2.38E+18
6.0IE+17 3.31E+17 7.22E+16
1.09E+18 6.02E+17 1.31E+17
2.06E+18 1.13E+,I18 2.47E+ 17
3.1 IE+18 1.71E+18 3.73E+17
4.81E+18 2.65E+ 18 5.78E+ 17
6.59E+18 3.63E+18 7.91E+17
1.28E+19 7.07E+ 18 1.54E+17
2.14E+19 1.18E+19 2.57E+18
Note: a) The 'AT and ¾T values were determined using the calculational methods described in Section 6.2 and not by the empirical
relation described in Regulatory Guide 1.99, Rev. 2.
b) Maximum neutron exposure projection reported for 30' vessel location representing the octant containing the 15.00 neutron pad span.
Testing of Specimens from Capsule V

6-38
Table 6-14 cont'd
Maximum Neutron Exposure Values Within The Diablo Canyon Unit 2 Reactor Vessel
Best Estimate Fluence (n/cm2 ) Based on dpa Slope[ 00 150 3 0 o[b]
1.02 EFPY Surface
'AT %¾T
2.05 EFPY
Surface ¼4T %¾T
4.43 EFPY Surface
¼/T % T
7.08 EFPY Surface
¼/T ¾/4T
11.49 EFPY Surface
¼/T %¾T
16 EFPY Surface
¼/T %¾T
32 EFPY
Surface 'AT %AT
54 EFPY Surface
¼T % T
3.29E+17 2.10E+17
7.56E+16
5.66E+17 3.61 E+ 17 1.30E+17
1. 14E+18 7.27E+17 2.62E+ 17
1.70E+18 1.08E+18 3.91E+17
2.72E+ 18 1.74E+18 6.26E+ 17
3.74E+ 18
2.39E+18
8.61E+17
7.32E+18 4.67E+ 18 1.68E+18
1.22E+19 7.81E+18 2.82E+ 18
5.04E+17 3.19E+ 17 1.14E+17
8.68E+17 5.51E+17 1.96E+17
1.79E+18 1.14E+18 4.06E+17
2.67E+ 18 1.69E+18 6.02E+ 17
4.18E+ 18 2.65E+18 9.45E+ 17
5.72E+ 18
3.63E+18
1.29E+18
1.IIE+19 7.05E+ 18 2.51E+18
1.85E+19 1.18E+19 4.19E+ 18
5.OOE+17 3.25E+17
1.22E+17
9.04E+ 17
5.89E+ 17 2.22E+ 17
1.77E+18 1.15E+18 4.35E+17
2.65E+18 1.72E+18 6.49E+ 17
4.13E+18 2.69E+18 1.01E+18
5.64E+ 18
3.67E+ 18 1.38E+18
1.1OE+19 7.14E+18 2.69E+ 18
1.83E+19
1. 19E+ 19 4.48E+ 18
a] 450
6.01E+17 3.87E+17 1.38E+17
1.09E+18
7.02E+17 2.50E+17
2.06E+18 1.32E+18 4.72E+17
3.11IE+18 2.OOE+18 7.12E+17
4.81E+18 3.10E+18 1.10E+18
6.59E+18 4.24E+ 18 1.51E+18
1.28E+19
8.25E+ 18 2.94E+ 18
2.14E+19 1.38E+19 4.90E+18
Note: a) The 'AT and 34T values were determined using the calculational methods described in Section 6.2 and not by the empirical
relation described in Regulatory Guide 1.99, Rev. 2. b) Maximum neutron exposure projection reported for 300 vessel location representing the octant containing the 15.00 neutron
pad span.
Testing of Specimens from Capsule V

6-39
Table 6-14 cont'd
Maximum Neutron Exposure Values Within The Diablo Canyon Unit 2 Reactor Vessel
Calculated Fluence (n/cm2 ) Based on E > 1.0 MeV 00 150 3 0o[b]
1.02 EFPY
Surface 1/T %¾T
2.05 EFPY
Surface 1/T %/T
4.43 EFPY Surface ¼AT 3/T
7.08 EFPY Surface ¼AT 3/T
11.49 EFPY Surface ¼AT 3¾T
16 EFPY Surface
¼AT 3/T
32 EFPY Surface ¼AT
%¾T
54 EFPY Surface
¼T 3/T
3.57E+17 2.OIE+17 4.64E+16
6.15E+17 3.47E+17 7.99E+16
1.24E+18 6.98E+17 1.61E+17
1.85E+18 1.04E+18 2.40E+ 17
2.96E+ 18 1.67E+18
3.85E+17
4.07E+ 18 2.29E+ 18 5.29E+ 17
7.96E+ 18
4.49E+ 18 1.04E+18
1.33E+19 7.51E+18 1.73E+18
5.47E+17 3.06E+ 17
6.95E+16
9.44E+17 5.28E+17 1.20E+17
1.95E+18 1.09E+ 18 2.48E+17
2.90E+18 1.62E+18 3.68E+17
4.54E+ 18 2.54E+18 5.77E+17
6.11E+18 3.47E+18 7.89E+ 17
1.20E+19
6.75E+18 1.54E+18
2.01E+19 1.13E+19 2.56E+18
5.43E+ 17 3.05E+ 17 7.06E+16
9.83E+17 5.53E+17 1.28E+ 17
1.93E+18 1.08E+ 18 2.51E+17
2.88E+ 18 1.62E+ 18 3.74E+ 17
4.48E+18 2.52E+18 5.83E+17
6.14E+ 18 3.45E+18 7.97E+ 17
1.19E+19 6.70E+ 18 1.55E+18
1.99E+19 1.12E+ 19 2.58E+18
Slope[a] 450
6.54E+ 17 3.60E+ 17 7.84E+ 16
1.19E+18 6.54E+17 1.42E+ 17
2.24E+ 18 1.23E+ 18 2.69E+ 17
3.38E+18 1.86E+18 4.05E+17
5.23E+18 2.88E+18 6.28E+ 17
7.17E+18 3.95E+18 8.60E+ 17
1.40E+19 7.68E+18 1.67E+18
2.33E+19 1.28E+19 2.79E+18
Note: a) The '/T and ¾T values were determined using the calculational methods described in Section 6.2 and not by the empirical
relation described in Regulatory Guide 1.99, Rev. 2.
b) Maximum neutron exposure projection reported for 300 vessel location representing the octant containing the 15.00 neutron
pad span.
Testing of Specimens from Capsule V

6-40
Table 6-14 cont'd
Maximum Neutron Exposure Values Within The Diablo Canyon Unit 2 Reactor Vessel
Calculated Fluence (n/cm2 ) Based on dpa Slope[a]
1.02 EFPY Surface
'AT 3/T
2.05 EFPY Surface
¼T 34T
4.43 EFPY Surface
¼AT ¾/T
7.08 EFPY Surface
¼T 3/T
11.49 EFPY Surface
'AT 1/T
16 EFPY Surface
'AT 3¾T
32 EFPY
Surface 'AT 3/4T
54 EFPY Surface
¼AT %¾T
O0
3.57E+17 2.28E+ 17
8.22E+ 16
6.15E+17 3.92E+17 1.41E+17
1.24E+18 7.90E+ 17 2.85E+17
1.85E+18 1.18E+18 4.25E+17
2.96E+18 1.89E+18 6.80E+17
4.07E+18
2.59E+18 9.35E+17
7.96E+18
5.08E+ 18 1.83E+18
1.33E+19 8.49E+ 18 3.06E+18
150
5.47E+17 3.47E+17
1.24E+17
9.44E+ 17 5.98E+ 17 2.13E+17
1.95E+ 18 1.24E+ 18 4.41E+17
2.90E+18 1.84E+ 18 6.55E+17
4.54E+l 8
2.88E+ 18 1.03E+ 18
6.IIE+18 3.94E+ 18
1.40E+18
1.20E+19
7.66E+18 2.73E+18
2.01E+19 1.28E+19 4.55E+18
3 0o[b]
5.43E+17 3.54E+17
1.33E+17
9.83E+17 6.40E+ 17 2.41E+17
1.93E+18 1.26E+18 4.72E+ 17
2.88E+18 1.87E+18
7.05E+17
4.48E+18 2.92E+ 18 1.1OE+18
6.14E+18 3.99E+18 1.50E+18
1.19E+19 7.76E+ 18
2.92E+18
1.99E+ 19 1.29E+19 4.87E+18
450
6.54E+17 4.20E+17
1.50E+l 7
1.19E+ 18 7.63E+ 17 2.72E+ 17
2.24E+ 18 1.44E+18 5.13E+17
3.38E+18 2.17E+ 18
7.73E+17
5.23E+18 3.36E+18 1.20E+18
7.17E+18
4.61E+18 1.64E+18
1.40E+19
8.97E+18 3.19E+1 8
2.33E+19 1.50E+19 5.33E+18
Note: a) The ¼T and 3AT values were determined using the calculational methods described in Section 6.2 and not by the empirical
relation described in Regulatory Guide 1.99, Rev. 2.
b) Maximum neutron exposure projection reported for 300 vessel location representing the octant containing the 15.00 neutron pad span.
Testing of Specimens from Capsule V

6-41
Table 6-15
Updated Lead Factors For Diablo Canyon Unit 2
Surveillance Capsules
Capsule Lead Factor
U[a] 5.15
X[b] 5.40
W[d] 5.26
V[di 4.58
y[c] 4.58
Z[d] 5.26
[a] - Withdrawn at the end of Cycle 1.
[hi - Withdrawn at the end of Cycle 3.
[c] - Withdrawn at the end of Cycle 6.
[d] - Withdrawn at the end of Cycle 9.
The surveillance capsule lead factor is defined by:
(DSurveillance Capsule Calculated
(DClad I Base Metal Interface Axial Peak Calculated
where (D is the neutron fluence (E > 1.0 MeV) at the time of the capsule withdrawal.
Testing of Specimens from Capsule V

7-1
7 SURVEILLANCE CAPSULE REMOVAL SCHEDULE
The following surveillance capsule removal schedule meets the requirements of ASTM El 85-82 and is
recommended for future capsules to be removed from the Diablo Canyon Unit 2 reactor vessel. This
recommended removal schedule is applicable to 32 EFPY of operation.
Table 7-1 Diablo Canyon Unit 2 Reactor Vessel Surveillance Capsule Withdrawal Schedule
Removal Time Fluence
Capsule Location Lead Factor(a) (EFPY)() (nlcm2,E>1.0 MeV)(')
U 56.00 5.15 1.02 3.38 x 10¹⁸ (c)
X 236.00 5.40 3.16 9.19 x 10¹⁸ (c)
Y 238.50 4.58 7.08 1.55 x 10¹⁹ (c)
V 58.50 4.58 11.49 2.41 x 10¹⁹ (c,d)
W(e) 124.00 5.26 11.49
Z(e) 304.00 5.26 11.49
Notes: (a) Updated in Capsule V dosimetry analysis, See Tables 6-12 and 6-16.
(b) Effective Full Power Years (EFPY) from plant startup.
(c) Plant specific evaluation.
(d) This fluence is not less than once or greater than twice the peak EOL fluence, and is approximately
equal to the peak vessel fluence at 54 EFPY.
(e) Surveillance capsules W and Z were removed and placed in storage during the 2R9 outage
(11.49 EFPY).
Testing of Specimens from Capsule V

8-1
8 REFERENCES
1. Regulatory Guide 1.99, Revision 2, Radiation Embrittlement of Reactor Vessel Materials,
U.S. Nuclear Regulatory Commission, May, 1988.
2. Code of Federal Regulations, 1OCFR50, Appendix G, Fracture Toughness Requirements, and
Appendix H, Reactor Vessel Material Surveillance Program Requirements, U.S. Nuclear Regulatory
Commission, Washington, D.C.
3. WCAP-8783, Pacific Gas and Electric Company Diablo Canyon Unit No. 2 Reactor Vessel
Radiation Surveillance Program, J. A. Davidson and S. E. Yanichko, December, 1976.
4. WCAP- 11851, Analysis of Capsule Ufrom the Pacific Gas and Electric Company Diablo Canyon
Unit 2 Reactor Vessel Radiation Surveillance Program, S. E. Yanichko, S. L. Anderson and L.
Albertin, May, 1988.
5. WCAP- 12811, Analysis of Capsule Xfrom the Pacific Gas and Electric Company Diablo Canyon
Unit 2 Reactor Vessel Radiation Surveillance Program, E. Terek, S. L. Anderson and L. Albertin,
December, 1990.
6. WCAP-14363, Analysis of Capsule Yfrom the Pacific Gas and Electric Company Diablo Canyon
Unit 2 Reactor Vessel Radiation Surveillance Program, P. A. Peter, S. L. Anderson and J. F.
Williams, August, 1995.
7. Section XI of the ASME Boiler and Pressure Vessel Code, Appendix G, Fracture Toughness Criteria
for Protection Against Failure.
8. ASTM E208, Standard Test Method for Conducting Drop-Weight Test to Determine Nil-Ductility
Transition Temperature of Ferritic Steels, in ASTM Standards, Section 3, American Society for
Testing and Materials, Philadelphia, PA.
9. ASTM E 185-82, Standard Practice for Conducting Surveillance Tests for Light-Water Cooled
Nuclear Pow'er Reactor Vessels, E706 (IF), in ASTM Standards, Section 3, American Society for
Testing and Materials, Philadelphia, PA, 1993.
10. ASTM E23-93a, Standard Test Methods for Notched Bar Impact Testing of Metallic Materials, in
ASTM Standards, Section 3, American Society for Testing and Materials, Philadelphia, PA, 1993.
11. ASTM A3 70-92, Standard Test Methods and Definitions for Mechanical Testing of Steel Products, in
ASTM Standards, Section 3, American Society for Testing and Materials, Philadelphia, PA, 1993.
12. ASTM E8-93, Standard Test Methods for Tension Testing of Metallic Materials, in ASTM Standards,
Section 3, American Society for Testing and Materials, Philadelphia, PA, 1993.
References

8-2
13. ASTM E21-92, Standard Test Methods for Elevated Temperature Tension Tests of Metallic Materials, in ASTM Standards, Section 3, American Society for Testing and Materials, Philadelphia, PA, 1993.
14. ASTM E83-93, Standard Practice for Verification and Classification of Extensometers, in ASTM Standards, Section 3, American Society for Testing and Materials, Philadelphia, PA, 1993.
15. RSICC Computer Code Collection CCC-650, DOORS 3.1, One, Two- and Three-Dimensional Discrete Ordinates Neutron/Photon Transport Code System, August 1996.
16. RSIC Data Library Collection DLC-185, BUGLE-96, Coupled 47 Neutron, 20 Gamma-Ray Group Cross Section Library Derivedfrom ENDF/B-Vl for LWR Shielding and Pressure Vessel Dosimetry Applications, March 1996.
17. E. Maerker, et al., Accounting for Changing Source Distributions in Light Water Reactor Surveillance Dosimetry Analysis, Nuclear Science and Engineering, Volume 94, Pages 291-308, 1986.
18. The Nuclear Design and Core Physics Characteristics of the Diablo Canyon Power Plant Unit 2 Cycle 1, WCAP-10593, July 1984. [W Proprietary Class 2]
19. The Nuclear Design and Core Physics Characteristics of the Diablo Canyon Power Plant Unit 2 Cycle 2, WCAP- 11450, May 1987. [W Proprietary Class 2]
20. The Nuclear Design and Core Physics Characteristics of the Diablo Canyon Power Plant Unit 2, Cycle 3, WCAP- 11962, October 1988. [W Proprietary Class 2]
21. The Nuclear Design and Core Physics Characteristics of the Diablo Canyon Power Plant Unit 2, Cycle 4, WCAP-12492, February 1990. L Proprietary Class 2]
22. The Nuclear Design and Core Physics Characteristics of the Diablo Canyon Power Plant Unit 2, Cycle 5, WCAP-13050, August 1991. [W Proprietary Class 2]
23. The Nuclear Design and Core Physics Characteristics of the Diablo Canyon Power Plant Unit 2 Cycle 6, WCAP-13623, February 1992. [W Proprietary Class 2]
24. The Nuclear Design and Core Physics Characteristics of the Diablo Canyon Power Plant Unit 2 Cycle 7, WCAP-14120-RO, September 1994. [W Proprietary Class 2C]
25. The Nuclear Design and Core Physics Characteristics of the Diablo Canyon Unit 2 Cycle 8, WCAP-14594-R1, April 1996. [W Proprietary Class 2C]
26. The Nuclear Design and Core Physics Characteristics of the Diablo Canyon Unit 2 Cycle 9, WCAP- 14998-RO, January 1998. [W Proprietary Class 2C]
References

8-3
27. ASTM Designation E482-89 (Re-approved 1996), Standard Guide for Application of Neutron Transport Methods for Reactor Vessel Surveillance, in ASTM Standards, Section 12, American Society for Testing and Materials, Philadelphia, PA, 1999.
28. ASTM Designation E560-84 (Re-approved 1996), Standard Recommended Practice for Extrapolating Reactor Vessel Surveillance Dosimetry Results, in ASTM Standards, Section 12, American Society for Testing and Materials, Philadelphia, PA, 1999.
29. ASTM Designation E693-94, Standard Practice for Characterizing Neutron Exposures in Iron and Low Alloy Steels in Terms of Displacements per Atom (dpa), in ASTM Standards, Section 12, American Society for Testing and Materials, Philadelphia, PA, 1999.
30. ASTM Designation E706-87 (Re-approved 1994), Standard Master Matrix for Light-Water Reactor Pressure Vessel Surveillance Standard, in ASTM Standards, Section 12, American Society for Testing and Materials, Philadelphia, PA, 1999.
31. ASTM Designation E853-87 (Re-approved 1995), Standard Practicefor Analysis and Interpretation of Light-Water Reactor Surveillance Results, in ASTM Standards, Section 12, American Society for Testing and Materials, Philadelphia, PA, 1999.
32. ASTM Designation E261-98, Standard Practice for Determining Neutron Fluence Rate, Fluence, and Spectra by Radioactivation Techniques, in ASTM Standards, Section 12, American Society for Testing and Materials, Philadelphia, PA, 1997.
33. ASTM Designation E262-97, Standard Method for Determining Thermal Neutron Reaction and Fluence Rates by Radioactivation Techniques, in ASTM Standards, Section 12, American Society for
Testing and Materials, Philadelphia, PA, 1999.
34. ASTM Designation E263-93, Standard Methodfor Measuring Fast-Neutron Reaction Rates by
Radioactivation of Iron, in ASTM Standards, Section 12, American Society for Testing and Materials, Philadelphia, PA, 1999.
35. ASTM Designation E264-92 (Re-approved 1996), Standard Method for Measuring Fast-Neutron Reaction Rates by Radioactivation of Nickel, in ASTM Standards, Section 12, American Society for Testing and Materials, Philadelphia, PA, 1999.
36. ASTM Designation E481-97, Standard Method for Measuring Neutron-Fluence Rate by Radioactivation of Cobalt and Silver, in ASTM Standards, Section 12, American Society for Testing and Materials, Philadelphia, PA, 1999.
37. ASTM Designation E523-92 (Re-approved 1996), Standard Test Method for Measuring Fast-Neutron Reaction Rates by Radioactivation of Copper, in ASTM Standards, Section 12, American Society for Testing and Materials, Philadelphia, PA, 1999.
References

8-4
38. ASTM Designation E704-96, Standard Test Method for Measuring Reaction Rates by Radioactivation of Uranium-238, in ASTM Standards, Section 12, American Society for Testing and Materials, Philadelphia, PA, 1999.
39. ASTM Designation E705-96, Standard Test Method for Measuring Reaction Rates by Radioactivation ofNeptunium-237, in ASTM Standards, Section 12, American Society for Testing and Materials, Philadelphia, PA, 1999.
40. ASTM Designation El 005-97, Standard Test Methodfor Application and Analysis of Radiometric Monitors for Reactor Vessel Surveillance, in ASTM Standards, Section 12, American Society for Testing and Materials, Philadelphia, PA, 1999.
41. A. Schmittroth, FERRET Data Analysis Core, HEDL-TME 79-40, Hanford Engineering Development Laboratory, Richland, WA, September 1979.
42. N. McElroy, S. Berg and T. Crocket, A Computer-Automated Iterative Method of Neutron Flux
Spectra Determined by FoilActivation, AFWL-TR-7-41, Vol. I-IV, Air Force Weapons Laboratory, Kirkland AFB, NM, July 1967.
43. RSIC Data Library Collection DLC- 178, "SNLRML Recommended Dosimetry Cross-Section Compendium", July 1994.
44. EPRI-NP-2188, Development and Demonstration of an Advanced Methodologyfor LWR Dosimetry Applications, R. E. Maerker, et al., 1981.
45. WCAP- 14370, Use of the Hyperbolic Tangent Function for Fitting Transition Temperature Toughness Data, T. R. Mager, et al, May 1995.
46. Combustion Engineering Inc., Metallurgical Research and Development Dept., Materials
Certification Report, Lukens Steel Copany, Contract No. 6268, Job No. X-96002-004, July 24, 1969.
47. Letter from Mr. J. A. Soltesz (Lukens Steel Company) to Mr. S. E. Yenicko (_W), Dated December 6, 1973.
References

A-0
APPENDIX A
LOAD-TIME RECORDS FOR CHARPY SPECIMEN TESTS
Appendix A

A-1
C¢v 764479-tAF1
.. .tM
tF1lme
WI a Fracture Inlllatlon Region Wp Fracture Propagation Region
toy , Time to General Yielding tM a Time to Maximum Load
IF w Time to Fast (Brittle) Fracture Start
Appendix A
I
I

0
o I I a a I I I I I I I I I I I aa a I a a I I I
I l I I 2I 2 I I I
SI I I I I I j I I I I I I I I I 3
-I-I, I-I, , . I,- . . . I, . . . I . .
I I I I I I
o 0.00 0680 1.20 1.80 2.40 3.00 3.60 4.2.0 4.80 5.40 6.00 Time (msec)
PL17, O*F
o I I I I I I I I I I I I I I II I I I I I I I I
I I I I I I I
II I I I I I I
I I I I I I I I I
c•0.00 0.60 1.20 1.80 2.40 3.00 3.60 4.20 4.80 5.40 6.00 Time (msec)
PL16, 50-F
CD q
CD
I Ila iI I I I III I I I I I
r" -- - - - - - - --- r - -r -- --r. - --r.--- r - -
aaI I I I I I II I I I I
I I I I I I I a I I I I£ I I I I
I I I I ! I I I I
I I I I I I I I
o I I I I I I a
0• 0.00 0.60 1.20 1.80 2.40 3.00 3.60 4.20 4.80 5.40 6.00 Time (msec)
--- ---- -- ----
0a
- - - - - - - - - - -
0.0 06 120 18 2.4 3.0 3.6 420 4.8 5.0 0 * I I T im (msI I
PL20, 100F
A-2

PL18, 125"F
PL25, 130°F
A-3
0 C3 6
*0
P130, 115*F
C) I I I o• I I I I I I I I o0 I I I I I I I I C3
r.. . ..-rr.- ----rrr- ----r -- -- r . .. . .... . . .. . . ..r- -
I I I I I I
I I I I I I I I I I I I
- II I I I I I
I I I I I i I
---0 0 .60 . ...... . 80 2.4 .. .. . . 00 3". . 60 4". . 20 4.8 . .. . 40 6.0
I T I I I 2 I I I I I iI I
I I I I I . . . . . . I . . .
----- - - - - - - - - - - - - - - - - - - - --1 ....
0II I I I I • I I I I I
o 0.00 0.60 1.20 1 .80 2.40 3.00 3.80 4.20 4,80 5.40 6.00
Time (msec)
CD q 0D
CD CD co
O 0.00 0.60 120 1.80 2.40 3.00 3.60 420 4.80 5.40 Time (msec)
aIJl

PL19, 140°F
CD
o
(D l I I I I I I I I
0 1 i I i i i i I I
.Ii I i i l i i i r ----.. ---- ..... -- ..... -- r - - rr -- - - - r - - -r - -
--- I-- I.----I . -- I - - I-- -*II I I I I I I I
I I I I I I I I I I I I I I I I I
-I Il I I I I I I I I I I I I i I I_ _ I I I I I I I I
I I I I I I I I I
II I I I I I I I
.14 I I I I I I I I oI (\. I I I I I I I
L'-----L -1-•--- L -----
0.00 0.60 1.20 1.80 2.40 3.00 3.60 4.20 4.80 5.40 6.00 Time (msec)
PL24, 150*F
PL29, 175"F
A-4
0 C3 D
C)
00.00 0.60 120 1.80 2.40 3.00 3.60 4.20 4.80 5.40 6.00 Time (msec)
CD
CD CD3
I IlII
-- -I - I - I - I - I - I ----I I I I I I I I I
II I I I I I II
I I I I I I I I
I I I I I I I I I 4 I I I I I I I I
0 0.00 0.60 1.20 1.80 2.40 3.00 3.60 420 4.80 5.40 6.00 Time (msec)

PL28, 200°F
C3 C I I I I I I I I a
-3 I$ I I I I a I a
I I i I I a a r ---- -r ----- r -- - r .. ... r --- --r - - -r -----r -- - r - -
ca 4 /I I I II I I aI
aI a I I a I aa
a I I a I SI I I I a I I SI I I I a a a a a . . .
- - - - --r ....------ r r --- -- r ----- -r ----- r ----- r ..... -----•--• - - - - - -- - - - -I I a a a I I
II I I I I I I
o 0.00 0.60 1.20 1.80 2.40 3.00 3.60 4.20 4.60 5.40 6.00
Time (msec)
PL27, 215-F
PL22, 225-F
A-5
CD oI I I a a a a a
I I I I a a a I a I a I a a I a a r.. . r -. . - -. . - -. . r . . r -. . - -. . - -. . r r - - - - -
13 I I a a a I
I a I I I I I II a a a I a
---a ---a--a--.------a- - a- --
S-- I I a a a a a
I I I I I I I I I I I a I a aI
I 4 I I aI a I I I I a I I I I a I
I I I I I I
•r ----- r r- -, '- ---
o 0.00 0.60 1.20 1.80 2.40 3.00 3.60 4.20 4.80 5.40 6.00
Trie (msec)
03
0-
3 0.00 0.60 120 1.80 2.40 3.00 3.60 4.20 4.80 5.40 6.00
Time (msec)

PL23, 250F
PL21, 300°F
PL26, 350-F
A-6
CDP 0 o I I I I I I I
OI I I I I I I
I I I I I I I
I -I
I I I I I I
L . .. . . . .. . . ' - - - -- -- -
0.00 0.60 1 .20 1 .80 2.40 3.00 3.60 4.20 4.80 5.40 6.00 Time (msec)
CD
q
Q
C3
0o C3
0
o,
CD q 0 CD
0
0
0 0.00 0.60 120 1.80 2.40 3.00 3.60 4.20 4.80 5.40 Tune (msec)

PT23, 25-F
CD
r -----.. r . .. r ----r r. . ---- I - - -- -
3 0.0 0.0 12 18 2.4 3.0 3.6 4i 4.8 SA 0
.0 a a a a a a a a a
---- a.-a"... ..-. r- a.- a a---"...f ... i ... -a.... -----
Time (msec)
PT28, 72"F
33 r ----- r a I ..... r aa a
I I I I I I
o0.00 0.60 1.20 1.60 2.40 3.00 3.60 4.20 4.60 5.40 6.00 Time (msec)
PT28, 100,F 0III
0
0
I a a a a a a a a O I a a a a a a a a
a. . a". . . a . . a . . a". . . a". . . a . . a . . a . . . . aI a a a a a a a I
I a a a a a a I I 3 a a a a a a a a - a- a. . a". . . a". . . a . . a . . a . . a- a . .
---a - a. - - - a. a- - a - a- - - - a. a a a a a a a I a a' aL _ a a a a a a a a aaa
a: .0 06 a.2 a.6 a.4 a.0 a. a 4.8 a.0 60 a a aTi a a aca)
C..) a aPa1a , a1a0aF
A-7
-3 -
C3
i
o• a a a I a a a I
iI I I I I I I I I
I I I I I I I a
0.0 I I I I I I 4
ITI I I I 3 I I 3 --- . ... . . .. aT... . a . .. r... . . .. a. -.. . - a...r . -. . I a I a a I a I I I a I a a I a a I
0I a a a a I a a a -- -- a. . a". . . I" . . . " . . . a . . a . . a . . a". . . I- . . .
a a a i I I a a I I. a a I I a a a
o 0.00 0.60 1 .20 1.60 2.40 3.00 3.60 4.20 4.60 5.40 6.00 rmie (msec)

It C C
U
C
C
U
CD
CD .
33I I I I I I I I I
I I I I I I I I I
r ---- r --*II I I I I I I I
I I I I I I I I I I *I I I I I I I I
* I j l i I i I i i I i
*II I I I I I I I
III I I I I I I I I I I I I I I I
.I I I I I I I I
I I I I I I I I
I I I I I I I I r .. . . - -.. . . r - . .- - . . . . .- - r . . .r -. . . . . r -.. . . . r r.. . . -. . . . .
oI I I I I I I I CD
C 0.01 0.60 120 1.80 2.40 3.00 3.60 420 4.80 SAO 6.00
Trme (msec)
PT21,115-F
PT26, 1250
F
o I I I I I I I I I C3 I I I I I I I I I
I I I I I I I I I r - --- r ---- -r ...... r- - r - - -r ----- r -- -
I I I I I I I I I
7.II I I I I I I I
-------- I-------.- --- 1-- -.
- ' I I I I I I I I I
II I I I I I I I I
II I I 3 I I I I
III I I I I I I I I I I II -4----- r r----- r----- r---r---r---r-----------
0• _ _ _ = . . _ _ _ _ , _ A_• _ _ • _ _
0 0.00 0.60 1.20 1.80 2.40 3.00 3.60 420 4.80 5.40 6.00 Time (msec)
PT20, 150 0F
A-8
CD
CD
CD
.0
*0 a 0
C-,
0 0
0.60 1.20 1.80 2.40 3.00 3.60 4.20 4.80 5.40 6.00 Time (msec)

CD
0 -- -r -
-- - - - - - - - - - --. ; - - - - - -r - - - - -r - - - - -r r - - - - - - -- - r
0I 0 1 1 2 3 I T 0I I
S' a a ' a a ' af a i a a a a a a
I I a a a a a a a I I I I a a a I Ia
I a a a a I a a
Ia a a I I a a
C..), , ai , a a a ai m
a a a 16, 17a5a
PT25, 200°F
P
O0
A - - - -I -- - - I.. -- - -- - -1 - - - - -
r r -- - - --r - - r - --r -----r - -- - - - -r - -
o0.00 0.60 1.20 1,80 2.40 3.00 3.60 4.20 4.80 5.40 6.00 Time (msec)
PT29, 205°F
A-9
CDI tI I 0:) CD
3•1 a. a a a a a a a r1 ----- ar-a--a- a- - a- - a- - a- - a-------
S~4 L -- - - - -- - --- - -r- r. . -- - r. . ---.. -- ..... .... r --- -- r- -C ) a a a a a a I
ol 0.00 0.60 1.20 1.80 2.40 3.00 3.60 4.20 4.80 5.40 6.00 Time (msec)

PT22, 215°F
PT24, 225°F
PTI8, 275-F
A-10
0 C. o II I I I I I I
I I I I I I I I IO I I I I I I I I
I I I I I I i I - ----- r ---. . r -----...-----
II I I I I I £ I
II I I i I I I i
IIII I I I I I
----------I- -------- - -- ----
lII I I I I
-c. . . . .I . . .I". . .I=. . .r -..... i-...... IIIiIi I I I
I I II i
---- ---- ---- -------
I) II-I •-. I _ I I l , I SI I I I I I = I : I------ r---r---r---- r----- I----- I----- I-----
o 0.00 0.60 1.20 1.80 2.40 3.00 3.60 4.20 4.80 5.40 6.01 Time (msec)
CD CD
ED
0 0.00 0.60 1.20 1.80 2.40 3.00 3.60 4.20 4.80 5.40 6.00 Time (msec)
CD q
CD C=)
co
M
V I I ; 0.00 0.60 1.20 1.80 2.40 3.00 3.60 4.20 4.80 5.40 6.00
Time (msec)

PT27, 2850F
PT17, 325°F
PT27, 350°F
A-1I
II I I I I III
I II I I I I
I III I I .. . . . . . . .I . . .
~~r -.. . . . r -. . --.. . . . . . . --.. . -
CD 0.00 0.60 1.20 1,80 2.40 3.00 3.60 4.20 4.80 5.40 6.00 Time (insec)
CD
C)
0a
to
S0O.00 0.60 120 1.80 2.40 3.00 3.60 420 4.80 5.40 6.00
"Time (msec)
C)
r . . .. .. . r - - - - - r - - - - -r --- -- r -- -- -r - -- - - r - - - --. ... .. ..
o0.00 0.60 1.20 1.80 2.40 3.00 3.60 4.20 4.80 5.40 6.00 Time (msec)

PW24, 72-F
0I
CD
! I
a IIaI IIIIIII I
S- - -.. . - -- r . - .- - --... -r- r -....
CD 0.00 0.60 1.20 1.80 2.40 3.00 3.60 4.20 4.80 5.40 6.00 Time (rnsec)
PW20, 125°F
PW29, 175-F
A-12
C3 o I I I I I I I I I
I I I I a I I I a I a I I I I I
Sr r ----- r ----- r ----- r - --r- ---I a a a I I I I I
a I I a I I a a a
0 3
r .. . . . . . . . . . . . . . . . . . . . . . . . . r - -C -- I- I- - a
0 I I I I a I
a I a I I a a (.. ) ap I a a a a I I
0 0.00 0.60 1.20 1.80 2.40 3.00 3.60 420 4.80 5.40 6.00 Time (msec)
(I a a a 3 I a aI CD
aI I I I I I a ~~~~~~r .. . . - -. . - -.. . . . . . r r . . .
I I I I I a I I a I I a I a a a a aI
0I a ai I iI
r' -.. .- -. . ---r -. . -" -. . -" -. . -" -. . -" -.. . .- -- - --
I a I 3 I I
I a aI I I a I I aI a a a a a
a I I I aaa
S 4 a a '
0 0.00 0.60 120 1.80 2.40 3.00 3.60 420 4.80 5.40 6.00 Time (msec)

PW28, 185°F
PW16, 200°F
PW25, 205°F
A-13
C)
Cý C) CD
co
CD - - - '. -- " c0 0.00 0.60 1.20 1.80 2.40 3.00 3.60 420 4.80 5.40 6.00
Time (msec)
a I I a a a a I I I I I I I I I I I ! I I a I I I I I a I a I I I
I l I a I I I I 3 I I I I I I I I
II I 1 ! I I I
I I I I I I I a I I I I I I I a I a a a I a I I a I
I I I I I I I U I I I I I a I I a a I I I I I I I a . . .
I I I a a I I I
4 I I a a a I I a a SI I a a I I I a
CD
cm CD co
�0 0 0
C-)
0
0.00 0.50 1.20 1.80 2.40 3.00 3.60 4.20 4.80 540 6.00 Time (msec)
ca a a i I a a CD a i a IIa
I I I I I I iaa
L----I -I- I---L ----- LI.-- -- I
a Ii I I
r - - - -r ----- r -----...... -r ----- r ----- r -----....... -
O a i I al a3 a I a ! I a
Saa I aI I a I
C- a a I a a 4 I aI a a a l
a a a a I a a.. . . .
aI I Ia
o I I -l-I I I
o 0.00 0.60 120 1.80 2.40 3.00 3.60 4.20 4.80 5.40 6.00 Time (msec)
il

PW22, 215°F
PW27, 225°F
PW17, 240-F
A-14
CD q
0 co (•I i I I I I I I I
SI I I I I I I I I I I I I I I I I I
S. r , ,------- -----I! I IIIII I I I I I I I
o I I I I I I I I
I I I I I I I
II I I I I I II
II I I I I I II
0 IIII I I 0*II I I
C 0.00 0.60 1.20 1.80 2.40 3.00 3.60 4.20 4.80 5.40 6.00 The (msec)
o
0
I3 I I I I I I I I I I I I I
3I I I I I I II I I I I I I
r ---- r------r . .-- - - -
I I I I I I
I I I I I I I
I I I I I I I
L' - - - - - - - - - - - - - - - --.. .L . . .L . . . . . . L - - - - - L - - - - - L - -
o II I I I II Sr - r - --- -- r -----
0 0.00 0.60 1.20 1.80 2.40 3.00 3.60 4.20 4.80 5.40 6.00 Tine (msec)
CD
CDl o• I I I II I I I
(.D IIII I I I I I
r - -- - -r -. . . - -. . - - -r -.. . . .. . . . r r- - - - -r - - - - -:3 I I I I II I I S I I I I I
S . -- . . . I- . . I- . . . I- . . I.. . I,- . . . . . . I= . . I,- . . . 3
0. --- 5--------- --- 5-- - 5 - ---
-,P I III
o 0.00 0.60 1.20 1.80 2.40 3.00 3.60 4.20 4.80 5.40 6.00 Time (ms.ec)

PW19, 250°F
PW30, 255-F
PW21, 2750F
A-15
oI a a a I I I I I I I I I I I I I I I I I I I I I
SI I a I I I I
3 I a I I a I
3•- i , I I I I I I a SI I a a I I I I I
----------- L---L--I- a-- -- --L-- -- ---L-------I4 a a I a a I I
S.. .• . . . . .r - - - - - r - - - - - r" - - - - - r - - - - - r" - - - - - r - - - - - r - - - - -UI a a a a a I I
a a a a a a I I I a a a a I I I
0.00 0.60 1.20 1.80 2.40 3.00 3.60 420 4.80 5.40 6.00 Tie (rmsec)
O I I a I I I a a
--------------------------------------- ------ ------ -----3a a a aaa S- ----r -- ---r -----r -----r -----r ----. r
a a a a a a a I I
D a a a a a , , 0 0 . . a. a.40 a_ a.60 a. a.80 SA 6.00
I a a a a a ( M ----------------------------------------------
I- III I I I I
o• 0.00 0.60 1 .20 1.80 2.40 3.00 3.60 4.20 4.80 5.40 6.00
Time (mse)
CD q
----------------------------------------.. ..-, . . ---,----' .... . ---------
3 I a a a a aI
aCa --a- a a- - --a-----------------a- - a --- a- - a-- -- -
3 a 0 0 a a a a A T 'msea,
C . . . . a.. .. . . . . . . . . . . . . . .a. aaa a. . II a a a I I
I a a a a I I a a aI a a a a a a
------------------------------------------
0o 0.00 0.60 1 20 1.80 2.40 3.00 3.60 4.20 4.80 6.40 6.00

a a I I I a
r - - r --- - - r - -- r - -- r - --r ---- -r --- --r - --r - -
r --- ----.. -... . ---- ..... - -- . .. . . ---. . . r- -.. ... -- r. . -- -- r-- - - -
CDI I I 1 2 3 3
.. ..- ..... - "-.....---. .r - - r - -r - -r - - -- - ------ r- ------
I --- - - - -- - - - -
I a a I I a a a a a a a I I I a a a
S- . . . . r . . . . .i - . . . a . . r . . a-. . . I I I II I I a a a
a I a I I a a * I I I I I a a
C 0.00 0.60 1.20 1.80 2.40 3.00 3.60 4.20 4.80 5.40 6.00 Time (msec)
PW26, 295F
O I a a I I a I
a i a a i ai
--- a- ---a-, - --- a• - - a- - a - a.. a-.. ----....
a a i a a a I
a i a a I a a a a a I a a
0 0.00 0.60 1.20 1.80 2.40 3.00 3.60 4.20 4.80 5.40 6.00 Time (msec)
PW23, 325°F
PW18, 4000 F
A-16
CD
C:D 0*
c• 0.00 0.60 1.20 1.80 2.40 3.00 3.60 420 4.80 5.40 6.00 Time (msec)

PH25, -50-F
CD C) O I I I I I lII
I I I I I I I I II I aII
"--- - - -- -- ---r . . .r -----. . . ...- r ----- r ---- -r - --r - - -r - -II I I I I I I I
- --------------------.-----------
* I I I -I I I I I a I I I I I I oI I I I I I I I -I I I I I I I I I
I I I . I I a I Ia
I I I I I I I I I
I I I I I a I I
I a I I a I a I I
I I I I I I a I I
I I a I I I I I I
o 0.00 0.60 1.20 1.80 2.40 3.00 3.60 4.20 4.80 5.40 6.00 Time (msec)
PH22, 0-F
CD O a a a I I II
£0a a
------------------------------ r -------------- -r -- r - - r . .r ------
as
! , , 9, O '
I I A a a aa I I1 I a
i I a ! a I I I I a a I I I
I a I a I I I
I I a a I I I. I a a I I
a a a a I a a a
4 i i i i i a a a a
I I 0 0.00 0.60 1.2.0 1 .60 2.40 3.00 3,60 4.20 4.80 5.40 6.00
Time (ms~ec)
PH129, O*F
A-17
o ] a a a I a a a SI I I I I I II I I SI II I I I I I I I
I I I I/I ! I I r - -. . . . - -. . - -. . r . . r . . . r -. . ---- -r I I I I I I I I I
I I I I I I I I I I I I I I I I I I 3
o0.00 0.60 1.20 1.80 2.40 3.00 3.60 4.20 4.80 5.40 6.00 Time (mse)

CD 6
O I I I I a I Ia a 8I I a I I a
I I I I I I I
- . r -r - -- r r---------- r ---- --------3 I I I I I a I
-- -- I -. . I - -. . I- -- - - - - ---- -- - ---- I- . . . . . .-- -. .-- -. . . . . - -
0I I a 0 a I
I I I a aa I I I IIaa a I I I
4. I I a
I !
_---..-. . ..- _ ---- -- - -- -- - - - - -- - - r -----r ----- r ----- r ---- -4 1 1
0 0.00 0.60 120 1.80 2.40 3.00 3.60 420 4.80 5.40 6.00 Time (msec)
PH28, 25°F
4:3
0
C.D
- -- - " - - - r - r - - -r - - -
a a i a a a a
13
I aa a!
a a I I I I
- '. - - -, -- r-- . - _ , _ --- - r-. -. . . .
CD 0.00 0.60 1.20 1.80 2.40 3.00 3.60 4.20 4.80 5.40 6.00 Time (msec)
- a aPHa 9a a50°F
a aaa a
q I I- Il V I I I I
0I.0 06 12 1.8 2.4 3.0 3.6 4 4.8 .0 60 I I I T Im ICmsIc
I I IP I 19 I 0F
0 } r , . . rIrr. . .r 0
0IIII
O a a a a a a a a
O a a a a a a a
-. -- a--a--a- -- a---a--a---a--- a --- - a--.---a .0 06 a.2 a,8 a.4 a.0 a. a.2 a. a. 60
0 aTan a a(a aca
PH20, 72"F
A-18

PH17, 90*F
(3 q o:( I a I I I a I I
SI I I I I a a a a a '- I I I ' I "
i~I I I I a
a I I I I I I
a I
-- .tI!4------------- ----------- -.. . . . -- -. . -- --
a I I a a a I
Q a a a a a
r| - - - - -- r r -_ - _ r' - - - -- r - - - - . . . .-
C3 0.00 0.60 1.20 1.80 2.40 3.00 3.60 4.20 4.80 5.40 6.00 Twne (msec)
PH16, 100-F
PH21, 125"F
A-19
CD C. 0
CD
C)
co
0
z-
0 0.00 0.60 120 1.80 2.40 3.00 3.60 4.20 4.80 5.40 6.00 Trhe (msec)
0
0
(33
€O a*aaI a a a a a
O a a a a a
,a aI a a a a
0 0 a0 a a0 a a a
,-- -- a--a-.....,,- - a- -.. .-- - -
aI a a a a a a a a a a a a a a
a a a , a a: - a • a a,_ _ • a -0 06 1.2 1. a.4 a.0 3.6 a.2 a. a.0 6
a aTa a (maseca C-) aa a a aa a

PH24, 150°F
P1'27, 175-F
PH30, 200°F
A-20
CD 0
CD
.0 C-C C 0
C)
.v • 0.00 0.60 1.20 1.80 2.40 3.00 3.60 420 4.80 5.40 6.00 Time (msec)
0 0 0D CD
.0
-U C 0
C-,
o0.00 0.60 1.20 1.80 2.40 3.00 3.60 4.20 4.80 5.40 6.00 Time (msec)

PH23, 250°F
CD q CD M o I I I I I I I I CD I I I I I I I CD
I I I I I I I
I I I I I I I I
II I I I I I
- - - - -- - - - I - - - -I - - - - - -- -
o I I I I I I II I
I _I I I I I II I III I I I I I I
I I I I I I I I I
-- --- . .. . r -. . -. . . - -. . r -. . - -. . -. . . r . . . . . . . . . . . . ..r
SI I I I I I I I
1 0.00 0.60 1.20 1.80 2.40 3.00 3.60 4.20 4.80 5.40 6.00 Time (msec)
PH26, 300-F
CD
SCý== ========================== o0.0 .0 12 .0 24 .0 36 .0 46 .0 60
Cie )sc
PH18, 350°F
A-21
CD q CD CD
Co
0 0.00 0.60 1.20 1.80 2.40 3.00 3.60 4.20 4.80 5.40 6.00
Time (msec)

B-0
APPENDIX B
CHARPY V-NOTCH SHIFT RESULTS FOR EACH CAPSULE PREVIOUS FIT VS. SYMMETRIC
HYPERBOLIC TANGENT CURVE-FITTING METHOD (CVGRAPH VERSION 4.1)
Appendix B

B-1
TABLE B-1 Changes in Average 30 ft-lb Temperatures for Intermediate Shell
Forging B5454-1 (Longitudinal Orientation) Previous Fit vs. CVGRAPH 4.1
Pr~vinh1 P :itU
CVGRAPH 4.1 Fit
Capsule Unirradiated Irradiated AT 30 Unirradiated Irradiated AT3 0
U 50F 70"F 65*F 6.5 0F 71.90F 65.4*F
X 4.6°F 105.7"F 101.1"F 6.5 *F 106.6 0F 100.1OF
Y 4.6 0F 117.6 0F 113.00F 6.5-F 118.1*F 111.6OF
V ...... 6.5°F 129.90F 123.4-F
TABLE B-2
Changes in Average 50 ft-lb Temperatures for Intermediate Shell Forging B5454-1 (Longitudinal Orientation)
Previous Fit vs. CVGRAPH 4.1
Previous Fit CVGRAPH 4.1 Fit
Capsule Unirradiated Irradiated AT 50 Unirradiated CVGRAPH AT50 Fit
U 33°F 117*F 84 0F 32.40F 116.20F 83.8*F
X 33.3 0F 154.6*F 121.40F 32.40F 150.80F 118.4 0F
Y 33.3*F 153.1 *F 119.80F 32.4*F 151.1*F 118.7XF
V ...... 32.4*F 162.3"F 129.9°F
TABLE B-3
Changes in Average 35 mil Lateral Expansion Temperatures for Intermediate Shell
Forging B5454-1 (Longitudinal Orientation) Previous Fit vs. CVGRAPH 4.1
Previous Fit CVGRAPH 4.1 Fit
Capsule Unirradiated Irradiated AT35 Unirradiated Irradiated AT35
U 180F 93"F 75*F 18.1 °F 93.3F 75.2°F
X 18.4 0F 135.6 0F 117.20F 18.1 0F 135.0 0F 116.9 0F
y 18.4 0F 144.1*F 125.7-F 18.1 0F 144.10F 126.0 0F
V . . - - 18.1 *F 166.4"F 148.3"F
Appendix B

B-2
-- TABLE B-4 Changes in Average Energy Absorption at Full Shear for Intermediate Shell
Forging B5454-1 (Longitudinal Orientation) Previous Fit vs. CVGRAPH 4.1
U
Capsule Unirradiated Irradiated AE Unirradiated Irradiated AE
U 144 ft-lb 124 ft-lb -20 ft-lb 132.7 ft-lb 118.3 ft-lb -14.4 ft-lb X 144.7 ft-lb 114.9 ft-lb -29.8 ft-lb 132.7 ft-lb 106.8 ft-lb -25.9 ft-lb Y 144.7 ft-lb 118.1 ft-lb -26.6 ft-lb 132.7 ft-lb 108.5 ft-lb -24.2 ft-lb V ....-- 132.7 ft-lb 101.3 ft-lb -31.4 ft-lb
TABLE B-5 Changes in Average 30 ft-lb Temperatures for Intermediate Shell
Forging B5454-1 (Transverse Orientation) Previous Fit vs. CVGRAPH 4.1
Previous Fit CVGRAPH 4.1 Fit
Capsule Unirradiated Irradiated AT3 0 Unirradiated Irradiated AT3 0
U 26 0F 99*F 73 *F 25.8*F 99.1 *F 73.3*F X 26.6*F 125.5 0F 98.9°F 25.8*F 125.4"F 99.5-F Y 26.6*F 137.3°F 110.7°F 25.8°F 137.4°F 111.6°F V ...... 25.8°F 138.7F 112.9°
TABLE B-6 Changes in Average 50 ft-lb Temperatures for Intermediate Shell
Forging B5454-1 (Transverse Orientation) Previous Fit vs. CVGRAPH 4.1
Previous Fit CVGRAPH 4.1 Fit
Capsule Unirradiated Irradiated AT5 0 Unirradiated Irradiated AT50 U 74°F 147?F 73 ?F 72.80F 146.7°F 73.9?F X 74.6"F 173.1?F 98.5?F 72.8°F 170.6°F 97.8°F Y 74.6?F 185.7°F 111.1IF 72.8"F 184.3?F 115.5°F V - - 72.8°F 187.1 °F 114.3?F
Appendix B
Previous Fit CVGRAPH 4.1 Fit

B-3
-. TABLE B-7 Changes in Average 35 mil Lateral Expansion Temperatures for Intermediate Shell
Forging B5454-1 (Transverse Orientation) Previous Fit vs. CVGRAPH 4.1
Previous FitI'
CVGRAPH 4.1 Fit
Capsule Unirradiated Irradiated AT 3 5 Unirradiated Irradiated AT3 5
U 54"F 116'F 62"F 54.40F 115.6 0F 61.2"F
X 54.4°F 149.1"F 94.7"F 54.4°F 149.2"F 94.8°F
Y 54.4"F 162.2°F 107.7*F 54.4*F 162.2-F 107.8°F
V ...... 54.40F 186.3 OF 131.9-F
TABLE B-8 Changes in Average Energy Absorption at Full Shear for Intermediate Shell
Forging B5454-1 (Transverse Orientation) Previous Fit vs. CVGRAPH 4.1
Previous Fit CVGRAPH 4.1 Fit
Capsule Unirradiated Irradiated AE Unirradiated Irradiated AE
U 95 ft-lb 94 ft-lb -1 ft-lb 91.2 ft-lb 93.5 ft-lb 2.3 ft-lb
X 94.9 ft-lb 85.0 ft-lb -9.9 ft-lb 91.2 ft-lb 80.0 ft-lb -11.2 ft-lb
Y 94.9 ft-lb 88.6 ft-lb -6.3 ft-lb 91.2 ft-lb 85.0 ft-lb -6.2 ft-lb V ...- - 91.2 ft-lb 86.0 ft-lb -5.2 ft-lb
TABLE B-9 Changes in Average 30 ft-lb Temperatures for Surveillance Weld Material
Previous Fit vs. CVGRAPH 4.1
Previous Fit CVGRAPH 4.1 Fit
Capsule Unirradiated Irradiated AT 30 Unirradiated Irradiated AT3 0
U -13'F 160°F 173*F -12.5*F 160.5°F 173.0°F
X -13.6°F 190.6°F 204.2°F -12.5°F 190.7°F 203.2°F
Y -13.6°F 198.9°F 212.5°F -12.5*F 198.9°F 211.4°F
V . -- . -12.5°F 212.0°F 224.5°F
Appendix B

B-4
-- TABLE B- 10 Changes in Average 50 ft-lb Temperatures for Surveillance Weld Material
Previous Fit vs. CVGRAPH 4.1
I
Capsule Unirradiated Irradiated AT 5 0 Unirradiated Irradiated AT 50
U 157F 2147F 199°F 14.6°F 214.07F 199.4°F X 14.9°F 228.7°F 213.8*F 14.67F 228.6°F 214.07F Y 14.9°F 260.9°F 246.07F 14.67F 256.8°F 242.2°F V ...... 14.6-F 242.4-F 227.87F
TABLE B-Il Changes in Average 35 mil Lateral Expansion Temperatures for Surveillance Weld Material
Previous Fit vs. CVGRAPH 4.1
Previous Fit CVGRAPH 4.1 Fit
Capsule Unirradiated Irradiated AT3 5 Unirradiated Irradiated AT3 5
U -1*F 170*F 171 7F -0.7*F 170.5*F 171.27F X -0.77F 212.3*F 213.0°F -0.77F 212.0°F 212.77F Y -0.77F 239.7°F 240.4°F -0.77F 238.2*F 238.97F V .......- 0.77F 239.2°F 239.9°F
TABLE B- 12 Changes in Average Energy Absorption at Full Shear for Surveillance Weld Material
Previous Fit vs. CVGRAPH 4.1
Previous Fit CVGRAPH 4.1 Fit
Capsule Unirradiated Irradiated AE Unirradiated Irradiated AE
U 121 ft-lb 85 ft-lb -36 ft-lb 118.3 ft-lb 82.0 ft-lb -36.3 ft-lb X 120.9 ft-lb 74.4 ft-lb -46.5 ft-lb 118.3 ft-lb 73.2 ft-lb -45.1 ft-lb Y 120.9 ft-lb 77.3 ft-lb -43.6 ft-lb 118.3 ft-lb 71.0 ft-lb -47.3 ft-lb V ...... 118.3 ft-lb 71.0 ft-lb -47.3 ft-lb
Appendix B
Previous Fit CVGRAPH 4.1 Fit

B-5
-- TABLE B- 13 Changes in Average 30 ft-lb Temperatures for the Weld Heat-Affected-Zone Material
Previous Fit vs. CVGRAPH 4.1
U
Capsule Unirradiated Irradiated AT 3 0 Unirradiated Irradiated AT3 0
U * 7 * -227.4 7.0 234.4 X -226.0 26.1 252.1 -227.4 26.1 253.5 Y -227.4 27.9 255.3 -227.4 30.3 257.7 V I 1... -227.4 64.1 291.5
• Not given in analysis of record.
TABLE B- 14 Changes in Average 50 ft-lb Temperatures for the Weld Heat-Affected-Zone Material
Previous Fit vs. CVGRAPH 4.1
Previous Fit CVGRAPH 4.1 Fit
Capsule Unirradiated Irradiated AT 50 Unirradiated Irradiated AT 50 U * 103 * -152.3 102.2 254.5
X -151.2 96.2 247.4 -152.3 96.2 248.5 Y -152.3 105.8 258.1 -152.3 102.4 254.7 V ..- 152.3 161.5 313.8
• Not given in analysis of record.
TABLE B- 15 Changes in Average 35 mil Lateral Expansion Temperatures for the Weld Heat-Affected-Zone Material
Previous Fit vs. CVGRAPH 4.1
Previous Fit CVGRAPH 4.1 Fit
Capsule Unirradiated Irradiated AT35 Unirradiated Irradiated AT35
U * 59 * -190.1 59.0 249.1 X -169.9 69.9 239.8 -190.1 70.0 260.1 Y -190.1 82.2 272.3 -190.1 82.2 272.3 V . - ---- 190.1 148.9 339.0
* Not given in analysis of record.
Appendix B
Previous Fit CVGRAPH 4.1 Fit

B-6
-- TABLE B- 16 Changes in Average Energy Absorption at Full Shear for the Weld Heat-Affected-Zone Material
Previous Fit vs. CVGRAPH 4.1
U
Capsule Unirradiated Irradiated AE Unirradiated Irradiated AE
U 148 88 -60 147.5 86.3 -61.2
X 147.6 101.2 -46.4 147.5 101.2 -46.3
Y 147.5 92.3 -55.2 147.5 88.2 -59.3
Previous Fit CVGRAPH 4.1 Fit
V I- I -- _ 147.5 71.3 -76.2
Appendix B
Previous Fit

C-0
APPENDIX C
CHARPY V-NOTCH PLOTS FOR EACH CAPSULE USING SYMMETRIC HYPERBOLIC TANGENT
CURVE-FITTING METHOD
Appendix C
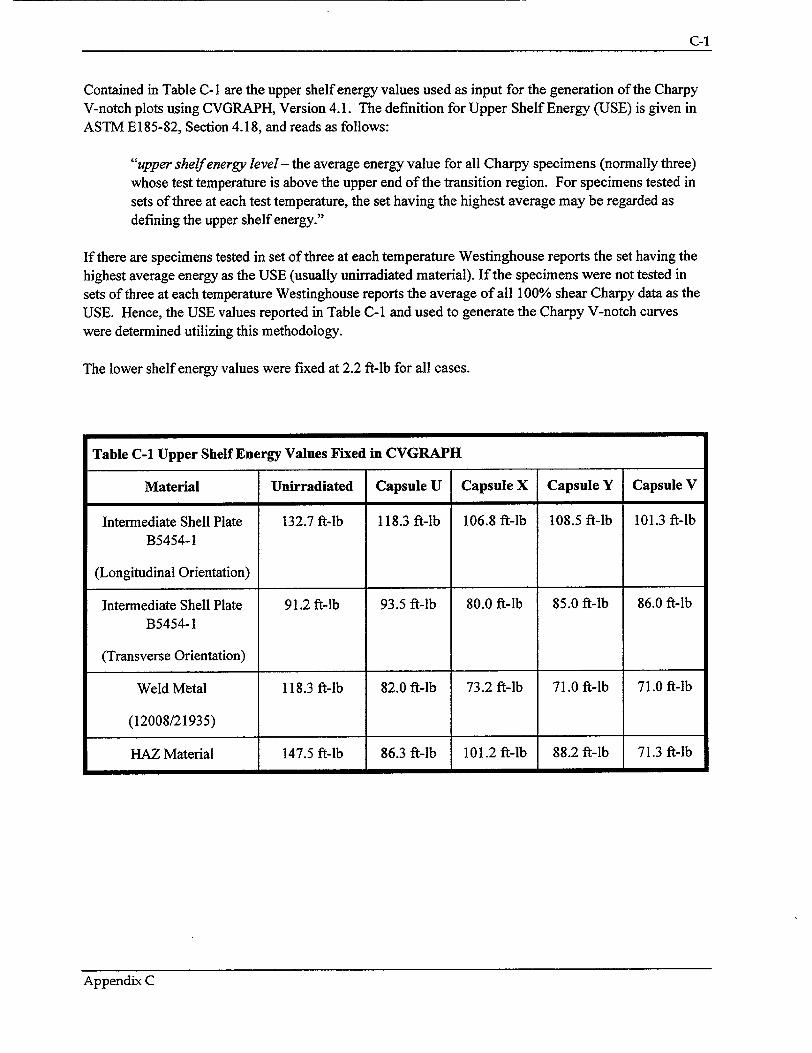
C-1
Contained in Table C-I are the upper shelf energy values used as input for the generation of the Charpy V-notch plots using CVGRAPH, Version 4.1. The definition for Upper Shelf Energy (USE) is given in ASTM E185-82, Section 4.18, and reads as follows:
"upper shelf energy level - the average energy value for all Charpy specimens (normally three) whose test temperature is above the upper end of the transition region. For specimens tested in
sets of three at each test temperature, the set having the highest average may be regarded as defining the upper shelf energy."
If there are specimens tested in set of three at each temperature Westinghouse reports the set having the highest average energy as the USE (usually unirradiated material). If the specimens were not tested in sets of three at each temperature Westinghouse reports the average of all 100% shear Charpy data as the USE. Hence, the USE values reported in Table C-I and used to generate the Charpy V-notch curves were determined utilizing this methodology.
The lower shelf energy values were fixed at 2.2 ft-lb for all cases.
Appendix C
Table C-1 Upper Shelf Energy Values Fixed in CVGRAPH
Material Unirradiated Capsule U Capsule X Capsule Y Capsule V
Intermediate Shell Plate 132.7 ft-lb 118.3 ft-lb 106.8 ft-lb 108.5 ft-lb 101.3 ft-lb B5454-1
(Longitudinal Orientation)
Intermediate Shell Plate 91.2 ft-lb 93.5 ft-lb 80.0 ft-lb 85.0 ft-lb 86.0 ft-lb B5454-1
(Transverse Orientation)
Weld Metal 118.3 ft-lb 82.0 ft-lb 73.2 ft-lb 71.0 ft-lb 71.0 ft-lb
(12008/21935)
HAZ Material 147.5 ft-lb 86.3 ft-lb 101.2 ft-lb 88.2 ft-lb 71.3 ft-lb
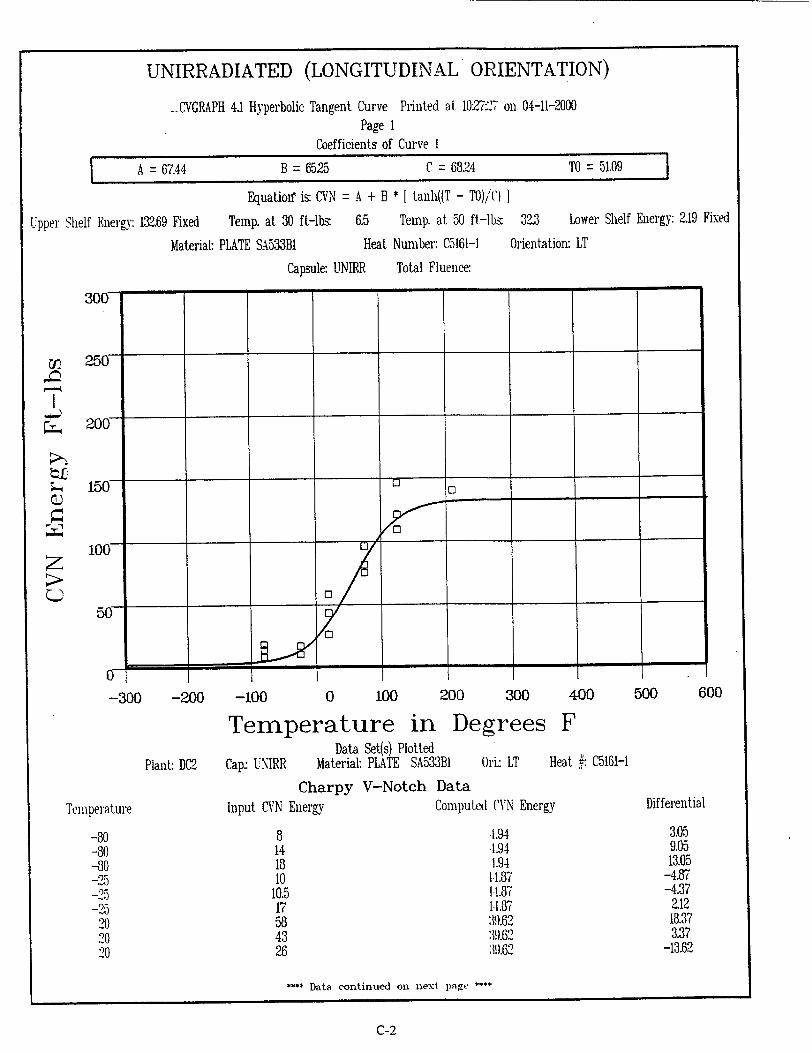
UNIRRADIATED (LONGITUDINAL ORIENTATION)
--CVGRAPH 4.1 Hyperbolic Tangent Curve Printed at 1027C7 on 04-11-2000 Page 1
Coefficients of Curve I
A =67.44 B= 6525 C= 6824 TO = 51.09
Equationi" is: CVN = A + B * [ tanh((T - TO)/C) ]
Upper Shelf Energy: 132.69 Fixed Temp. at 30 ft-lbs 6.5 Temp. at 50 ft-lbs- 32.3 Lower Shelf Energy: 2.19 Fixed
Material: PLATE SA533BI Heat Number: C5161-1 Orientation: LT
Capsule: UNIRR Total Fluence:
3007-
250
20-
150-- --
0
100 /
50
9-0
-300 -200 -100 0 100 200 300 400 500 600
Temperature in D Data Set(s) Plotted
Plant: DC2 Cap: UNIRR Material: PLATE SA533BI
Charpy V-Notch Data
Input CVN Energy
8 14 18 10
10.5 17 58 43 26
igrees
Ori.: LT Heat #: C5161-1
Computed (VN Energy
1.94 .1.94 .1.94 11.87 11.87 1-1.87 39.62 39.62 :19.62
**** Data continued on next pane **..
C-2
C2 4
F
Temperature
-80 -80 -80 -25 -25
-25 20 20 20
Differential
3.05 9.05 13.05
-4.87 -4.37
2.12 18.37 3.37
-13.62

UNIRRADIATED (LONGITUDINAL ORIENTATION)Page 2
Material: PLATE SA533BI Heat Number. C5161-1 Orientation: LT
Capsule: UNIRR Total Fluence:
Charpy V-Notch Data (Continued)
Input CVN Energy 81 75 96 121 109 146 140 140 140
Computed CV\N Energy 89.41 89.41 89.41 119227 11927 11927 131.47 131.47 131.47
SUM of RESIDUAl
C-3
Temperature 75 75 75 125 125 125 210 210 210
Differential -8.41 -14.41
6.58 1.72
-1027 26.72 8.52 8.5? 8.52
S = 53.7

CAPSULE U (LONGITUDINAL ORIENTATION)
-- CVGRAPH 4.1 Hyperbolic Tangent Curve Printed at 10"2727 on 04-11-2000 Page 1
Coefficients of Curve 2
Equation is: CVN =
Upper Shelf Energy: 118.3 Fixed Temp. at 30 ft-lbs: 71
Material: PLATE SA533B1
Capsule: U
)
|
I) Z
200
bk ;. 150
Tempera
0 50 60 75 75
10 10
500 600
Differential
-6.39 -2.51 -7.71
8.79 4.79 16.4
-15.06 -1.06
*,*Data continued on next page ***
C-4
I A = 6025 B = 58.05 C = 110.83 TO = 135.93
A + B* I tanh((T - T0)/C) ]
1.8 Temp. at 50 ft-lbs 116.1 Lower Shelf Energy: 2.19 Fixed
Heat Number. C5161-1 Orientation: LT
Total Fluence:
-300 -200 -100 0 100 200 300 400
Temperature in Degrees F Data Set(s) Plotted
Plant: D)2 Cap" U Material: PLATE SA533B1 Ori.: LT Heat #: C5161-1
Charpy V-Notch Data
ature Input CVN Energy Computed CVN Energy
5 11.39 20 22.51 18 :5171 40 312 36 :312
6 48 :21.59 0 27 12.06 0 41 .12.06
I

CAPSULE U (LONGITUDINAL ORIENTATION) Page 2
Material: PLATE SA533BI Heat Number. C5161-1 Orientation: LT
Capsule: U Total Fluence:
Charpy V-Notch Data (Continued)
Input CVN Energy Computed C'VN Energy Differential 39 5-1.53 -15.53 74 5-1.53 19.46 63 67.57 -4.57 90 90.5 -.5 113 109.56 3.43 117 115.91 1.08 125 117.67 7.32
SUM of RESIDUALS = 7.93
C-5
Temperature 125 125 150 200 275 350 425

CAPSULE X (LONGITUDINAL ORIENTATION)
--CVGRAPH 4.1 Hyperbolic Tangent Curve Printed at 10,27:27 on 04-11-2000 Page 1
Coefficients of Curve 3
A = 54.5 B = 52.3 C= 104.86 TO = 159.84
Equation is: CVN = A + B * I tanh((T - TO)/C) IUpper Shelf Energy: 106.8 Fixed Temp. at 30 ft-lbs: 106.5 Temp. at 50 ft-lbsr 150.7 Lower Shelf Energy: 2.19 Fixed
Material: PLATE SA533BI Heat Numbein C5161-1 Orientation: LT
Capsule- X Total Fluence:
300
25fF
200
15f0
100
o 1
-300 -200 -100 0 100
Temperature in200 300
Degrees400
F500 600
Plant: DC2 Cap: XData Set(s) Plotted
Material: PLATE SA533BI Ori- LT Heat #: C5161-1
Charpy V-Notch DataInput CVN Energy
7 21 29 17 29 40 34 45
Computed CVN Energy
9.62 20.92
2ý).39 2'9.39 :•f.4 :73.4 :r7.73
**** Data continued on next page ****
C-6
CI)
0.)
z
Temperature
25 80 80
105 105 115 115 125
Differential
-2.62 .07 8.07
-12.39 -.39 6.59 .59
7.26

CAPSULE X (LONGITUDINAL ORIENTATION) Page 2
Material: PLATE SA533BI Heat Number. C5161-1 Orientation: LT
Capsule: X Total Fluence:
Charpy V-Notch Data (Continued)
Input CVN Energy 42 43 73 111 100 104 112
Computed (VN Energy 4-1.71 4-1.71 83.37 97.19
100.04 10.1.08 105.1
SUM of RESIDUAL
Differential -2.71 -1.71
-10.37 13.8
-.04 -.08 6.89
S : 12.94
C-7
Temperature 140 140 225 280 300 350 375

CAPSULE Y (LONGITUDINAL ORIENTATION)
-- CVGRAPH 4.1 Hyperbolic Tangent Curve Printed at 1027:27 on 04-11-2000 Page 1
Coefficients of Curve 4
A = 55.34 B= 5315 C = 78.98 TO = 159.08
Equation is CVN = A + B * [ tanh((T - TO)/C) ]
Upper Shelf Energy: 108.5 Fixed Temp. at 30 ft-lbs. 118 Temp. at 50 ft-lbs: 1511 Lower Shelf Energy: 2.19 Fixed
Material: PLATE SA533BI
Capsule: Y
Heat Number C5161-1
Total Fluence:
Orientation: LT
300
250
200
150
01 1 -300 -200 -100 0 100 200 300 400
Temperature in Degrees F Data Set(s) Plotted
Plant: DC- Cap- Y Material: PLATE SA5:3:3B1 Oni- LT Heat #: C5161-1
Charpy V-Notch Data
Input CVN Energy
6 6 9 15 20 34 32
Computed CVN Energy
1.05 5.64 3.51
12.75 16.32 21.65 :ý1.74
500
Differential
1.94 .35 .48 224 3.67 12.34
-1.74
-* Data continued on next page ****
C-8
cn
z0)
z
Temperature
600
0 25 50 72 85 100 123
I I - -I I I i .94

CAPSULE Y (LONGITUDINAL ORIENTATION) Page 2
Material: PLATE SA533B1 Heat Number. C5161-1 Orientation: LT
Capsule: Y Total Fluence:
Charpy V-Notch Data (Continued)
Input CVN Energy Computed CVN Energy Differential 48 4926 -1.26 57 65.91 -8.91 59 72.18 -13.18
104 91.64 12.35 104 98.83 5.16 108 98.83 9.16 117 105.58 11.41 105 108.05 -3.05
SUM of RESIDUALS = 30.97
C-9
Temperature 150 175 185 225 250 250 300 375

CAPSULE V (LONGITUDINAL ORIENTATION)
CVGRAPH 4.1 Hyperbolic Tangent Curve Printed at 1027:27 on 04-11-2000 Page I
Coefficients of Curve 5
A=51.72 B= 49.52 C= 74.38 T0 = 164.94
Upper Shelf Energy: 10125 Fixed
Material:
CI)
z
Equation is: CVN = A + B * I tanh((T - TO)iC) 0
Temp. at 30 ft-lbs: 129.9 Temp. at 50 ft-lbs 162.3 Lower Shelf Energy: Z19 Fixed
PLATE SA533B1 Heat Number C5161-1 Orientation: LT
Capsule: V Total Fluence:
-300 -200 -100 0 100 200 300 400
Temperature in Degrees F Data Set(s) Plotted
Plant: DC2 Cap- V Material: PLATE SA533BI Oriz LT Heat #: C5161-1
Temperature
0 50 100 115 125 130
Charpy V-Notch Data Input CVN Energy Computed CVN Energy
4 8 13 31 28 27
3.36 6.5
16.91
27.42 30.03
500 600
Differential
.63 1.49
-3.91 8-9 .)(*
-3.03
**** Data continued on next page ****
C-I1

CAPSULE V (LONGITUDINAL ORIENTATION) Page 2
PLATE SA533B1 Heat Number. C5161-1 Oriental
Capsule: V Total Fluence
Charpy V-Notch Data (Continued)
Input CVN Energy Computed CVN Energy 48 35.71 42 41.9 43 58.38 54 73.47 83 80.79
104 84.81 112 9211 88 98.69 101 100.57
S
tion: LT
UM of RESIDUAL
Differential 1228 .09
-15.38 -19.47
22 19.18 19.88
-10.69 A2
S = 12.57
C-1I
Material:
Temperature 140 150 175 200 215 225 250 300 350

UNIRRADIATED (LONGITUDINAL ORIENTATION)
CVGRAPH 4.1 Hyperbolic Tangent Curve Printed at 14:31.50 on 04-11-2000 Page 1
Coefficients of Curve I
A= 45 B =44 C= 80.02 TO = 36.62
Upper Shelf LF." 89
Material: PLATE
Equatioii is: LE.. = A + B * I tanh((T - TO)/C) I Temperature at LE. 35: 18.1 Low
SA5331B1 Heat Number: C5161-1
er Shelf LE.: I Fixed
Orientation: LT
Capsule: UNIRR Total Fluence:
600-300 -200 -100 0 100 200 300 400 500
Temperature in Degrees FData Set(s) Plotted
Plant: flQ2 Cap: UNIRR Material: PLATE SA533B1
Charpy V-Notch Data Input Lateral Expansion Cor
8 13 113
7
9 5-4 49 23
Ori: LT Heat /. C5161-1
nputed LE.
5.52 5.52 5.52 16.53 16.53 16.53 35.98 35.98 35.98
Differential
2.47 7.47 12.47
-9.53 -9.53 -7.53
18.01 13.01
-12.98
*-* Data continued on next page I
C-12
r,,=4
ct
,=t= 0=.
Temperature
-80 -80 -80 -25 -25 -25 20 20 20

UNIRRADIATED
--Material: PLATE SA533BI
(LONGITUDINAL ORIENTATION) Page 2
Heat Number. C5161-1 Orientation: LT
Capsule: UNIRR Total Fluence:
Charpy V-Notch Data (Continued)
Input Lateral Expansion 62 56 64 84 77 87 89 91 82
Computed LR 64.62 64.62 64.62 8029 8029 8029 87.86 87.86 87.86
Differential -Z62 -8.62 -.62 3.7
-329 6.7 .13
3.13 -5.86
SUM of RESIDUALS = 7.53
C-13
Temperature 75 75 75
125 125 125 210 210 210

CAPSULE U (LONGITUDINAL ORIENTATION)
CVGRAPH 4.1 Hyperbolic Tangent Curve Printed at 14:3150 on 04-11-2000 -- Page 1
Coefficients of Curve 2
A 44.32 B = 43.32 C= 115.67 TO = 118.59
Upper Shelf LE: 87.65
Material: PLATE
Equation is-. L.E = A + B * I tanh((T - TO)/C) I Temperature at LE. 35: 932 LC
SA533111 Heat Number. C5161-1
Capsule: U Total Fluence:
)wer Shelf LE.: I Fixed
Orientation: LT
m
S
P5
600-300 -200 -100 0 100 200 300 400 500
Temperature in Degrees FData Set(s) Plotted
Plant: DC2 Cap: U Material: PLATE SA533BI OrL LT Heat #: C5161-I
Charpy V-Notch Data Input Lateral Expansion Computed LE.
6.5 20 19 36 29 38 27 38
10.87 2127 24.08 28.73 28.73 29.05 37A2 37.42
**** Data continued on next page *4*
C-14
Temperature
0 50 60 75 75 76 100 100
Differential
-4.37 -1.27 -5.08 726
8.94 -10.42
.F7

CAPSULE U (LONGITUDINAL ORIENTATION) Page 2
Material: PLATE SA53311 Heat Number. C5161-1 Orientation: LT
Capsule: U Total Fluence:
Charpy V-Notch Data (Continued)
Temperature Input Lateral ,spansion Computed .E. Differential 125 38.5 46.72 -822 125 58 46.72 11.27 150 54 55.81 -1.81 200 70 70.61 -.61 275 84 8222 1.77 350 82 86.1 -4.1 425 90 8722 2.77
SUM of RESIDUALS = -3.03
C-15

CAPSULE X (LONGITUDINAL ORIENTATION)
CVGRAPH 4.1 Hyperbolic Tangent Curve Printed at 14:31:50 on 04-11-2000 "Page 1
Coefficients of Curve 3
A 44.92 I = 43.92 C = 122.47 TO = 163.12
Equation is: LE = A + B * [ tanh((T - TO)/C)
Upper Shelf LEz 88.84
Material: PLATE SA53311
Temperature at LE. 35: 134.9
Heat Number: C5161-1
Lower Shelf LE.: I Fixed
Orientation: LT
Capsule: X Total Fluence:
600-300 -200 -100 0 100 200 300 400 500
Temperature in Degrees FData Set(s) Plotted
Plant: DC2 Cap- X Material: PLATE SA533BI C
Charpy V-Notch Data Input Lateral Expansion Coi
9 19 28 16 a3 31 21i 36
lri LT Heat #. C5161-1
nputed LE
9.33 18.97 18.97 25.51 25.51 28A9 28A9 31.67
**** Data continued on next page ****
C- 16
Temperature
25 80 80 105 105 115 115 125
Differential
-.33 .02
9.02 -9.51 -2.51
2.5
-249 4.32

CAPSULE X (LONGITUDINAL ORIENTATION) Page 2
Material: PLATE SA5331:1 Heat Number C5161-1 Orientation: LT
Capsule: X Total Fluence:
Charpy V-Notch Data (Continued)
Input Lateral Expansion Computed LE. Differential 38 36.72 1z2 34 36.72 -2.72 62 65.39 -3.39 B5 77.49 7.5 79 80.35 -1.35 83 84.87 -1.87 85 86.16 -1.16
SUM of RESIDUALS = -.71
C-17
Temperature 140 140 225 280 300 350 375

(LONGITUDINAL ORIENTATION)
CVGRAPH 4.1 Hyperbolic Tangent Curve Printed at 14:31.50 on 04-11-2000 Page 1
Coefficients of Curve 4
A = 44.88 II = 43.88 C = 10124 TO = 167.34
Upper Shelf LE-: 88.77
Material: PLATE
Equation is LE. = A + B * [ tanh((T - TO)/C) l
Temperature at LE. 35: 144.1 1l
E SA53311 Heat Number. C5161-1
Capsule: Y
wer Shelf LE.: 1 Fixed
Orientation: LT
Total Fluence:
200- - . - � . - . - p - � -, �1*
1500
5-
- -O
U1
-300 -200 -100 0 100 200 300
Temperature in Degrees400
FData Set(s) Plotted
Plant: DC2 Cap-: Y Material: PLATE SA533B1 C
Charpy V-Notch Data Input Lateral Expansion Cor
64 8 13 18 27 27.
)ri: LT Heat #: C5161-1
nputed LE.
4.1 5.97 8.86 1258 15.42 19.35 27.53
**** Data continued on next page **
C-18
Uf) Mp.
500 600
Temperature
0 25 50 72 85
100 125
Differential
1.89 -1.97 -.86 .41
2.57 7.64 -.53
CAPSULE Y

CAPSULE Y (LONGITUDINAL ORIENTATION) Page 2
--Material: PLATE SA533B11 Heat Number C5161-1 Orientation: LT
Capsule: Y Total Fluence:
Charpy V-Notch Data (Continued)
Input Lateral Expansion Computed L.E 38 37.44 42 482 43 52.46 75 67.48 7t 74.42 78 74.42 86 8K.82 80 87.34
SUM of R]
Differential .55
-62 -9.46
7.51 2.57 3.57 3.17
-7.34 ESIDUALS = 3.52
C-19
Temperature 150 175 185 225 250 250 300 375

CAPSULE V (LONGITUDINAL ORIENTATION)
CVGRAPH 4.1 Hyperbolic Tangent Curve Printed at 14-51"3 on 04-11-2000 Page 1
Coefficients of Curve 5
A = 38.02 11 = 37.02 C = 78.17 TO = 172.76
Equation is- LE. = A + B* [ tanh((T - TO)/C) I
Upper Shelf LE. 75.04
Material: PLATE SA533111
Temperature at LU 35: 166.3
Heat Number C5161-1
Lower Shelf LE- 1 Fixed
Orientation: LT
Capsule: V Total Fluence:
600-300 -200 -100 0 100 200 300 400 500
Temperature in Degrees F Data Set(s) Plotted
Plant: DC2 Cap: V Material: PLATE SA533BI Oni: LT Heat 1 C5161-1
Charpy V-Notch DataInput Lateral Expansion
0 3 8
20 19
DifferentialComputed LE.
1.88 4.06 10.96 14.75 17.85 19.57
-1.88 -1.06 -2.96 724 2.14
-.57
"*** Data continued on next page *
C-20
Temperature
0 50 100 115 125 130

CAPSULE V (LONGITUDINAL ORIENTATION) Page 2
- Material: PLATE SA533111 Heat Number. C5161-1 Orientation: LT
Capsule: V Total Fluence:
Charpy V-Notch Data (Continued)
Input Lateral Expansion 27 27 31 39 60 69 75 64 74
Computed LE 23.35 27.53 39.08 50.42 5628 59.64 66.03 7229 7426
Differential 3.64 -.53
-8.08 -11.42
3.71 9.35 8.96
-829 -26
SUM of RESIDUALS = -.03
C-21
Temperature 140 150 175 200 215 225 250 300 350

UNIRRADIATED (LONGITUDINAL ORIENTATION)
- CVGRAPH 4.1 Hyperbolic Tangent Curve Printed at 11:00:04 on 04-11-2000 Page 1
Coefficients of Curve I
A 50 B= 50 C= 80.49 TO = 46.87
Equation is- Shearx = A + B * I tanh((T - TO)/C) ]
Temperature at 50/ Shear. 46.8
Material: PLATE SA533BI Heat Number. C5161-1 Orientation: LT
Capsule: UNIRR Total Fluence:
-300 -200 -100 0 100 200 300 400 500
Temperature in Degrees Data Set(s) Plotted
Plant: D(2 Cap: UNIRR Material: PLATE SA533B1 Ori.: LT He•
Charpy V-Notch Data
Input Percent Shear ComputeI Percent Shear
5 5 5 13 16 18 40 40 35
.1.09 41.09 -1.09 I-1.35 1-1.'T5 1.:35
33.9 33.9 33.9
F
Differential
.9 .9
.9
1.64 3.64 6.09 6.09 1.09
**** Data continued on next page -'
C-22
C)
UD
600
Temperature
-80 -80 -80 -25 -25 -25 20 20 20
at ý': C5161-1

UNIRRADIATED (LONGITUDINAL ORIENTATION) Page 2
Material: PLATE SA533BI Heat Number. C5161-1 Orientation: LT
Capsule: UNIRR Total Fluence:
Charpy V-Notch Data (Continued)
Input Percent Shear Computed Percent Shear 55 66.79 50 66.79 61 66.79
100 87.44 100 87.44 100 87.44 100 9829 100 9829 100 9829
Differential -11.79 -16.79 -5.79 12.55 12.55 12.55 1.7 1.7 1.7
DUALS = 28.31
C-23
Temperature 75 75 75 125 125 125 210 210 210
SUM of RESI

CAPSULE U (LONGITUDINAL ORIENTATION)
-. CVGRAPH 4.1 Hyperbolic Tangent Curve Printed at 11:00:04 on 04-11-2000 Page 1
Coefficients of Curve 2
A = 50 B = 50 C = 93.5 TO = 142.66
Equation is: Shear' = A + B * tanh((T - T•)/C) I
Temperature at 50>: Shear. 142.6
Material: PLATE SA533B1 Heat Number: C5161-1 Orientation: LT
Capsule: U Total Fluence:
600-300 -200 -100 0 100 200 300 400 500
Temperature in Degrees F
Plant: DC2 Cap: UData Set(s) Plotted
Material: PLATE SA533BI Ori- LT HE
Charpy V-Notch DataInput Percent Shear
5 15 15 20 20 25 20 25
Computed Percent Shear
4.51 12.11 14.57 19.04 19.04 19.37 28.64 28.64
***Data continued on next page ***
C-24
Cfo
0
0a
Temperature
0 50 60 (5 75 76 t00 100
Differential
.48 2.88 .42 .95 .95
5.62 -8.64 -3.64
I
eat -,:z C5161-1

CAPSULE U (LONGITUDINAL ORIENTATION) Page 2
Material: PLATE SA533B1 Heat Number. C5161-1 Orientation: LT
Capsule: U Total Fluence:
Charpy V-Notch Data (Continued)
Input Percent Shear Computed Percent Shear 25 40.66 60 40.66 55 53.91 75 7.31 100 94.43 100 9B.82 100 99.76
SUM of R
Differential -15.66
19.33 1.0O
-2.31 5.56 1.17 .23
ESIDUALS = 8.44
C-25
Temperature 125 125 150 200 275 350 425

CAPSULE X (LONGITUDINAL ORIENTATION)
-. CVGRAPH 4.1 Hyperbolic Tangent Curve Printed at 11:00:04 on 04-11-2000 Page 1
Coefficients of Curve 3
A = 0 B= 50 C =71.02 TO = 45.31
Equation is: Shear/ = A + B * [ tanh((T - TO)/C)
Temperature at K/z Shear. 145.3
Material: PLATE SA533BI Heat Number C5161-1 Orientation: LT
Capsule: X Total Fluence:
100-
80
60
49Y
20
-300 -200 -100 0 100
Temperature200 300 400
in Degrees500 600
F
Plant: DC2 Cap: XData Set(s) Plotted
Material: PLATE SA533B1 Ori- LT Heat #: C5161-1
Charpy V-Notch Data Input Percent Shear Computed Percent Shear
5 15 20 15 25 35 30 40
326 13.71 13.71 2:.32 24.32 29.86 29.86 Wt.07
** Data continued on next page ****
C-26
C)
C�)
C)
Temperature
25 80 80 105 105 115 115 125
Differential
1.73 128 628
-9.32 .67
5.13 .13
3.92

CAPSULE X (LONGITUDINAL ORIENTATION) Page 2
Material: PLATE SA533B1 Heat Number C5161-1 Orientation: LT
Capsule: X Total Fluence:
Charpy V-Notch Data (Continued)
Input Percent Shear Computed Percent Shear 40 4626 45 4626 95 90.41
100 97.79 100 98.73 10o 99.68 100 99.84
SUM of RI
Differential -626 -126
4.58 22 126 .31 .15
ESIDUALS = 10.83
C-27
Temperature 140 140 225 280 300 350 375

CAPSULE Y (LONGITUDINAL ORIENTATION)
-- CVGRAPH 41 Hyperbolic Tangent Curve Printed at 11:00.04 on 04-11-2000 Page 1
Coefficients of Curve 4
A= 50 B= 50 C= 48.3 T0 = 188.43
Equation is: Shear'. = A + B * tanh((T - T'C) ]
Temperature at 50% Shear 188.4
Material: PLATE SA533BI
Capsule: Y
Heat Number. C5161-1
Total Fluence:
Orientation: LT
80 / 6O
40F
20
C - -- - -
U 1 I
-300 -200 -100 0 100 200
Temperature in D Data Set(s) Plotted
Plant: DC2 Cap- Y Material: PLATE SA533B1 0
Charpy V-Notch Data
Input Percent Shear
0 5 10 15
20 20
300
egrees400
F500 600
iri.: [T Heat #: C5161-1
Computed Percent Shear
.04 .11 .32 .79 1.36
[6.74
Differential
-.04 4.88 9.67 92
13.63 17.49 1325
"** Data continued on next page ****
C-28
1UU
4.) 0
03
Temperature
0 25 50 72 85
100 125
4£
(

CAPSULE Y (LONGITUDINAL ORIENTATION) Page 2
Material: PLATE SA533BI Heat Number: C5161-1 Orientation: LT
Capsule: Y Total Fluence:
Charpy V-Notch Data (Continued)
Input Percent Shear 25 30 30 95
100 100 100 100
Computed Percent Shear 16.91
36.43 46.44 81.96 T92.74 92.74 99.02 99.95
SUM of RESIDUAL'
C-29
Temperature 150 175 185 225 250 250 300 375
Differential 8.08
-6.43 -16.44
13.03 725 725 .97 .04
= 81.86

CAPSULE V (LONGITUDINAL ORIENTATION)
-. CVGRAPH 41 Hyperbolic Tangent Curve Printed at 11:0&.04 on 04-11-2000 Page 1
Coefficients of Curve 5
S A= 50 B= 50 C= 7325 T0 = 173.43
Equation is: Shear. = A + B * [ tanh((T - TO)/C) ]
Temperature at 50Y. Shear- 173.4
Material: PLATE SA533BI Heat Number. C5161-1 Orientation: LT
Capsule: V Total Fluence:
-300 -200 -100 0 100 200 300 400 500 600
Temperature in Degrees F
Plant: DC2 Cap- VData Set(s) Plotted
Material: PLATE SA53:3B1 Ori- LT Heat #: C5161-1
Charpy V-Notch Data Input Percent Shear Computed Percent Shear
2 5 15 20 20 25
.87 3.32 11.86 16.86 21.04 2.3.39
*** Data continued on next page ****
C-30
0
C�)
0
Temperature
0 50 100 115 125 130
Differential
1.12 1.67 3.13 3.13
-1.04 1.6

CAPSULE V (LONGITUDINAL ORIENTATION) Page 2
Material: PLATE SA533B1 Heat Number. C5161-1 Orientation: LT
Capsule: V Total Fluence:
Charpy V-Notch Data (Continued)
Input Percent Shear Computed Percent Shear Differential 35 28.64 6.35 40 34.52 5.47 35 51.06 -16.06 50 67.37 -17.37 75 7-5.67 -.67 100 80.34 19.65 100 88.99 11 100 96.93 3.06 100 992 .79
SUM of RESIDUALS = 21.87
C-3 I
Temperature 140 150 175 200 215 225 250 300 350

UNIRRADIATED (TRANSVERSE ORIENTATION)
CVGRAPH 4.1 Hyperbolic Tangent Curve Printed at 11:15:47 on 04-11-2000 "Page 1
Coefficients of Curve I
A : 46.69 II = 44.5 C = 100.21 TO.= 65.36(
Equation is: CVN = A + B * tanh((T - TO)/C) ]
:l)per Shelf Energy: 91.19 Fixed Temp. at 30 ft-lbs: 25.8
Material: PLATE SA533l1
Temp. at 50 ft-lbs: 72.8
Heat Number. C5161-1
Lower Shelf Energy: 2.19 Fixed
Orientation: TL
Capsule: UNIRR Total Fluence:
z
-300 -200 -100 0 100 200 300 400 500
Temperature in Degrees FData Set(s) Plotted
Plant: DC2 Cap- UNIRR Material: PLATE SA533BI Ori- TL Heat #: C5161-1
Charpy V-Notch Data Input CVN Energy Computed CVN Energy
2.5
28.5 26 2'3
59.3 53.5
729 729 729 21.19 21.19 2L19 50.96 50.96 50.96
"-* Data continued on next page ***
C-32
Tempera ture
600
- (:) -75
0 0 0
15 (6)
Differential
-4.79 -1.79 -4.79
7.3 4.8 1.8
-18.96 8.53 2.53

CAPSULE U (TRANSVERSE ORIENTATION) Page 2
"Material: PLATE SA5:l11 Heat Number: C5161-1 Orientation: TL
Capsule: U Total Fluenee:
Charpy V-Notch Data (Continued)
Input CVN Energy Computed CVN Energy 37 51.46 54 55.81 55 7115 106 78.3 92 87.06 90 91.9 86 93.12
SUM of I
Differential -14.46 -1.81
-16.15 27.69 4.93 -1.9 -7. 1 9. RESIDUALS = 9.33
C-33
Temperature 150 160 200 225 275 350 425

CAPSULE U (TRANSVERSE ORIENTATION)
CVGRAPH 4.1 Hyperbolic Tangent Curve Printed at 11:15:47 on 04-11-2000 Page 1
Coefficients of Curve 2
A= 47.84 B = 45.65 C = 103.3 TO = 141.79
Equation is:. CVN = A + B * [ tanh((T - TO)/C) I
Upper Shelf Energy: 93.5 Fixed Temp. at 30 ft-lbs 99.1 Temp. at 50 ft-lbs 146.6 Lower Shelf Energy: 2.19 Fixed
Material: PLATE SA533BI Heat Number: C5161-1
Capsule: U Total Fluence:
Orientation: TL
200
150
100 z
50
0+
-30
Temperature
0 50 75 100 100 110 125 125
0 -200 -100 0 100 200 300 400 500
Temperature in Degrees FData Set(s) Plotted
Plant: DC2 Cap. U Material: PLATE SA533B1 C
Charpy V-Notch Data Input CVN Energy Comput
12 22 23 299 27 39 40 47
3ri: TL Heat #: C5161-1
ed CVN Energy
7.71 15.4
21.85 30.32 30.32 3422 40.49 40.49
"**** Data continued on next page 1*
C-34
600
Differential
428 6.59 1.14
-1.32 -332
4.77 -.49
6.5

CAPSULE U (TRANSVERSE ORIENTATION) Page 2
-'Material: PLATE SA533B1 Heat Number. C5161-1 Orientation: TL
Total Fluence:
Charpy V-Notch Data (Continued)
Input CVN Energy 3754 55
106 92 90 86
Computed CVN Energy 51.46 55.81 7L15 78.3
87.06 91.9
93.12
Differential -14.46
-1.81 -16.15 27.69 4.93 -1.9 -7.12
UM of RESIDUALS = 9.33
C-35
Capsule: U
Temperature 150 160 200 225 275 350 425

CAPSULE X (TRANSVERSE ORIENTATION)
CVGRAPH 4.1 Hyperholic Tangent Curve Printed at 11:15:47 on 04-11-2000 Page 1
Coefficients of Curve 3
A 41.09 1,= 38.9 C= 85.98 TO = 150.58
Equation is- CVN = A + B * [ tanh((T - TO)/C) I
Upper Shelf Energy: 80 Fixed Temp. at W0 ft-lbs: 125.3
Material: PLATE SA533fl1
Temp. at 50 ft-lbs.
Heat Number: C5161-1
170.6 Lower Shelf Energy: 2.19 Fixed
Orientation: TL
Capsule: X Total Fluence:
- r - T - T - T I I
-'200 -100 0 100 200
Temperature in D Data Set(s) Plotted
Plant: DC2 Cap: X Material: PLATE SA533BI 0
Charpy V-Notch Data Input CVN Energy Compul
8 21 17 27 26 38 34 47
300
egrees400
F
)ri- TL Heat #: C5161-1
ted CVN Energy
6.17 14.82 14.82 27.81 29.85 34.12 36.33 53.91
**** Data continued on next page **-
C-36
;5UU
C)
Z
250
200
150
100
50F-
0
-300
Temperature
25 80 80 120 125 135 140 180
500 600
Differential
1.82 6.17 2.17 -.81
-3.85 3.87
-2.33 -6.91
Sf

CAPSULE X (TRANSVERSE ORIENTATION) Page 2
"Material: PLATE SA53:ml[ Heat Number: C5161-1 Orientation: TL
Capsule: k Total Fluence:
Charpy V-Notch Data (Continued)
Input CVN Energy Computed CVN Energy Differential 55 61.28 -628 82 68-9 13.7 76 72.99 3 76 76.34 -.34 85 78.51 6.48 79 78.81 .18 82 7925 2.74
SUM of RESIDUALS = 19.63
C-37
Temperature 200 225 250 280 320 330 350

CAPSULE Y (TRANSVERSE ORIENTATION)
CVGRAPH 4.1 Hyp'rbolie Tangent Curve Printed at 11:15:47 on 04-11-2000 Page 1
Coefficients of Curve 4
A= 43.59 B = 41.4 C = 94.41 TO = 169.62
Equation is. CVN = A + B * [ tanh((T - TO}/C) I
Upper Shelf Energy: 85 Fixed Temp. at .10 ft-lbs. 137.4 Temp. at 50 ft-lbs 184.3 Lower Shelf Energy: 2.19 Fixed
Material: PLATE SA5.31BI
Capsule: Y
Heat Number. C5161-1
Total Fluence:
Orientation: TL
- - U -. U - * - , - we
-300 -200 -100 0 100 200 300
Temperature in E Data Set(s) Plotted
Plant: DC2 Cap.: Y Material: PLATE SA533BI
Cha Input CVX Energy
9 9 '21
2-1 32
rpy V-Notch Data Computed CVN Energy
4.41 5.89 828 11.66 17.61 25.36 35.11
**** Data continued on next page ****
C-38
300
2507
200-
150-
1UL
50
0
_________ I �-.-,4*f +
.�. z
I t
400 500 600
)egrees F
Ori. TL Heat ff C5161-1
Temperature
0 25 50 73 100 125 150
Differential
2.58 3.1 .71
8.33 1.38
-1.36 -3.11

CAPSULE Y (TRANSVERSE ORIENTATION)Page 2
-Material: PLATE SA533B1 Heat Numbei. C5161-1 Orientation: TL
Capsule: Y Total Fluence:
Charpy V-Notch Data (Continued)
Input CVN Energy 40 55 69 76 89 80 80 91
Computed CVN Energy 45.95 56.47 65.43 7223 80.07 82.02 84.37 84.78
Differential -5.95 -1.47
3.56 3.76 8.92
-2.02 -4.37
621 UJM of RESIDUALS = 2026
C-39
Temperature 175 200 225 250 300 325 400 450

CAPSULE V (TRANSVERSE ORIENTATION)
CVGRAPH 4.1 Hyperbolic Tangent Curve Printed at 11:15:47 on 04-11-2000 Page 1
Coefficients of Curve 5
A = 44.09 B = 41.9 C = 9827 TO = 173.14
Equation is- CVN = A + B * [ tanh((T - TO)/C) I
Upper Shelf Energy: 86 Fixed Temp. at 30 ft-lbs-. 138.7
Material: PLATE SA533B1
Temp. at 50 ft-lbs: 187
Heat Number. C5161-1
Capsule: V Total Fluence:
Lower Shelf Energy: 2.19 Fixed
Orientation: TL
z
0 i
-30
Temperature
25 72 100 115 125 150
0 -200 -100 0 100 200 300 400 500
Temperature in Degrees FData Set(s) Plotted
Plant: DC2 Cap- V Material: PLATE SA533BI 0
Charpy V-Notch Data Input C•N Energy Compul
8 13 17 28 32 37
iri- TL Heat #: C5161-1
ted CVN Energy
6.11 11.68 17.63 21.84 25.07 34A1
**** Data continued on next page ***
C-40
600
Differential
1.88 1.31
-.63 6.15 6.92 a.58

CAPSULE V (TRANSVERSE ORIENTATION) Page 2
Material: PLATE SA5331 Heat Number C5161-1 Orientation: TL
Capsule: V Total Fluence:
Charpy V-Notch Data (Continued)
Input CVN Energy Computed CVN Energy 36 44.89 41 5527 47 5722 68 60.93 74 64.36 81 76.63 83 78.19 90 82.35 90 83.76
SUM of
Differential -8.89 -1427 -1092
7.06 9.63 4.36 4.8
7.64 623
RESIDUALS = 24.58
C-41
Temperature 175 900 205 215 225 275 285 325 350

UNIRRADIATED (TRANSVERSE ORIENTATION)
CVGRAPH 4.1 Hyperbolic Tangent Curve Printed at 14:59:59 on 04-11-2000 Page 1
Coefficients of Curve I
A 39.05 B = 38.05 C= 95.99 TO = 64.68
Upper Shelf LE. 77.1
Material: PLATE
Equation is. LE. = A + B * [ tanh((T - TO)/C) I Temperature at LE 35: 54.4 Lo
SA533BI Heat Number. C5161-1
wer Shelf LE.: I Fixed
Orientation: TL
('apsule: UNIRR Total Fluence:
p - I I r
100 ]0
50 0
-200 -100 0 100 200 300 400 500 600
Temperature inData Set(s) Plotted
Plant: DC2 Cap-: UNIRR Material: PLATE SA533BI
Degrees F
Ori: TL Heat #: C5161-1
Charpy V-Notch Data Input Lateral Expansion Computed LE.
2 7 0 26 19 17 35 50 38
4.93 4.93 4.93 16.69 16.69 16.69 43.12 43.12 43.12
**** Data continued on next page *
C-42
;uU
MI150
I- F t r 1
U3 -300
Temperature
-75 -75 -75
0 0 0 75 75 75
Differential
-2.93 2.06 -4.93
9.3 a3 .3
-8.12 6.87
-5.12

C-43
Temperature 125 125 125 160 160 160 300 300 300 550 550 550
UNIRRADIATED (TRANSVERSE ORIENTATION) Page 2
Material: PLATE SA533fl1 Heat Number. C5161-1 Orientation: TL
Capsule: UNIRR Total Fluence:
Charpy V-Notch Data (Continued) Input Lateral Expansion Computed LK Differential
61 6024 .75
59 6024 -124 48 6024 -1224 75 67.92 7.07 75 67.92 7.07 73 67.92 5.07 83 76.54 6.45 87 76.54 10.45 80 76.54 345 70 77.1 -7.1 65 77.1 -12.1 70 77.1 -7.1
SUM of RESIDUALS = 27
I

CAPSULE U (TRANSVERSE ORIENTATION)
CVGRAPH 4.1 Htyperbolic Tangent Curve Printed at 1459-59 on 04-11-2000 Page 1
Coefficients of Curve 2
A = '39.53 13 :38.53 C = 122.73 TO = 130.07
Equalion is LE. = A + B * [ tanh((T - TO)/C) ]
Upper Shelf L.E. 78.06
Material: PLATE SA5.33B1
Temperature at L.E 35: 115.5
Heat Number C5161-1
Lower Shelf LE. I Fixed Orientation: TL
Capsule: U Total Fluence:
150
1IO
0 o
50
00
-300 -200 -100 0 100 200 300 400
Temperature in DegreesData Set(s) Plotted
Plant: DC2 Cap: U Material: PLATE SA533BI
Charpy V-Notch Da
Input Lateral Expansion
13 20.5
24.5 28 37.5 38 43
FOri: TL Heat #: C5161-1
ta Computed LE.
926 17.44 2331 3027 3027 3328 37.93 37.93
**** Data continued on next page *
C-44
Y1
600
Temperature
0 50 75 100 100 110 125 125
Differential
3.73 3.05 -.81
-5.77 -227
421 .06
5.06
500

CAPSULE U (TRANSVERSE ORIENTATION) Page 2
-Material: PLATE SA53:1] Heat. Number: C5161-1 Orientation: TL
Capsule: U Total Fluence:
Charpy V-Notch Data (Continued)
Temperature Input Lateral Expansion Computed LK Differential 150 39 45.73 4.73 160 49 48.74 .25 200 52.5 59.38 -6.88 225 75 64.53 10.46 275 7-1 71.42 2.57 350 78 75.98 2.01 425 71.5 77.43 -5.93
SUM of RESIDUALS = 3.05
C-45
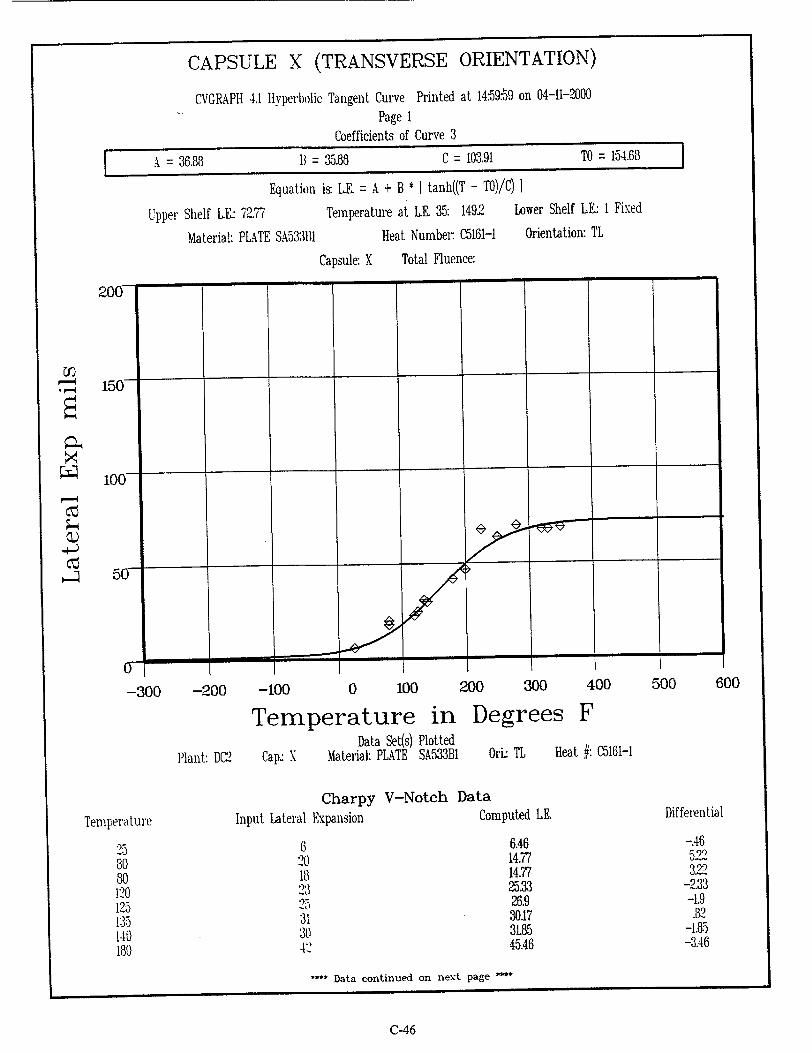
-300 -200 -100 0 100
Temperature in Data Set(s) Plotted
Plant: DC2 Cap- X Material: PLATE SA533B1
200 300
Degrees400
F
Ori: TL Heat #: C5161-1
Charpy V-Notch Data Input Lateral Expansion Computed LE.
6 20 1I 23 25 31 30 4:-
6.46 14.77 14.77 25.33 26.9
30.17 3K85 45.46
*** Data continued on next page ***
C-46
Temperature
600
25 80 80 120 125 1:35 140 180
Differential
-.46 5.22 3.22
-2.33 -1.9 .82
-1.85 -3.46
CAPSULE X (TRANSVERSE ORIENTATION)
CVGRAPH 4.1 tHyperbolic Tangent Curve Printed at 14:5959 on 04-11-2000
Page I Coefficients of Curve 3
36.88 B = 35.88 C = 103.91 TO = 154.68
Equation is- LE. A + B * [ tanh((T - T0)/C) ]
Upper Shelf L.E. 72.77 Temperature at LE. 35: 1492 Lower Shelf LE2 I Fixed
Material: PLATE SA5331I Heat Number. C5161-1 Orientation: TL
Capsule: X Total Fluence:
200~
150
100
50
o~
-i
500

CAPSULE X (TRANSVERSE ORIENTATION) Page 2
Material: PLATE SA533111 Heat Number: C5161-1 Orientation: TL
Capsule: X Total Fluence:
Charpy V-Notch Data (Continued)
Input Lateral Expansion Computed LE. Differential 47 51.61 -4.61 68 58.04 9.95 64 62.89 1.1 70 66.87 3.12 68 69.91 -1.91 68 70.4 -2.4 69 71.14 -2.14
SUM of RESIDUALS = 2.35
C-47
Temperature 200 225 250 280 320 330 350

CAPSULE Y (TRANSVERSE ORIENTATION)
CVGRAPH 4.1 Hyperbolic Tangent Curve Printed at 14:59:59 on 04-11-2000 "Page 1
Coefficients of Curve 4
A = 36.58 B = 35.58 C = 108.5 TO = 166.99
Equation is:. L.E. = A + B * [ tanh((T - TO)/C) ]
Upper Shelf LE: 72-.16
Material: PLATE SA533111
Temperature at LE. 35: 162.1
Heat Number C5161-1
Lower Shelf LE- I Fixed
Orientation: TL
Total Fluence:
cn • 150
1007-
0 O-g -30
Temperature
0 25 50 73 100 125 150
0 -200 -100 0 100 2
Temperature in D Data Set(s) Plotted
Plant: DC2 Cap: Y Material: PLATE SA533BI C
Charpy V-Notch Data Input Lateral Expansion Cor
6 8 8 16 19
28
00 300 400 500
agrees F
ri: TL Heat #: C5161-1
rputed LE.
4.13 5.84 8.38 11.69 17.03 23.46 3105
*,** Data continued on next page I
C-48
Capsule: Y
600
Differential
1.86 2.15 -.38 4.3
1.96 -1.46 -3.05

C-49
Temperature 175 200 225 250 300 325 400 450
CAPSULE Y (TRANSVERSE ORIENTATION) Page 2
-Material: PLATE SA533131 Heat Number. C5161-1 Orientation: TL
(apsule: Y Total Fluence:
Charpy V-Notch Data (Continued)
Input Lateral Expansion Computed L.E. Differential 36 392 -32 46 47.08 -1.08 55 53.97 1.02 62 59.49 2.5 70 66.52 3.47 74 68.49 5.5 65 712 -6.2 70 71.78 -1.73
SUM of RFSIDUALS = 5.61

CAPSULE V (TRANSVERSE ORIENTATION)
CVGRAPH 4.1 Hyperbolic Tangent Curve Printed at 14:5959 on 04-11-2000 "Page 1
Coefficients of Curve 5
A 35.5 13 = 34.5 C = 105.72 TO = 187.86
Equalion is: L.E. = A + B * [ tanh((T - TO)/C) I
Upper Shelf LE. 70.01
Material: PLATE SA533813
Temperature at LE. 35: 186.3
Heat Number. C5161-1
Lower Shelf LFE.: I Fixed Orientation: TL
Capsule: V Total Fluence:
-300 -200 -100 0 100 200 300 400 500
Temperature in Degrees F
Plant: DC2 Cap- VData Set(s) Plotted
Material: PLATE SA533B1 Ori: TL Heat #: C5161-1
Charpy V-Notch DataInput Lateral Expansion
*1 11 21)
"29
Computed LE.
4.02 793 12
14.89 17.1
23.65
*"* Data continued on next page ****
C-50
Cr)
600
Temperature
25 72 100 115 125 150
Differential
-2.02 .06 -i 5.1 .89
5.34

CAPSULE V (TRANSVERSE ORIENTATION) Page 2
"7Material: PLATE SA533111 Heat Number: C5161-1 Orientation: TL
Capsule: V Total Fluence:
Charpy V-Notch Data (Continued)
Input Lateral Expansion 24 31 37 50 52 63 61 65 64
Computed L.K 31.32 39.45 41.05 44.17 47.15 58.87 60.53 6521 66.94
Differential -7.32 -8.45 -4.05
5.82 4.84 4.12 .46
-21 -2.94
SUM of RESIDUALS = .64
C-51
Temperature 175 200 205 215 225 275 285 325 350

UNIRRADIATED (TRANSVERSE ORIENTATION)
CVGRAPH 4.1 Hyperbolic Tangent Curve Printed at 11:34:06 on 04-11-2000 "Page 1
Coefficients of Curve I
A 50 11 = 50 C = 91.07 TO = 61.4
Equation is: Shear:. = A + B * [ tanh((T - TO)/C) ]
Temperature at 50.z Shear: 61.4
Material: PLATE SA533H1 Heat Numbein C5161-1 Orientation: TL
Capsule: UNIRR Total Fluence:
600-300 -200 -100 0 100 200 300 400 500
Temperature in Degrees FData Set(s) Plotted
Plant: DC2 Cap- UNIRt, Material: PLATE SA533BI
Charpy V-Notch DataInput Percent Shear
9 9 9
25 2:5 25 50
45 47.
Ori" TL Heat #: C5161-1
Computed Percent Shear
4.76 4.76 4.76 20.61 20.61 20.61 57.4 57A 57.4
Differential
423 4-93 423 4.38 4.38 4.38
-7.4 -5.4 -10.4
**** Data continlued on next page *
C-52
0
0J 0
Temperature
-75 -75 -75
0 0 0 75 75 75

UNIRRADIATED (TRANSVERSE ORIENTATION) Page 2
Material: PLATE SA533It1 Heat Number. C5161-1 Orientati
Capsule: UNIRR Total Fluence:
Charpy V-Notch Data (Continued)
Input Percent Shear Computed Percent Shear 79 80.16 79 80.16 82 8016 100 89.7 100 89.7 100 89.7 100 99.47 100 99.47 100 99.47 100 99.99 100 99.99 100 99.99
on: TL
JM of RESIDUAL
Differential -1.16 -1.16
1.83 1029 1029 1029 .52 .52 .52 0 0 0
LS = 34.63
C-53
Temperature 125 125 125 160 160 160 300 300 300 550 550 550
St

-300 -200 -100 0 100
Temperature200 300
in Degrees400
F500
Plant: DC2 Cap.: UData Set(s) Plotted
Material: PLATE SA533BI Ori: TL Heat /. C5161-1
Charpy V-Notch DataInput Percent Shear
5 10 20 20
35 35
Computed Percent Shear
3.14 8.54 13.68 2L18 2LIB 24.92 3W 31.3
****Data continued on next page ****
C-54
C.)
600
Temperature
0 50 75
100 100 110 125 125
Differential
1.85 1A5 6.31
-1.18 -1.18 5.07 3.69 3.69
CAPSULE U (TRANSVERSE ORIENTATION)
CVGRAPH 4.1 Hyperbolic Tangent Curve Printed at 11:34:06 on 04-11-2000 Page 1
Coefficients of Curve 2
A 501 B=50 C = 94.66 TO= 162.11
Equation is: Shear. = A + B * I tanh((T - TO)/C) I Temperature at 50'. Shear. 162.1
Material: PLATE SA533f11 Heat Number. C5161-1 Orientation: TL
Capsule: U Total Fluence:
L000
600
i00 o o 00
20 7-/
0
0- ~ - - -

CAPSULE U (TRANSVERSE ORIENTATION) Page 2
-Material: PLATE SA533111 Heat Number: C5161-1 Orientation: TL
Capsule: U Total Fluence:
Charpy V-Notch Data (Continued)
Input Percent Shear Computed Percent Shear 35 43.59 45 48.84 50 68.97 1oo 79.03 100 91.55 100 98.14 100 99.61
C-55
Temperature 150 160 200 225 275 350 425
Differential -'.59 -3.84
-18.97 20.96 8.44 1.85 .38
S = 19.94SUM of RESIDUAL•

CAPSULE X (TRANSVERSE ORIENTATION)
CVGRAPH 4.1 Hyperbolic Tangent Curve Printed at 11:34.06 on 04-11-2000 Page 1
Coefficients of Curve 3
A 50 B = 50 C = 76.42 TO = 170.5
Equation ik: Shear". = A + B * tanh((T - TO)/C) ]
T,,mperature at 50/ Shear:. 170.5
Material: PLATE SA533111 Heat Number: C5161-1
Capsule: X Total Fluence:
Orientation: TL
-300 -200 -100 0 100 200 300 400 500
Temperature in Degrees F
Plant: DC- Cap: KData Set(s) Plotted
Material: PLATE SA533B1 Off" TL Heat #: C5161-1
Charpy V-Notch DataInput Percent Shear
5 15 15 20 25 :35 30 45
Computed Percent Shear
2.17 8.56 856 21.05 23.31 28.3
31.03 56.17
**** Data continued on next page 1*
C-56
02
0
C-
600
Temperature
25 80 80 120 125 135 140 180
Differential
2.82 6.43 6A3
-1.05 1.68 6.69
-1.03 -11.17

C-57
Temperature 200 225 250 280 320 330 350
CAPSULE X (TRANSVERSE ORIENTATION) Page '2
--Material: PLATE SA5331ll Heat Number: C5161-1 Orientation: TL
(:apsule: X Total Fluence:
Charpy V-Notch Data (Continued)
Input Percent Shear Computed Percent Shear Differential 50 68.38 -18.38 100 80.62 19.37 100 88.89 11.1 100 94.6 539 100 98.03 1.96 100 98.48 1.51 100 99.09 .9
SUM of RESIDUALS = 32.67

CAPSULE Y (TRANSVERSE ORIENTATION)
CVGRAPH 4.1 Hyperbolic Tangent Curve Printed at 11:34.06 on 04-11-2000 Page 1
Coefficients of Curve 4
A :50 11 50 C = 74.97 TO = 199.21
Equation is: Shear-. = A + B * t tanh((T - TO)/C) ]
Temperature at 507. Shear: 1992
Material: PLATE SA53311l Heat Number. C5161-1
Capsule: Y Total Fluence:
Orientation: TL
-300 -200 -100 0 100 200 300 400 500
Temperature in Degrees FData Set(s) Plotted
Plant: DC2 Cap-- Y Material: PLATE SA533B1 0
Charpy V-Notch Data
Input Percent Shear
10 20
ri: TL Heat #: C5161-1
Computed Percent Shear
.48
.94
3.33 6.61 12.13 212
**** Data continued on next page **
C-58
C.)
600
Temperature
0 25 50 73 100 125 150
Differential
4.51 4.05 3.16 6.66 8.38 7.86 3.79

CAPSULE Y (TRANSVERSE ORIENTATION) Page 2
Material: PLATE SA533111 Heat Number: C5161-1 Orientation: TL
Capsule: Y Total Fluence:
Charpy V-Notch Data (Continued)
Input Percent Shear 30 35 65 95
100 100 100 100
Computed Percent Shear 34.38 50.52 66.54 79.48 93.63 96.62 99.53 99.87
Differential -4.38
-15.52 -1.54
15.51 6.36 3.37 .46 .12
M of RESIDUALS = 42.82
C-59
Temperature 175 200 225 250 300 325 400 450

CAPSULE V (TRANSVERSE ORIENTATION)
CVGRAPH 4.1 Hyperbolic Tangent Curve Printed at 11:34:06 off 04-11-2000 Page 1
Coefficients of Curve 5
A 50 13=50 C= 79.59 TO = 169.62
Equation is: Shear= A + B * tanh((T - TO)/C) ]
Temperature at 50. Shear 169.6
Material: PLATE SA53,111
Capsule: V
Heat Number. C5161-1
Total Fluence:
Orientation: TL
0
-30 S 407
2G
-301
Temtperature
25 72 100 115 125 150
0 -200 -100 0 100 200 300 400 500
Temperature in Degrees FData Set(s) Plotted
Plant: DC2 Cap: V Material: PLATE SA533BI Ori- TL Heat #: C5161-1
Charpy V-Notch Data Input Percent Shear Computed Percent Shear
10 15 20 35 40
2.57 7.92 14.81 2021 24.57 37.91
**** Data continued on next page ***
C-60
600
Differential
-.57 2.07 .18
-.21 10.2 2.08

CAPSULE V (TRANSVERSE ORIENTATION) Page 2
"-Material: PLATE SA533BI Heat Number. C5161-1 Orientation: TL
('apsule: V Total Fluence:
Charpy V-Notch Data (Continued)
Input Percent Shear Computed Percent Shear 45 53.36 50 682 65 70.86 85 75.76 95 80.07 100 93.38 100 94.77 100 98.02 100 98.93
SUM of R
Differential -8.36 -18.2 -5.86 923 14.92 6.61 522 1.97 1.06
ESIDUALS = 20.57
C-61
Temperature 175 200 205 215 225 275 285 325 350

Upper Shelf Energy: 118.3 Fixed Temp. at 30 ft-lbs- -12.5
Material: WELD
Temp. at 50 ft-lbs:
Heat Number 12008/21935
14.6 Lower Shelf Energy: 2.19 Fixed
Orientation:
Capsule: UNIRR
3(00
Total Fluence:
-- . - ! - * - - r T
250
200
150
00
5--
1 -300
' -200-100 0 100
Temperature in Data Set(s) Plotted
Plant: DC2 Cap-- NIRR Material: WELD
200 300
Degrees4W0
F
Ori: Heat #: 12008/21935
Charpy V-Notch Data
Input (VN Energy
19 23
:13
111.3.
Computed CVN Energy
16.46 16.46 16.46 38.51 38.51 38.51 79.41 79A1 79.41
***Data continued on next pagge *1
C-62
Cf..
I)
z
Temperature
500 600
-40 -40 -40
0 0 0 50 50 50
Differential
2.53 6.53 -4.46 -17.51
18.48 -5.51 -4A.
5.08 1.58
UNIRRADIATED (WELD)
CVGRAPH 4.1 Hyperbolic Tangent Curve Printed at 14:18:31 oin 04-11-2000
Page 1 Coefficients of Curve 1
A = 6025 II = 58.05 C = 67.88 TO = 26.71
Equation is: CVN = A + B I tanh((T - TO)/C) ]
300
t

UNIRRADIATED (WELD) Page 2
Material WI:ELD Heat Number. 12008/21935 Orient
Capsule: UNIRR Total Fluence:
Charpy V-Notch Data (Continued)
Input CVN Energy Computed CVN Energy 105 10628 109 10628 105 10628 124 115.3 111 115.3 103 115.3 125 117.77 125 117.77 122 117.77
S1
C-63
ation:
Differential -128
2.71 -128
8.69 -4.3 -12.3 722 722 422
UM of RESIDUALS = 1322
Temperature 100 100 100 150 150 150 210 210 210
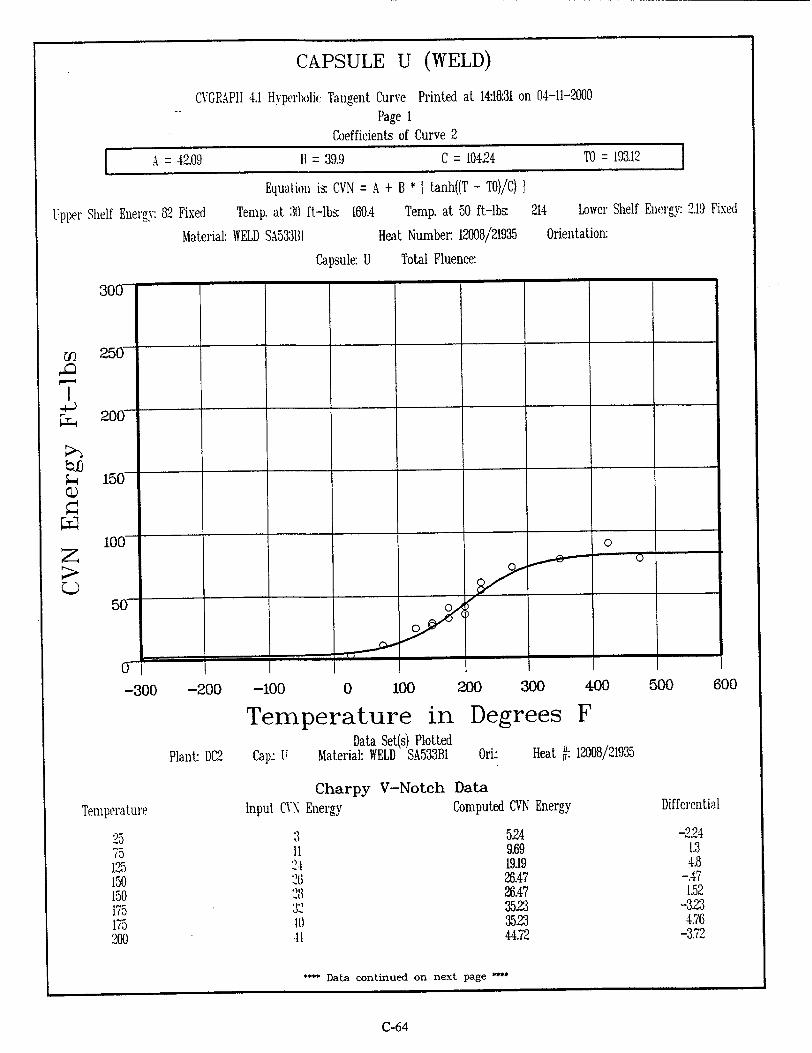
CAPSULE U
CVGRAPH 4.1 Hyperbolic Tangent Curve Printed at 14:18:31 on 04-11-2000 Page 1
Coefficients of Curve 2
A 42.09 II = 39.9 C = 10424 TO = 193.12
Equation is: CVN = A + B I tanh((T - TO)/C) ]
Upper Shelf Energy: 82 Fixed Temp. at :4) ft-lbs: 160.4
Material: WELD SA5331B1
Capsule: U
Temp. at 50 ft-lbs
Heat Number 12008/21935
Total Fluence:
214 Lower Shelf Energy: 2.19 Fixed
Orientation:
CI) U
200o
S 150
100
50
-30'
Temperature
25 7,
125 150 150 175 175 200
0 -200 -100 0 100 200 300 400 500
Temperature in Degrees FData Set(s) Plotted
Plant: DC2 Cap- U Material: WELD SA533B1 Or
Charpy V-Notch Data Input CVN Energy Compu'
3 11
2-1 26
3:2 .I0 -11
:i- Heat #T: 12008/21935
ted CVN Energy
524 9.69 1919
26.47 26.47 3523 3523 44.72
**** Data continued on next page I
C-64
600
Differential
-224 1.3 4.8
-.47 1.52
-323 4.76
-3r72
(WELD)
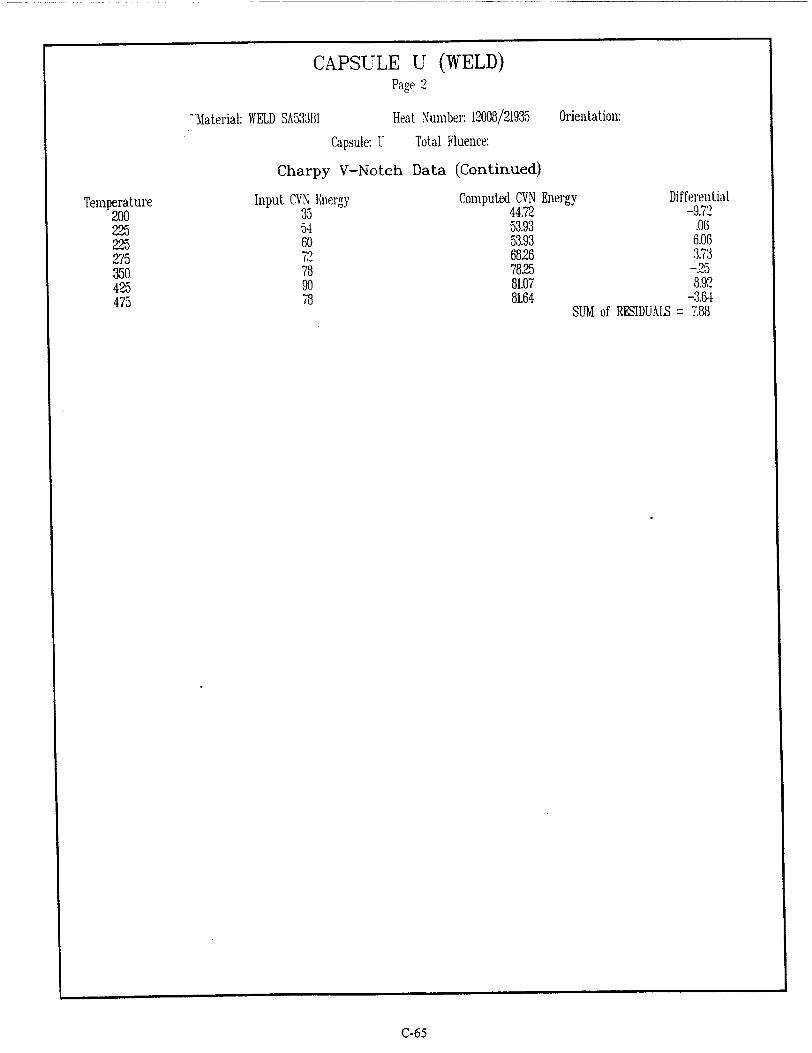
CAPSULE U Page 2
"%iateriat: WELD SA53311 Heat Number: 12008/21935 Orientation:
Capsule: U Total Fluence:
Charpy V-Notch Data (Continued)
Input CVN Energy 35 54 60 72) 78 90 78
Computed CVN Energy 44.72 53.93 53.93 6826 7825 81.07 81.64
SUM of RESIDUAL!
C-65
(WELD)
Temperature 200 225 225 25 350 425 475
Differential -9.72
.06 6.06 3.73
-25 8.92
-3.64 :7.88

CAPSULE X (WELD)
CVGRAPH 4.1 Hyperbolic Tangent Curve Printed at 14:18:31 on 04-11-2000 Page 1
Coefficients of Curve 3
A= 37.69 11 = 35.5 C = 65.11 TO = 205.07
Equation is. CVN = A + B [ tanh((T - TO)/C) I
Up~per Shelf Energy: 73.19 Fixed Temp. at 30) ft-lbs. 190.7
Material: WELD SA533111
Temp. at 50 ft-lbs 228.6
eat Number. 12008/21935 0
Lower Shelf Energy: 2.19 Fixed
rientation:
Capsule: X Total Fluence:
-300 -200 -100 0 100 200 300 400 500 600
Temperature in D Data Set(s) Plotted
Plant: DC2 Cap: X Material: WELD SA533BI Or
Charpy V-Notch Data Input CVX Energy Compu
15 It. 25 19
:33 32
50
egrees F
i-- Heat #: 12008/21935
ted CVN Energy
4.9 1324 27.08 27.08 3224 3224 4037 40X3
"*** Data continued on next page **"
C-66
I)
Tempera t ure
100 150 185
195 195 210 210
Differential
10.09 2.75
-2.08 -8.08
.75 -24
-3.37 9.62

CAPSULE X (WELD) Page 2
rELD SA533BI Heat Number 12008/21935 Orie
Capsule: X Total Fluence:
Charpy V-Notch Data (Continued)
Input CVN Energy Computed CVN Energy 53 58.92 63 58.92 74 69.55 71 72.38 76 72.81 72 73.02 73 73.1
S
ntation:
Differential -5.92
4.07 4.44
-1.38 3.18
-1.02 -.1
UM of RESIDUALS = 12.68
C-67
-Material: V
Temperature 250 250 300 350 375 400 420

CAPSULE Y (WELD)
CVGRAPH 4.1 Hyperbolic Tangent Curve Printed at 14:18:31 on 04-11-2000 Page 1
Coefficients of Curve 4
A= 36.59 B = 344 C = 95.58 TO = 217.45
Equation is: CVN = A + B * [ tanh((T - TO)/C) IUpper Shelf Energy: 71 Fixed Temp. at 'M ft-lbs: 19
Material: WELD
8. Temp. at 50 ft-lbs: 256.7
Heat Number. 12008/21935 Or
Lower Shelf Energy: 2.19 Fixed
ientation:
Capsule: Y Total Fluence:
600-300 -200 -100 0 100 200 300 400 500
Temperature in Degrees FData Set(s) Plotted
Plant: DC2 Cap- Y Material: WELD Ori: Heat . 12008/21935
Charpy V-Notch Data
Input CVN Energy
6 10 20
21 37 4-1
Computed CVN Energy
42 7.62 15.68 25.34 30.38 33.92 39.3
**** Data continued on next page ****
C-68
CI-)
z Q)
Temperature
50 100 150 185 200 210 225
Differential
1.79 2.37 4.31
-3.34 -6.38
3.07 4.69

CAPSULE Y (WELD) Page 2
Material: WELD Heat
Capsule: Y
Charpy V-Notch
Input CVN Energy 50 42 68 68 69 73 (I
Number: 12008/21935 Orientation:
Total Fluence:
Data (Continued)
Computed CVN Energy Differential 47.88 Z11 55.12 -13.12 60.61 7.38 64.44 3.55 68.54 .45 69.52 3.47 70.47 6.52
SUM of RESIDUALS = 16.9
C-69
Temperature 250 275 300 325 375 400 450

CAPSULE V (WELD)
CVGRAPH 4.1 Hyperbolic Tangent Curve Printed at 14:18:31 on 04-11-2000 Page 1
Coefficients of Curve 5
A= 36.59 B= 34.4 C= 50.17 TO = 221.71
Equation is: CVN = A + B * [ tanh((T - TO)/C) ]
Upper Shelf Energy: 71 Fixed Temp. at 30 ft-lbs: 211.9
Material: WELD
Temp. at 50 ft-lbs: 242.3
.at Number. 12008/21935 Or
Lower Shelf Energy: 2.19 Fixed
ientation:
Capsule: V Total Fluence:
300
250
200
150
•z0-0- •
0
-200 -100 0 100
TemperatureData Set(s) Plotted
Plant: DC2 Cap" V Material: WELD
Cha Input CVN Energy
6 t3 16 17 17 19
200 300
in Degrees
400
F
Oni: Heat #: 12008/21935
rpy V-Notch Data Computed CVN Energy
237 3.62 11.44 1512 2257 2554
**** Data continued on next page ****
C-70
z
-300 500 600
Temperature
72 125 175 185 200 205
Differential
3.62 9.37 4.55 1.87
-5.54 -6.54
M'

CAPSULE V (WELD) Page 2
WELD Heat Number: 12008/21935 Orienl
Capsule: V Total Fluence:
Charpy V-Notch Data (Continued)
Input CVN Energy Computed CVN Energy 43 32.02 34 38.84 43 48.6 63 54.16 51 56.57 72 63.65 64 67.48 74 69.89 68 70.94
S
ration:
UM of RESIDUAL
Differential 10.97
-4.84 -5.6 8.83
--5.57 8.34
-3.48 4.1
-2,94 S = 17.11
C-71
-' Material:
Temperature 215 225 240 250 255 275 295 325 400

Upper Shelf LE. 91.11
Material: WEL
Equation is: L.E. = A + B * I tanh((T - T0)/C) I Temperature at LE. 35: -.7 Lo,
D Heat Number. 12008/21935
rer Shelf LEa I Fixed
Orientation:
Capsule: UNIRR Total Fluence:
- � - - - r - - r r
50)1
-300 -200 -100 0 100 200
Temperature in Data Set(s) Plotted
Plant: DC2 Cap: UNIRII, Material: WELD
Charpy V-Notch Da Input Lateral Expansion
16 20 11 27 51 32 59 69 62
300
Degrees400
F
Or.: Heat #: 12008/21935
ata Computed LE.
15.49 15.49 15.49 35.43 35.43 35.43 6659 6659 6659
500 600
Differential
.5 4.5
-4.49 -8.43
15.56 -3.43 -(.59
2.4 -4.59
*- Data continued on next page *-
C-72
cITJ
200
150
100
I 4 4 4 1 t I I
-1 4 I 4 - + t I 0
F
U
Tem'perature
-40 -40 -40
0 0 0 50 50 50
UNIRRADIATED (WELD)
CVGRAPH -1.1 Hvperbolite Tangent Curve Printed at 15:05:46 on 04-11-2000 "Page 1
Coefficients of Curve I
A 46.05 B = 45.05 C= 6828 TO = 16.4
[]

UNIRRADIATED (WELD) Page 2
ial: WELD Heat Number. 12008/21935 O0
Capsule: UNIRR Total Fluence:
Charpy V-Notch Data (Continued)
Input Lateral Expansion Computed L. 91 83.94 90 83.94 86 83.94 96 89.35 89 89.35 82 89.35 87 90.8 90 90.8 89 90.8
rientation:
Differential 7.05 6.05 2.05 6.64
-.35 -7.35 -3.8 -.8 -1.8
SUM of RESIDUALS = 2.09
C-73
Mater
Temperature 100 100 100 150 150 150 210 210 210
s ...... \

CAPSULE U (WELD)
Upper Shelf L.E.: 75.89
Material: WELD SA533B1
Temperature at LE. 35: 170.4 Lower Shelf L.:a I Fixed
Heat Number. 1t2008/21935 Orientation:
Capsule: U Total Fluence:
600-300 -200 -100 0 100 200 300 400 500
Temperature in Degrees F
Plant: DDC Cap: UData Set(s) Plotted
Material: WELD SA533BI Onf: Heat #: 12008/21935
Charpy V-Notch Data
Input Lateral Expansion Computed L.K
4 6.52 12 12,33 20 22.37 29 29.01
30.5 29.01 33 3635 31; 36.35. 39 4336
I *** Data continued on next page '
C-74
ct Cl)
Temperature
25 75 125 150 150 175 175 200
Differential
-2.52 -.33 6.62 -.01
1.48 -3.35
1.64 -4.86
CVGRAPH 4.1 Hyperbolic Tangent Curve Printed at 15:05:46 on 04-11-2000 Page 1
Coefficients of Curve 2
A = 38.44 11 = 37.44 C = 124.02 TO = 181.92
Equation is: LE = A + B * tanh(tT - TO)/C) I
-1

CAPSULE U (WELD) Page 2
-Material: WELD
Input
SA533B1 Heat Number 12008/21935
Capsule: U Total Fluence:
Charpy V-Notch Data (Continued)
Lateral Expansion Computed LE. 36 43.86 51 50.95 58 50.95
65.5 62.24 71 7122 75 74.43 73 7523
Orientation:
Differential -7.86
.04 7.04 3.25
-- 99
.56 -223
SUM of RESIDUALS = -.74
C-75
Temperature 200 225 225 275 350 425 475

CAPSULE X (WELD)
CVGRAPH 4.1 Hyperbolic Tangent Curve Printed at 15:4A023 on 04-11-92000 Page I
Coefficients of Curve 3
A = 36.78 B = 35.78 C = 101.11 TO= 217.07
Equation is. LE. = A + B * [ tanh((T - TO)/C) ]
Upper Shelf L.E. 72.57 Temperature at LE. 35: 212 Lower Shelf LE.: I Fixed
Material: WELD SA533BI Heat Number:. 12008/21935 Orientation:
Capsule: k Total Fluence:
200-
150
100
50-
0 100 200
Temperature in DegreesData Set(s) Plotted
Material: WELD SA533BI
Charpy V-Notch Da
300
Plant: DC2 Cap: X
Input Lateral Expansion
14 15 25 17 28 32 30 41
400
F
Ori- Heat ý 12008/21935
ta Computed LE.
7.43 16
25.8 25.8 29.09 29.09 3428 3428
500
Differential
6.56 -1 -.8 -8.8
-1.09 2.9
-4.28 6.71
***' Data continued on next page ****
C-76
Cl-
0
-300 -200 -100
Temperature
600
100 150 185 185 195 195 210 210

CAPSULE X (WELD) Page 2
-11aterial: WELD SA533B1 Heat Number: 12008/21935
Capsule: X Total Fluence:
Charpy V-Notch Data (Continued)
Input Lateral Expansion Computed LE. 45 48.04 56 48.04 62 60.94 62 67.75 67 69.55 62 70.69 85 7129
Orientation:
Differential -3.04
7.975 1.05
-5.75 -2.55 -8.69
13.7 SUM of RESIDUALS = 2.86
C-77
Temperature 250 250 300 350 375 400 420

CAPSULE Y (WELD)
CVGRAPH 4.1 Hyperbolic Tangent Curve Printed at 15:05:46 on 04-11-2000 Page 1
Coefficients of Curve 4
A 32.3 1 = 31.3 C = 125.38 TO = 227.34
Equation is: LK = A + B * [ tanh((T - T0)/C) ]
Upper Shelf LE. 63.6
Material: WELD
Temperature at LE. 35: 238.1
Heat Number 12008/21935
Lower Shelf LEz I Fixed
Orientation:
Capsule: Y Total Fluence:
600-300 -200 -100 0 100 200 300 400 500
Temperature in Degrees FData Set(s) Plotted
Plant: DC2 Cap.: Y Material: WELD Oni:
Charpy V-Notch Data
Input Lateral Expansion Cor
4 9 16
31 38
Heat 1. 12008/21935
rputed LE
4.49 826 15.12 22.11 25.58 28
3L71
**** Data continued on next page ****
C-78
z
Lt
Temperature
50 100 150 185 200 210 225
Differential
-.49 .73 .87
-.11 -3.58
2.99 628

CAPSULE Y (WELD) Page 2
rial: WELD Heat Number: 12008/21935 C
Capsule: Y Total Fluence:
Charpy V-Notch Data (Continued)
Input Lateral Expansion Computed L. 32 37.9 35 43.66 55 48.65 57 52.71 59 58.18 59 59.86 60 61.86
)rientation:
Differential -5.9 -8.66 6.34 428 .81
-.86 -1.86
SUM of RESIDUALS = .85
C-79
Mate]
Temperature 250 275 300 325 375 400 450

CAPSULE V (WELD)
CVGRAPH 4.1 Hyperbolic Tangent Curve Printed at 15:05:46 on 04-11-2000 "Page 1
Coeffi.ents of Curve 5
A= 27.41 B = 26.41 C = 55.95 TO 222.65
Equation is: LE = A + B * [ tanh((T - T0)/C) I
Upper Shelf LE. 53.82
Material: WELD
Temperature at LE. 35: 239.1
Heat Number 12008/21935
Capsule: V Total Fluence:
Lower Shelf LE- I Fixed
Orientation:
-300 -200 -100 0 100 200 300 400 500
Temperature in Degrees FData Set(s) Plotted
Plant: DC2 Cap- V Material: WELD Ori.: Heat / 12008/21935
Charpy V-Notch DataInput Lateral Expansion
0 6 8 16 14 18
Computed LK
124 256 913 11.9
1726 1934
**** Data continued on next page ****
C-80
M P-4,,
600
Temperature
72 125 175 185 200 205
Differential
-124 3.43
-1.13 4.09
-326 -1.34

CAPSULE V (WELD) Page 2
ial: WELD Heat Number. 12008/21935 0
Capsule: V Total Fluence:
Charpy V-Notch Data (Continued)
Input Lateral Expansion Computed L8 30 2.81 23 28.51 32 35.34 43 39.37 39 4UI7 52 46.77 50 50.12 52 52.49 52 53.72
rientation:
SUM of RESIDUAL'
C-81
- Matei
Temperature 215 225 240 250 255 275 295 325 400
Differential 6.18
-5.51 -3.34
3.62 -2.17 522 -.12 -.49
-1.72 = 2.18

UNIRRADLATED (WELD)
SA = 50 1 O = 50 C = 84.11 TO = 23.43 1
Material: WI
Equation is. Shear.: = A + B * [ tanh((T - TO)/C) I Temperature at 50;/. Shear: 23.4
,LD Heat Number. 12008/21935
Capsule: UNIRR Total Fluence:
Orientation:
-300 -200 -100 0 100 200 300
Temperature in Degrees Data Set(s) Plotted
Plant: DC2 Cap: UNIRR Material: WELD Ori: Heat #:
Charpy V-Notch Data
ature Input Percent Shear Computed Percent She
-40 -40 -40
0 0 0 50 50 50
10 10 10 50 55 38 50 65 59
400 500
F
12008/91935
ear
18.11 18.11 18.11 36.41 36.41 36.41 6528 6528 6528
Differential
-8.11 13.58 18.58 1.58
-1528 -28 -628
***Data continued on next page *'
C-82
4-) 0/
0
Telnulero
600
(VGRAPH 4.1 Ilyperboli Tangent Curve Printed at 12:12,46 on 04-11-2000 Page 1
Coefficients of Curve I
I
I

UNIRRADIATED (WELD) Page 2
.1: WELD Heat Number: 12008/21935 Orienta
Capsule: UN[RR Total Fluence:
Charpy V-Notch Data (Continued)
Input Percent Shear Computed Percent Shear 87 86.06 86 86.06 86 86.06 t0) 9529
100 9529 100 9529 100) 98.82 100 98.82 100 98.82
SUM of RESIDUAAU
C-83
Materia
Temperature 100 100 100 150 150 150 210 210 210
Differential .93 -.06 -.06 4.7 4.7 4.7 1.17 1.17 1.17
5 :.96
tion:
-1

CAPSULE U (WELD)
CVGRAPH 4.1 Hyperbolic Tangent Curve Printed at 12:12:46 on 04-11-2000 Page 1
Coefficients of Curve 2
A 50 11=50 C= 75.76 TO = 175.19
Equation isr Shear:: = A + B * [ tanh((T - TO)/C) ]
Temperature at 50x Shear: 175.1
Material: WELD SA53310 Heat Number. 12008/21935
Capsule: U Total Fluence:
-300 -200 -100 0 100 200 300 400 500
Temperatuire in Degrees F
Plant: DC-2 Cap.: UData Set(s) PI
Material: WELD SA5otted 53381 Ori: Heat /. 12008/21935
Charpy V-Notch DataInput Percent Shear
10 20 25 30 50 65 70
Computed Percent Shear
L86 6.63
20.99 33,96 33.96 4987 49.87 65.8
"*** Data continued on next page *'
C-84
Orientation:
¢0 ;-4 ct
4
600
Ternperature
25 75 125 150 150 175 175 200
Differential
.13 3.36
-.99 -8.96 -3..96
.12 15.12 4.19

CAPSULE U (WELD) Page 2
WELD SA53o31 Heat Number. 12008/21935 Orien
C;apsule: V Total Fluence:
Charpy V-Notch Data (Continued)
Input Percent Shear Computed Percent Shear 60 65.8 75 78.82 80 78.82 90 93.3 100 99.01 100 99.6 100 99.96
tation:
SUM of RESIDUAL'
C-85
-Material:
Temperature 200 225 225 275 350 425 475
Differential -5.8
-3.82 1.17
-3.3 .98 .13 .03
S -- 1.58

CAPSULE X (WELD)
CVGRAPH 4.1 Hyperbolit- Tangent Curve Printed at 12:12:46 on 04-11-2000 "Page 1
Coefficients of Curve 3
A= 50 t1=50 C= 272 TO = 192.77
Equation ik: Shear, A + B * [ tanh((T - TO)/C) I
Temperature at 50/. Shear: 192.7
Material: WELD SA533B1
Capsule: X
Heat Number. 12008/21935
Total Fluence:
C.)
C(D
C.)
0
C.)
-300 -200 -100 0 100 200 300 400
Temperature in Degrees FData Set(s) Plotted
Plant: DC2 Cap- X Material: WELD SA533B1
500 600
Ori. Heat It 12008/21935
Charpy V-Notch Data Input Percent Shear Computed Percent Shear
10 15 25 35
. 60 60 60 95
1 4.13
36.09 36.09 54.08 54.08 78.01 78.01
**** Data continued on next page **
C-86
Orientation:
Temperature
100 150 185 185 195 195 210 210
Differential
9.89 10.86
-11.09 -1.09
5.91 5.91
-18.01 16.98

CAPSULE X (WELD) Page 2
WELD SA533BI Heat Number: 12008/21935 Orien
Capsule: K Total Fluence:
Charpy V-Notch Data (Continued)
Input Percenil Shear Computed Percent Shear 9T 98.53 9T 98.53 100 99.96 100 99.99 100 99.99 100 99.99 100 99.99
SU
tation:
Differential -:3.53 -3.53
.03 0 0 0 0
M of RESIDUALS = 12.36
C-87
-Material:
Temperature 250 250 300 350 375 400 420
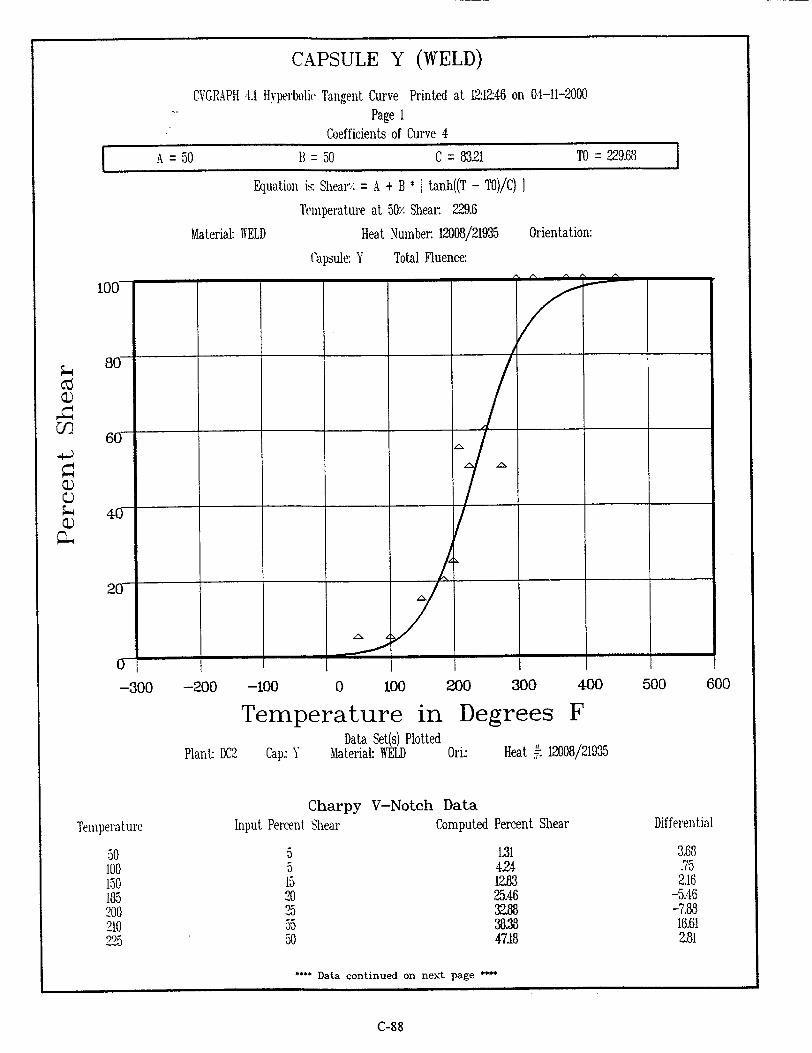
CAPSULE Y (WELD)
CVGRAPH 4.1 Hyperbolic Tangent Curve Printed at 12:12:46 on 04-11-2000 Page 1
Coefficients of Curve 4
A= 50 Bt=50 C= 8321 TO = 229.68
Equation i,- Shear'z = A + B * [ tanh((T - TO)/C) I Temperature at 50Y Shear. 229.6
Material: WELD Heat Number. 12008/21935
Capsule: Y Total Fluence:
-300 -200 -100 0 100 200 300 400 500
Temnerature in Degrees FData Set(s) Plotted
Plant: DC2 Cap: Y Material: WELD Ori: Heat :. 12008/21935
Charpy V-Notch DataInput Percent Shear
5 5 15 20 25 55 50
Computed Percent Shear
L31 424 12B83 25.46 3288
3838 4718
**** Data continued on next page ****
C-88
Orientation:
u-i
C-)
Temperature
600
50 100 150 185 200 210 225
Differential
3.68 .(5
2.16 -5.46 -7.88
16.61 2.81

CAPSULE Y (WELD) Page 2
1: WELD Heat Number: 12008/21935 Orienta Capsule: Y Total Fluenee:
Charpy V-Notch Data (Continued)
Input Percent Shear Computed Percent Shear 60 61.96 50 74.82 lot) 84.42 101) 90.81 1001 97.04 10(0 98.35 101) 99.5
SU
tion:
Differential -1.96
-24.82 15.57 9.18 2.95 1.64 .49
M of RESIDUALS = 15.75
C-89
- Materia
Temperature 250 275 300 325 375 400 450

CAPSULE V (WELD)
CVGRAPH 4.1 Hyperbolic Tangent Curve Printed at 12:12:46 on 04-11-2000 "Page 1
Coefficients of Curve 5
A= 50 B3= 50 C= 50.67 TO = 217.96
Equation is: Shearz = A + B * [ tanh((T - TO)/C) ]
Temperature at 50Y Shear: 217.9
Material: WELD Heat Number. 12008/21935
Total Fluence:
600-300 -200 -100 0 100 200 300 400 500
Temperature in Degrees FData Set(s) Plotted
Plant: DC2 Cap: V Material: WELD Ori" Heat /: 12008/21935
Charpy V-Notch DataInput Percent Shear
5 15 15 30 25 135
Computed Percent Shear
.31 2.48 15.49 2L39 32.97 37.47
**** Data continued on next page *
C-90
Capsule: V
Orientation:
C.)
0= 03
0
Temperature
72 125 175 185 900 905
Differential
4.68 12.51 -.49 8.6
-7.97 -2.47

CAPSULE V (WELD) Page 2
I- WELD Heat Number: 12008/21935 Orienta
Capsule: V Total Fluence:
Charpy V-Notch Data (Continued)
Input Percent Shear Computed Percent Shear 60 47.07 40 56.89 60 70.46 95 77.97 85 8117 95 90.47 90 95.43 100 98.55 i00 99.92
SU
tion:
Differential 12.92
-16.89 -10.46
17.02 3.82 4.52
-5A3 1.44 .07
M of RESIDUALS = 21.87
C-91
Materia
Temperature 215 225 240 250 255 275 295 325 400

UNIRRADIATED (HAZ)
I
A = 74.84 II = 72.65 C = 206.3 TO =-78.75
•pper Shelf Energy: 147.5 Fixed
Material:
Equal ion is:. CVN = A +
Temp. at :10 ft-lbs: -227.4
HEAT AFFD ZONE SA533B1
Capsule: UNIRR
B* I tanh((T - TO)/C) I
Temp. at 50 ft-lbs: -1522 Lower Shelf Energ.v: 2.11) Fixed
Heat Number. C5161-1 Orientation:
Total Fluence:
200
;4 150
100
5
Tempera
-15( -151 -151 -101 -lto -10 -10 -to
-150
3-
-300 -200 -100 0 100 200 30UU
Temperature in Degrees Data Set(s) Plotted
Plant: DC2 Cap- UNIRR Material: HEAT AFFD ZONE SA533B1 Or:
Charpy V-Notch Data
•ture Input CVN Energy Computed CVN Energy
113 50.71 0 80.5 50.71 0 .19 50.71 O 6-1.5 6739
4-t2 6739 0 41 67.39
72 982 40 982 82 982
400 500
F600
Heat ,. C5161-1
Differential
6228 29.78
-1.71 -2.89 -25.39 -26.39 -962 -582 -162
**" Data continued on next page ***
C-92
(XGRAPH 4.1 Hyperbolic Tangent Curve Printed at 12:53:42 on 04-11-2000 Page 1
Coefficients of Curve 1
I
_j

UNIRRADIATED (HAZ) Page 2
-Material: HEAT AFFD ZONE SA533B1
Capsule: UNIRR
Heat Number C5161-1
Total Fluence:
Charpy V-Notch Data (Continued)
Input CVN Energy 134 135 135 129 142 146 182 142 144
Computed CVN Energy 115.09 115.09 115.09 129.79 129.79 129.79 139.16 139.16 139.16
SUM of RESIDUAL1
Differential 18.9 19.9 19.9
-. 7(9
122 162
42.83 2.83 4.83
S 71.9
C-93
Orientation:
Temperature 50 50 50 125 125 125 210 210 210

Upper Shelf Energy: 86.3 Fixed Temp. at 30 ft-lbs: 6.9
Material: HEAT AFFD ZONE SA533B1
Capsule: U
Temp. at 50 ft-lbs: 102.1 Lower Shelf Energy: 2.19 Fixed
Heat Number C5161-1 Orientation:
Total Fluence:
C12
Z
-300 -200 -100 0 100 200 300 400 500
Tpm ornt 11 re in Degrees FData Set(s) Plotted
Plant: DC2 Cap- U Material: HEAT AFFD ZONE SA533BI Oni: Heat #: C5161-1
Charpy V-Notch Data Input CVN Energy Computed CVN Energy
2 26 15 44 33 59 47 35
14.04 20.3 2423 28.67 3355 38.76 44.14 4436
~'Data continued on next page
C-94
Temperature
600
-100 -50 -25
0 25 50 75 76
Differential
-12.04 5.69 -923
15.32 -. 55P 2023 2.85
-9.36
CAPSULE U (HAZ)
CVGRAPH 4.1 Hyperbolic Tangent Curve Printed at 12:53:42 on 04-11-2000
"Page t Coefficients of Curve 2
A = 44.25 B = 42.05 C = 194.06 TO = 75.46
Equation is: CVN = A + B * tanh((T - TO)/C)
I
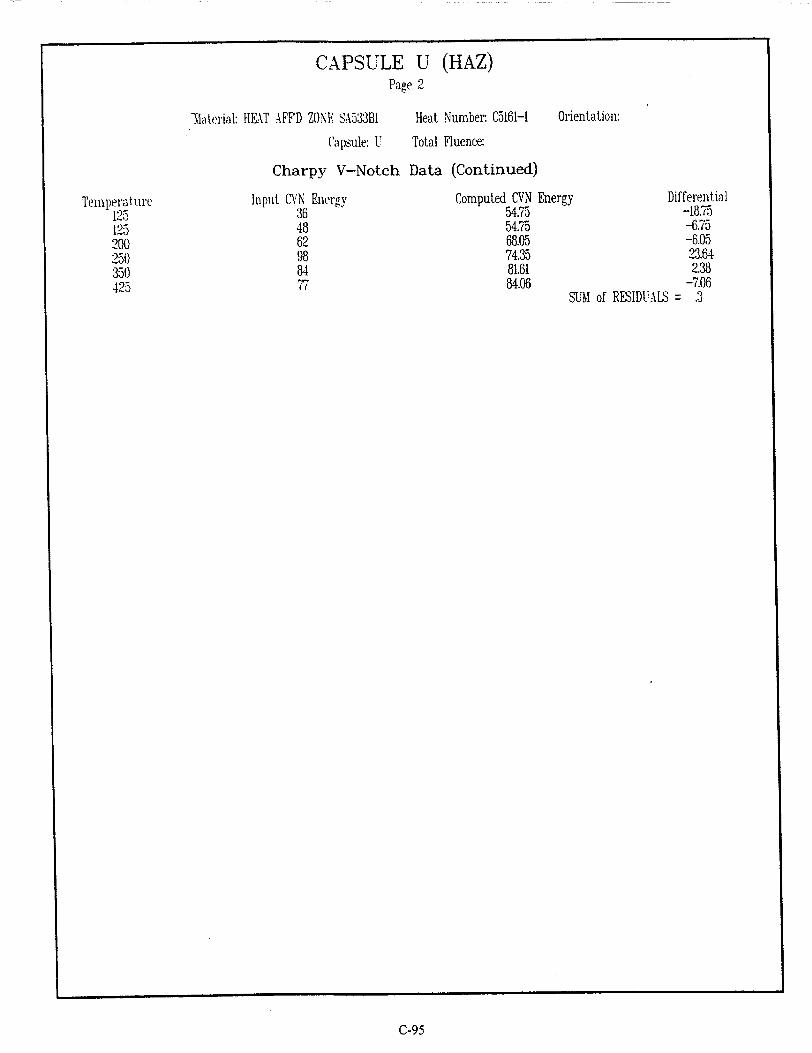
CAPSULE U (HAZ) Page 2
laterial: HEAT AFF'D ZONE SA533B1 Heat Number: C5161-1 Orie
(Capsule: U Total Fluenoe:
Charpy V-Notch Data (Continued)
Input CVN Energy Computed CVN Energy 36 54.75 48 54.75 62 68.05 98 74.35 84 81.61 7 84.06
Sl
entation:
Differential -18.75 -6.75 -6.05 23.64 2.38
-7.06 UM of RESIDUALS = .3
C-95
Tempera t ure 125 125 200 250 350 425

CAPSULE X (HAZ)
CVGRAPH 4.1 Hyperbolic Tangent Curve Printed at 12-533:42 on 04-11-2000 Page 1
Coefficients of Curve 3
A 51.69 B 49.5 C = 160.82 TO = 101.71
Equation is. CVN
Upper Shelf Energy: 101.19 Fixed Temp. at 30 ft-lbs:
Material: HEAT AFF'D ZONE SA533BI
Capsule: X
A + B * I tanh((T - TO)/C) ]
26 Temp. at 50 ft-lbs:
Heat Number: C5161-1
Total Fluence:
96.1 Lower Shelf Energy: 2.19 Fixed
Orientation:
-300 -200 -100 0 100 200 300 400
Temperature in Degrees F Data Set(s) Plotted
Plant: DC2 Cap: X Material: HEAT AFFD ZONE SA533BI Ori: Heat #:
Charpy V-Notch Data
ature Input CV. Energy Computed CVN Energy
18 23.99 0 29 36.3
36 36.3 5 2.1 43.55 575 43.55
35 57 58.81 5 91 58.81 '5 58 72.81
500
C5161-1
Differential
-5.99 -7.3 -.3
-19.55 31.44
-1.81 35.18
-14.81
**** Data continued on next page ****
C-96
z bt CL
Temper•
0 5t 51
17
600

CAPSULE X (HAZ) Page 2
Mlaterial: HEAT AFFD ZONE SA533B1
Capsule: X
Charpy V-Notch
Input CVN Envrgy 48 58 97 113 123 71 102
Heat Number. C5161-1
Total Fluence:
Data (Continued)
Computed CVN Ene 72.81 78.67 90.91 90.91 93.44 93.44 95.39
Orientation:
,rgy Differential -24.81 -20.67
6.08 ".08 29.55
-2.44 6.6
SUM of RESIDUALS = 13.22
C-97
Tenipeiatuire 175 200 275 275 300 300 325
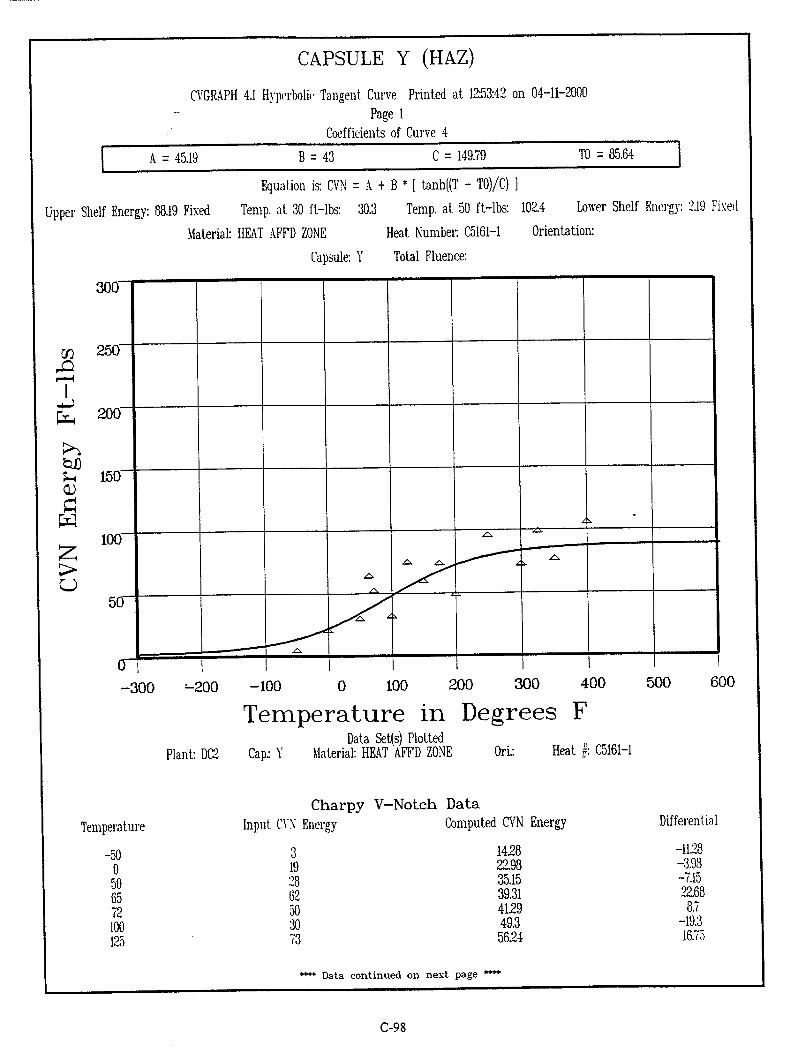
CAPSULE Y (HAZ)
CVGRAPH 4.1 Hyperbolic Tangent Curve Printed at 12:53:42 on 04-11-2000 Page 1
Coefficients of Curve 4
A= 45.19 B =43 C =149.79 TO = 85.64
Equation is: CVN = A + B * [ tanh((T - TO)/C) ]
Upper Shelf Energy: 88.19 Fixed Temp. at 30 ft-lbs: 30.3
Material: HEAT kFF'D ZONE
Capsule: Y
Temp. at 50 ft-lbs: 102.4
Heat Number C5161-1
Total Fluence:
Lower Shelf Energy: '2.19 Fixed
Orientation:
ý a -
0 100
Temperature in Data Set(s) Plotted
Plant: DC2 Cap: Y Material: HEAT AFFD ZONE
Cha Input CVN Energy
3 19 28 62 50 30 73
200 300
Degrees400
F
Ori.: Heat #: C5161-1
rpy V-Notch Data Computed CVN Energy
1428 22.98 35.15 39.31 4129 49.3 5624
**** Data continued on next page *'
C-98
U)
T250
200
150
100-"
3007_________________________________________
S.
0-300 -200 -100 500 600
Temperature
-50 0 50 65 72 100 125
Differential
-1128 -3.98 -7.15 22.68 8.7
-19.3 16.75
r-ý -

CAPSULE Y (HAZ) Page 2
- Material: HEAT AFF'D ZONE Heat Number C5161-1 Orientation:
Capsule: Y Total Fluence:
Charpy V-Notch Data (Continued)
Input CVN Energy 58 72 47 94 71 97 75 104
Computed CVN Energy 62.61 68.18 72.85 79.57 83.55 84.81 85.75 86.92
Differential -4.61
3.81 -25.85
14.42 -12.55
12.18 -10.75
17.07 UM of RESIDUALS = .14
C-99
Temperature 150 175 2100 250 300 325 350 400

CAPSULE V (HAZ)
CVGRAPH 4.1 Hyperbolic Tangent Curve Printed at 12:53:42 on 04-11-2000 Page 1
Coefficients of Curve 5
A= 36.75 B = 34.55 C = 161.78 TO = 96.09
Upper Shelf Energy: 71.3 Fixed Tern
Material: HEA
Equation is- CVN = A + B * [ tanh((T - TO)/C) ]
p. at 30 ft-lbs: 64 Temp. at 50 ft-lbs.
T AFF'D ZONE Heat Number: C5161-1
Capsule: V Total Fluence:
161.4 Lower Shelf
Orientation:
Energy: 2.19 Fixed
CF2
z
-300 -200 -100 0 100 200 300
Temperature in Degrees Data Set(s) Plotted
Plant: DC2 Cap- V Material: HEAT AFFD ZONE Ori: H
400 500
F
eat f. C5161-1
Charpy V-Notch Data
Input CVN Energy Computed CVN Energy
7 17 14 26 48 28
11.95 18.34 18.34 22.47 27.16 31.64
**** Data continued on next paae *'*
C-lO0
600
Temperature
-50 0 0 25 50 72
Differential
-4.95 -1.34 -4.34
3.52 20.83
-3.64

CAPSULE V (HAZ) Page 2
Heat Number C5161-1 Orientation:
Capsule: V Total Fluence:
Charpy V-Notch Data (Continued)
Input CVN Energy 26 34 47 49 59 43 68 76 70
Computed CVN Energy 35A4 37.58 42.85 47.85 52.38 56.31 62.32 66.15 68.42
Differential -9A4 -3.58
4.14 1.14
-.38 -13.31
5.67 9.84 1.57
'UM of RESIDUALS = 5.71
C-I01
Temperature 90 100 125 150 175 200 250 300 350
" Material: HEAT AFF'D ZONE

UNIRRADIATED (HAZ)
CVGRAPH 4.1 Hyperbolic Tangent Curve Printed at 15:47:01 on 04-11-2000 Page 1
Coefficients of Curve 1
A= 56.86 B = 55.86 C = 360.03 TO = -4125
Shelf LE- I Fixed Orientation:
Equation is-. LE. = A + B * I tanh((T - TO)/C) I
Upper Shelf LE.: 112.73 Temperature at LE. 35: -190.1 Lower
Material: HEAT AFF'D ZONE SA533BI Heat Number: C5161-1
Capsule: UNIRR Total Fluence:
200
150
O00
0~
-300 -200 -100 0 100 200 300
Temperature in Degrees Data Set(s) Plotted
Plant: DC2 Cap.: UNIRR Material: HEAT AFFD ZONE SA533B1 Ori:
Charpy V-Notch Data
ure Input Lateral Expansion Computed LE
72 53 33 46 34 31 51 35 58
40A8 40.48 40.48 47B3 47.83 47.83 617 61.7 6W7
400
F500 61
Heat #. C5161-l
Differential
31.51 12.51
-7.48 -1.83
-13.83 -16.83 -10.7 -26.7 -3.7
"*** Data continued on next page "*
C-102
°S,
Temperati
-150 -150 -150 -100 -100 -100 -10 -10 -10
00
S

UNIRRADIATED Page 2
-Material: HEAT AFFD ZONE SA533B1
Capsule: UNIRR
Charpy V-Notch
Input Lateral Expansion 82 81 85 8490 91 87 81 85
Heat Number: C5161-1
Total Fluence:
Data (Continued)
Computed LE. 70.73 70.73 70.73 80.97 80.97 80.97 90.55 90.55 90.55
Orientation:
Differential 1126 1026 1426 3.02 9.02 10.02
-3.55 -955 -5.55
SUM of RESIDUALS = Z09
c-I103
(HAZ)
Temperature 50 50 50
125 125 125 210 210 210

-300 -200 -100 0 100
Temperature200 300
in DegreesData Set(s) Plotted
Plant: DC2 Cap.: U Material: HEAT AFFD ZONE SA533B1 Ori: Heat .: C5161-1
Charpy V-Notch Data
Input Lateral Expansion Computed LK
11L36 "20 16.89 1:.5 20.36 8•.5 24.3
28.63 4.1 3327 36 38.08
32. 3827
* Data continued on next page ý*
C-104
O9 Pl-4
400 500 F
600
Temperature
-100 -50 -25
0 25 50 75 76
Differential
-9.36 3.1 -6.86
14.19 -1.63 10.72
-2.08 -5.7(
CAPSULE U (HAZ)
CVGRAPH 4.1 Hyperbolic Tangent Curve Printed at 15:47:01 on 04-11-2000 Page 1
Coefficients of Curve 2
A 38.44 [1 = 37.44 C = 193.47 TO = 76.17
Equal-ion is:. LE. = A + B* t tanh((T - TO)/C) I
Upper Shelf LE.: 75.89 Temperature at LE. 35: 59 Lower Shelf LE.: I Fixed
Material: HEAT AFFD ZONE SA533B1 Heat Number. C5161-1 Orientation:
Capsule: U Total Fluence:
200F
150
100
500
40
I

CAPSULE U (HAZ) Page 2
1laterial: HEAT AFFD ZONE SA533BI Heat Number: C5161-1
Capsule: U Total Fluence:
Charpy V-Notch Data (Continued)
Input Lateral Expansion Computed LE. 40 47.57 47 47.57
58.5 59.5 72 65.17 70 71.69 73 73.89
Orientation:
Differential - (.-. 5)
-1 6.82
-1.69 -.89
SUM of RESIDUALS = -2.62
C-105
Temperature 125 125 200 250 350 425

Equalion is: LE. = A + B * [ tanh((T - TO)/C) I Temperature at LE. 35: 69.9 Lo
Material: HEAT AFFD ZONE SA533BI Capsule: X
Heat Number. C5161-1
Total Fluence:
wer Shelf LE- I Fixed Orientation:
600-300 -200 -100 0 100 200 300 400 500
Temperature in Degrees F
Plant: DC2 Cap- XData Set(s) Plotted
Material: HEAT AFFD ZONE SA533B1
Charpy V-Notch Data
Input Lateral Expansion
15 213 31 23 52 1-1 ,3 47
Ori: Heat #. C5161-1
DifferentialComputed LE.
22.13 30.99 30.99 36.03 36.03 46.71 46.71 5718
-7.13 -4.99 3
-13.03 15.96
-2.71 2628
-10.18
~**" Data continued on next page '
C-106
Upper Shelf LK: 88.65
U),
Temperature
0 50 550 75 75 125 125 175
CAPSULE X (HAZ)
CVGRAPH 4.1 Hyperbolic Tangent Curve Printed at 15:47:01 on 04-11-2000
Page 1 Coefficients of Curve 3
A= 44.82 11 = 43.82 C = 202.78 TO = 11625
I

CAPSULE X (HAZ) Page 2
Naterial: HEAT AFFD ZONE SA533B1 Heat Number. C5161-1
Capsule: K Total Fluence:
Charpy V-Notch Data (Continued)
Input Lateral Expansion Computed L.E. 45 57.18 55 61.96 80 73.5 84 73.5 81 76.35 67 76.35 76 78.73
Orientation:
Differential -1Z1B -6.96
6.49 10.49 4.64
-9.35 -2.73
SUM of RESIDUALS = -2.41
C-107
Temperature 175 200 275 275 300 300 325
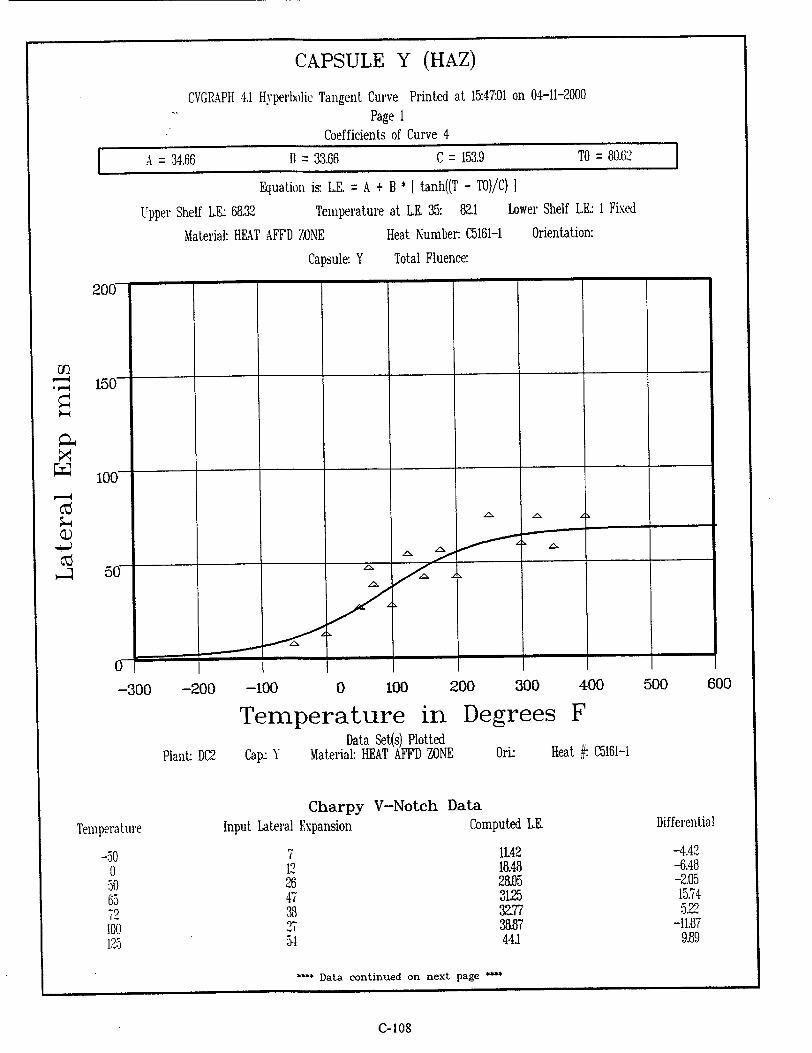
CAPSULE Y
CVGRAPH 4.1 Hyperbolic Tangent Curve Printed at 15:47:01 on 04-11-2000 "Page 1
Coefficients of Curve 4
A 34.66 B = 33.66 C = 153.9 TO = 80.62
Equation is:. LE. = A + B * I tanh((T - TO)/C) I Temperature at LE. 35: 82.1 LC
Material: HEAT AFFD ZONE
Capsule: Y
Heat Number. C5161-1
Total Fluence:
wer Shelf LE- I Fixed
Orientation:
�00� { - e - I p
150
100
50F
U
-300 -200 -100 0 100 200
Temperature in
Plant: DC2 Cap: YData Set(s) Plotted
Material: HEAT AFFD ZONE
Degrees F Ori: Heat #: C5161-1
Charpy V-Notch Data Input Lateral Expansion Computed LE.
7 12 26 47 38 27 54
1L42 18.48 2&05 3125 3.77 3X87 441
-* Data continued on next page *'
C-I108
Upper Shelf LE.: 68.32
F-0
300 400 500 600
Temperature
-50 0 50 65 72 100 125
Differential
-4.42 -6.48 -9.05
15.74 522
-11.87 9.89
(HAZ)

CAPSULE Y Page 2
- Material: HEAT AFFD ZONE Heat Number: C5161-1 Orientation:
Capsule: Y Total Fluence:
Charpy V-Notch Data (Continued)
Input Lateral Expansion 42 56 42 74 59 73 57 73
Computed LE. 48.88 53.05 56.55 6L61
64.64 65.62 66.35 6728
Differential -6.88
2.94 -14.55
12.38 -5.64
7.37 -9.35
SUM of RESIDUALS = -1.99
C-109
(HAZ)
Temperature 150 175 200 250 300 325 350 400

CAPSULE V (HAZ)
CVGRAPH 4.1 Hyperbolic Tangent Curve Printed at 15:47.-01 on 04-11-2000
Page 1 Coefficients of Curve 5
A 32.9 1 = 31.9 C= 161.42 TO = 13823
Upper Shelf LE.: 64.8
Equation is-. LE. = A + B * I tanh((T - TO)/C) I Temperature at LE. 35: 148.9 Lower Shelf LE. I Fixed
Material: HEAT AFFD ZONE Capsule: V
Heat Number. C5161-1 Total Fluence:
Orientation:
600-300 -200 -100 0 100 200 300 400 500
Temperature in Degrees FData Set(s) Plotted
Cap: V Material: HEAT AFFD ZONE
Charpy V-Notch Data
Input Lateral Expansion Cor
0 8 4 15
15
Ori: Heat #: C5161-1
nputed LE.
6.64 10.74 10.74 13.58 17
20.49
*** Data continued on next page *
C- 110
Plant: DC2
Temperature
-50 0 0 25 50 72
Differential
-6.64 -2.74 -6.74
1.41 11.99
-5.49
I

CAPSULE V (HAZ)Page 2
" Material: HEAT AFFD ZONE Heat Number- C5161-1
Capsule: V Total Fluence:
Charpy V-Notch Data (Continued)
Input Lateral Expansion 22 31 33 39 42 30 54 60 61
Computed LE. 23.63 25.47, 3028 3521 40.03 44.54 52.02 5722 60.49
Differential -1.63
5.52 2.71 3.78 1.96
-14.54 1.97 2.77.5 SUM of RESIDUALS = -5.15
C-llI
Orientation:
Temperature 90 too 125 150 175 200 250 300 350

UNIRRADIATED (HAZ)
CVGRAPH 4.1 Hyperbolic Tangent Curve Printed at 13:0500 on 04-11-2000 "Page 1
Coefficients of Curve 1
A 50 B=:50 C 179.59 TO -O
Equation i,7 Shearz = A + B * I tanh((T - TO)/C) I Temperature at 50% Shear. -80.4
Material: HEAT AFFD ZONE SA533BI Heat Number. C5161-1
Capsule: UNIRR Total Fluence:
Orientation:
41-300 -200 -100 0 100 200 300
Temperature in Degrees F Data Set(s) Plotted
Plant: DV2 Cap.: UNIRR Material: HEAT AFFD ZONE SA533BI OriL H
Charpy V-Notch Data
ire Input Percent Shear Computed Percent Shear
34 43 38 43 37 52 50 46 6 6
3155 31.55 31.55 4458 44.58 44.58 68B6 68.66 68.66
O 500 600
eat #: C5161-1
Differential
a44 11.44 6A4
-1.58 -7.50
7.41 -18.66 -L9.66 -.66
"*** Data continued on next page ***
C-I 12
CID
C.)
Temperatu
-150 -150 -150 -100 -100 -100 -10 -10 -10

UNIRRADIATED (HAZ) Page 2
Material: HEAT AFFD ZONE SA533BI
Capsule: UNIRR
Charpy V-Notch
Input Percent Shear 87 87 85 100 100 100 100 100 100
Heat Number. C5161-1 0;
Total Fluence:
Data (Continued)
Computed Percent Sh( 81.04 81.04 81.04 90.78 90.78 90.78 9621 9621 9621
rientatior:
ear Differential 5.95 5.95 3.95 921 921 921 3.78 3.78 3.78
SUM of RESIDUALS = 31.46
C-1 13
Temperature 50 50 50 125 125 125 210 210 210

Material: HEAT AFFD ZONE SA533BI Heat Number. C5161-1 Orientation:
Capsule: U Total Fluence:
600-300 -200 -100 0 100 200 300 400 500
Temperature in Degrees F
Plant: DC2 Cap.: UData Set(s) Plotted
Material: HEAT AFFD ZONE SA533BI
Charpy V-Notch Data
Input Percent Shear
Ori: Heat #: C5161-1
Computed Percent Shear
13.33 2329 29.9
37.47 45.7 54.17 62.41 62.73
Differential
-11.33 -829 .09
12.52 929 10.82
-2.41 -12.73
*** Data continued on nexct page ""
C-I 14
4-)
Temperature
-100 -50 -25
0 25 50 75 76
15 30 50 55 55 60 50
CAPSULE U (HAZ)
CVGRAPH 4.1 Hyperbolic Tangent Curve Printed at 13:05:00 on 04-11-2000
Page I Coefficients of Curve 2
S A= 50 B = 50 C= 147.14 TO = 37.67
Equation is: Shear:. = A + B * [ tanh((T - TO)/C) I
Temperature at 50,i Shear 37.6

CAPSULE U Page 2
"Ilaterial: HEAT AFFD ZONE SA533BI Heat Number- C5161-1 Orier
Capsule: U Total Fluence:
Charpy V-Notch Data (Continued)
Input Pereeni Shear Computed Percent Shear 70 76.61 70 76.61 95 90.08 100 94.71 100 98.58 100 99.48
SU
itation:
Differential -6.61 -6.61
4.91 5.28 1.41 .51
M of RESIDUAIS = -3.16
C-115
(HAZ)
Temnperature 125 125 200 250 350 425

Material: HEAT AFFD ZONE SA533B1
Capsule: X
Heat Number C5161-1 Total Fluence:
Orientation:
-300 -200 -100 0 100 200 300 400 500
Tpmnmorntire in Degrees FData Set(s) Plotted
Plant: DC2 Cap: X Material: HEAT AFF'D ZONE SA533B1 Ori: Heat ý C5161-1
Charpy V-Notch Data
Input Percent Shear
15 215 35
65 60
65
Computed Percent Shear
1722 33.3 33.3
43.62 43.62 65 65
81.68
'~Data continued on next page
C-1 16
600
Temperature
0 50 50 75 75 125 125 175
Differential
-229 -8.3 1.69
-18.62 21.37 -5
24.99 -16.68
CAPSULE X (HAZ)
CVGRAPH 4.1 Hyperbolic Tangent Curve Printed at 13:05:00 on 04-11-2000
"Page 1 Coefficients of Curve 3
A 50 B=50 C= U!4.19 TO = 89.64
Equation is-. Shear. = A + B * tanh((T - TO)/C) I
Temperature at 50'/. Shear 89.6
I

CAPSULE X (HAZ) Page 2
3laterial: HEAT AFFD ZONE SA533B1
Capsule: X
Charpy V-Notch
Input Percent Shear 70 90
100 t0o 100 100 100
Heat Number C5161-1 Orientation:
Total Fluence:
Data (Continued)
Computed Percent Shear 8168 8735 9625 9625 97.54 9754 9&4
SUM of RESIDUAL
Differential -11.68
2.64 3.74 3.74 2.45 2.45 1.59
S = 2.19
C-1 17
Temperature 175 200 275 275 300 300 325

-300 -200 -100 0 100
Temperature200 300
in DegreesData Set(s) Plotted
Plant: DC2 Cap.: Y Material: HEAT AFF'D ZONE
400
F
Orf: Heat #: C5161-1
Charpy V-Notch Data Input Percent Shear Computed Percent Shear
5 25 25 70 60 40 60
1425 24.02 37.55 42.17 4428 53.6 612
**** Data continued on next page ****
C-1 18
;-4 ct a)
Ici C/I 4-ý
600
Temperature
-50 0 50 65 72 100 125
Differential
-9.25 .97 -12.55
27.82 15.61
-13.36 -12
CAPSULE Y (HAZ)
CVGRAPH 4.1 Hyperbolic Tangent Curve Printed at 13:05-00 on 04-11-2000 "Page I
Coefficients of Curve 4
A 50 11 = 50 C = 155.53 TO 89.53
Equation i.,- Shear' = A + B * [ tanh((T - TO)/C)
Temperature at 50>': Shear: 89.5
Material: HEAT AFF'D ZONE Heat Number. C5161-1 Orientation:
Capsule: Y Total Fluence:
100 -
80
60F
207
0~
/0
500

CAPSULE Y (HAZ) Page 2
Material: HEAT AFFD ZONE Heat Number. C5161-1 Orientation:
Capsule: Y Total Fluence:
Charpy V-Notch Data (Continued)
Input Percent Shear Computed Percent Shear Differential 40 68.51 -28.51 90 75 14.99 70 80.54 -10.54 100 88.73 1126 100 93.74 6.25 100 95.38 4.61 100 96.6 3.39 100 98.18 1.81
SUM of RESIDUALS = 11.31
C-I 19
Temperature 150 175 200 250 300 325 350 400

A = 50 11=50 C =146.91 TO0=76AI
Equation is•: Shear,: = A + B * [ tanh((T - TO)/C) ]
Temperature at 50/ Shear: 76.4
Material: HEAT AFFD ZONE Heat Number. C5161-1 Orientation:
Capsule: V Total Fluence:
1007
8G-
60
41, 1)
20
-300 -200 -100 0 100
Temperature200 300
in Degrees
400
F500
Plant: DC2 Cap.: VData Set(s) Plotted
Material: HEAT AFFD ZONE Ori. Heat /. C5161-1
Charpy V-Notch DataInput Percent Shear
10 15 15 40 60 45
Computed Percent Shear
15.17 26.11 26.11 33.18 41.1 48.5
**** Data continued on next page ***
C-120
4I)
0l
7
(
I I. i Ir
/_________ -k �-*-i 1 1
7
___ _______ - -
600
Temperature
-50 0 0 25 50 72
Differential
-5.17 -11.11 -11.11
6.81 18.89 -3.5
CAPSULE V (HAZ)
CVGRAPH 4.1 Hyperbolic Tangent Curve Printed at 13:05:00 on 04-11-2000
Page 1 Coefficients of Curve 5

"Material: HEAT AFFD
Charl
Input Percen 60 70 55 75 75 65 100 100 100
CAPSULE V (HAZ) Page 2
ZONE Heat Number. C5161-1 Orient,
Capsule: V Total Fluence:
y V-Notch Data (Continued)
t Shear Computed Percent Shear 54.61 57.96 65.96 73.14 7928 84.32 91.39 95.45 97.64
SU
tion:
Differential 5.38 12.03
-10.96 1.85
-428 -19.32
8.6 4.54 2.35
M of RESIDUALS = -4.97
C-121
Temperature 90 100 125 150 175 200 250 300 350

D-0
APPENDIX D
DIABLO CANYON UNIT 2 SURVEILLANCE PROGRAM
CREDIBILITY ANALYSIS
Appendix D

D-1
INTRODUCTION:
Regulatory Guide 1.99, Revision 2 and 10 CFR Part 50.6 1, describe general procedures acceptable to the
NRC staff for calculating the effects of neutron radiation embrittlement of the low-alloy steels currently
used for light-water-cooled reactor vessels. Position C.2 of Regulatory Guide 1.99, Revision 2 and 10
CFR Part 50.61, describe the method for calculating the adjusted reference temperature and Charpy
upper-shelf energy of reactor vessel beltline materials using surveillance capsule data. These methods
can only be applied when two or more credible surveillance data sets become available from the reactor
in question.
There is only surveillance data available from the Diablo Canyon Unit 2 surveillance program for these
surveillance materials. To date there has been four surveillance capsules removed from the Diablo
Canyon Unit 2 reactor vessel. To use these surveillance data sets, they must be shown to be credible. In
accordance with the discussion of Regulatory Guide 1.99, Revision 2 and/or 10 CFR Part 50.61, there are
five requirements that must be met for the surveillance data to be judged credible.
The purpose of this evaluation is to apply the credibility requirements to the Diablo Canyon Unit 2
reactor vessel surveillance data and determine if the Diablo Canyon Unit 2 surveillance data is credible.
EVALUATION:
Criterion 1: Materials in the capsules should be those judged most likely to be controlling with regard
to radiation embrittlement.
The beltline region of the reactor vessel is defined in Appendix G to 10 CFR Part 50, "Fracture
Toughness Requirements", as follows:
"the reactor vessel (shell material including welds, heat affected zones, and plates or
forgings) that directly surrounds the effective height of the active core and adjacent
regions of the reactor vessel that are predicted to experience sufficient neutron radiation
damage to be considered in the selection of the most limiting material with regard to
radiation damage."
Appendix D

D-2
The Diablo Canyon Unit 2 reactor vessel consists of the following beltline region materials:
"* Intermediate Shell Plate B5454-1 (Heat Number C5161-1 ) "* Intermediate Shell Plate B5454-2 (Heat Number C5168-2) "* Intermediate Shell Plate B5454-3 (Heat Number C5161-2) "* Lower Shell Plate B5455-1 (Heat Number C5175-1) "* Lower Shell Plate B5455-2 (Heat Number C5175-2) "* Lower Shell Plate B5455-3 (Heat Number C5176-1) "* Intermediate Shell Axial Welds (Wire Heat Number 21935/12008)
"* Intermediate to Lower Shell Girth Weld (Wire Heat Number 10120) "* Lower Shell Axial Welds (Wire Heat Number 33A277)
The surveillance program was developed to the requirements of ASTM El 85-73. Intermediate shell plate B5454-1 had one of the highest IRTNDT values and one of the lowest initial upper shelf energy (IUSE) values of all beltline plate materials. In addition, intermediate shell plate B5454-1 had the highest copper and nickel contents of all beltline plate materials. Hence, intermediate shell plate B5454-1 was chosen as the most limiting.
The intermediate shell axial welds weldment had the highest IRTNDT value and the highest Cu, Ni, and P content of all beltline weld materials. Hence, weld heat number 21935/12008 was chosen as the most limiting.
Based on the above information, the Diablo Canyon Unit 2 surveillance program meets this criteria.
Criterion 2: Scatter in the plots of Charpy energy versus temperature for the irradiated and unirradiated conditions should be small enough to permit the determination of the 30 ft-lb temperature and upper shelf energy unambiguously.
Plots of Charpy energy versus temperature for the unirradiated and irradiated condition are presented Appendix C of this calc note.
Based on engineering judgment, the scatter in the data presented in these plots is small enough to permit the determination of the 30 ft-lb temperature and the upper shelf energy of the Diablo Canyon Unit 2 surveillance materials unambiguously. Hence, the Diablo Canyon Unit 2 surveillance program meets this criterion.
Criterion 3: When there are two or more sets of surveillance data from one reactor, the scatter of ARTNDT values about a best-fit line drawn as described in Regulatory Position 2.1 normally should be less than 28'F for welds and 177F for base metal. Even if the fluence
Appendix D
D-3
range is large (two or more orders of magnitude), the scatter should not exceed twice those
values. Even if the data fail this criterion for use in shift calculations, they may be credible
for determining decrease in upper shelf energy if the upper shelf can be clearly determined,
following the definition given in ASTM E185-82.
The functional form of the least squares method as described in Regulatory Position 2.1 will be
utilized to determine a best-fit line for this data and to determine if the scatter of these ARTNDT
values about this line is less than 28'F for welds and less than 17'F for the plate.
Following is the calculation of the best fit line as described in Regulatory Position 2.1 of Regulatory
Guide 1.99, Revision 2.
Appendix D
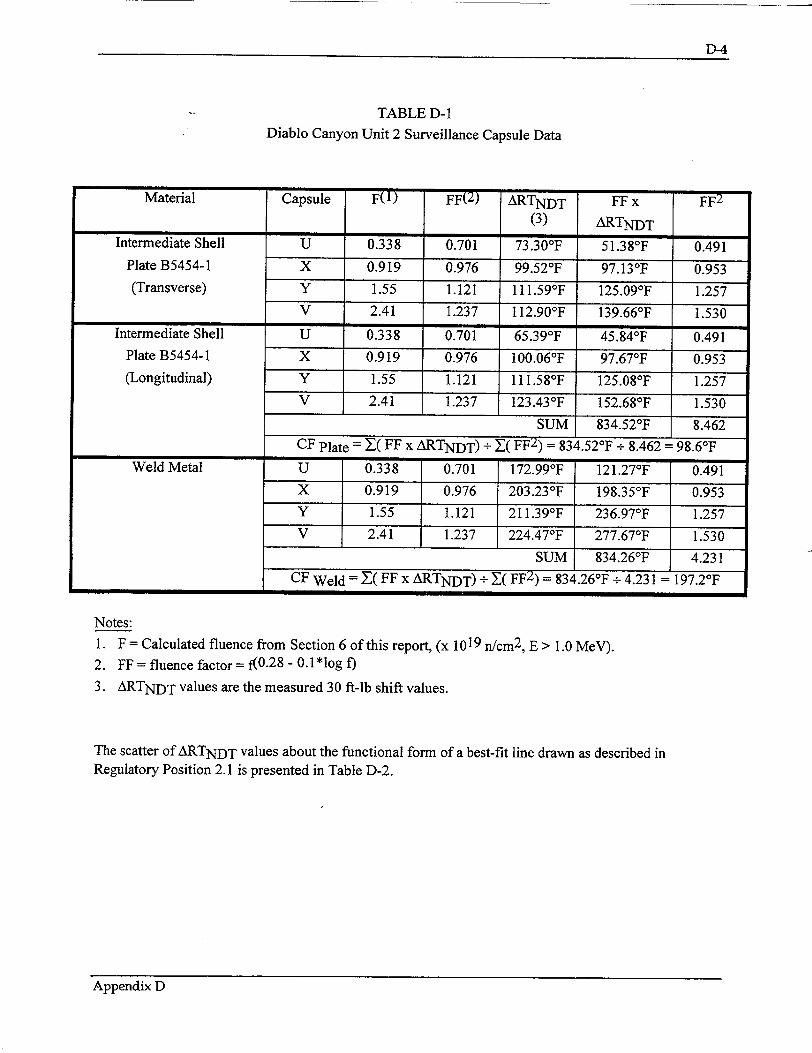
D-4
TABLE D- 1 Diablo Canyon Unit 2 Surveillance Capsule Data
Material Capsule F(1 FF(2) ARTNDT FF x FF2 (3) ARTNDT
Intermediate Shell U 0.338 0.701 73.30°F 51.38°F 0.491 Plate B5454-1 X 0.919 0.976 99.52°F 97.13°F 0.953 (Transverse) Y 1.55 1.121 111.59 0F 125.09°F 1.257
V 2.41 1.237 112.90°F 139.66°F 1.530
Intermediate Shell U 0.338 0.701 65.39°F 45.84°F 0.491 Plate B5454-1 X 0.919 0.976 100.060F 97.67°F 0.953 (Longitudinal) Y 1.55 1.121 111.580 F 125.08°F 1.257
V 2.41 1.237 123.43°F 152.68°F 1.530
SUM 834.52°F 8.462 CF Plate = Z( FF x ARTNDT) + .( FF2 ) = 834.52°F + 8.462 = 98.6 0F
Weld Metal U 0.338 0.701 172.99°F 121.27°F 0.491 X 0.919 0.976 203.23°F 198.35°F 0.953 Y 1.55 1.121 211.39°F 236.97°F 1.257 V 2.41 1.237 224.47°F 277.67°F 1.530
SUM 834.26°F 4.231 CF Weld =( FF x ARTNDT) + Y-( FF2) = 834.260F ÷ 4.231 197.2 0F
Notes: 1. F = Calculated fluence from Section 6 of this report, (x 1019 n/cm 2 , E> 1.0 MeV). 2. FF = fluence factor = f(O. 2 8 - 0.1*log f)
3. ARTNDT values are the measured 30 ft-lb shift values.
The scatter of ARTNDT values about the functional form of a best-fit line drawn as described in Regulatory Position 2.1 is presented in Table D-2.
Appendix D

D-5
TABLE D-2
Best Fit Evaluation for Diablo Canyon Unit 2 Surveillance Materials
Base Material CF FF Measured Best Fit Scatter of < 171F (Base
(OF) ARTNDT ARTNDT ARTNDT Metals)
(30 ft-lb) (OF) (OF) < 28°F (Weld
(OF) Metal)
Intermediate Shell 98.6 0.701 73.3 69.1 4.2 Yes
Plate B5454-1 98.6 0.976 99.5 96.2 3.3 Yes
(Transverse) 98.6 1.121 111.6 110.5 1.1 Yes
98.6 1.237 112.9 122.0 -9.1 Yes
Lower Shell 98.6 0.701 65.4 69.1 -3.7 Yes
Plate B5454-1 98.6 0.976 100.1 96.2 3.9 Yes
(Longitudinal) 98.6 1.121 111.6 110.5 1.1 Yes
98.6 1.237 123.4 122.0 1.4 Yes
Weld Metal 197.2 0.701 173.0 138.2 34.8 No
197.2 0.976 203.2 192.5 10.7 Yes
197.2 1.121 211.4 221.1 -9.7 Yes
197.2 1.237 224.5 243.9 -19.4 Yes
Table D-2 indicates that the plate data scatter is within the acceptable range for credible surveillance plate
data. One of the weld data points has a scatter value that is greater than a la of 28 0F. However, it is
expected that 1 would bound approximately 69% of the data. In this case I a encompasses 75% of the
data. Hence, it is statistically acceptable for one value to be out side of the lc bound. Therefore, the
weld metal data meets the intent of this criteria. However, since the weld metal is not expected to be
limiting for the life of the vessel, its data may be conservatively deemed to be not credible without
impacting plant operating margins.
Criterion 4: The irradiation temperature of the Charpy specimens in the capsule should match the
vessel wall temperature at the cladding/base metal interface within +/- 25 0F.
The capsule specimens are located in the reactor between the core barrel and the vessel wall and
are positioned opposite the center of the core. The test capsules are in baskets attached to the
Neutron Pads. The location of the specimens with respect to the reactor vessel beltline provides
assurance that the reactor vessel wall and the specimens experience equivalent operating
conditions such that the temperatures will not differ by more than 250F. Hence, this criteria is
met.
Appendix D

D-6
Criterion 5: The surveillance data for the correlation monitor material in the capsule should fall within the scatter band of the data base for that material.
The Diablo Canyon Unit 2 surveillance program does not contain correlation monitor material (SRM HSST02 A533B Class 1). Therefore, this criteria does not apply.
Based on the preceding responses to all five criteria of Regulatory Guide 1.99, Revision 2, Section B and 10 CFR 50.61, the Diablo Canyon Unit 2 surveillance data are credible.
Appendix D


![Diablo Canyon Draft Report [shared]](https://static.fdocuments.us/doc/165x107/6240f5837ae9a70fd615d117/diablo-canyon-draft-report-shared.jpg)