ANALYSIS OF AUTOMOTIVE TURBOCHARGER NONLINEAR … · 2018-12-22 · Keun Ryu, Manish Thorat, Ameen...
100
ANALYSIS OF AUTOMOTIVE TURBOCHARGER NONLINEAR VIBRATIONS INCLUDING BIFURCATIONS A Thesis by ARIAN VISTAMEHR Submitted to the Office of Graduate Studies of Texas A&M University in partial fulfillment of the requirements for the degree of MASTER OF SCIENCE August 2009 Major Subject: Mechanical Engineering
Transcript of ANALYSIS OF AUTOMOTIVE TURBOCHARGER NONLINEAR … · 2018-12-22 · Keun Ryu, Manish Thorat, Ameen...

ANALYSIS OF AUTOMOTIVE TURBOCHARGER NONLINEAR
VIBRATIONS INCLUDING BIFURCATIONS
A Thesis
by
ARIAN VISTAMEHR
Submitted to the Office of Graduate Studies of Texas A&M University
in partial fulfillment of the requirements for the degree of
MASTER OF SCIENCE
August 2009
Major Subject: Mechanical Engineering

ANALYSIS OF AUTOMOTIVE TURBOCHARGER NONLINEAR
VIBRATIONS INCLUDING BIFURCATIONS
A Thesis
by
ARIAN VISTAMEHR
Submitted to the Office of Graduate Studies of Texas A&M University
in partial fulfillment of the requirements for the degree of
MASTER OF SCIENCE
Approved by: Chair of Committee, Luis San Andrés Committee Members, Alan Palazzolo
Monique Hite Head Head of Department, Dennis L. O’Neal
August 2009
Major Subject: Mechanical Engineering

iii
ABSTRACT
Analysis of Automotive Turbocharger Nonlinear Response
Including Bifurcations. (August 2009)
Arian Vistamehr, B.S., Texas A&M University
Chair of Advisory Committee: Dr. Luis San Andrés
Automotive turbochargers (TCs) increase internal combustion engine power and
efficiency in passenger and commercial vehicles. TC rotors are usually supported on
floating ring bearings (FRBs) or semi-floating ring bearings (SFRBs), both of which are
inexpensive to manufacture. However, fluid film bearings are highly nonlinear
components of TC units and contribute to the complex behavior (i.e. bifurcations and
frequency jumps between a first whirl frequency and a second whirl frequency) of the
entire rotor-bearing system (RBS). The frequency jump phenomenon concerns the TC
manufacturing industry due to increased levels of noise generation. This thesis presents
progress on assessing the effects of some bearing parameters and operating conditions
on the RBS dynamic forced performance and the frequency jump phenomenon.
A fluid film bearing model is integrated into a finite element rotordynamics
computational model for numerical prediction of the TC linear and nonlinear (time
transient) forced response. Since automotive TCs operate with variable rotational speed,
predictions are conducted with shaft acceleration/deceleration.
Over most of its operating speed range, TC rotor nonlinear response predictions
display two subsynchronous whirl frequencies ω1 and ω2 representing a conical mode
and a cylindrical bending mode, respectively. At low shaft speeds ω1 is present up to a
shaft speed (Ωbifurcation), where there is a frequency jump from ω1 to ω2. The second whirl
frequency may persist up to the highest shaft speeds (depending on operating
conditions). Results show during rotor deceleration the Ωbifurcation may be different from
the one during rotor acceleration (hysteresis).
Predictions show the following factors delay the Ωbifurcation: increasing oil supply
pressure, decreasing oil supply temperature, and increasing shaft acceleration. Also,

iv
rotor imbalance distribution greatly affects Ωbifurcation and the shaft amplitude of total
motion.
Overall, this study shows the sensitivity of bifurcations and frequency jump
phenomenon in TC nonlinear response due to various bearing parameters and operating
conditions. Further analysis is required to generalize these findings and to assess the
effect of other bearing parameters (i.e. clearances, outer film length, ring rotation, etc.)
on this phenomenon. In addition further validation of the predictions against test data is
required for refinement of the predictive tool.

v
DEDICATION
I dedicate my thesis to my parents, Nasrin and Homayoun Vistamehr. I admire
them for sacrificing the joy of living with the family, and for letting me go thousands of
miles away from home to achieve a better education, and a refined mindset. I thank them
for their extraordinary vision, their unconditional love and continuous support.
I also dedicate my thesis to all the interested readers in academia and industry.

vi
ACKNOWLEDGEMENTS
I would like to thank Honeywell Turbo Technologies for giving me the
opportunity to work on fascinating research projects with applications in industry. I
would like to especially thank Dr. Kostandin Gjika for his guidance, Dr. Sherry Xia for
providing the rotor-bearing specifications, and Dr. Chris Groves for educating me about
turbochargers.
I thank my advisor, Dr. Luis San Andrés, who made every possible effort to help
me learn and advance. It was an honor and a privilege working with him.
I also thank my colleagues and friends in Tribology Group for their continuous
support and encouragement. I especially thank Dr. Adolfo Delgado, Ash Maruyama,
Keun Ryu, Manish Thorat, Ameen Aboel-Hassan, Thomas Abraham Chirathadam,
Yaying Niu, and Shraddha Sangelkar for their invaluable assistance. I would also like to
thank Mr. John William Kimla for his support and encouragement throughout the past
few years of my graduate studies.
Last but not least, I would like to thank my committee members, Dr. Alan
Palazzolo and Dr. Monique Hite Head, for taking the time and making the effort to
participate in my final defense. I especially thank Dr. Dara Childs for taking an active
role in educating me and providing invaluable feedback throughout my graduate studies.

vii
TABLE OF CONTENTS
Page ABSTRACT ................................................................................................................... iii DEDICATION ............................................................................................................... v ACKNOWLEDGEMENTS ........................................................................................... vi LIST OF FIGURES......................................................................................................... ix LIST OF TABLES .........................................................................................................xiii CHAPTER I INTRODUCTION ................................................................................... 1 CHAPTER II FREQUENCY JUMP PHENOMENON IN TC ROTORDYNAMIC RESPONSE (BETWEEN THE 1ST AND
THE 2ND WHIRL FREQUENCIES) .................................................. 4 CHAPTER III LITERATURE REVIEW .................................................................... 11
Objective ...............................................................................................18 Prior Work at TAMU ............................................................................18
CHAPTER IV OVERVIEW OF THERMO-HYDRODYNAMIC MODEL
FOR SFRB FORCED RESPONSE AND FINITE ELEMENT MODEL FOR TURBOCHARGER STURCTURE............................. 21
Predicted SFRB Performance Characteristics........................................24 CHAPTER V LINEAR TURBOCHARGER RESPONSE PREDICTIONS ............ 28 CHAPTER VI NONLINEAR ROTORDYNAMIC PREDICTIONS ......................... 35
Baseline Case ........................................................................................36 The Effect of Oil Supply Pressure on Jump Phenomenon ....................47 The Effect of Oil Supply Temperature on Jump Phenomenon .............50 The Effect of Bearing Inner Film Length on Jump Phenomenon .........54 The Effect of Rotor Acceleration/Deceleration on Jump Phenomenon 56 The Effect of Imbalance Distribution on Jump Phenomenon ............... 60

viii
Page CHAPTER VII CONCLUSIONS .................................................................................. 68 REFERENCES ............................................................................................................... 72 APPENDIX A PHYSICAL PROPERTIES OF TURBOCHARGER ROTOR
AND SFRB .......................................................................................... 76 APPENDIX B FILTERED MODE SHAPES............................................................... 77 APPENDIX C PREDICTED WATERFALLS OF TC ROTOR MOTION
FOR VARIOUS CASES...................................................................... 79 APPENDIX D ROTOR BEARING SYSTEM EQUATIONS OF MOTION .............. 85 VITA ............................................................................................................................... 87

ix
LIST OF FIGURES
Page Figure 1 Turbocharger supported on SFRB........................................................... 1 Figure 2 Waterfalls of TC center housing acceleration for 30°C
oil inlet temperature and 4bar oil inlet pressure ...................................... 6 Figure 3 Waterfalls of TC center housing acceleration for 100°C
oil inlet temperature and 4bar oil inlet pressure ...................................... 7 Figure 4 Waterfalls of TC center housing acceleration as the shaft
accelerates ............................................................................................... 8 Figure 5 Waterfalls of TC center housing acceleration as the shaft
accelerates, TC supported on FRBs ........................................................ 8 Figure 6 Waterfalls of TC center housing acceleration for 30°C oil
inlet temperature and 4bar oil inlet pressure; (a) low imbalance amount, (b) high imbalance amount ............................................................ 9
Figure 7 Photograph of typical SFRB and center housing with
oil feed lines ............................................................................................ 22 Figure 8 Schematic cross section view of TC rotor and SFRB ............................ 23 Figure 9 TC finite element rotor model .................................................................... 24 Figure 10 Predicted oil films exit temperature versus rotor speed
in TC compressor and turbine bearings .................................................. 25 Figure 11 Predicted normalized power loss at the inner film of
the compressor and turbine bearings versus rotor speed......................... 26 Figure 12 Predicted effective oil film viscosity versus rotor speed
for the compressor and turbine bearings ................................................. 26 Figure 13 Predicted film clearance ratios versus rotor speed
for the compressor and turbine bearings ................................................. 27 Figure 14 Predicted journal eccentricity relative to ring versus
rotor speed for the compressor and turbine bearings .............................. 27

x
Page Figure 15 Schematic view of rotor coordinate system
for analysis of rotor motions ................................................................... 29 Figure 16 Predicted SFRB normalized force coefficients; (LEFT)
compressor bearing, (RIGHT) turbine bearing; (a) and (b) inner film stiffness k ; (c) and (d) inner film damping
ic ; (e) and (f) outer film damping coefficients oc ................................... 30 Figure 17 (TOP) TC damped natural frequency map and mode
shapes at rotor speed of 95 krpm, (BOTTOM) damping ratio versus rotor speed ........................................................................... 32
Figure 18 TC damped natural frequency map and mode shapes
for the unstable modes............................................................................. 33 Figure 19 Predicted amplitude of TC synchronous response at
compressor end........................................................................................ 34 Figure 20 Waterfalls of predicted TC shaft motion at the compressor
end; horizontal direction; baseline case .................................................. 37 Figure 21 Waterfalls of predicted TC shaft motion at the compressor
end, vertical direction; ; (TOP) waterfall, (BOTTOM) contour map; baseline case...................................................................... 38
Figure 22 Total TC shaft motion (pk-pk) amplitude at the compressor
end during rotor acceleration and deceleration; baseline case ............... 39 Figure 23 Prediction from transient shaft speed analysis ........................................ 41 Figure 24 Compressor ring displacements along the
vertical direction versus time .................................................................. 41 Figure 25 Subsynchronous whirl amplitudes versus shaft speed,
rotor accelerates....................................................................................... 42 Figure 26 Subsynchronous whirl amplitudes versus shaft speed,
rotor decelerates ...................................................................................... 43 Figure 27 Subsynchronous whirl frequencies versus rotor speed;
acceleration = +500Hz/s; baseline case................................................... 44

xi
Page Figure 28 Subsynchronous whirl frequencies versus rotor speed;
deceleration = -500Hz/s; baseline case ................................................... 45 Figure 29 Subsynchronous whirl frequencies and damped natural
frequencies versus rotor speed ................................................................ 45 Figure 30 Predicted whirl frequency ratio versus rotor speed;
acceleration = +500Hz/s; baseline case................................................... 46 Figure 31 Predicted whirl frequency ratio versus rotor speed;
deceleration = -500Hz/s; baseline case ................................................... 47 Figure 32 Predicted subsynchronous whirl frequencies versus
rotor speed; acceleration= +500Hz/s; oil supply pressure reduced by 33%....................................................................................... 48
Figure 33 Predicted subsynchronous whirl frequencies versus
rotor speed; deceleration= -500Hz/s; oil supply pressure reduced by 33%....................................................................................... 49
Figure 34 Predicted amplitude of total shaft motions at the
compressor end during rotor acceleration and deceleration; baseline and reduced supply pressure cases ............................................ 49
Figure 35 Predicted effective oil film viscosity at three oil
supply temperatures................................................................................. 51 Figure 36 Predicted subsynchronous whirl frequencies versus
rotor speed; reduced oil supply temperature ........................................... 52 Figure 37 Predicted subsynchronous whirl frequencies versus
rotor speed; increased oil supply temperature......................................... 53 Figure 38 Predicted subsynchronous whirl frequencies versus
rotor speed; bearing inner length increased by 15%. .............................. 55 Figure 39 TC total shaft motion amplitude at compressor end
during rotor acceleration and deceleration; speed ramp rates= 0Hz/s, 250Hz/s, 500Hz/s, 750Hz/s............................................... 57
Figure 40 Predicted subsynchronous whirl frequencies versus rotor
speed; (TOP) rotor acceleration = +250Hz/s; (BOTTOM) rotor deceleration = -250Hz/s.................................................................. 58

xii
Page Figure 41 Predicted subsynchronous whirl frequencies versus rotor
speed; (TOP) rotor acceleration = +750Hz/s; (BOTTOM) rotor deceleration = -750Hz/s.................................................................. 59
Figure 42 Total TC shaft motion amplitude at the compressor
end during rotor acceleration and deceleration; imbalance distribution: opposed couple. .................................................................. 61
Figure 43 Predicted subsynchronous whirl frequencies versus
rotor speed; imbalance distribution: opposed couple .............................. 62 Figure 44 Predicted subsynchronous whirl frequencies versus
rotor speed; imbalance distribution: turbine back out of phase .............. 64 Figure 45 Total TC shaft motion amplitude at the compressor
end during rotor acceleration and deceleration; imbalance distribution: turbine-back-out-of-phase................................................... 65
Figure 46 Predicted subsynchronous whirl frequencies versus rotor
speed; imbalance distribution: turbine back out of phase; imbalance amount doubled...................................................................... 66
Figure 47 Total TC shaft motion amplitude at the compressor end during
rotor acceleration and deceleration; imbalance distribution: turbine-back-out-of-phase; imbalance amount doubled.......................... 67

xiii
LIST OF TABLES
Page Table 1 Parameters for speed transient, time transient......................................... 35 Table 2 The internal and combined relations between the two
subsynchronous whirl frequencies (ω1 and ω2) and the Ωb..................... 71

1
CHAPTER I
INTRODUCTION
Turbochargers (TCs) increase internal combustion engine power and efficiency
in passenger and commercial vehicles. TCs consist of a thin shaft with a turbine wheel
friction welded at one end and compressor wheel (slide in) at the other end. TC rotors
are usually supported on floating ring bearings (FRBs) or semi-floating ring bearings
(SFRBs), both of which are inexpensive to manufacture and last longer than other types
of bearings (i.e. ball bearings). Figure 1 depicts a TC supported on a SFRB. Oil is
supplied through the center housing to the compressor and turbine fluid film bearings.
Note the anti-rotation pin hole in the middle of the SFRB. SFRBs are pinned and
restrained from rotation. Therefore, the motion in SFRBs is limited to precession,
whereas in FRBs the ring is free to rotate. As the lubricant is supplied, (S)FRBs form
two fluid films in series; the inner film (between the journal and inner ring) and the outer
film (between the outer ring and center housing). SFRBs are advantageous over FRBs
due to lesser power loss [1] .
Turbine wheel Compressor wheel
Oil supplyTurbine Bearing Oil Supply Hole
Compressor Bearing Oil Supply Hole
SFRB Anti-Rotation Pin Hole
Figure 1: Turbocharger supported on SFRB
____________ This thesis follows the style of Journal of Engineering for Gas Turbines and Power.

2
Hot exhaust gas from the engine drives the turbine wheel that is connected
through the shaft to the compressor wheel. The compressor feeds air to the engine intake
manifold. This process improves the air/fuel ratio for a more efficient and a cleaner
combustion. Air/fuel ratio is one of the main factors influencing the composition of the
exhaust emission. For instance, insufficient amount of air mixing with the fuel in the
combustion chamber, leads to increased hydrocarbons (HCs) emissions in diesel engines
[2].
Fluid film bearings provide viscous damping. However, in some instances these
bearings are prone to induce a condition called subsynchronous oil whirl, where the RBS
(rotor-bearing system) motion response contains one or more frequencies at fractions of
the rotor (and ring in case of a FRB) rotational frequency. Fluid film bearings are highly
nonlinear components of TC units and responsible for the complex behavior of the entire
RBS [3].
TC rotors operate at high rotational speeds. Due to heat generation and shaft and
casing thermal gradients, changes in lubricant properties (i.e. viscosity) and thermal
growth of the rotor and the bearings must be considered. The inner and outer film
clearances, ring rotational speed (in FRBs), and journal and ring eccentricities are
functions of the shaft rotational speed, shaft temperature, and oil inlet pressure and
temperature. These parameters play a crucial role in the RBS response behavior [4]. As
the rotor speed increases, subsynchronous whirl motions appear with increasing
amplitudes. However, at high shaft speeds, sometimes due to fluid film bearing
nonlinearities, rotor imbalance can limit the amplitude of TC rotor subsynchronous
motions [5]. The TC shaft motion often reaches a limit cycle within the rotor-bearing
clearance physical limit, which allows TC units to operate safely at high speeds [6].
Turbocharger performance assessment involves rigorous testing which is both
costly and time consuming. Significant time and costs can be saved by replacing the
shop assessment with a proven predictive model, experimentally benchmarked. The
development and refinement of such model has been the goal of a research project [1],
[3-7] over nearly the past decade at Texas A&M University.

3
A fluid film bearing model [7], accounting for the thermal energy transport
between the fluid films and the bounding solids, predicts the hydrodynamic pressure
generation and bearing performance characteristics (i.e. inner/outer film clearances, oil
viscosities, lubricant flow rate, ring rotational speed, power loss and bearing reaction
forces). This flow model is integrated to a finite element rotordynamics code,
XLTRC2™ [8], for predicting linear and nonlinear rotordynamic responses. The
nonlinear predictive model assists the design and optimization of high performance, high
reliability TC RBS.

4
CHAPTER II
FREQUENCY JUMP PHENOMENON IN TC ROTORDYNAMIC
RESPONSE (BETWEEN THE 1ST AND THE 2ND WHIRL FREQUENCIES)
Figures 2-6 depict the waterfalls of measured TC center housing accelerations (at
the oil outlet location) provided by Honeywell Turbo Technologies (HTT) [9]. The TC
shaft is supported on a SFRB for results shown in Figures 2, 3, 4, and 6. Figure 5 depicts
similar waterfalls recorded in a TC supported on FRBs [10]. The horizontal axis shows
frequency content, the vertical axis shows the rotor speed, and the color intensity denotes
amplitude of acceleration. The following color pattern shows the increasing order of
response amplitude: dark blue, light blue, green, yellow, orange, and red. Therefore, red
corresponds to the highest acceleration amplitude. The oil inlet pressure and
temperature corresponding to the case in Fig. 2 are 4 bar and 30°C, respectively.
Synchronous and subsynchronous frequencies are labeled in all figures. According to
Ref. [10], at low shaft speeds (< 1,800 Hz = 108 krpm) the dominant whirl frequencies
are ω1 (conical mode) and 2ω1. In the speed range between 1,500 Hz and 1,800 Hz oil
whip phenomenon seem to occur, where the first whirl frequency (ω1) and its multiples
(2ω1 and 3ω1) lock (also known as whip) at the system natural frequency*. As shaft
speed (Ω) increases, the whirl motion, ω1, bifurcates to another branch of frequency, Ω -
ω2 (shaft speed minus the second whirl frequency, ω2). At a certain speed (Ωbifurcation), ω1
vanishes and the second whirl frequency (cylindrical mode) appears with a high
amplitude of acceleration (red color). Hence, at this speed, (Ωbifurcation), there is
apparently a jump from the first to the second subsynchronous whirl frequency. The
* Note according to the TC manufacturer, the natural frequencies of the RBS calculated using an eigenvalue analysis, do not correspond to the measured subsynchronous frequencies (ω1 and ω2). Therefore, one cannot make a definitive statement regarding the occurrence of oil whip phenomenon in the measured results. In addition, the TC manufacturer determines (using a visual software and predicted test data) that the rotor whirls in a conical mode at shaft speeds where ω1 is the dominant frequency, and it whirls in a cylindrical bending mode at high shaft speeds where ω2 is dominant. Based on the information provided by the TC manufacturer, one cannot conclude whether ω1 and ω2 correspond with actual rotor-bearing system natural frequencies [11].
5
second whirl motion is dominant at rotor speeds higher than the bifurcation speed [10].
HTT states that there is sudden increase in noise generation associated with this
frequency jump (from 1st to 2nd whirl frequency). Therefore, the jump phenomenon is of
concern to TC manufacturers. In vibration (and acoustic) measurements obtained in a
passenger vehicle, a gas-stand test rig, and a VSR (Vibration Sorting Rig), HTT
engineers [9-10] detected the jump phenomenon from the first to the second
subsynchronous whirl frequency in TC rotors supported on both FRBs and SFRBs.
One can find relations between the whirl frequencies and the operating speed by
measuring the synchronous and subsynchronous frequencies at the bifurcation speed. In
the results shown in Figs. 2-4, it appears the bifurcation speed (Ωbifurcation) is equal to
twice the first whirl frequency plus the second whirl frequency (Ωbifurcation~ 2ω1 +ω2). In
vibration this is called a combined resonance if ω1 and ω2 represent the system natural
frequencies [12]. This type of combined resonance occurs in systems with for example, a
cubic nonlinearity such as Duffing-type systems [10] , [13]. In addition, at the
bifurcation speed, three times the first natural frequency is approximately equal to twice
the second natural frequency (3ω1 ~ 2ω2). In other words, (if ω1 and ω2 represent the
system natural frequencies) there is a 3:2 internal resonance between the first and second
natural frequencies of the TC system. Yamamoto and Ishida [12] introduce internal
resonance as a means of energy transfer between the natural modes. Moreover, they
hold nonlinearities responsible for energy transfer between the natural modes.
Figure 3 depicts the waterfalls of measured center housing accelerations for the
same TC RBS at 100°C and 4 bar oil inlet temperature and pressure, respectively. The
operating conditions are identical to the ones stated in Fig. 2 except the oil inlet
temperature increases to 100°C. The relations between the whirl frequencies and the
running speed are the same as the ones found in the data shown in Fig. 2. Note the
bifurcation shaft speed (Ωbifurcation) drops to a lower speed (~1,400 Hz = 84 krpm) just by
increasing the oil inlet temperature. As a reminder, the bifurcation speed corresponding
to the case with 30°C oil temperature is 1,800 Hz (108 krpm). HTT reports that the
bifurcation speed is sensitive to the oil temperature [10]. The sensitivity of the
bifurcation speed to oil inlet temperature is especially interesting. In prior studies, for a

6
TC supported on FRBs, Holt et al. [5] observe from TC casing acceleration
measurements, the presence of two sets of subsynchronous whirl motions. At low speeds
only one set of subsynchronous whirl is present. At a certain shaft speed, the first whirl
frequency disappears and the second whirl frequency appears with a higher amplitude of
acceleration. The test data does not show any oil whip. Holt et al. report increasing oil
inlet pressure delays the onset speed of second subsynchronous whirl appearance;
however, the oil temperature has a minimal effect. Nevertheless, a decreasing oil inlet
temperature acts to reduce the amplitudes of synchronous and subsynchronous motions
due to the lubricant higher viscosity.
Rot
or S
peed
Bifurcation speed~ 1800 Hz (108 Krpm)
ω1Mode 1: Conical
Mode 2: Cylindricalω2
2ω1
3ω1
4ω1
Synchronous: 1XΩ
~Ω- ω2
Frequency (Hz)
2ω2
2ω2~3ω1(internal resonance)
Ωbifurcation =2 ω1+ω21500 Hz (90 Krpm)
Jump
Figure 2: Waterfalls of TC center housing acceleration for 30°C oil inlet temperature and 4bar oil inlet pressure [9]

7
Frequency (Hz)
Rot
or S
peed
Bifurcation speed
Mode 1: Conical
ω2~Ω- ω2
Synchronous: 1X
Ω
ω1
Ωbifurcation=2 ω1+ω2
Mode 2: Cylindrical
Jump
Figure 3: Waterfalls of TC center housing acceleration for 100°C oil inlet temperature and 4bar oil inlet pressure [9]
Figure 4 depicts waterfalls of measured center housing acceleration. The oil inlet
temperature and pressure are 30°C and 4bar, respectively. Measurements are taken while
the TC shaft accelerates. The relations between the whirl frequencies and the running
speed (at the bifurcation speed) are identical to the ones found in the data of Figs. 2 and
3. At a rotor speed below the bifurcation speed (Ωbifurcation), the dominant whirl
frequencies are ω1 (conical mode) and 2ω1. However, beyond the bifurcation speed, the
second whirl frequency ω2 (cylindrical mode) is dominant. The dark lines indicate high
amplitudes of motion. Hence, a cylindrical mode with high amplitude continues to be the
dominant whirl motion at speeds beyond the bifurcation speed [10].

8
Rot
or S
peed
Frequency (Hz)
Bifurcation speed
Mode 2: Cylindricalω2
3ω1
2ω2Synchronous: 1X
Ω
ω1Mode 1: Conical 2ω1
Ωbifurcation =2 ω1+ω2Jump
Figure 4: Waterfalls of TC center housing acceleration as the shaft accelerates [10]
Jump
Frequency (Hz)
Synchronous:1X
Bifurcation speed
Ω
ω1Mode 1: Conical
2ω1
ω2
Mode 2: Cylindrical
Rot
or S
peed
Figure 5: Waterfalls of TC center housing acceleration as the shaft accelerates, TC supported on FRBs [10]

9
For a TC supported on SFRBs, Figure 6 depicts the waterfalls of TC housing
acceleration at 30°C oil inlet temperature and 4 bar oil inlet pressure. Results in Fig. 6
(a) correspond to a rotor with higher imbalance amount. Expectedly, increasing the
imbalance amount increases the amplitude of synchronous motion, but more
interestingly, note the disappearance of the first and second subsynchronous whirl
frequencies at shaft speeds above 60 krpm (1000Hz).
In addition to lubricant temperature, HTT suggests that the bifurcation speed is
sensitive to the rotor imbalance distribution and amount. This observation is based on
test data in Fig. 6 (from Ref. [9]) and some rotordynamic predictions on a TC supported
on a SFRB [14]. However, no technical reports are advanced by HTT regarding this
observation. Hence, according to HTT, the rotor bifurcation speed varies with oil inlet
temperature, imbalance distribution and amount, and how fast the rotor accelerates or
decelerates. However, the type of bearing (SFRB or FRB) and the oil inlet pressure
appear to play lesser significant roles [10].
Frequency (Hz) Frequency (Hz)
Rot
or S
peed
Rot
or S
peed
Synchronous:1XΩ
ω2 ~Ω-ω2
Mode 2: Cylindrical
~Ω-ω2
Mode 1: Conicalω1
Jump
Bifurcation speed~ 1875 Hz (~112 Krpm)
1000 Hz (60 Krpm)
Figure 6: Waterfalls of TC center housing acceleration for 30°C oil inlet temperature and 4bar oil inlet pressure; (a) low imbalance amount, (b) high imbalance amount. TC supported on SFRB [9]

10
As mentioned earlier, the jump phenomenon from the first to the second whirl
frequency generates noise, and that is the main concern to TC manufacturers. Sahay and
LaRue [15] note subsynchronous whirl in turbochargers as the second major source of
structural noise generation (the first source is rotor imbalance).
A parametric study on the bearing performance characteristics as well as rotor
responses for a TC supported on (S)FRBs (using computational tools such as a fluid film
bearing thermo-hydrodynamic model [7] and XLTRC2™ rotordynamics code [8]) will
provide useful insight which can lead to a better understanding of the jump phenomenon.
In order to accomplish this, it is critical to understand the fundaments of modal
interactions and nonlinearities in rotordynamics. Recall that TCs supported on fluid film
bearings display highly nonlinear characteristics. The following section presents a
literature review of the past work related to modal interactions as a result of internal and
combined resonances in nonlinear systems.

11
CHAPTER III
LITERATURE REVIEW
As Noah and Sundararajan [16] point out, rotors supported on fluid film bearings
display a highly nonlinear behavior, which linear analysis cannot predict. A few
examples of nonlinear behavior include subsynchronous, quasi-periodic and chaotic
responses; all occurring in rotating machinery with nonlinear supports. For instance,
rotating multi-shaft systems exhibit multi frequency excitations which may lead to quasi-
periodic response and even chaos [16].
The stability of a dynamic system can be analyzed using Hopf bifurcation theory.
This theory explains how a dynamic system behaves qualitatively based on the motion of
the system’s Eigenvalues in complex plane. Consider the Eigenvalues (pair of complex
conjugate) of a RBS linearized at the static equilibrium position of the rotor. As the rotor
speed varies, at a certain critical speed, Ω0, the real parts of a pair of complex conjugate
Eigenvalues cross the imaginary axis and enter the positive (real part) region. It is said
that the fixed stable point (at static equilibrium position) loses stability and bifurcates
into a limit cycle, which can be either stable (if the bifurcation is supercritical) or
unstable (if the bifurcation is subcritical) [17].
In cases where a subcritical bifurcation occurs, the system response can display a
phenomenon known as hysteresis [18]. Pinkus [19] observes hysteresis in the rotor onset
(and disappearance) speed of instability. He describes during rotor acceleration, the
onset speed of instability is higher than the speed at which the instability disappears
(return to stable region) during rotor deceleration. Muszynska [20] attributes the
occurrence of hysteresis in RBS response to the fluid mean circumferential velocity
which is smaller during rotor acceleration than during rotor deceleration. Wang and
Khonsari [18] investigate the effect of lubricant viscosity on hysteresis in RBS
instability. Analytical results show that subcritical bifurcations and hysteresis occur with
high viscosity oil. Therefore, by controlling the lubricant temperature (and hence its
viscosity) one can control the hysteresis phenomenon.

12
Choi and Noah [21] state the increase in significance of fluid film bearing
nonlinear effects at higher speeds in rotating machinery. They introduce hydrodynamic
bearings with clearance as highly nonlinear components in rotating machinery. As a
result of nonlinearities in hydrodynamic bearings, subsynchronous whirl motions and
bifurcations of periodic motions into quasi-periodic motions may occur in rotor-bearing
systems. The authors use a fixed point algorithm (FPA) to solve for quasi-periodic
solutions of a nonlinear Jeffcott rotor with imbalance. Then, a Winding (or rotation)
number, obtained numerically, is introduced to assist in identifying any trends in
nonlinear system behavior. The Winding (rotation) number is the ratio of forcing
frequency to Hopf bifurcation frequency. Choi and Noah [21] observe that in certain
regions the forcing frequency (rotor frequency) locks to a system natural frequency. This
locking phenomenon occurs below certain forcing amplitude (critical amplitude).
However, above the critical forcing amplitude, chaotic response appears in addition to
subsynchronous and quasi-periodic responses.
Brown et al. [22] describe that chaotic motions can occur in rotors supported on
journal bearings for a certain values of imbalance and rotor speed. For instance, at high
journal eccentricities, the total vertical load (caused by static load and vertical
component of imbalance excitation force) may be very small at some portions of an
orbit. This event may give rise to chaos. Chaotic motion can also occur in systems with
weak gyroscopic effects. Inoue and Ishida [23] observe chaotic motion at the
fundamental and twice the fundamental critical speed in a 2DOF rotor model with weak
nonlinearity and weak gyroscopic effects. In this case, the absolute value of forward (ωf)
and backward (ωb) critical speeds become almost equal. Since ωf ~ - ωb, the combined
resonance Ω=0.5(ωf -ωb) results in Ω ~ωf. If the gyroscopic effects are completely
neglected, the magnitudes of the forward, backward critical speeds and combined
resonance 0.5(ωf -ωb) coincide; and interestingly, chaotic motion does not occur.
One of the means for energy transfer between the natural modes of a nonlinear
system is internal resonance. If at a certain operating speed, two (or more) of the natural
frequencies are rational multiples of each other, an internal resonance may occur. In
other words, it is said that those natural frequencies are commensurate. Yamamoto and

13
Ishida [12] as well as Nayfeh and Balachandran [13] hold nonlinearities responsible for
the occurrence of internal and combined resonances in multi-degree-of-freedom (multi-
DOF) systems. The two resonance phenomena can couple the natural modes of a system
and cause an exchange of energy among the coupled modes. Moreover, the modal
interactions may lead to quasi-periodic and chaotic responses.
In Ref [17], Shaw and Shaw explain the critical role of the Winding (rotation)
number in determining the dynamic behavior of a system. For instance, based on how
commensurate the rotation number is, the bifurcating limit cycle can become periodic,
quasi-periodic, or chaotic. Moreover, consider a system with a cubic nonlinearity, where
Ω is the rotor speed (forcing frequency) and ω is the bifurcating limit cycle frequency.
In this case, the strongly resonant cases are 1:1 (Ω ~ ω), 2:1 (Ω ~ 2ω), and 3:1 (Ω ~ 3ω).
Most interestingly, Shaw and Shaw state that jump phenomenon is often observed in
these resonant conditions.
Nayfeh and Balachandran [13] review the related work to systems with internal
and combined resonances. Consider ωn and ωm as any two natural frequencies of the
system where n>m. The 1:1 internal resonance (ωn ~ ωm) occurs in systems with
quadratic or cubic nonlinearities. The 2:1 internal resonance (ωn ~ 2ωm) occurs in
systems with quadratic nonlinearities; and the 3:1 internal resonance (ωn ~ 3ωm) occurs
in systems with cubic nonlinearities. The combination internal resonance can occur in
systems with quadratic and/or cubic nonlinearities. Therefore, the degree of nonlinearity
determines the type of internal resonance. The possible types of combined resonance in
systems with quadratic and cubic nonlinearities are given in detail in Ref.[13].
One of the particularly interesting effects of internal resonance is saturation. For
instance, consider a 2 DOF system with a quadratic nonlinearity, and internal resonance,
ω2 ~ 2ω1 where the system is excited with Ω~ω2 (Ω is the excitation frequency). The
second mode is dominant up to a certain value of excitation amplitude, known as critical
amplitude. Beyond the critical excitation amplitude, the second mode becomes saturated
and the excessive energy excites the first natural mode. The value of critical amplitude
depends on system damping [13].

14
Ref. [24] mentions a few practical examples where internal resonances have led a
mechanical system to failure. These examples encouraged Nayfeh et al. to investigate
the response of a 3DOF nonlinear system with quadratic nonlinearities and internal
resonances ω3~2ω2 and ω2~ 2ω1. The response of the system to a primary excitation
Ω=ω3 is examined. As the system is excited starting with low excitation amplitudes, the
response consists of only the third mode (excited mode) and the amplitude of response
increases linearly with the amplitude of excitation up to a critical amplitude. With
further increasing the excitation amplitude, Hopf bifurcation occurs and the second
(lower) mode is excited in addition to the third mode. As the excitation amplitude further
increases, a secondary Hopf bifurcation occurs and the result is an unstable response
with all the three modes present.
Yamamoto and Ishida [12] explain that internal resonance may happen in
systems where the forward whirl and backward whirl natural frequencies are equal in
magnitude and related to each other by antisymmetric nonlinearities. For instance, in
Jeffcott rotors [25], the forward and backward natural frequencies are equal in
magnitude (absolute value); hence these rotors are susceptible to internal resonance.
The nonlinear Jeffcott rotor model is used to study theoretically and
experimentally the effect of internal resonance on nonlinear system response at the
critical speed, as well as two and three times the fundamental critical speed [26]. Note
that in Jeffcott rotors the gyroscopic effects are negligible, so natural frequencies are
speed independent and the magnitude of forward and backward natural frequencies
coincide (1:-1 internal resonance may occur).
When exciting the nonlinear Jeffcott rotor system with the fundamental critical
speed, the magnitude of the forward, ωf, and backward, ωb, synchronous frequencies
coincide with the combined resonance of 0.5(ωf -ωb). In a case where the system is
excited with twice the major critical speed, the magnitude of the forward
subsynchronous 0.5(2ωf) and backward subsynchronous 0.5(2ωb ) frequencies coincide
with combined resonance 0.5(2ωf -2ωb). Also, in a case where the system is excited with
three times the major critical speed, the magnitude of the forward subsynchronous
1/3(3ωf ) and backward subsynchronous 1/3(3ωb ) frequencies coincide with combined
15
resonances (2ωf -ωb) and (ωf -2ωb). In all cases due to occurrence of internal resonance,
the response of the system is nearly periodic due to Hopf bifurcation and the
nonlinearities bend the resonance curves. As gyroscopic effects are introduced to the
system, the forward and backward synchronous speeds diverge from each other.
Therefore, internal resonance does not occur and responses appear similar to cases with
solitary resonance (no internal resonance) [26].
A combined resonance Ω= 2ω1 +ω2 occurs in systems with cubic nonlinearity
[13] such as Duffing-type systems. However, Shaw and Shaw [27] demonstrate that in
presence of internal damping, the nonlinear behavior of an unbalanced rotating shaft is
far more complicated than a Duffing-type response. In a rotating shaft with internal
damping they observe quasi-periodic motion, which results from amplitude modulations
of the whirl motion.
Yamamoto and Yasuda [28] obtain the forced response of a 2DOF system with
both quadratic and cubic nonlinearities and internal resonance 1:2 (ω2 ~ 2ω1). In
addition, viscous damping is present. They observe that at small excitation frequencies,
Ω (away from resonance) the system behaves similar to a case without internal
resonance. However, as Ω increases and approaches to the first natural frequency, ω1,
the amplitude of second natural mode increases in addition to the first natural mode. At
this excitation frequency both the first and second harmonics are present. As Ω
increases beyond the first natural frequency, a jump occurs in the response. With further
increase of Ω there is a back and forth exchange of energy between the first and second
natural modes. This region is called quasi-periodic region. As Ω increases, the response
becomes completely periodic and both first and second harmonics are observed. With
further increasing Ω, the amplitude of the second natural mode becomes very small, and
the behavior of the system is again similar to a case without internal resonance.
Yamamoto and Yasuda [28] also observe that damping ratio greatly affects the response
in the quasi-periodic region. As the damping ratio increases, the back and forth energy
exchanges between the first and second modes cease, and the response becomes fully
periodic and stable.

16
Asmis and Tso [29] investigate the effect of internal resonance on combined
resonance response in a 2 DOF system with a cubic nonlinearity. The system has a
combined resonance, Ω~ω1 +ω2 and an internal resonance, ω1~ω2. They use the concept
of internal and external detuning as a way to quantify how well the internal and
combined resonance relations are satisfied by the actual values of natural frequencies.
The larger the internal detuning, the farther are the first and second natural frequencies
from each other. Also, the larger the external detuning, the less accurate is the combined
resonance approximation Ω~ω1 +ω2. Interestingly, Asmis and Tso report that for a
certain range of external detuning, the system exhibits amplitude modulated quasi-
periodic response. In other words, the system displays beating and energy is exchanged
between the first and second natural modes. As the internal detuning increases the range
of modulated quasi-periodic response increases. However, the amplitude of beating
decreases and the response becomes more periodic. For cases where internal detuning is
zero (ω1=ω2), internal resonance causes larger steady state response amplitude and tends
to reinforce the combined resonance.
In another study, Mook et al. [30] investigate the effect of internal resonance on
the response of a system of differential equations with cubic and quadratic nonlinearities.
The system has a combined resonance of Ω= ω1+ ω2, where Ω is the excitation
frequency, and ω1 and ω2 are the first and second natural frequencies, respectively. For a
case with no internal resonance, the response of the system consists of a trivial solution
where the excited frequency is near the excitation frequency, Ω. There is also a non-
trivial solution where the responses occur near ω1 and ω2 due to combined resonance.
For a case with internal resonance ω1~ ω2 the trivial solution is identical to the one for
without internal resonance. However, the nontrivial solution does not reach steady state
as a result of back and forth exchange of energy between the first and second natural
modes. In fact, the response is quasi-periodic. Mook et al. [30] also report that internal
resonance decreases the amplitude of response due to combined resonance. However,
this conclusion is the exact opposite of what Asmis and Tso report in Ref. [29] . The
discrepancy in results may be due to the different types of nonlinearity in two cases.

17
Recently, Schweizer and Sievert [31] study bifurcations in measured
turbocharger shaft responses during rotor acceleration (from 0 krpm-160 krpm). The TC
rotor is supported on FRBs. Shaft displacements, along horizontal and vertical
directions, are measured (using eddy current sensors) at the compressor end.
Measurements are at two oil supply pressures (1.5 bar and 3 bar) and oil inlet
temperatures (75°C and 90°C). In addition, the authors increase the imbalance amount
(by adding 0.25gr.mm and 0.57gr.mm) at the compressor wheel, and study its effect on
the nonlinear response. The measured waterfalls of shaft motion display a jump from a
1st subsynchronous whirl frequency to a 2nd (higher), and sometimes to a 3rd (lower)
subsynchronous frequencies. The authors relate the 1st and 2nd subsynchronous
frequencies to the inner film whirl/whip exciting the conical and cylindrical modes,
respectively. The 3rd subsynchronous frequency is attributed to the outer film instability
exciting the conical mode of the RBS.
According to the measured waterfalls of TC shaft motion, Ωbifurcation (the rotor
speed at which the frequency jump occurs) is more sensitive to oil inlet pressure than it
is to oil inlet temperature. At 75°C oil supply temperature, increasing the oil inlet
pressure (from 1.5 bar to 3 bar) delays the Ωbifurcation (from ~45 krpm to 60 krpm).
However, a higher oil inlet temperature results in the disappearance of the 2nd
subsynchronous motion at a shaft speed below 120 krpm (which persists up to 160 krpm
with low oil inlet temperature). The sensitivity of Ωbifurcation to oil supply pressure is not
in agreement with the earlier observations of HTT engineers. The waterfalls of casing
accelerations provided by HTT correspond to various inlet temperatures, but not various
inlet pressures.
Interestingly, increasing the imbalance amount by adding 0.25gr.mm, results in
the disappearance of the 2nd subsynchronous whirl frequency at approximately 130
krpm. However, the Ωbifurcation remains unchanged. Further increase in the imbalance
amount (by adding 0.57gr.mm) delays the onset speed of a 2nd whirl frequency to a TC
speed of 80 krpm. In addition, the 1st whirl frequency disappears at a lower shaft speed
(~45 krpm). However, between 60 krpm and 80 krpm, a 0.5 whirl frequency motion

18
appears to be dominant. Amplitudes of motion in the horizontal and vertical directions
are similar, indicating of FRB operation at low journal eccentricities.
In addition to the shaft response measurements, Schweizer and Sievert [31] also
find the bifurcations in predicted TC shaft responses using a flexible rotor model
supported on simple FRBs. The frequency spectrum of the predicted results shows the 1st
whirl frequency bifurcating into the 2nd whirl frequency; however, the figures do not
show the speed at which the bifurcation occurs. Only one case of simulation is
presented, with few details given as per either the predicted results, or the bearing model,
or the TC rotor finite element model.
Based on the literature review, in order to analyze the jump phenomenon from
the first to the second subsynchronous frequency, one must pay special attention to the
fluid film bearing nonlinearities and operating conditions under which internal and
combined resonances occur.
Objective According to the TC manufacturer, the frequency jump phenomenon from a first
subsynchronous whirl frequency to a higher whirl frequency, results in increased level of
noise generation in automotive turbocharger units. Hence, the objective of this research
is to investigate some of the bearing parameters and rotor characteristics affecting the
rotor-bearing system performance and the frequency jump phenomenon, as well as the
severity and persistence of subsynchronous whirl motions. This study will assist
turbocharger manufacturers in achieving a quantifiable understanding of the frequency
jump phenomenon and will aid to the optimization of turbocharger design, achieving
lower noise generation.
Prior Work at TAMU Turbocharger rotordynamic performance assessment involves rigorous testing
which is both costly and time consuming. Significant time and costs can be saved by
replacing the shop assessment with a proven predictive model, experimentally
benchmarked. The development and refinement of such model are the goal of a research
project, nearly a decade long, at Texas A&M University [1-6], [33-35].

19
Holt et al., [5] measure center housing acceleration of a turbocharger supported
on FRBs. The authors assess the effect of lubricant supply temperature and pressure on
TC housing acceleration response. The waterfalls of center housing acceleration show
motions with two typical subsynchronous frequencies, ranging between 40% and 70% of
shaft speed. Tests show that lubricant supply pressure delays the onset speed of the
second subsynchronous whirl motions. However, lubricant supply temperature shows
negligible effect on the onset speed of subsynchronous whirl motions. Further, Holt et al.
[5] validate a TC FE rotor model against measured free-free natural modes, and obtain
TC shaft response predictions at the compressor end. Predicted waterfalls of shaft
motion display two subsynchronous frequencies at ½ ring speed and ½(rotor + ring)
speed, denoting instability of the outer and inner films, respectively. Most importantly,
waterfalls of TC response predictions with rotor imbalance demonstrate a more stable
operation at high shaft speeds compared to the case with a TC rotor perfectly balanced.
The measured center housing accelerations [5] , in which the TC rotor includes an
unknown imbalance, also show the absence of subsynchronous whirl motion at high
shaft speeds.
San Andrés and Kerth [4] detail a thermo-hydrodynamic (THD) model and
compare predicted bearing performance parameters against measurements on a TC rotor
supported on FRBs. Measured ring speed, lubricant exit temperature, and power loss
agree well with predictions. The floating ring rotational speed is proportional to the inner
film viscosity and outer film clearance. Predictions show that with increasing shaft
speed, the inner film viscosity and the outer film clearance decrease due to thermal
effects. Therefore, the ring speed decreases with shaft speed. Waterfalls of measured and
predicted TC shaft motions show the presence of two subsynchronous whirl motions due
to instability of the inner and outer films. However, predictions typically overestimate
the amplitude of subsynchronous whirl shaft motions. The discrepancy is attributed to an
inaccurate knowledge of the rotor imbalance.
Kerth [32] measures and predicts the shaft motion response of a TC supported on
FRBs. Kerth also assesses the effect of compressor aerodynamic load on the measured
TC rotor response by rotating (statically) the compressor housing (cut water) to redirect

20
the aerodynamic load. The TC rotordynamic response appears insensitive to compressor
housing orientation. In addition, Kerth obtains test data and predictions of TC shaft
response at various oil supply pressures. The measurements show a reduction in
response amplitude with increases in oil supply pressure. However, predictions do not
display such reduction in response amplitude. Therefore, San Andrés and co-workers
continue to improve the fluid film bearing THD flow model (XLFEMSFRB™ [7]).
Rivadeneira [33] accounts for hydrostatic (side) loads acting on the FRBs due to
oil supply pressurization and obtains TC rotor response predictions for various oil inlet
temperatures and oil inlet pressures. The shaft total motion response does not show great
sensitivity to the variations of oil inlet temperature and pressure. However, accounting
for the hydrostatic side loads significantly improves the agreement between the predicted
and measured shaft responses.
Maruyama [3] continues the refinement to the developed TC rotor-bearing
motion predictive tool by including the effect of engine-induced base motion excitations.
Fluid film bearings transmit the base excitation from the center housing to the TC rotor.
A TC manufacturer provides center housing and compressor housing accelerations
measured in a commercial vehicle TC whose inlet manifold is attached to a four-cylinder
engine. Test data reveals that center housing and compressor housing do not move as a
rigid body. TC housing accelerations show prominent amplitudes of acceleration at two
and four orders of engine fundamental frequency. The center housing acceleration is
input into the rotordynamics code (base excitation) as components of a Fourier time
series. Nonlinear response predictions agree well with test data, demonstrating a rich
subsynchronous behavior. However, nonlinear predictions, excluding the effect of base
excitation, show little subsynchronous motions, indicating of the importance of base
excitation effects in TC nonlinear response predictions.

21
CHAPTER IV
OVERVIEW OF THERMO-HYDRODYNAMIC MODEL FOR SFRB
FORCED RESPONSE AND FINITE ELEMENT MODEL FOR
TURBOCHARGER STRUCTURE
Fluid film bearing parameters play a key role in TC rotordynamic performance.
Bearing parameters such as operating clearances, fluid film viscosity, and inlet film
pressure vary with the TC shaft rotational speed. Further, these parameters are functions
of shaft, ring, and casing temperatures as well as the lubricant supply pressure and
temperature. San Andrés and Kerth [4] develop a FE thermo-hydrodynamic fluid film
bearing model, which predicts the (S)FRB static and dynamic performance
characteristics (i.e. operating bearing clearances, effective film viscosity, fluid film
temperature rise, ring and journal eccentricities, power losses, film flow rates, and
dynamic fluid film force coefficients).
The THD model accounts for the fluid film bearing clearance variations due to
shaft and ring thermal growth. The shaft temperatures at the turbine and compressor
bearing locations are estimated using an empirical temperature defect ratio [shaft
temperature - lubricant inlet temperature]/ [turbine wheel temperature - lubricant inlet
temperature]. Measurements show the temperature defect ratio at the turbine bearing and
the compressor bearing are 0.16 and 0.13, respectively, when the turbine wheel
temperature is ~ 700°C [34].
TC units often use non-Newtonian lubricants. Therefore, the oil viscosity
decreases with shear rate, in addition to temperature. The available fluid film bearing
model incorporates Cross equation [35] to account for shear thinning effects in the
lubricant viscosity.
Lubricant pressure drop into the inner and outer films may occur for various
reasons and must be taken into account. For instance, experiments show the supply
pressure into the outer film feed plenum is lower than the feed pressure recorded at the
inlet port in the center housing. In the fluid film bearing model, an empirical pressure
loss factor quantifies this loss [3]. In addition, the rotation of the ring (in FRB) and shaft

22
cause a pressure drop into the inner film due to centrifugal flow effects. The bearing
model incorporates a centrifugal pressure loss model developed in Ref. [36].
The turbocharger CHRA (Center Housing Rotating Assembly) in this study is
similar to the one shown in Figure 1 (Chapter I). The TC rotor is supported on a SFRB.
Figure 7 (not to scale) enlarges the SFRB and the center housing. The SFRB is a long
and hollow cylinder with the compressor side bearing and turbine side bearing at its
ends. Lubricant is supplied through the TC center housing into the outer film of both
bearings, and from there to the respective inner films through four equidistant holes in
both sides (compressor and turbine ends) of the SFRB. Note the center housing
incorporates a ½ moon groove on the turbine bearing side; hence, creating a larger
hydrostatic side load factor on the turbine bearing than the one on the compressor
bearing. Ref [33] provides details on predicting side load factors.
Figure 8 depicts the cross section schematic view of the TC analyzed, excluding
the thrust collar and the ring spacers. The inner and outer film clearances are greatly
exaggerated. The figure is not to scale and intends to qualitatively show the bearing
inner and outer fluid films. The yellow sections represent regions filled with lubricant.
For simplicity, Fig. 8 shows only the upper half section of the TC rotor-bearing system.
Turbine bearing ½ moon groove
Turbine bearing oil supply holes
Compressor bearing oil supply holes
Oil supply
Anti-rotation pin
Compressor side bearing oil supply holes
Oil supply
Turbine side bearing ½ moon groove
Turbine side bearing oil supply holes
Figure 7: Photograph of typical SFRB and center housing with oil feed lines

23
SFRB
Turbine Comp
Turbine bearing outer film Comp bearing
outer filmCenter housing
Oil supply
Turbine bearing inner film
Comp bearing inner film
Shaft
Figure 8: Schematic cross section view of TC rotor and SFRB (not to scale, films enlarged)
Figure 9 depicts the TC rotor finite element model, consisting of 43 finite
elements, and the SFRB modeled with 13 elements. A blue arrow shows the rotor-
bearing system (RBS) center of gravity. A spring connecting the shaft to the SFRB
models the inner film, and a spring connecting the SFRB to the ground represents the
outer film. The shaft and SFRB are made of steel and brass, respectively. The turbine
and compressor wheels are modeled as low density elements with added lumped mass
and mass moments of inertia (polar and transverse). The TC manufacturer provides a
four plane imbalance mass distribution. Appendix A lists the TC and SFRB physical
properties.
The fluid film bearing model is integrated with the finite element rotordynamics
computational model for numerical prediction of the TC linear and nonlinear (time
transient) forced response. The FE rotor model uses Timoshenko’s beam theory to model
the TC shaft and the ring. Each node in a structural finite element has four degrees of
freedom (two rotations and two translations). The number of degrees of freedom for the
RBS is reduced using component mode synthesis [37]. The nonlinear rotordynamic
analysis applies the instantaneous bearing reaction forces (dependent on operating
conditions; i.e., actual clearances, ring speed, films viscosity, journal and ring
displacements and velocities, and lubricant supply pressure) into the equations of motion
(EOM). The EOM are integrated using a Gear-Stiff method [8]. Appendix D provides
the equations of motion for the RBS.

24
CompressorThrust collar
Turbine
SFRB
C.G
Compressor bearing
Turbine bearing
10 14
39
42
Axial location
Shaf
t rad
ius
RotorComp nose Comp back
Imbalance stationsTurb nose
Turb back
Imbalance stations
Figure 9: TC finite element rotor model
Predicted SFRB Performance Characteristics This section details the SFRB static load performance characteristics predicted
by the THD flow model XLFEMSFRB™ [7]. Note in this analysis, the bearing reaction
force is always equal to the rotor static load applied on the bearing. The turbocharger
shaft speed varies from 30 krpm to 240 krpm. Table A.5 (Appendix A) lists the nominal
operating conditions.
In the following, performance parameters are shown in dimensionless form as
ratios with respect to inlet conditions, unless otherwise stated. Figure 10 depicts the
inner and outer oil films exit temperatures for the compressor and turbine bearings. The
exit temperatures are higher at the turbine bearing location due to heat transfer from the
hotter turbine wheel. In addition, in both turbine and compressor bearings, the inner oil
film has a higher temperature (compared to the outer film) due to shaft rotation shear
effects. Recall that the floating ring is pinned, i.e., it does not rotate.
Figure 11 depicts the inner oil film power loss (relative to the maximum power
loss at the highest shaft speed) for the compressor and turbine bearings. Power
dissipation is a quadratic function of shaft speed. As shaft speed increases, the shear
dissipation in oil films increases; therefore power dissipation increases.
Figure 12 shows, for the compressor and turbine bearings, the effective inner and
outer oil film viscosities versus shaft speed. The outer oil film, which acts as a squeeze

25
film damper has a lower film temperature and a higher viscosity. The inner film reduced
viscosity is due to its higher temperature as well as more lubricant shear thinning effects
as a result of shaft rotation.
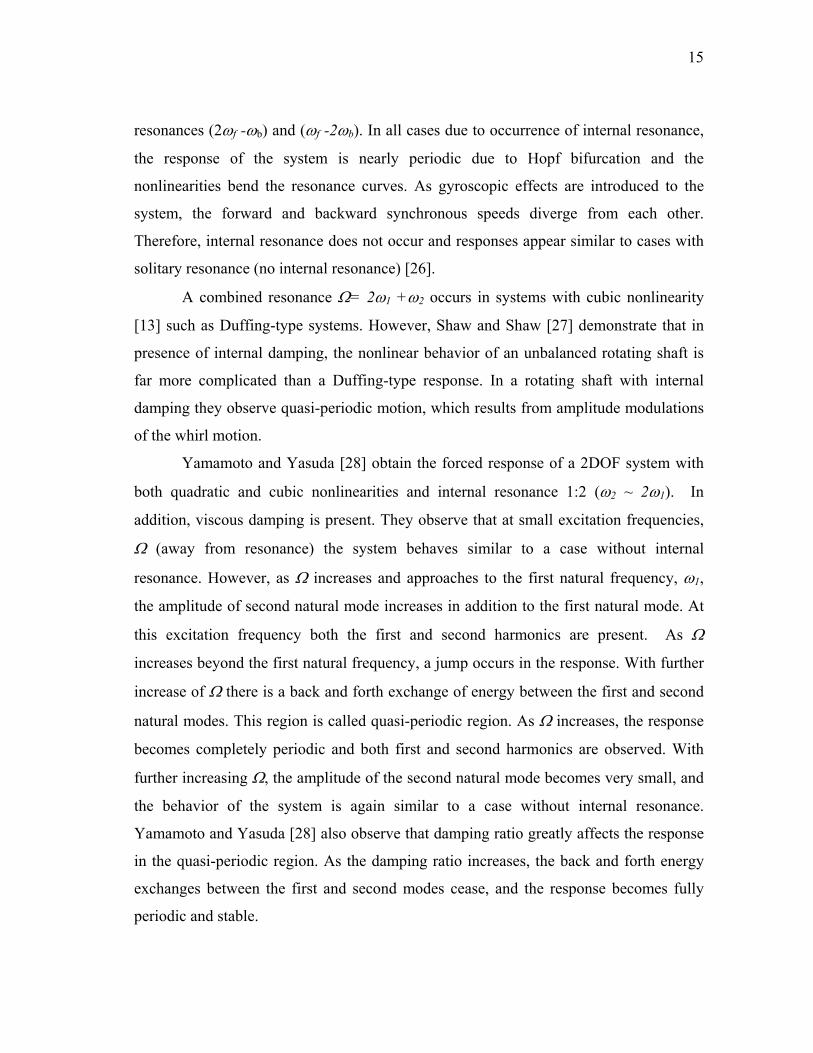
Figure 13 depicts the operating (inner and outer film) clearances (relative to the
respective cold clearances) for the turbine and compressor bearings. The changes in
operating clearances between the lowest and highest shaft speeds are approximately 7%
for both the inner and outer films. As the shaft speed increases, the inner film clearance
increases and the outer film clearance decreases, indicating of ring thermal expansion.
Figure 15 shows the journal relative to ring eccentricity ratio for the compressor
and turbine bearings. Note the maximum value of journal eccentricity relative to ring (at
lowest shaft speed) for the turbine and compressor bearings are around 7% and 3% of
the inner film clearance, respectively. In other words, the journal operates at centered
position relative to the ring.
1.0
1.1
1.2
1.3
1.4
1.5
1.6
0 50000 100000 150000 200000 250000
Rotor speed (RPM)
Exit
tem
pera
ture
S
uppl
y te
mpe
ratu
re
Inner film comp bearing
Inner film turb bearing
Outer film comp bearingOuter film
turb bearing
(°C
)
(°C
)
Figure 10: Predicted (inner and outer) oil films exit temperature versus rotor speed in TC compressor and turbine bearings

26
0.00
0.20
0.40
0.60
0.80
1.00
1.20
0 50000 100000 150000 200000 250000
Rotor speed (RPM)
Pow
er d
issi
pate
d P m
ax
Inner film comp bearing
Inner film turb bearing
Figure 11: Predicted normalized power loss at the inner film of the compressor and turbine bearings versus rotor speed
0.0
0.2
0.4
0.6
0.8
1.0
1.2
0 50000 100000 150000 200000 250000Rotor speed (RPM)
Effe
ctiv
e oi
l film
vis
cosi
ty
Supp
ly o
il vi
scos
ity
Inner film turb bearing
Inner film comp bearing
Outer film turb bearing Outer film
comp bearing
Figure 12: Predicted effective (inner and outer) oil film viscosity versus rotor speed for the compressor and turbine bearings
27
0.00
0.50
1.00
1.50
0 50000 100000 150000 200000 250000Rotor speed (RPM)
Film
cle
aran
ce
Col
d cl
eara
nce
Outer film turb & comp bearing
Inner film turb & comp bearing
Figure 13: Predicted (inner and outer) film clearance ratios versus rotor speed for the compressor and turbine bearings
0.00
0.01
0.02
0.03
0.04
0.05
0.06
0.07
0 50000 100000 150000 200000 250000Rotor speed (RPM)
Jour
nal r
elat
ive
to ri
ng e
ccen
tric
ity
Inne
r film
cle
aran
ce
Comp bearing
Turb bearing
Figure 14: Predicted journal eccentricity relative to ring versus rotor speed for the compressor and turbine bearings

28
CHAPTER V
LINEAR TURBOCHARGER RESPONSE PREDICTIONS
Linear Eigenvalue analysis uses the linearized bearing force coefficients,
obtained from the THD flow model [7], in predicting the rotor-bearing system (RBS)
natural frequencies. Figure 15 shows a schematic view of the coordinate system for.
Figure 16 depicts the predicted (non-dimensional) SFRB inner film stiffnesses as well as
the inner and outer films damping coefficients for the compressor and turbine bearings.
The graphs on the left and right sides correspond to the compressor and turbine bearings,
respectively. The non-dimensional stiffness ( k ) and damping force (c ) coefficients are
defined using [39]: 3
**
3*
*
,2
,2
l
l
K D Lk KK C
C D Lc CC C
μ
μ
⎛ ⎞= = Ω⎜ ⎟
⎝ ⎠
⎛ ⎞= = ⎜ ⎟
⎝ ⎠
where K and C are the physical force coefficients, μ is the lubricant viscosity at the
supply temperature and Ω is the shaft rotational speed. For the inner film force
coefficients, D, L, and Cl represent the nominal values of shaft diameter, bearing inner
film length, and (cold) inner film clearance, respectively. For the outer film coefficients,
D, L and Cl represent the nominal values of ring (outer) radius, bearing outer film length,
and (cold) outer film clearance, respectively. Appendix A details the shaft and ring
dimensions.
As a note, hydrostatic side loads are applied only on the bearing outer film. For
the inner film, only the weight of the shaft is considered, so the journal operates close to
the center of the ring. Chapter VI further explains the reason for applying hydrostatic
loads only to the outer film.
Figures 16 (a) and (b) show that for compressor and turbine bearings, the inner
film direct stiffness coefficients are nil due to the low static load. Also, the cross-coupled
stiffness coefficients, (kxy- kyx> 0) add energy to the whirl orbits. Note kxy is

29
approximately equal to -kyx. As a reminder, (kxy = -kyx) is a typical driver of instability in
a RBS.
The inner film damping coefficients in Figures 16 (c) and (d) decrease with shaft
speed due to the journal displacement closer towards the center of the ring. The outer
film direct damping coefficients decrease with shaft speed because the ring eccentricity
decreases (ring moves towards the center of the bearing). The outer film cross coupled
damping coefficients equal zero, and are not shown in Figures 16 (e) and (f).
g
Ω X
Y
Gravitational loadShaft rotational speed
Rotor
Figure 15: Schematic view of rotor coordinate system for analysis of rotor motions

30
STIFFNESS (INNER FILM)
-0.3
-0.2
-0.1
0.0
0.1
0.2
0.3
0 50 100 150 200 250Rotor Speed (krpm)
Stiff
ness
(-)
KxxKxyKyxKyy
a INNER filmCompressor bearing
-0.3
-0.2
-0.1
0.0
0.1
0.2
0.3
0 50 100 150 200 250Rotor Speed (krpm)
Stiff
ness
(-)
KxxKxyKyxKyy
bINNER film
Turbine bearing
DAMPING (INNER FILM)
-0.3
-0.2
-0.1
0.0
0.1
0.2
0.3
0 50 100 150 200 250
Rotor Speed (krpm)
Dam
ping
(-)
CxxCxyCyxCyy
c
INNER film
Compressor bearing-0.3
-0.2
-0.1
0.0
0.1
0.2
0.3
0 50 100 150 200 250Rotor Speed (krpm)
Dam
ping
(-)
CxxCxyCyxCyy
d
INNER film
Turbine bearing
DAMPING (OUTER FILM)
0
1
2
3
4
5
0 50 100 150 200 250Rotor Speed (krpm)
Dam
ping
(-)
CxxCyy
OUTER film
Compressor bearinge
0
1
2
3
4
5
0 50 100 150 200 250Rotor Speed (krpm)
Dam
ping
(-)
Cxx
Cyy
OUTER filmTurbine bearingf
Figure 16: Predicted SFRB normalized force coefficients; (LEFT) compressor bearing, (RIGHT) turbine bearing; (a) and (b) inner film stiffness k ; (c) and (d) inner film damping ic ; (e) and (f) outer film damping coefficients oc .

31
Figure 17 (top) depicts the damped natural frequency map of the TC analyzed,
with mode shapes at 95 krpm shaft speed shown. The compressor and turbine ends of the
TC are marked on the mode shapes with letters ‘C’ and ‘T’, respectively. The black
dashed line denotes the shaft synchronous speed. The bottom figure depicts the
corresponding damping ratios versus shaft speed. The 1st natural frequency corresponds
to a conical rigid body mode, frequency ranging from 8Hz to 230Hz as rotor speed
increases. This mode is well-damped (at 95 krpm shaft speed, damping ratio ξ=0.68).
The 2nd natural frequency corresponds to a conical mode with the SFRB whirling in a
conical mode as well. This mode is always unstable (at 95 krpm shaft speed, damping
ratio ξ= -0.05). The 3rd natural frequency corresponds to a rotor cylindrical bending
mode with the SFRB whirling in a cylindrical mode. This mode is also always unstable
(at 95 krpm shaft speed, ξ= -0.09). Figure 17 (bottom) shows negative damping ratios
for the 2nd and the 3rd natural frequencies, which indicates unstable modes. The 4th
natural frequency corresponds to a cylindrical bending mode (at 95 krpm shaft speed,
ξ=0.24), and the highest natural frequency within the TC shaft operating speed range is a
well-damped first elastic mode ranging from 1,000 Hz to 2,300 Hz (at 95 krpm shaft
speed, ξ=0.30).
Figure 18 depicts the damped natural frequency map for the unstable modes. The
( ) and ( ) symbols represent the unstable 2nd and 3rd natural modes, respectively.
Note at 140 krpm shaft speed, the 2nd natural frequency represents a conical mode with
SFRB whirling in a conical mode. As the shaft speed increases to 145 krpm, the shaft
still whirls in a conical mode, but the SFRB whirls in a cylindrical mode. Eventually, as
the shaft speed increases, the 2nd natural frequency represents a cylindrical bending
mode with the SFRB whirling in a cylindrical mode. A similar phenomenon occurs at
the 3rd natural frequency, which represents a cylindrical bending mode at low shaft
speeds. As the rotor speed increases to 145 krpm, the shaft still whirls in a cylindrical
bending mode, whereas the ring starts whirling in a conical mode. As the rotor speed
further increases, the 3rd mode represents a conical mode with the SFRB in a conical
mode. One can attribute this transition of modes (between conical and cylindrical) to the

32
closely spaced natural frequencies. In fact, it seems the ring motion encourages the rotor
whirl transition from one mode to the other.
0
500
1000
1500
2000
2500
0 60000 120000 180000 240000
Rotor Speed (rpm)
Dam
ped
Nat
ural
Fre
quen
cy (H
z)
Mode shapes at 95 krpm
C
T
C
TC
T
C
T
ξ=0.68
ξ=0.24
ξ= -0.09
ξ= -0.05
ξ=0.301st elastic mode
Conical, turbine and compressor ringing mode
Conical mode
Cylindrical bending mode
C
T
C
TC
T
C
T
1X
80 krpm
45 krpm
Cylindrical bending, turbine and compressor ringing mode
C
T
C
T
-0.2
0
0.2
0.4
0.6
0.8
1
1.2
0 60000 120000 180000 240000Rotor Speed (rpm)
Dam
ping
Rat
io (-
)
C
T
C
T
Conical , turbine and compressor ringing mode
Cylindrical bending, turbine and compressor ringing mode
2nd mode Unstable
3rd mode Unstable
Figure 17: (TOP) TC damped natural frequency map and mode shapes at rotor speed of 95 krpm, (BOTTOM) damping ratio versus rotor speed

33
0
200
400
600
800
1000
1200
1400
1600
0 60000 120000 180000 240000
Rotor Speed (rpm)
Dam
ped
Nat
ural
Fre
quen
cy (H
z)
Ω=145krpm
Ω=140krpm
Ω=225krpm
Ω=140krpm
Ω=145krpm
Ω=240krpmCylindrical bending mode-cylindrical ring mode
Cylindrical bending mode-conical ring mode
Conical shaft mode- conical ring mode
Conical shaft mode-cylindrical ring mode
Cylindrical bending shaft mode-cylindrical ring mode
conical shaft mode-conical ring mode
Figure 18: TC damped natural frequency map and mode shapes for the unstable modes
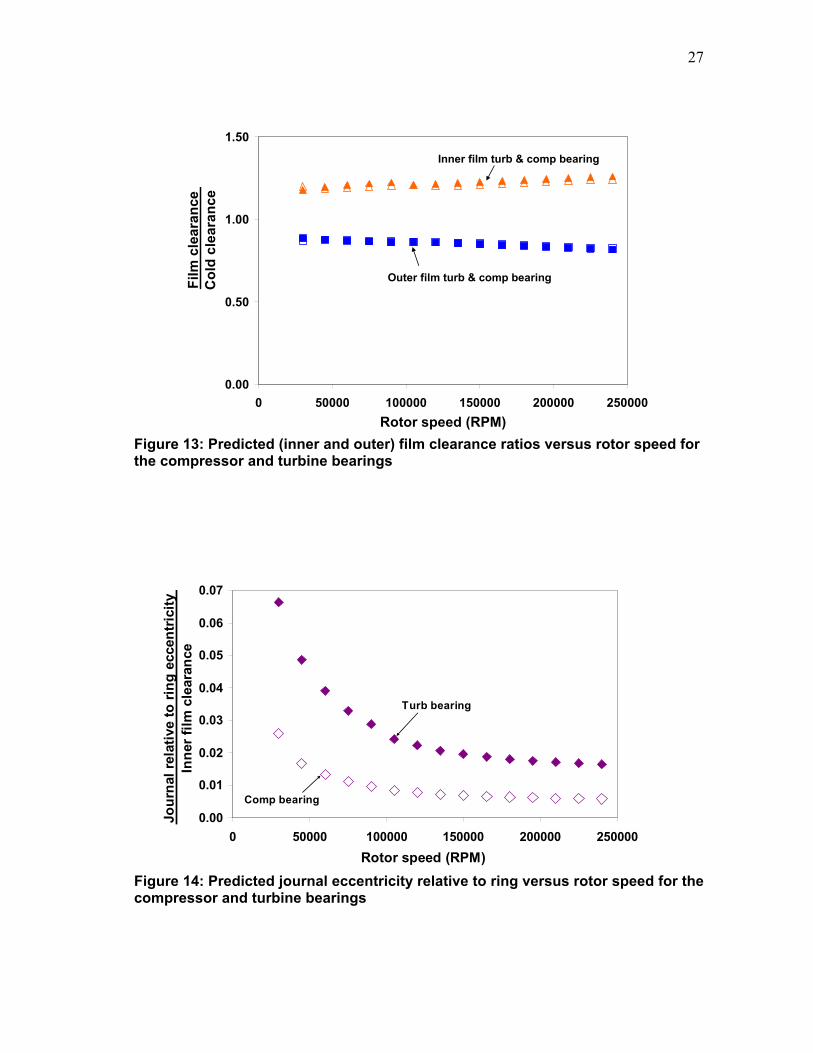
Figure 19 depicts the predicted amplitude of imbalance synchronous rotor
response (at the compressor end) obtained from the linear analysis (blue line) and from
the nonlinear rotor speed transient analysis ( ). In addition, the synchronous responses
from the nonlinear time transient analysis (obtained at a fixed speed) are shown at the
highest shaft speeds ( ). In the transient rotor speed analysis the shaft accelerates with
a 500 Hz/s speed ramp rate†. The amplitudes of response are normalized with respect to
the maximum physical displacement at the compressor end (listed in Appendix A).
The synchronous response from the linear rotordynamics analysis in Fig. 19
shows peak amplitudes at 45 krpm and at 110 krpm. According to the damped natural
† In the FFT analysis of the time data, data is broken into segments of 512 points. The sampling time Δt = 0.1ms, and the time span over each FFT is approximately 52ms. The shaft speed variation over each FFT segment is approximately 1,500 rpm (~26Hz). The sampling frequency in FFT analysis is rather large (~20Hz). Since the FFT sampling frequency (~20Hz) is close to the speed variation over each FFT (~26Hz), even though the rotor speed changes, the FFT analysis of synchronous motion captures one speed per FFT segment. Therefore, the speed transient synchronous response amplitude is similar to the ones from the nonlinear fixed rotor speed analysis.
34
frequency map (Fig. 17), at ~ 45 krpm rotor speed, the cylindrical bending mode
(ξ=0.20) coincides with the rotor synchronous speed. A simple estimation using the half
power frequency law [38] shows the corresponding damping ratio at the critical speed in
Fig. 19 is ξ~0.22 which is close to the one for cylindrical bending mode at the critical
speed (ξ=0.20). Hence, the peak response in Fig. 19 is due to rotor speed exciting the
cylindrical bending mode. The natural frequency map also shows at approximately 80
krpm the synchronous speed coincides with the first elastic mode. Results from the
linear rotordynamic analysis in Fig. 19 shows a well-damped (ξ=0.33) peak response at
around 110 krpm, which may be due to the rotor speed exciting the first elastic mode.
Note the discrepancies between the synchronous responses from the linear
rotordynamic analysis and the nonlinear (at fixed shaft speed and speed transient)
analyses. The linearized bearing force coefficients are obtained using small perturbations
of the rotor about a static equilibrium position. However, nonlinear analysis shows large
rotor and ring motions (see Chapter VI for details on nonlinear analysis), which explains
the discrepancies between the linear and nonlinear predictions.
0.00
0.05
0.10
0.15
0 50000 100000 150000 200000 250000Rotor Speed (rpm)
Res
pons
e 0-
pk (-
)
Compressor Nose
Nonlinear rotor speed transient analysis
Linear rotordynamic analysis
500 Hz/s
45krpm
49krpm
Nonlinear fixed rotor speed analysis
110 krpm
Figure 19: Predicted amplitude of TC synchronous response at compressor end (vertical direction). Results from linear rotordynamics analysis, nonlinear analysis at fixed rotor speed, and nonlinear analysis with varying rotor speed.

35
CHAPTER VI
NONLINEAR ROTORDYNAMIC PREDICTIONS This section contains predictions of the nonlinear time transient, rotor speed
transient, TC rotor response. Automotive TC shaft operation normally involves a varying
shaft speed. In this analysis the shaft accelerates from 30 krpm to 240 krpm and
decelerates down to 30 krpm with 500Hz/s speed ramp rate, unless otherwise stated. The
time duration is 7 seconds for the shaft to accelerate from the lowest to the highest shaft
speed. In the numerical integration, the sampling rate equals 10,000 samples/sec (Δt =
0.1ms). Table 1 lists the parameters used in the nonlinear speed transient numerical
analysis.
The results are best understood in the frequency domain; hence, the predicted
responses are converted from the time domain into the frequency domain using the
discrete Fast Fourier Transform (FFT). The frequency contents of the predictions are
obtained by dividing the whole time domain data into segments of 211 (2048) points
(time span of each segment ~102ms) and applying the FFT on each time segment. The
maximum shaft speed is 240 krpm (4,000Hz), hence the maximum frequency and Δf in
the FFTs are 5,000Hz and 4.88 Hz, respectively.
Table 1. Parameters for speed transient, time transient. Shaft speed=30-240krpm, sampling time=100μs
‡ The processor and other specifications of the computer used in this analysis are IntelR CoreTM2 CPU 4300@ 1.80GHz, 1.79 GHz, 2.00GB of RAM
Ramp Rate Δf
Time Segment Duration
Time Steps per Segment
Total Integration
Time
Number of Time
Segments
Total # of
Time Steps
Total ‡CPU
Time for Speed
Transient [Hz/s] [Hz] [s] - [s] - [hr] ±500 4.88 0.5 5,000 7.0 14 70,000 ~9.0

36
In order to determine the effect of various operating conditions, and bearing and rotor
characteristics, on bifurcations and frequency jump phenomenon, only one parameter is
varied at a time. A baseline case is below, showing the typical results for the
corresponding operating conditions§.
Baseline Case Appendix A lists the operating conditions as well as the rotor and bearing
specifications for the baseline case. The rotor speed ramp rate is 500Hz/s, and a 4-plane
static imbalance distribution is used ( ).
The predicted response amplitudes in the following sections are presented in
dimensionless form with respect to the maximum physical displacement at the
compressor end, which is listed in Appendix A.
Figures 20 and 21 depict the predicted waterfalls of TC shaft motion at the
compressor end, along the horizontal and vertical directions, respectively. The
synchronous response is labeled with ‘1X’. Figure 21 (bottom) shows the contour map
of shaft motions in the vertical direction and the synchronous line is marked with yellow
arrows. In the waterfall plots, subsynchronous whirl frequencies are marked with ‘ω1’
and ‘ω2’, respectively.
Both waterfalls show motions with a subsynchronous whirl frequency (ω1) up to
165 krpm (2.75 kHz) shaft speed. At this speed (Ωbifurcation) there is a jump from ω1 to a
second whirl frequency, ω2. Note the second whirl frequency persists up to the highest
shaft speed, 240 krpm (4 kHz).
As the shaft decelerates, ω2 disappears at 182 krpm (~3 kHz), and ω1 shows up
and persists up to the lowest shaft speed, 30 krpm (500 Hz). The 2nd whirl motion
persists over a longer speed span during the ramp up motion than when the rotor
decelerates. The differences in response (in this case ω1, ω2, and Ωbifurcation) between the
ramp up and ramp down cases are hereby named hysteresis, which is a typical
characteristic of subcritical bifurcations [18]. The contour map in Fig. 21 shows the
§ The operating conditions follow TC manufacturer practice.
C TC T

37
frequency jump and the hysteresis in the corresponding Ωbifurcation during shaft
acceleration and deceleration. Also, note the amplitude of ω1 is higher in the vertical
direction than along the horizontal direction, which will be discussed later. In each FFT,
the shaft speed variation is rather fast (~6,200 rpm, 103Hz). Recall (from Table 1) the
FFT step frequency Δf ~5Hz. The fast variation of shaft speed over each time span
smears (no sharp peaks) the synchronous response.
Am
plitu
de (-
)
0 1000 2000 3000 4000
Frequency (Hz)
0 1000 2000 3000 4000
Frequency (Hz) Rotor Speed (krpm)
30 105
240 105
30
Rotor Speed (krpm)
30 105
240 105
30
0.1
0.
2
0.3
ω1
ω2 ω1
Jump at 182krpm (ramp down)
Jump at 165 krpm (ramp up)
1X
Figure 20: Waterfalls of predicted TC shaft motion at the compressor end, horizontal direction, baseline case. Shaft speed ramp rate =500 Hz/s.
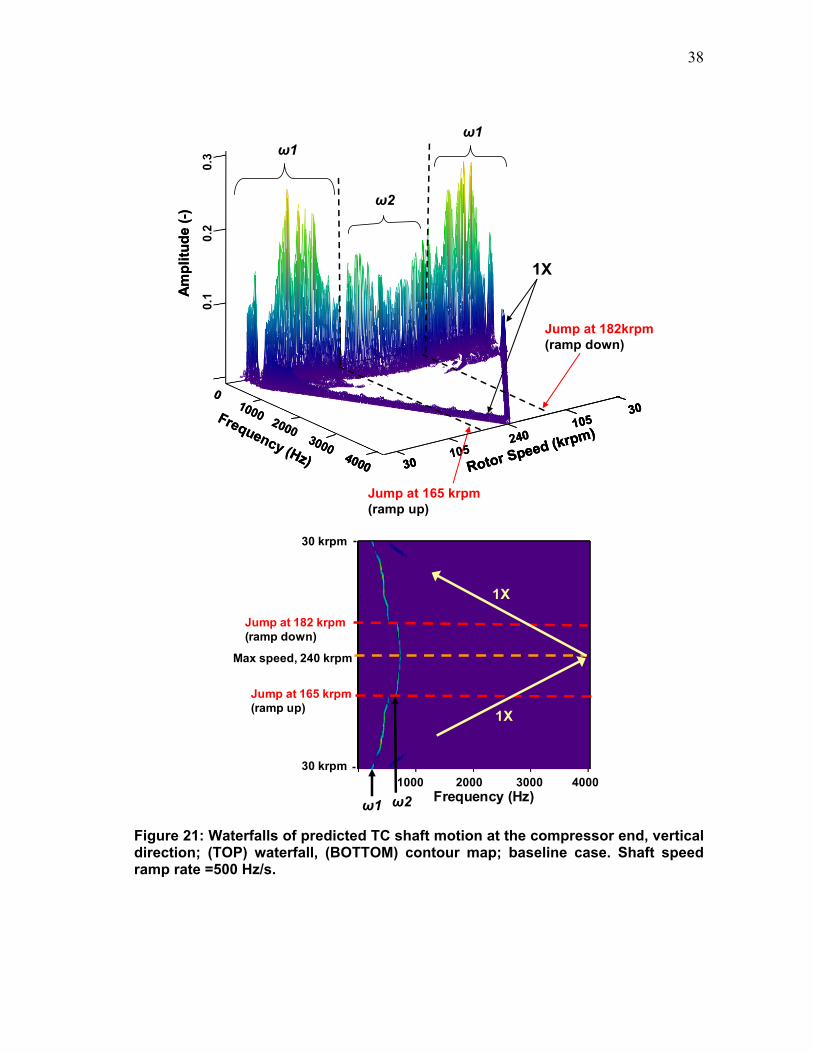
38
0.1
0.2
0
.3
Am
plitu
de (-
)
0 1000 2000 3000 4000
Frequency (Hz) Rotor Speed (krpm)
30 105
240 105
30
Am
plitu
de (-
)
0 1000 2000 3000 4000
Frequency (Hz)
0 1000 2000 3000 4000
Frequency (Hz) Rotor Speed (krpm)
30 105
240 105
30
Rotor Speed (krpm)
30 105
240 105
30
ω1
ω2
ω1
Jump at 182krpm (ramp down)
Jump at 165 krpm (ramp up)
1X
Frequency (Hz)1000 2000 3000 4000
Jump at 182 krpm (ramp down)
Max speed, 240 krpm
Jump at 165 krpm (ramp up)
30 krpm
30 krpm
1X
1X
ω1 ω2
Figure 21: Waterfalls of predicted TC shaft motion at the compressor end, vertical direction; (TOP) waterfall, (BOTTOM) contour map; baseline case. Shaft speed ramp rate =500 Hz/s.

39
Figure 22 depicts the peak to peak (pk-pk) amplitude of shaft total motion at the
compressor end during rotor acceleration ( ) and deceleration ( ). The total shaft
motion contains amplitudes of synchronous, all subsynchronous, and supersynchronous
(if any) motions. The total amplitude of shaft motion remains unchanged whether the
rotor accelerates or decelerates. The amplitude of total shaft motion is between ~ 20%
and 40% of the maximum allowed shaft motions at the compressor end.
0.00
0.10
0.20
0.30
0.40
0.50
0 50 100 150 200 250
Shaft Speed (krpm)
Tota
l Am
plitu
de p
k-pk
(-)
Rotor accelerates
Rotor deceleratesCompressor end
Figure 22: Total TC shaft motion (pk-pk) amplitude at the compressor end during rotor acceleration ( ) and deceleration ( ). Baseline case, shaft speed ramp rate =500 Hz/s.
Figure 23 (top) depicts the predicted inner and outer film static reaction forces (in
vertical direction) at the (a) compressor bearing and (b) turbine bearing. The outer film
static reaction forces, shown in these figures, are normalized with respect to the rotor
weight, and closely correspond to the hydrostatic loads applied along the vertical
direction on the bearings. Note the nearly nil inner film static loads.
Figure 23 (c) depicts the static** displacements (vertical direction) of the
compressor ring with respect to the outer film clearance. The hydrostatic side load is
applied on the ring; hence the ring eccentricity is ~ 83% of the outer film clearance at low
** The “static” displacements correspond to the zero frequency component of the DFT (Discrete Fourier Transform) of shaft motions and obtained from the time varying rotor response in the nonlinear analysis.

40
shaft speeds. The static displacement of the turbine ring (not shown) is similar to that of
the compressor bearing, ranging from ~85% (low shaft speeds) to 70% (high shaft
speeds) of the outer film clearance. Figure 23 (d) shows the journal static displacements
relative to the ring (normalized with respect to the inner film clearance). As results in
Figure 23(d) show, the journal (relative to the ring) static displacements vary between 0%
and~ 4.5% of the inner film clearance, indicating of journal operation close to the ring
center due to the nearly nil static load acting on the inner film.
Figure 24 shows the compressor ring displacements (along the vertical direction)
versus time. The displacements are normalized with respect to the outer film clearance.
Note the maximum peak to peak (pk-pk) ring displacement is ~ 60% of the outer film
clearance. Figure 24(b) depicts the results in Fig. 24(a) in a time span from 3.9s to
3.906s. The frequency of the ring motion over this time span is ~ 667Hz (WFR~0.27),
while the shaft speed is ~ 147 krpm (2,450 Hz). The pk-pk displacements at the turbine
ring are smaller (maximum value ~ 15% of the outer film clearance). Time transient
predictions show that ring motions have frequencies ranging from ~ 300Hz to 900Hz as
the shaft speed increases from 30 krpm (500Hz) to 240 krpm (4,000Hz).
Note the outer film in a SFRB is a squeeze film damper (SFD). The results in
Figure 23 show the outer film supports the hydrostatic side load. According to Refs. [39]
and [40], high frequency damper journal motions and operation at high instantaneous
journal eccentricities induces lubricant cavitation in the film. However, the high oil
supply pressure (see Table A.5) may prevent or delay this eventuality. Refs. [42-43] show
cases where a SFD without retainer springs relies on unbalance force for journal lift-off.
In this study, rotor whirl motions induce inner film forces that act on the ring. The ring
whirl motions generate hydrodynamic pressures in the outer film, which results in ring
lift-off.

41
0 50 100 150 200 25040−
30−
20−
10−
0
0 50 100 150 200 25040−
30−
20−
10−
0
0 50 100 150 200 2500.9−
0.8−
0.7−
0.6−
0.5−
Inner film
Outer film
Inner film
Outer filma
b
c d
Shaft Speed (krpm)
Stat
ic L
oad
(-)
Shaft Speed (krpm)
Stat
ic L
oad
(-)
Shaft Speed (krpm)Shaft Speed (krpm)
Am
plitu
de (-
)
Am
plitu
de (-
)
Compressor bearing Turbine bearing
Compressor ring static displacement Journal relative to ring @ comp brg
0 50 100 150 200 2500.05−
0.04−
0.03−
0.02−
0.01−
0
0.01
Figure 23: Prediction from transient shaft speed analysis. Static load on inner and outer films (a) compressor bearing and (b) turbine bearing; [Normalized with respect to rotor weight]. Predicted static displacements in vertical direction (c) compressor ring (normalized with respect to the outer film clearance), (d) rotor relative to the ring (normalized with respect to the inner film clearance).
0 2 4 6 81−
0.8−
0.6−
0.4−
0.2−
0
0.2
3.9 3.903 3.9061−
0.8−
0.6−
0.4−
0.2−
Compressor ring displacement (vertical direction) versus time
Am
plitu
de (-
)
Time (s) Time (s)
1.5ms~667Hza bAm
plitu
de (-
)
Shaft speed= 147krpm (2.45kHz)
Figure 24: Compressor ring displacements along the vertical direction (from the nonlinear analysis) versus time. (a) Time between 0-7 seconds, (b) a portion of highlighted time window in (a).
Figures 25 and 26 depict the amplitude of subsynchronous whirl motions at the
compressor end during rotor acceleration and deceleration, respectively. The figures

42
show shaft motions in (a) horizontal and (b) vertical planes. The symbols and
correspond to the first (ω1) and second (ω2) subsynchronous frequencies, respectively.
Whether the shaft accelerates or decelerates, the amplitude of first whirl frequency is
somewhat larger in the vertical direction compared to that in the horizontal direction
(non-circular orbits of shaft motion at low rotor speeds). The outer film forces may not
be the same squeeze along the horizontal and vertical directions. In the following
sections, for brevity, only the motions in the vertical direction are presented.
Results in Figs. 25(b) and 26(b) show there is hysteresis associated with
Ωbifurcation when the rotor accelerates and decelerates. However, there is no significant
hysteresis in the amplitude of subsynchronous motion between ramp up and ramp down
cases. As a note, in cases where there are multiple shaft speeds where there is a jump
between ω1 and ω2, the one associated with the highest subsynchronous amplitude is
noted as Ωbifurcation.
0.00
0.05
0.10
0.15
0.20
0.25
0.30
0 50 100 150 200 250Shaft Speed (krpm)
Am
plitu
de (-
)
ω1_upω2_up
JUMP
165krpm
Compressor X-direction
a
0.00
0.05
0.10
0.15
0.20
0.25
0.30
0 50 100 150 200 250Shaft Speed (krpm)
Am
plitu
de (-
)
ω1_upω2_up
JUMP
165 krpm
Compressor endY-direction
b
Figure 25: Subsynchronous whirl amplitudes versus shaft speed, rotor accelerates (+500Hz/s). Motions at the compressor end in (a) horizontal and (b) vertical directions. 1st whirl frequency ω1 ( ), 2nd whirl frequency ω2 ( ). Baseline case.

43
0.00
0.05
0.10
0.15
0.20
0.25
0.30
0 50 100 150 200 250Shaft Speed (krpm)
Am
plitu
de (-
)ω1_downω2_down 182krpm
Compressor end
X-direction
a
JUMP
0.00
0.05
0.10
0.15
0.20
0.25
0.30
0 50 100 150 200 250Shaft Speed (krpm)
Am
plitu
de (-
)
ω1_downω2_down 182 krpm
Compressor end
Y-direction
b
JUMP
Figure 26: Subsynchronous whirl amplitudes versus shaft speed, rotor decelerates (-500Hz/s). Motions at the compressor end in (a) horizontal and (b) vertical directions. 1st whirl frequency ω1 ( ), 2nd whirl frequency ω2 ( ). Baseline case.
Figures 27 and 28 depict the predicted subsynchronous whirl frequencies versus
shaft speed during rotor acceleration and deceleration, respectively. In both figures, the
corresponding whirl motion amplitudes are shown with vertical lines. The graphs
provide a scale for quantifying the whirl amplitudes. The scale denotes 10% of the
maximum physical displacement at the compressor end. The diamond and triangle
symbols denote the first (ω1) and the second (ω2) subsynchronous frequencies,
respectively. The mode shapes shown, are obtained by filtering the frequency content of
the nonlinear response predictions (obtained at five locations in the turbocharger rotor).
In other words, the frequency range of interest is selected in the results from the FFT
analysis. Hence, each mode shape corresponds to a certain whirl frequency. Appendix B
details the procedure in obtaining the filtered mode shapes.
Figure 27 shows the first whirl frequency (ω1) ranges from ~300 Hz to 670 Hz,
and the second frequency (ω2) ranges from ~820 Hz to 900 Hz. High amplitude motions
have characteristic frequencies mainly ranging from ~450 Hz to 600 Hz. The obtained
rotor mode shapes show that the first whirl frequency (ω1) corresponds to a conical
mode, and the second whirl frequency (ω2) represents a cylindrical bending mode. At
the Ωbifurcation, 165 krpm (2,750 Hz), five times the first whirl frequency (5ω1) is
approximately equal to four time the second whirl frequency (5ω1 ~4ω2). In addition, at
Ωbifurcation, 165 krpm (2,750 Hz), 3ω1 +ω2 ~ Ωbifurcation.

44
Figure 28 shows that during rotor deceleration, the frequency content of the first
and second subsynchronous frequencies is similar to those during rotor acceleration.
However, the Ωbifurcation occurs at a higher shaft speed, 182 krpm (~3 kHz). Hence, the
combined relation between the whirl frequencies and the running speed is 2ω1 +2ω2
~Ωbifurcation. Interestingly, the internal relation between ω1 and ω2 at the Ωbifurcation is
identical to that during rotor acceleration.
Figure 29 overlays the predicted damped natural frequencies on the
subsynchronous whirl frequencies (during rotor acceleration). The 1st whirl frequency
(ω1) follows the conical mode (with SFRB in conical mode) up to shaft speeds around
80 krpm. At shaft speeds above 80 krpm the whirl frequencies ω1 and ω2 do not follow
any of the predicted natural frequencies from the eigenvalue analysis. Note the filtered
rotor motions shown in Figs. 27 and 28 are obtained from the nonlinear analysis (see
Appendix B for details). If the whirl frequencies would represent the RBS natural
frequencies, based on the definition in Ref [12], the abovementioned relations, (5ω1
~4ω2) and (2ω1 +2ω2 ~Ωbifurcation), would be referred to as an internal resonance and a
combined resonance, respectively. However, throughout this thesis these relations are
called simply internal and combined relations.
0
200
400
600
800
1000
1200
1400
0 50 100 150 200 250Shaft Speed (krpm)
Freq
uenc
y (H
z)
ω1_upω2_up
JUMP
165krpmCompressor endY-direction
0.1
(-)
ω2 = 815 Hz Ωb= 165krpm
ω1 = 654 Hz Ωb= 165krpm
@ Ωb= 165krpm (2.75kHz) 5ω1 ~ 4ω23ω1 + ω2~ Ωb
Cylindrical bending rotor filtered whirling mode
Conical rotor filtered whirling modeΩb
CT
CT
CT
CTUP
Figure 27: Subsynchronous whirl frequencies versus rotor speed; acceleration = +500Hz/s; baseline case. Normalized amplitudes at compressor end in vertical direction shown (scale included).

45
0
200
400
600
800
1000
1200
1400
0 50 100 150 200 250Shaft Speed (krpm)
Freq
uenc
y (H
z)ω1_downω2_down
JUMP
182krpm
Compressor d
Y-direction
0.1
(-)
00
ω2 = 845 Hz Ωb= 182krpm
ω1 = 674 Hz Ωb= 182krpm
@ Ωb=182krpm (~3kHz)5ω1 ~ 4ω22ω1 + 2ω2~ Ωb
Ωb
DOWN
CT
CT
CT
CT
Cylindrical bending rotor filtered whirling mode
Conical rotor filtered whirling mode
Figure 28: Subsynchronous whirl frequencies versus rotor speed; deceleration = -500Hz/s; baseline case. Normalized amplitudes at compressor end in vertical direction shown (scale included).
0
400
800
1200
1600
2000
2400
0 50 100 150 200 250Shaft Speed (krpm)
Freq
uenc
y (H
z)
Conical mode
Cylindrical bending mode
Conical mode, with comp and turb ring modes
Cylindrical mode, with comp and turb ring modes
1st elastic mode
0.5 Ω
0.25 Ω
Ω: shaft speed
Figure 29: Subsynchronous whirl frequencies and damped natural frequencies (from eigenvalue analysis) versus rotor speed. Figures 30 and 31 depict the predicted whirl frequency ratios (WFRs) versus rotor
speed during rotor acceleration and deceleration, respectively. The WFR equals
subsynchronous frequency divided by the frequency of shaft rotation. Predictions
correspond to shaft motions in the vertical direction at the compressor end. The

46
horizontal dashed lines denote 50% and 25% of rotor speed. Results in both figures show
that the subsynchronous frequencies at low shaft speeds (below 50 krpm) are 50% of the
rotor speed. The ½ rotor frequency is a typical oil whirl instability in rotors supported on
plain journal bearings. Since the SFRB does not rotate, the inner film acts as a plain
journal bearing. In addition, at the Ωbifurcation, the TC rotor whirls at a frequency close to
25% of the rotor speed. This observation holds during both rotor acceleration and
deceleration for all the cases (with various operating conditions) in this thesis study.
Hence, for brevity, the WFR versus shaft speed is provided only for the baseline case. In
general, as the shaft speed increases, the first whirl frequency decreases from 50% to
~22% of the rotor speed, up to Ωbifurcation. After the frequency jump, the second whirl
frequency decreases from ~30% to 20% of the rotor speed. The WFRs are almost
identical during rotor acceleration and deceleration.
0.00
0.25
0.50
0.75
1.00
0 50 100 150 200 250Shaft Speed (krpm)
WFR
(-)
ω1_up
ω2_up
Compressor endY-direction
1/4xΩ
Ω: Shaft speed
1/2xΩ
JUMP 165krpm
0.1
(-)
UP
Figure 30: Predicted whirl frequency ratio versus rotor speed; acceleration = +500Hz/s; baseline case. Normalized amplitudes at compressor end in vertical direction shown (scale included).
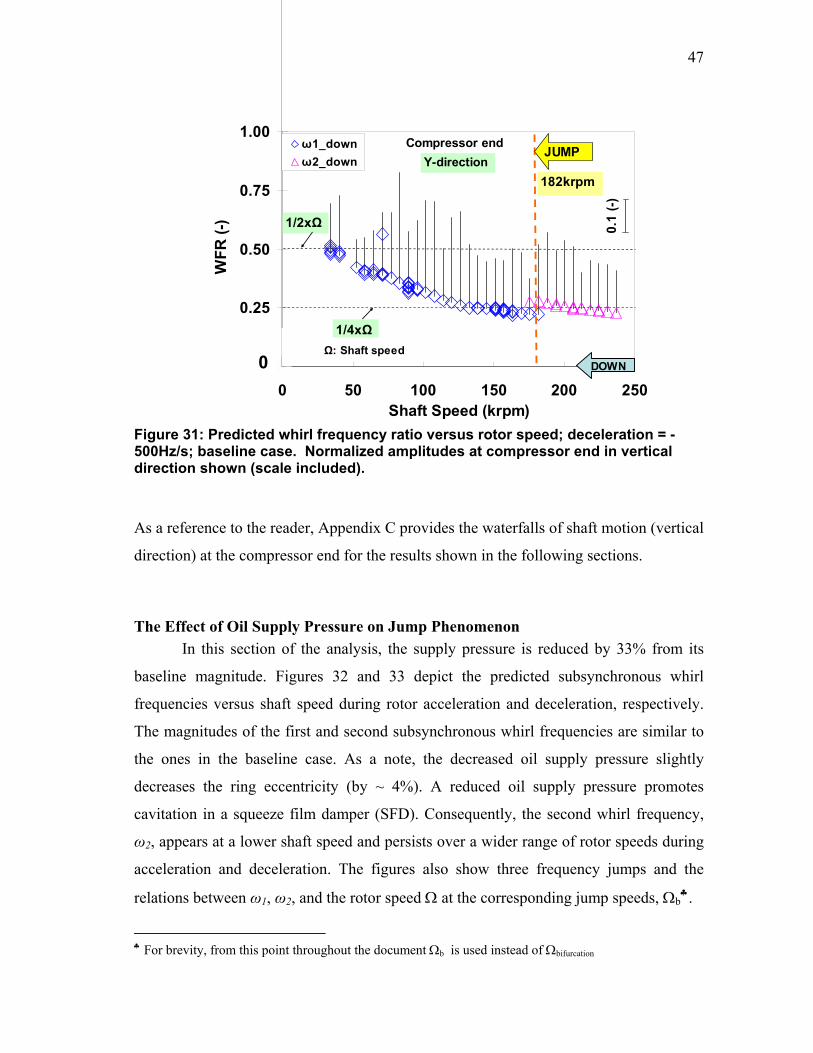
47
0.00
0.25
0.50
0.75
1.00
0 50 100 150 200 250Shaft Speed (krpm)
WFR
(-)
ω1_downω2_down
Compressor endY-direction
1/4xΩ Ω: Shaft speed
1/2xΩ
JUMP
182krpm
0.1
(-)
00 DOWN
Figure 31: Predicted whirl frequency ratio versus rotor speed; deceleration = -500Hz/s; baseline case. Normalized amplitudes at compressor end in vertical direction shown (scale included).
As a reference to the reader, Appendix C provides the waterfalls of shaft motion (vertical
direction) at the compressor end for the results shown in the following sections.
The Effect of Oil Supply Pressure on Jump Phenomenon In this section of the analysis, the supply pressure is reduced by 33% from its
baseline magnitude. Figures 32 and 33 depict the predicted subsynchronous whirl
frequencies versus shaft speed during rotor acceleration and deceleration, respectively.
The magnitudes of the first and second subsynchronous whirl frequencies are similar to
the ones in the baseline case. As a note, the decreased oil supply pressure slightly
decreases the ring eccentricity (by ~ 4%). A reduced oil supply pressure promotes
cavitation in a squeeze film damper (SFD). Consequently, the second whirl frequency,
ω2, appears at a lower shaft speed and persists over a wider range of rotor speeds during
acceleration and deceleration. The figures also show three frequency jumps and the
relations between ω1, ω2, and the rotor speed Ω at the corresponding jump speeds, Ωb♣.
♣ For brevity, from this point throughout the document Ωb is used instead of Ωbifurcation

48
Another point of interest is the effect of supply pressure on the amplitude of total
motion. Figure 34 depicts the predicted amplitudes of shaft total motions at the
compressor end during rotor acceleration and deceleration for the baseline case and the
reduced supply pressure case. At the lower supply pressure, the total amplitude of shaft
motion is smaller, mainly due to a reduced amplitude of subsynchronous motions (i.e.
see the vertical lines, representing subsynchronous amplitudes, in Figs. 27 and 32). This
observation is already reported for a different TC unit in Ref [43].
Predicted results show that a higher oil inlet supply pressure delays the onset
speed of the second whirl frequency, and therefore, further delays the onset of the
bifurcation speed, Ωb. This finding is consistent with measurements by Schweizer and
Sievert [31] where increasing the supply pressure from 1.5 bar to 3 bar delays Ωb from
45 krpm to 60 krpm. However, Ref. [10] reports that oil supply pressure has an
insignificant effect on Ωb. Alas, no test data is provided by the TC manufacturer to
support this observation.
0
200
400
600
800
1000
1200
1400
0 50 100 150 200 250Shaft Speed (krpm)
Freq
uenc
y (H
z)
ω1_upω2_up
JUMP1
119krpm
Compressor end
Y-direction
0.1
(-)
150krpmJUMP2
JUMP3 162krpm
Ωb1
Ωb2
Ωb3
@ Ωb1=119krpm (~2kHz), ω1=493Hz, ω2=732Hz
3ω1 ~ 2ω2ω1 +2ω2~ Ωb1
@ Ωb2=150krpm (~2.5kHz), ω1=562Hz, ω2=747Hz4ω1 ~ 3ω23ω1 + ω2~ Ωb2
@ Ωb3=162krpm (~2.7kHz), ω1=576Hz, ω2=767Hz
4ω1 ~ 3ω22ω1 + 2ω2~ Ωb3UP
CT
CT
C TC T
Figure 32: Predicted subsynchronous whirl frequencies versus rotor speed; acceleration= +500Hz/s; oil supply pressure reduced by 33%. Normalized amplitudes in vertical direction shown at compressor end (scale included).

49
0
200
400
600
800
1000
1200
1400
0 50 100 150 200 250Shaft Speed (krpm)
Freq
uenc
y (H
z)ω1_downω2_down
JUMP1 120krpm
Compressor end
Y-direction
102krpm
96krpm
JUMP2
JUMP3
0.1
(-)
0
@ Ωb1=120krpm (2kHz), ω1=508Hz, ω2=732Hz
3ω1 ~ 2ω2ω1 +2ω2~ Ωb1
@ Ωb2=102krpm (1.7kHz), ω1=474Hz, ω2=703Hz
3ω1 ~ 2ω22ω1 + ω2~ Ωb2
@ Ωb3=96krpm (1.6kHz), ω1=474Hz, ω2=674Hz
3ω1 ~ 2ω22ω1 + ω2~ Ωb3
Ωb1Ωb2
Ωb3
DOWN
C TC T
C TC T
Figure 33: Predicted subsynchronous whirl frequencies versus rotor speed; deceleration= -500Hz/s; oil supply pressure reduced by 33%. Normalized amplitudes in vertical direction shown at compressor end (scale included).
0.00
0.10
0.20
0.30
0.40
0.50
0 50 100 150 200 250Shaft Speed (krpm)
Tota
l Am
plitu
de p
k-pk
(-)
Compressor end
Baseline case
Rotor accelerates
Rotor decelerates
Reduced pressure (by 33%)
Figure 34: Predicted amplitude of total shaft motions at the compressor end during rotor acceleration and deceleration; baseline and reduced (33%) supply pressure cases.

50
The Effect of Oil Supply Temperature on Jump Phenomenon This section assesses the effect of lubricant supply temperature on the
subsynchronous frequency jump phenomenon of the studied TC unit. Predictions are
conducted at three different oil supply temperatures: Tlow, Tbaseline, Thigh. Table A6 lists
the actual oil supply temperatures. Figure 35 shows the effective (inner and outer) oil
film viscosity, at the compressor bearing, for the three oil supply temperatures. The
highest (Thigh) and the lowest (Tlow) temperatures cause the outer film viscosity to vary
by 15-20% and the inner film viscosity to vary by 10-15% from the ones in the baseline
case.
Figures 36 and 37 show the predicted subsynchronous whirl frequencies at the
compressor end for Tlow and Thigh oil supply temperatures, respectively. The results in
the top graphs correspond to cases with rotor accelerating, and the bottom graphs
correspond to speed ramp down cases. Figure 36 also includes an inset corresponding to
the whirl frequency versus shaft speed for the baseline case. Despite the changes in inner
and outer oil film viscosities, the subsynchronous (as well as the total) amplitudes of
shaft motions remain similar in all cases with various oil supply temperatures. However,
the supply temperature affects the speeds at which the whirl frequencies (ω1 and ω2)
appear (or disappear). Increasing the oil supply temperature from Tlow to Tbaseline
increases the Ωb during ramp down (from 163 krpm to 182 krpm). However, further
increasing the oil supply temperature from Tbaseline to Thigh, lowers the onset speed of ω2
appearance, with Ωb occurring at a lower speed (150 krpm). This finding is consistent
with the test data provided in Figs. 2 and 3 where increasing the oil supply temperature
from 30°C to 100°C decreases the Ωb (from 108 krpm to 84 krpm). Note the multiple
frequency jumps in Fig. 37 as a result of a reduced oil viscosity (higher temperature).
Interestingly, at a certain oil supply temperature, the internal relations between ω1 and
ω2 (provided in Figs. 36 and 37) remain the same at all jump speeds during rotor
acceleration and deceleration. In other words, at all bifurcations speeds, Ωb, at Tlow oil
supply temperature, 5ω1 ~ 4ω2 and at Thigh oil supply temperature, 4ω1 ~3ω2.
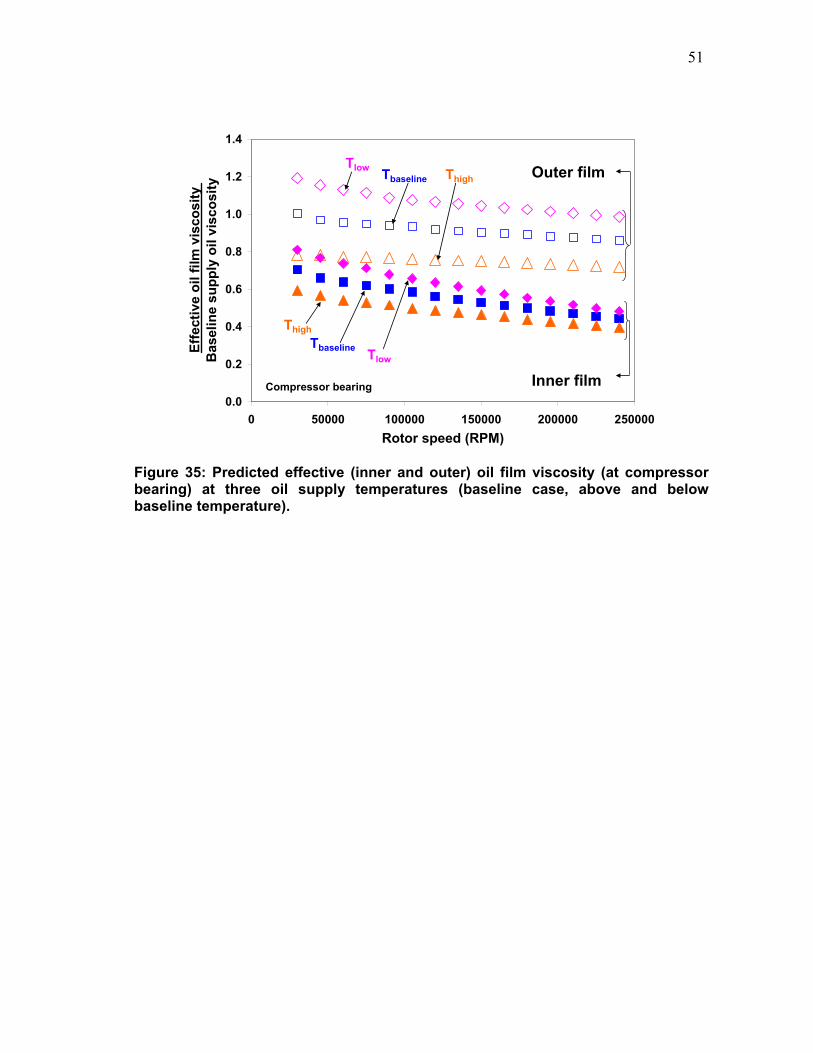
51
0.0
0.2
0.4
0.6
0.8
1.0
1.2
1.4
0 50000 100000 150000 200000 250000Rotor speed (RPM)
Effe
ctiv
e oi
l film
vis
cosi
ty
Bas
elin
e su
pply
oil
visc
osity
Compressor bearing Inner film
Outer filmThighTbaselineTlow
Tlow
ThighTbaseline
Figure 35: Predicted effective (inner and outer) oil film viscosity (at compressor bearing) at three oil supply temperatures (baseline case, above and below baseline temperature).

52
0
200
400
600
800
1000
1200
1400
0 50 100 150 200 250Shaft Speed (krpm)
Freq
uenc
y (H
z)ω1_upω2_up
Compressor end
Y-direction
JUMP
165krpm
0.1
(-)
@ Ωb =165krpm(2.75kHz) ω1=684Hz, ω2=820Hz
5ω1 ~ 4ω2Ωb
0200400600800
100012001400
0 50 100 150 200 250Shaft Speed (krpm)
Freq
uenc
y (H
z) ω1_upω2_up
JUMP
165krpm
BASELINE
0.1
(-)
Tlow
UP00
CT
CT
CT
CT
0200400600800
100012001400
0 50 100 150 200 250Shaft Speed (krpm)
Freq
uenc
y (H
z)
JUMP
182krpm0.1
(-)
BASELINE
0
200
400
600
800
1000
1200
1400
0 50 100 150 200 250Shaft Speed (krpm)
Freq
uenc
y (H
z)
ω1_downω2_down
Compressor end
Y-direction
JUMP
163 krpm0.1
(-)
0
Ωb @ Ωb =163krpm (~2.7kHz) ω1 =659Hz, ω2 =820Hz
5ω1 ~ 4ω23ω1 +ω2~ Ωb
DOWN
C TC T
C TC T
Tlow
Figure 36: Predicted subsynchronous whirl frequencies versus rotor speed; reduced oil supply temperature (Tlow). (TOP) rotor acceleration = 500Hz/s; (BOTTOM) rotor deceleration= -500Hz/s. Normalized amplitudes in vertical direction shown at compressor end (scale included).

53
0
200
400
600
800
1000
1200
1400
0 50 100 150 200 250Shaft Speed (krpm)
Freq
uenc
y (H
z)ω1_upω2_up
JUMP1150 krpm
Compressor Y-direction
0.1
(-) JUMP2162 krpm
JUMP3 193krpm
Ωb1
Ωb2
Ωb3
@ Ωb1=150krpm(2.5kHz), ω1=620Hz, ω2=801Hz4ω1 ~ 3ω2
@ Ωb2=162krpm(2.7krpm), ω1=620Hz, ω2=811Hz
4ω1 ~ 3ω23ω1 + ω2~ Ωb2
@ Ωb3=193krpm(~3.2kHz), ω1=674Hz, ω2=845Hz
4ω1 ~ 3ω2ω1 + 3ω2~ Ωb3UP
C TC T
C TC TThigh
0
200
400
600
800
1000
1200
1400
0 50 100 150 200 250Shaft Speed (krpm)
Freq
uenc
y (H
z)
ω1_downω2_down
JUMP1 182krpm
Compressor endY-direction
0.1
(-)
JUMP2
JUMP3
JUMP4
JUMP5
163krpm
151krpm
132krpm
108krp
@ Ωb1(~3kHz), ω1=645Hz, ω2=840Hz
@ All Ωb, 4ω1 ~ 3ω2
@ Ωb2(~2.7kHz), ω1=615Hz, ω2=811Hz
2ω1 + 2ω2~ Ωb1
3ω1 + ω2~ Ωb2
@ Ωb3(2.5kHz), ω1=601Hz, ω2=786Hz3ω1 + ω2~ Ωb3
@ Ωb4(2.2kHz), ω1=581Hz, ω2=786Hzω1 + 2ω2~ Ωb4
@ Ωb5(1.8kHZ), ω1=522Hz, ω2=737Hz
2ω1 + ω2~ Ωb5
Ωb1
Ωb2
Ωb3
Ωb4
Ωb5
DOWN
C T
C TDOWN
Thigh
Figure 37: Predicted subsynchronous whirl frequencies versus rotor speed; increased oil supply temperature (Thigh). (TOP) rotor acceleration = 500Hz/s; (BOTTOM) rotor deceleration= -500Hz/s. Normalized amplitudes in vertical direction shown at compressor end (scale included).

54
The Effect of Bearing Inner Film Length on Jump Phenomenon The bearing inner film length is increased by 15%, (compared to the baseline
length), and nonlinear predictions are obtained for shaft speed ramp up and ramp down
cases. In this analysis, the hydrostatic side loads applied on the bearings are identical to
the ones in the baseline case. Therefore, the ring static displacement is the same as for
the baseline case. Figure 38 depicts the subsynchronous whirl frequencies at the
compressor end versus shaft speed. The figures include insets corresponding to the
results for the baseline case. The shaft amplitudes of total motions decrease by~ 11%
with increasing the bearing inner length. This observation is consistent with the general
statement in Ref. [15] regarding the increase in amplitude of TC shaft motion as a result
of shortening the bearing inner film length.
For the longer inner film length, at shaft speeds between 120 krpm (~2 kHz) and
162 krpm (2.7 kHz), the first subsynchronous whirl frequency, ω1, increases. This
increase in ω1 creates a smooth transition between ω1 and ω2 at Ωb=162 krpm during
ramp up and at Ωb=163 krpm (~2.72 kHz) during rotor deceleration. Figure 38 (top)
shows an inset of (normalized) rotor static displacement (in vertical direction) relative to
the ring at the compressor bearing. The highlighted regions correspond to the shaft
speeds over which ω1 increases (compared to the baseline case).
Recall the baseline case where the rotor static displacement shows a sudden dip
at around Ωb, see Fig. 23(d) (highlighted region), with a jump in whirl frequency at Ωb,
see Fig 27. Presently, for the bearing with a longer inner length, at speeds around Ωb the
journal climbs smoothly towards the ring center, without showing a jump in whirl
frequency (see Fig. 38). For the same applied static load on the bearing, the rotor
operates closer to the center when the inner film length is increased. Therefore, journal
operation is similar to the one at high shaft speeds, which explains the increase in ω1 at
shaft speeds close to Ωb.
Interestingly, the subsynchronous frequencies (and amplitudes) remain
unchanged for the two studied inner film lengths, at low (below 100 krpm) and at high
(above 170 krpm) shaft speeds. The main discrepancies occur at shaft speeds close to the
bifurcation speed.

55
0 50 100 150 200 2500.05−
0.04−
0.03−
0.02−
0.01−
0
0.01
0
200
400
600
800
1000
1200
1400
0 50 100 150 200 250Shaft Speed (krpm)
Freq
uenc
y (H
z)ω1_upω2_up
162 krpm
Compressor end
Y-direction0.1
(-)
0200400600800
100012001400
0 50 100 150 200 250Shaft Speed (krpm)
Freq
uenc
y (H
z) ω1_upω2_up
JUMP
165krpm
BASELINE
0.1
(-)
Increased Liby 15%
UP
C TC T
CT
CT
Y
Journal static displacement relative to the ring at compressor bearing
Am
plitu
de (-
)
Shaft Speed (krpm)
0
200
400
600
800
1000
1200
1400
0 50 100 150 200 250Shaft Speed (krpm)
Freq
uenc
y (H
z)
ω1_downω2_down
163 krpm
Compressor end
Y-direction0.1
(-)
0200400600800
100012001400
0 50 100 150 200 250Shaft Speed (krpm)
Freq
uenc
y (H
z)
JUMP
182krpm0.1
(-)
BASELINE
DOWN000
C TC T
C TC T
Increased Liby 15%
Figure 38: Predicted subsynchronous whirl frequencies versus rotor speed; bearing inner length increased by 15% (compared to baseline case). (TOP) rotor acceleration = 500Hz/s; (BOTTOM) rotor deceleration = -500Hz/s. Normalized amplitudes in vertical direction shown at compressor end (scale included).

56
The Effect of Rotor Acceleration/Deceleration on Jump Phenomenon The effect of rotor acceleration or deceleration on the frequency jump
phenomenon is assessed. Predictions are conducted at fixed shaft speeds as well as with
various shaft speed ramp rates: 250 Hz/s, 500 Hz/s (baseline case), and 750 Hz/s. In
order to reduce computational time, predictions for the 250 Hz/s ramp rate are conducted
only at shaft speeds between 90 krpm (1.5 kHz) and 190 krpm (~3.2 kHz) (includes the
bifurcation speed). Figure 39 depicts the amplitude of total shaft motion (pk-pk) at the
rotor compressor end during rotor (a) acceleration and (b) deceleration as well as for the
fixed shaft speed condition. The amplitude of total motion remains unchanged with shaft
acceleration or deceleration, and it is between 20% and 40% of the physical limit at the
compressor end. As the rotor speed increases, the amplitude of total motion decreases.
Figure 40 depicts the subsynchronous whirl frequency versus shaft speed at the
compressor end. The shaft accelerates (top graph) and decelerates (bottom graph) with
250 Hz/s ramp rate. In addition, the figure shows the subsynchronous whirl frequencies
for the baseline case (500 Hz/s). Results in Fig. 40 shows an internal relation between
the whirl frequencies, 4ω1 ~ 3ω2, similar for both ramp up (+250 Hz/s) and ramp down
(-250 Hz/s) cases. Figure 41 depicts the whirl frequencies versus rotor speed for 750
Hz/s ramp rate. In this case, the internal relations between the whirl frequencies ω1 and
ω2 are different during rotor acceleration and deceleration. In other words, at high speed
ramp rates, there is hysteresis in the internal relations between the two whirl frequencies.
The reason is that at high speed ramp rates there is a larger difference between Ωb during
rotor acceleration and deceleration. Therefore, the corresponding whirl frequencies (ω1
and ω2) at Ωb (and the internal relations between them) are different for the speed ramp
up and speed ramp down cases (see Fig. 41 for the appropriate relationship).
In general, increasing the rotor spin acceleration delays the bifurcation speed Ωb.
In addition, decreasing the rotor rate of speed change decreases the difference between
Ωb values during rotor acceleration and deceleration. For instance, the difference
between the bifurcation speeds during rotor acceleration and deceleration are as follows:
7 krpm (for 250 Hz/s), 17 krpm (for 500 Hz/s), and 58 krpm (for 750 Hz/s). In other

57
words, increasing the shaft speed ramp rate leads to a stronger hysteresis in Ωb during
ramp up and ramp down cases.
Prior work by San Andrés and the author [44], related to the effect of shaft
acceleration/deceleration on the dynamic response of turbochargers, also shows that a
higher speed ramp rate leads to a stronger hysteresis of subsynchronous whirl motions
(amplitude and frequency). This behavior is common in nonlinear systems, and it is a
characteristic of subcritical bifurcation.
0.00
0.10
0.20
0.30
0.40
0.50
0 50 100 150 200 250Shaft Speed (krpm)
Tota
l Am
plitu
de p
k-pk
(-)
+250Hz/s+500Hz/s+750Hz/sFIXED SPEED
Compressor a
0.00
0.10
0.20
0.30
0.40
0.50
0 50 100 150 200 250Shaft Speed (krpm)
Tota
l Am
plitu
de p
k-pk
(-)
-250Hz/s-500 Hz/s-750Hz/sFIXED SPEED
Compressor endb
Figure 39: TC total shaft motion amplitude (pk-pk) at compressor end during rotor (a) acceleration and (b) deceleration; speed ramp rates= 0Hz/s (fixed speed), 250Hz/s, 500Hz/s, 750Hz/s.

58
0
200
400
600
800
1000
1200
1400
50 75 100 125 150 175 200Shaft Speed (krpm)
Freq
uenc
y (H
z)ω1_upω2_up
JUMP
150 krpmCompressor endY-direction
0.1
(-)
Ωb@ Ωb=150krpm (2.5kHz) ω1=635Hz, ω2=840Hz
4ω1 ~ 3ω2
0200400600800
100012001400
0 50 100 150 200 250Shaft Speed (krpm)
Freq
uenc
y (H
z) ω1_upω2_up
JUMP
165krpm
BASELINE
0.1
(-)
250Hz/s
500Hz/s
UP
C TC T
CT
CT
0
200
400
600
800
1000
1200
1400
50 75 100 125 150 175 200Shaft Speed (krpm)
Freq
uenc
y (H
z)
ω1_downω2_down
JUMP
157krpm
Compressor end
Y-direction
0.1
(-) Ωb
@ Ωb=157krpm(~2.6kHz) ω1=645Hz, ω2=811Hz
4ω1 ~ 3ω2
0200400600800
100012001400
0 50 100 150 200 250Shaft Speed (krpm)
Freq
uenc
y (H
z)
JUMP
182krpm0.1
(-)
BASELINE
-250Hz/s-500Hz/s
DOWN
Figure 40: Predicted subsynchronous whirl frequencies versus rotor speed; (TOP) rotor acceleration = +250Hz/s; (BOTTOM) rotor deceleration = -250Hz/s. Normalized amplitudes in vertical direction shown at compressor end (scale included).

59
0
200
400
600
800
1000
1200
1400
0 50 100 150 200 250Shaft Speed (krpm)
Freq
uenc
y (H
z)ω1_upω2_up
JUMP
187krpm
Compressor end
Y-direction
0.1
(-)
Ωb
@ Ωb=187krpm(~3.1kHz) ω1=713Hz, ω2=850Hz
6ω1 ~ 5ω22ω1 +2ω2~ Ωb
UP
TC TC C TC T
750Hz/s
0
200
400
600
800
1000
1200
1400
0 50 100 150 200 250Shaft Speed (krpm)
Freq
uenc
y (H
z)
ω1_downω2_down
JUMP
129 krpm
Y-direction
Compressor end
0.1
(-) Ωb
@ Ωb=129krpm (2.15kHz) ω1=552Hz, ω2=786Hz
3ω1 ~ 2ω2ω1 +2ω2~ Ωb
DOWN000
-750Hz/s
Figure 41: Predicted subsynchronous whirl frequencies versus rotor speed; (TOP) rotor acceleration = +750Hz/s; (BOTTOM) rotor deceleration = -750Hz/s. Normalized amplitudes in vertical direction shown at compressor end (scale included).

60
The Effect of Imbalance Distribution on Jump Phenomenon In this analysis a four-plane imbalance distribution is applied (at the compressor
nose, compressor back, turbine nose, and turbine back). The imbalance amount remains
constant but the phase is varied (0° or 180°), creating three different imbalance
distribution: opposed couple, static all-in-phase (baseline case), and turbine-back-out-
of-phase. An inset in Figures 43 and 44 shows the imbalance condition in the TC.
Further nonlinear predictions of TC dynamic response are conducted with the three
imbalance distributions.
Figure 42 depicts the shaft total motions at the compressor end for the opposed
coupled imbalance distribution. As the shaft speed increases, the total amplitude of shaft
motion decreases from ~38% to ~10% of the maximum physical limit at the compressor
bearing. Recall from Figure 23 that the total shaft motions for the baseline case (static
imbalance) varies between 40% and 20% of the maximum physical limit at the
compressor end. Therefore, the opposed couple imbalance leads to a decrease of the total
shaft motion at high rotor speeds.
Figure 43 depicts the predicted subsynchronous whirl motions versus shaft speed
for the opposed couple imbalance distribution. The opposed couple distribution delays
the bifurcation speed Ωb to 180 krpm (3 kHz) during rotor acceleration. Recall in the
baseline case (static imbalance distribution), Ωb equals 165 krpm (2.75 kHz) during rotor
acceleration. Note the decreased amplitude of subsynchronous whirl motion at high shaft
speeds (highlighted in Fig. 43). Indeed, the total motions at high shaft speeds reduce for
the opposed couple case due to the decrease in amplitudes of subsynchronous motions.

61
0.00
0.10
0.20
0.30
0.40
0.50
0 50 100 150 200 250
Shaft Speed (krpm)
Tota
l Am
plitu
de p
k-pk
(-)
Rotor accelerates
Rotor deceleratesCompressor end
C TC T
Figure 42: Total TC shaft motion (pk-pk) amplitude at the compressor end during rotor acceleration ( ) and deceleration ( ); imbalance distribution: opposed couple. Shaft speed ramp rate =500 Hz/s.
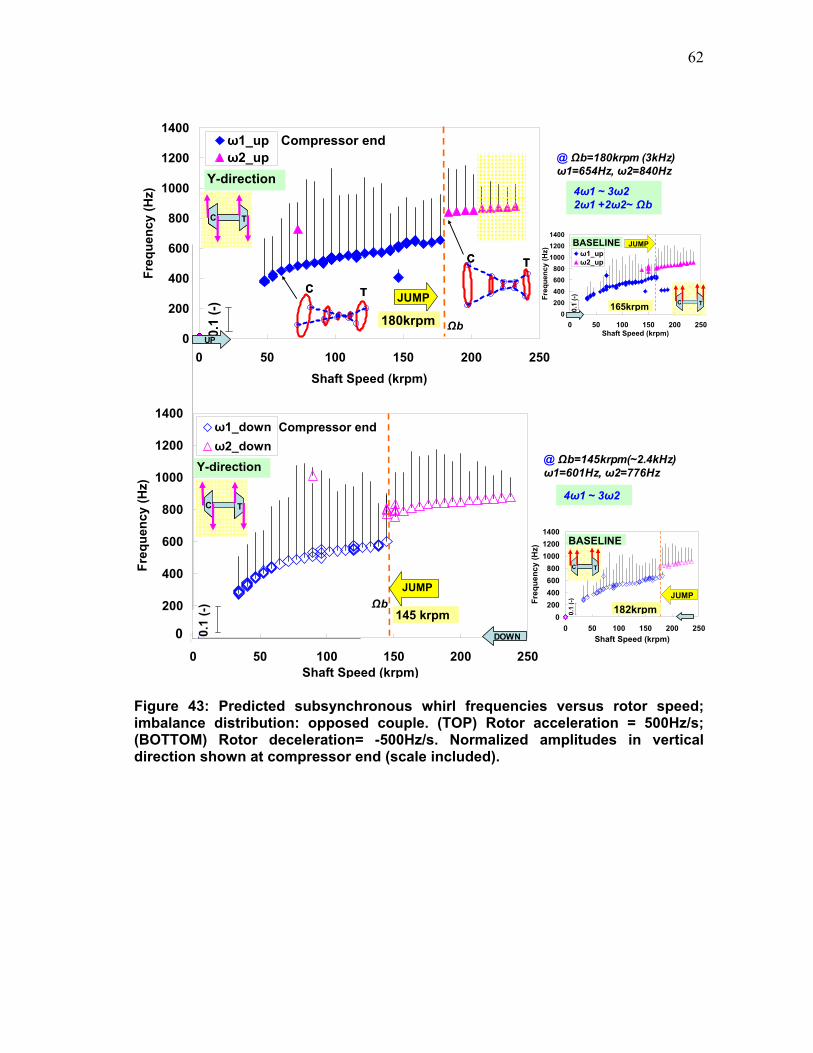
62
0
200
400
600
800
1000
1200
1400
0 50 100 150 200 250Shaft Speed (krpm)
Freq
uenc
y (H
z)ω1_upω2_up
JUMP
180krpm
Compressor end
Y-direction
0.1
(-)
C TC T
@ Ωb=180krpm (3kHz) ω1=654Hz, ω2=840Hz
4ω1 ~ 3ω22ω1 +2ω2~ Ωb
Ωb0
200400600800
100012001400
0 50 100 150 200 250Shaft Speed (krpm)
Freq
uenc
y (H
z) ω1_upω2_up
JUMP
165krpm
BASELINE
0.1
(-)
C TC T
C TC T
UP
C TC T
0
200
400
600
800
1000
1200
1400
0 50 100 150 200 250Shaft Speed (krpm)
Freq
uenc
y (H
z)
ω1_downω2_down
JUMP
145 krpm
Compressor end
Y-direction
0.1
(-)
@ Ωb=145krpm(~2.4kHz) ω1=601Hz, ω2=776Hz
4ω1 ~ 3ω2
Ωb0
200400600800
100012001400
0 50 100 150 200 250Shaft Speed (krpm)
Freq
uenc
y (H
z)
JUMP
182krpm0.1
(-)
BASELINE
DOWN00
C TC T
C TC T
Figure 43: Predicted subsynchronous whirl frequencies versus rotor speed; imbalance distribution: opposed couple. (TOP) Rotor acceleration = 500Hz/s; (BOTTOM) Rotor deceleration= -500Hz/s. Normalized amplitudes in vertical direction shown at compressor end (scale included).

63
Figure 44 depicts the predicted subsynchronous frequencies versus shaft speed
for the turbine-back-out-of-phase (TBOP) imbalance distribution. This imbalance
condition decreases the Ωb for both, shaft speed ramp up and ramp down cases.
However, the second whirl frequency, ω2 disappears shortly after the bifurcation speed.
During rotor deceleration, the second whirl frequency appears at the highest shaft speed;
however, it has a small amplitude of motion. In this case, the internal relations between
the two whirl frequencies, ω1 and ω2, at Ωb are different during ramp up (4ω1 ~3ω2) and
ramp down (3ω1 ~ 2ω2) motions. The combined relations for the speed ramp up (3ω1 +
ω2 ~Ωb) and speed ramp down (ω1 + 2ω2 ~Ωb) cases are also different. However, these
combined relations are different during shaft acceleration and deceleration in most cases
(unless Ωb is almost identical during either a shaft speed ramp up or a ramp down case).
Figure 45 depicts the total amplitude of shaft motion at the compressor end for
the TBOP imbalance. Note at rotor speeds above ~160 krpm the total amplitude of shaft
motion is less than 10% of the physical limit at the compressor end. Due to the reduced
amplitudes of motion, the TBOP imbalance distribution is particularly interesting. For
completeness, the effect of an increased imbalance amount (for the TBOP distribution)
on the frequency jump phenomenon is assessed next.

64
0
200
400
600
800
1000
1200
1400
0 50 100 150 200 250Shaft Speed (krpm)
Freq
uenc
y (H
z)ω1_upω2_up
JUMP
150 krpm
Compressor endY-direction
0.1
(-)
@ Ωb=150krpm (2.5kHz) ω1=591Hz, ω2=791Hz
4ω1 ~ 3ω23ω1 +ω2~ Ωb
Ωb 0200400600800
100012001400
0 50 100 150 200 250Shaft Speed (krpm)
Freq
uenc
y (H
z) ω1_upω2_up
JUMP
165krpm
BASELINE
0.1
(-)
C TC T
C TC T
UPC TC T
C TC T
0
200
400
600
800
1000
1200
1400
0 50 100 150 200 250Shaft Speed (krpm)
Freq
uenc
y (H
z)
ω1_downω2_down
JUMP
120krpm
Compressor endY-direction
0.1
(-)
@ Ωb=120krpm (2kHz) ω1=513Hz, ω2=757Hz
3ω1 ~ 2ω2ω1 +2ω2~ Ωb
Ωb0
200400600800
100012001400
0 50 100 150 200 250Shaft Speed (krpm)
Freq
uenc
y (H
z)
JUMP
182krpm0.1
(-)
BASELINE
C TC TC TC T
DOWN0
Figure 44: Predicted subsynchronous whirl frequencies versus rotor speed; imbalance distribution: turbine back out of phase. (TOP) Rotor acceleration = 500Hz/s; (BOTTOM) Rotor deceleration= -500Hz/s. Normalized amplitudes in vertical direction shown at compressor end (scale included).

65
0.00
0.10
0.20
0.30
0.40
0.50
0 50 100 150 200 250
Shaft Speed (krpm)
Tota
l Am
plitu
de p
k-pk
(-)
Rotor acceleratesRotor decelerates
Compressor end
C TC T
Figure 45: Total TC shaft motion (pk-pk) amplitude at the compressor end during rotor acceleration ( ) and deceleration ( ); imbalance distribution: turbine-back-out-of-phase. Shaft speed ramp rate =500 Hz/s.
Figure 46 depicts the subsynchronous whirl frequency versus shaft speed for a
case with turbine-back-out-of-phase imbalance distribution. However, the imbalance
amounts are twice the ones in the previous distribution. Note with increased imbalance
amounts, the whirl frequencies disappear at ~100 krpm (1.67 kHz) for both speed ramp
up and ramp down cases. There are no bifurcations in this case. This observation agrees
with the test data in Fig. 6, where increased imbalance amounts leads to subsynchronous
whirl motion disappearance, (i.e. stability!). Figure 47 shows the total amplitude of
shaft motion at the compressor end. Expectedly, the total amplitude decreases at shaft
speeds above ~100 krpm (where the subsynchronous whirl motions disappear).
However, the total amplitude of shaft motion increases with rotor speed due to the
increased imbalance amounts (which increases the amplitude of synchronous motions).
See Appendix C for the waterfalls of shaft motion.
Overall, the imbalance distribution greatly affects the subsynchronous whirl
motions (amplitude and frequency); hence, also the bifurcation speeds and the internal
relations between the whirl frequencies. In addition, the imbalance distribution also
affects the degree of hysteresis in the RBS nonlinear response.

66
0
200
400
600
800
1000
1200
1400
0 50 100 150 200 250Shaft Speed (krpm)
Freq
uenc
y (H
z)
ω1_upω2_up
Compressor endY-direction
0.1
(-)
C TC T
Imbalance amount doubled
No Frequency Jump
C TC T
1/2xΩΩ: Shaft speed
UP
0
200
400
600
800
1000
1200
1400
0 50 100 150 200 250Shaft Speed (krpm)
Freq
uenc
y (H
z)
ω1_downω2_down
Compressor endY-direction
0.1
(-)
DOWN00
CT
CT
1/2xΩΩ: Shaft speed
C TC T
Imbalance amount doubled
No Frequency Jump
Figure 46: Predicted subsynchronous whirl frequencies versus rotor speed; imbalance distribution: turbine back out of phase; imbalance amount doubled. (TOP) Rotor acceleration = 500Hz/s; (BOTTOM) Rotor deceleration= -500Hz/s. Normalized amplitudes in vertical direction shown at compressor end (scale included).

67
0.00
0.10
0.20
0.30
0.40
0.50
0 50 100 150 200 250
Shaft Speed (krpm)
Tota
l Am
plitu
de p
k-pk
(-)
Rotor acceleratesRotor decelerates
Compressor end
C TC T
Imbalance amount doubled
Synchronous motion only
Figure 47: Total TC shaft motion (pk-pk) amplitude at the compressor end during rotor acceleration ( ) and deceleration ( ); imbalance distribution: turbine-back-out-of-phase; imbalance amount doubled. Shaft speed ramp rate =500 Hz/s.
68
CHAPTER VII
CONCLUSIONS
A frequency jump between a first and a second subsynchronous rotor whirl
motions increases noise level in automotive TCs [11]. In an effort to improve
turbocharger dynamic performance and to reduce noise generation levels in TC
operation, the focus of this thesis is to assess factors (operating conditions and bearing
performance parameters) affecting the onset and persistence of the frequency jump
phenomenon.
Nonlinear predictions are conducted for a TC supported on a SFRB, operating
with various conditions (oil inlet temperature and pressure), bearing geometry, rotor
acceleration/deceleration rate, as well as various imbalance distribution. In addition, a
linear eigenvalue analysis is conducted to predict the rotor-bearing system (RBS)
damped natural frequencies. TC shaft nonlinear response predictions (at the compressor
end) display, over the whole speed range typically, two subsynchronous whirl
frequencies ω1 and ω2 corresponding to a conical mode and a cylindrical bending mode,
respectively. At all operating conditions, ω1 is present from startup (lowest shaft speed
of 30 krpm) to a shaft speed (Ωbifurcation), where there is a frequency jump from ω1 to ω2.
The second whirl frequency (ω2) may persist (depending on operating conditions) up to
the highest shaft speed (240 krpm, 4 kHz).
At low shaft speeds, the compressor and turbine rings operate at high static
eccentricities (~ 85% of outer film clearance). As the rotor speed increases, the rings
move closer to the bearing center (~ 60% of the outer film clearance). The outer film
supports the hydrostatic side loads applied on the bearings, and the rotor operates at a
centered position (relative to the ring).
Linear eigenvalue analysis predicts two unstable natural frequencies,
characterizing a conical mode (with SFRB in conical mode) and a cylindrical bending
mode (with SFRB in cylindrical mode). The two natural frequencies are closely spaced.
The first whirl frequency ω1 follows the 2nd damped natural frequency (unstable
conical mode), only at low shaft speeds up to ~80 krpm (~1.3 kHz). In addition, the rotor

69
synchronous response is calculated from the linear and nonlinear (at fixed shaft speed
and speed transient) analyses. Predictions show discrepancies between the linear and
nonlinear results. These discrepancies are due to the large rotor whirl motions predicted
using nonlinear analysis, whereas in the linear analysis only small perturbations about a
static equilibrium position are assumed.
Interestingly, predicted rotor subsynchronous whirl motions are similar in
frequency and amplitude for most cases (regardless of operating conditions) at low shaft
speeds (below~ 100 krpm) and at high shaft speeds (above~ 200 krpm). This is with the
exception for cases with turbine-back-out-of-phase imbalance distribution for which the
system becomes stable at high shaft speeds. Operating conditions mainly affect the TC
response over a speed range (~100 krpm-200 krpm) enclosing the bifurcation speed
(Ωbifurcation). Also, in all cases, the first whirl frequency (ω1) (conical mode) at low shaft
speeds (below 50 krpm) is 50% of the rotational frequency. In addition, at the Ωbifurcation,
the TC rotor whirls at a frequency close to 25% of the rotor speed.
In most cases, there is an internal relation between the two whirl frequencies (ω1
and ω2) at the Ωbifurcation. Table 2 lists the corresponding internal and combined relations
for all cases. For each case, the internal relations (between ω1 and ω2) are the same
during rotor acceleration and deceleration, except for the case with turbine-back-out-of-
phase (TBOP) imbalance distribution and the case with the highest shaft speed ramp rate
(750Hz/s). In each case, the combined relations are different during rotor acceleration
and deceleration unless the Ωbifurcation is almost identical during rotor speed ramp up and
ramp down cases (i.e. reduced pressure case).
The total amplitude of rotor motion at the compressor end is generally between
20% and 40% of the maximum allowed shaft motions. However, a TBOP imbalance
distribution reduces the total amplitude of motion at high shaft speeds (above 100 krpm).
The reason is due to the subsynchronous whirl motions disappearing at high shaft
speeds. In general, predictions and test data confirm that rotor imbalance distribution
greatly affects the onset speed of subsynchronous frequency appearance (or
disappearance), the total amplitude of shaft motion, and the bifurcation speed.

70
Predictions show that a 33% increase oil supply pressure delays the onset speed
of second subsynchronous whirl motion (ω2); hence, also delaying the bifurcation speed
(Ωbifurcation). This observation is in agreement with the test data in Ref. [31]. Also,
predictions (cases with three supply temperatures studied) show that increasing the oil
supply temperature leads to a decrease of the onset speed of (ω2) whirl motion and
hence, also decreases Ωbifurcation. Also, test data (provided by a TC manufacturer)
confirms this finding (see Figs. 2 and 3). Increasing the bearing inner film length by 15%
decreases the amplitude of shaft total motions. In addition, increasing the inner film
length leads to rotor operation at even lower eccentricities (similar to operation at very
high shaft speeds). Therefore, predictions show an increase in the first subsynchronous
frequency (ω1) near Ωbifurcation, which leads to a smooth transition (rather than a jump)
from ω1 to ω2.
Note the effect of the abovementioned operating conditions and bearing
parameters on response bifurcations are studied only for a few cases. Further analyses
must be conducted to generalize the findings.
Predictions in most cases display hysteresis in Ωbifurcation when the rotor
accelerates to a top speed and decelerates from this high magnitude. Hysteresis is
stronger in cases with faster acceleration/deceleration rates. Also, increasing rotor
acceleration delays the onset speed of the second whirl motion (ω2), therefore delaying
the Ωbifurcation. The total shaft motion amplitude though, remains unchanged with rotor
speed ramp rate.
Predicted results in this analysis agree well (qualitatively) with the test data in the
literature and provided by a TC manufacturer. Further analysis should be done to assess
the effects of clearances, ring rotation, lubricant type, and bearing outer film length on
the frequency jump phenomenon. Additional imbalance distributions should be studied
to assess the imbalance condition that results in small or no subsynchronous motions. In
addition, validating the predictions against test data assists refinement of the predictive
tool, which can save significant time and cost in TC manufacturing industry.

71
Table 2. The internal and combined relations (at the bifurcation speed (Ωb)) between the two subsynchronous whirl frequencies (ω1 and ω2) and the Ωb.
Case Ωb
(Hz) ω1
(Hz) ω2
(Hz) Internal relation
Combined relation
Baseline (up♠) 2,750 654 815 5ω1~4ω2 3ω1+ω2 ~Ωb Baseline (down♥) 3,030 674 845 5ω1~4ω2 2ω1+2ω2 ~Ωb Reduced Pressure (up) 1,980 493 732 3ω1~2ω2 ω1+2ω2 ~Ωb Reduced Pressure (down) 2,000 508 732 3ω1~2ω2 ω1+2ω2 ~Ωb Reduced Temperature (up) 2,750 684 820 5ω1~4ω2 N/A Reduced Temperature (down) 2,720 659 820 5ω1~4ω2 3ω1+ω2 ~Ωb Increased Temperature (up) 2,500 620 801 4ω1~3ω2 N/A Increased Temperature (down) 3,030 645 840 4ω1~3ω2 2ω1+2ω2 ~Ωb Increased Inner Length (up) †† 2,700 762 786 N/A N/A Increased Inner Length (down) 2,720 762 796 N/A N/A Low Acceleration (+250Hz/s) 2,500 635 840 4ω1~3ω2 N/A Low Deceleration (-250Hz/s) 2,620 645 811 4ω1~3ω2 N/A High Acceleration (+750Hz/s) 3,120 713 850 6ω1~5ω2 2ω1+2ω2 ~Ωb High Deceleration (-750Hz/s) 2,150 552 786 3ω1~2ω2 ω1+2ω2 ~Ωb Opposed Couple Imb Dist. (up) 3,000 654 840 4ω1~3ω2 2ω1+2ω2 ~Ωb Opposed Couple Imb Dist. (down) 2,420 601 776 4ω1~3ω2 N/A TBOP Imb Dist. (up) 2,500 591 791 4ω1~3ω2 3ω1+ω2 ~Ωb TBOP Imb Dist. (down) 2,000 513 757 3ω1~2ω2 ω1+2ω2 ~Ωb
♠ Up means rotor accelerates from 30 krpm to 240 krpm with a +500 Hz/s speed ramp rate. ♥ Down means rotor decelerates from 240 krpm to 30 krpm with a -500 Hz/s speed ramp rate. †† There is no frequency jump in this case (both during rotor acceleration and deceleration), rather, there is a smooth transition between the two whirl frequencies (ω1 and ω2).

72
REFERENCES
[1] San Andrés, L., Rivadeneira, J. C., Chinta, M., Gjika, K., and LaRue, G., 2007,
“Nonlinear Rotordynamics of Automotive Turbochargers: Predictions and Comparisons to Test Data,” ASME J. Eng. Gas Turb. Power, 129, pp.488-493.
[2] Haller, C. L., Killinger, A. G., and Smith, L. A., 1995, “Methods to Reduce
Diesel Engine Exhaust Emissions at Established Installations to Comply with the Clean Air Act,” ASME/ ICE Journal, 4, pp.75-84.
[3] Maruyama, A., 2007, “Predictions of Automotive Turbocharger Nonlinear
Dynamic Forced Response with Engine-Induced Housing Excitations: Comparisons to Test Data,” M.S. thesis, Texas A&M University, College Station, TX.
[4] San Andrés, L., and Kerth, J., 2004, “Thermal Effects on the Performance of
Floating Ring Bearings for Turbochargers,” Proc. of the Inst. of Mech. Eng., Part J, J. Eng. Tribol., 218(5), pp. 437-450.
[5] Holt, C., San Andrés, L., Sahay, S., Tang, P., LaRue, G., and Gjika, K., 2005,
“Test Response and Nonlinear Analysis of a Turbocharger Supported on Floating Ring Bearings,” ASME J. Vib. Acoust., 127, pp. 107-115.
[6] Gjika, K., San Andrés, L., and LaRue, G., 2007, “Nonlinear Dynamic Behavior
of Turbocharger Rotor-Bearing Systems with Hydrodynamic Oil Film and Squeezed Film Damper in Series: Prediction and Experiment,” Proc. of the 21st Biennial Conference on Mechanical Vibration and Noise, Las Vegas, NV, September 4-7, Paper No. DETC 2007-34136.
[7] San Andrés, L., 2008, XLFEMSFRB™ v8.0 Software Suite, Tribology Group,
Turbomachinery Laboratory, Texas A&M University, College Station, TX. [8] XLTRC2™ Rotordynamics Software Suite v.2.22, 2008, Turbomachinery
Laboratory, Texas A&M University, College Station, TX. [9] Gjika, K., 2004, Bearing Systems Behavior - Subsynchronous Vibration and
Relationship with Noise: Applications to PV Turbochargers, Honeywell Turbo Technologies Proprietary, France.
[10] Gjika, K., 2006, Sur le comportement dynamique non linéaire des turbo
compresseurs d’automobile, Partenariat entre le Laboratoire de Mécanique des Contacts et des Structures (LAMCOS, UMR CNRS 5514 de L’INSA de Lyon) et Honeywell Turbo Technologie.

73
[11] Gjika, K., Personal Communication, 5 May, 2009. [12] Yamamoto, T., and Ishida, Y., 2001, Linear and Nonlinear Rotordynamics: A
Modern Treatment with Applications, Wiley, New York. [13] Nayfeh, A. H., and Balachandran, B., 1989, “Modal Interactions in Dynamical
and Structural Systems,” ASME Appl Mech Rev, 42, pp.175-201. [14] Xia, S., 2006, Unbalance Configuration Effect on Subsynchronous Shift,
Honeywell Turbo Technologies Internal Presentation and Proprietary, France. [15] Sahay, S. N., and LaRue, G., 1997, "Turbocharger Rotordynamic Instability and
Control," NASA CP3344, pp. 247-257. [16] Noah, S., and Sundararajan, P., 1995, “Significance of Considering Nonlinear
Effects in Predicting the Dynamic Behavior of Rotating Machinery,” J. Vibration and Control, 1, pp. 431-458.
[17] Shaw, J., and Shaw, S. W., 1990, “The Effect of Unbalance on Oil Whirl,”
Nonlinear Dynamics, 1, pp. 293-311. [18] Wang, J. K., and Khonsari, M. M., 2006, “On the Hysteresis Phenomenon
Associated with Instability of Rotor-Bearing Systems,” ASME, 128, pp. 188-196.
[19] Pinkus, O., 1956, “Experimental Investigation of Resonant Whip,” Trans.
ASME, 78, pp. 975-983. [20] Muszynska, A., 1998, “Transition to Fluid-Induced Stability Boundaries Self-
Excited Vibrations of a Rotor and Instability Threshold ‘Hysteresis’,” Proc. of ISROMAC-7, The 7th International Symposium on Transport Phenomena and Dynamics of Rotating Machinery, February, Honolulu, HI, pp. 775-784.
[21] Choi, S. K., and Noah, S. T., 1994, “Mode Locking and Chaos in a Modified
Jeffcott Rotor with a Bearing Clearance,” J. Appl. Mech., 61 (1), pp. 131-138. [22] Brown, R. D., Drummond, G., and Addison, P. S., 2000, “Chaotic Response of a
Short Journal Bearing,” ASME J. Appl. Mech., 214, pp. 387- 400. [23] Inoue, T., and Ishida, Y., 2003, “Chaotic Vibration and Internal Resonance
Phenomena in Rotor Systems (Part I: Theoretical Analysis),” Proc. of Design Engineering Technical Conferences and Computers and Information in Engineering Conference, Chicago, IL, September 2-6, 5(A), pp. 867-876.

74
[24] Nayfeh, T. A., Asrar, W., and Nayfeh, A. H., 1992, “Three-Mode Interactions in Harmonically Excited Systems with Quadratic Nonlinearities,” Nonlinear Dynamics, 3, pp. 385-410.
[25] Childs, D., 1993, Turbomachinery Rotordynamics: Phenomena, Modeling, &
Analysis, John Wiley & Sons, Inc., New York. [26] Ishida, Y., and Inoue, T., 2004, “Internal Resonance Phenomena of the Jeffcott
Rotor with Nonlinear Spring Characteristics,” J. Vibration and Acoustics, 126, pp. 476-484.
[27] Shaw, J., and Shaw, S.W., 1991, “Non-Linear Resonance of an Unbalanced
Rotating Shaft with Internal Damping,” J. Sound Vib., 147, pp. 435-451. [28] Yamamoto, T., and Yasuda, K., 1977, “On the Internal Resonance in a Nonlinear
Two-Degree-of-Freedom system (Force Vibrations near the Lower Resonance Point when the Natural Frequencies Are in the Ratio 1:2),” Bull. JSME, 20, pp. 168-175.
[29] Asmis, K. G., and Tso, W. K., 1972, “Combination and Internal Resonance in a
Nonlinear Two-Degree-of-Freedom System,” J. Appl. Mech., 39, pp. 832-834. [30] Mook, D. T., HaQuang, N., and Plaut, R. H., 1986, “The Influence of an Internal
Resonance on Nonlinear Structural Vibrations under Combination Resonance Conditions,” J. Sound Vib., 104, pp. 229-241.
[31] Schweizer, B., and Sievert, M., 2009, “Nonlinear Oscillations of Automotive
Turbocharger Turbines,” J. Sound Vib., 321, pp. 955-975. [32] Kerth, J., 2003, “Prediction and Measurement of the Rotordynamic Response of
an Automotive Turbocharger with Floating Ring Bearings,” M.S. thesis, Texas A&M University, College Station, TX.
[33] Rivadeneira, J. C., 2005, “Predictions Versus Measurements of Turbocharger
Nonlinear Dynamic Response,” M.S. thesis, Texas A&M University, College Station, TX.
[34] San Andrés, L., 2007, Project Progress Report #41, Proprietary, Honeywell
Turbo Technologies, May, Texas A&M University, College Station, TX. [35] Taylor, R. I., 1999, “The Inclusion of Lubricant Shear Thinning in the Short
Bearing Approximation,” Proc. Instn Mech Engrs, 213 (1), pp. 35-46.

75
[36] Tsuruta, Y., and Tsuda, K., 1986, “Investigation into an Effect of Floating Bush Bearing, in Suppressing Oil-Whip at Higher Shaft Speed,” J. of JSLE, 7, pp. 135-140.
[37] Nelson, H. D., and Meacham, H., 1981, “Transient Analysis of Rotor Bearing
System Using Component Mode Synthesis,” Proc. of ASME Gas Turbine Conference and Product Show, Houston, TX, March 9-12.
[38] Paz, M., and Leigh, W. E., 2004, Structural Dynamics, Kluwer Academic
Publishers, Norwell, MA. [39] San Andrés, L., 2008, “Modern Lubrication Theory, Notes 4. Static Load
Performance of Plain Journal Bearings,” Texas A&M University, pp.1-14, 2 Feb. 2009, http://phn.tamu.edu/TRIBGroup.
[40] Zeidan, F. Y., and Vance, J. M, 1990, “Cavitation Regimes in Squeeze Film
Dampers and Their Effect on the Pressure Distribution,” Tribol. Trans., 33, pp. 447-453.
[41] Rezvani, M. A., and Hahn, E. J., 1996, “An Experimental Evaluation of Squeeze
Film Dampers without Centralizing Springs,” Tribol. Intl. , 29 (1), pp. 51-59. [42] Tonnesen, J., 1976, “Experimental Parametric Study of a Squeeze Film Bearing,”
J. Lub. Tech., 98, pp.206-213. [43] San Andrés, L., 2008, Project Progress Report #50, Proprietary, Honeywell
Turbo Technologies, February, Texas A&M University, College Station, TX. [44] San Andrés, L., 2009, Project Progress Report #57, Proprietary, Honeywell
Turbo Technologies, January, Texas A&M University, College Station, TX. [45] San Andrés, L., Personal Communication, 9 April, 2009.

76
APPENDIX A
PHYSICAL PROPERTIES OF TURBOCHARGER ROTOR AND SFRB Appendix A is removed, proprietary material to Honeywell Turbo Technologies.

77
APPENDIX B
FILTERED MODE SHAPES
In order to determine the rotor whirling mode corresponding to a certain
subsynchronous frequency, the nonlinear predictions of the shaft motion are obtained at
5 TC rotor locations (1: compressor end, 2: compressor backface, 3: compressor bearing,
4: turbine bearing, 5: turbine end) shown in Figure B1. The Discrete Fourier
Transforms (DFT) of the predicted results are obtained over a range of shaft speeds. The
DFT consist of a real part (Re) and an imaginary part (Im). The frequency of interest is
selected from the DFTs and the corresponding orbits are generated, using equation B.1
[45], for the specified frequency, at each of the 5 rotor locations.
Re( )cos( ) Im( )sin( )Re( )cos( ) Im( )sin( )
X X
Y Y
X DFT DFTY DFT DFT
θ θθ θ
= −= −
(B.1)
where DFTX and DFTY are the Discrete Fourier Transforms of the time data rotor
motions along the horizontal and vertical directions, respectively. Also, θ is a parameter
that varies between 0 and 2π.

78
Ampl
itude
(-)
Frequency (Hz)
0 1000 2000 3000 40000
0.05
0.1
0 1000 2000 3000 40000
0.05
0.1
0 1000 2000 3000 40000
0.05
0.1
0 1000 2000 3000 40000
0.05
0.1
0 1000 2000 3000 40000
0.05
0.1
1
2
3
4
5
1 2 3 4 5
Comp end Turb end
Turb endComp end Comp back
Comp bearing
Turbbearing
Figure B.1: TC rotor model and the 5 axial stations where responses are obtained. DFT amplitude of shaft motion at the corresponding 5 stations; a filtered mode shape.

79
APPENDIX C
PREDICTED WATERFALLS OF TC ROTOR MOTION FOR VARIOUS
CASES Figures C.1-C.6 depict the predicted waterfalls of rotor motion (along the vertical
direction) at the compressor end. The captions list the operating conditions. Motions are
normalized with respect to the maximum physical limit at compressor end.
0 1000 2000 3000 4000
Frequency (Hz)
0 1000 2000 3000 4000
Frequency (Hz)Rotor Speed (krpm)
30 105
240 105
30
Rotor Speed (krpm)
30 105
240 105
30
Am
plitu
de (-
)0.
1
0.2
0
.3
ω1
ω2
ω1
1XJump at 120krpm (ramp down)
Jump at 119 krpm (ramp up)
119 krpm
120 krpm
ω1 ω2 Frequency (kHz)42
1X
1X
C TC T
Static imbalance
Figure C.1: Waterfalls of predicted TC shaft motion at the compressor end, vertical direction; static imbalance distribution, speed ramp rate = 500Hz/s. Oil supply pressure reduced by 33%.

80
Am
plitu
de (-
)0.
1
0.2
0
.3
0 1000 2000 3000 4000
Frequency (Hz)
0 1000 2000 3000 4000
Frequency (Hz)Rotor Speed (krpm)
30 105
240 105
30
Rotor Speed (krpm)
30 105
240 105
30
ω1
ω2
ω1
1XJump at 163krpm (ramp down)
Jump at 165 krpm (ramp up)
ω1 ω2 Frequency (kHz)42
1X
1X
165 krpm
163 krpm
C TC T
Static imbalance
Tlow
Am
plitu
de (-
)0.
1
0.2
0
.3
Rotor Speed (krpm)
30 105
240 105
30
Rotor Speed (krpm)
30 105
240 105
30
0 1000 2000 3000 4000
Frequency (Hz)
0 1000 2000 3000 4000
Frequency (Hz)
ω1
ω2
ω1
1XJump at 108 krpm (ramp down)
Jump at 150 krpm (ramp up)
ω2ω2
ω2 Frequency (kHz)42
1X
1X
ω1
150 krpm
108 krpm
162 krpm193 krpm
132 krpm163 krpm182 krpm
ThighC TC T
Static imbalance
Figure C.2: Waterfalls of predicted TC shaft motion at the compressor end, vertical direction; oil supply temperature: (TOP) reduced (Tlow), (BOTTOM) increased (Thigh), static imbalance distribution, speed ramp rate = 500Hz/s.

81
A
mpl
itude
(-)
0.1
0.
2
0.3
Rotor Speed (krpm)
30 105
240 105
30
Rotor Speed (krpm)
30 105
240 105
30 0 1000 2000 3000 4000
Frequency (Hz)
0 1000 2000 3000 4000
Frequency (Hz)
ω1
ω2
ω1
1X
No Jump
ω2 Frequency (kHz)42
1X
1X
ω1
C TC T
Static imbalance
Figure C.3: Waterfalls of predicted TC shaft motion at the compressor end, vertical direction; static imbalance distribution, speed ramp rate = 500Hz/s. Bearing inner film length increased by 15%.

82
Rotor Speed (krpm)
90 140
190 140 9
0
Rotor Speed (krpm)
90 140
190 140 9
0 0 800 1600 2400 3200
Frequency (Hz)
0 800 1600 2400 3200
Frequency (Hz)
Am
plitu
de (-
)0.
1
0.2
0
.3 ω1
ω2
ω1
1X
Jump at 157krpm (ramp down)
Jump at 150krpm (ramp up)
ω2 Frequency (kHz)42
1X
1X
ω1
150 krpm
157 krpm
C TC T
Static imbalance
Am
plitu
de (-
)0.
1
0.2
0
.3
Rotor Speed (krpm)
30 105
240 105
30
Rotor Speed (krpm)
30 105
240 105
30 0 1000 2000 3000 4000
Frequency (Hz)
0 1000 2000 3000 4000
Frequency (Hz)
ω1
ω2
ω1
1XJump at 129krpm (ramp down)
Jump at 187 krpm (ramp up)
ω2 Frequency (kHz)42
1X
1X
ω1
187 krpm
129 krpm
C TC T
Static imbalance
Figure C.4: Waterfalls of predicted TC shaft motion at the compressor end, vertical direction; static imbalance distribution, speed ramp rate: (TOP) 250Hz/s, (BOTTOM) 750Hz/s.

83
A
mpl
itude
(-)
0.1
0.
2
0.3
Rotor Speed (krpm)
30 105
240 105
30
Rotor Speed (krpm)
30 105
240 105
30 0 1000 2000 3000 4000
Frequency (Hz)
0 1000 2000 3000 4000
Frequency (Hz)
ω1
ω2
ω1
1XJump at 145krpm (ramp down)
Jump at 180 krpm (ramp up)
ω2 Frequency (kHz)42
1X
1X
ω1
180 krpm
145 krpm
C TC T
Figure C.5: Waterfalls of predicted TC shaft motion at the compressor end, vertical direction; imbalance distribution: opposed couple, speed ramp rate= 500Hz/s.
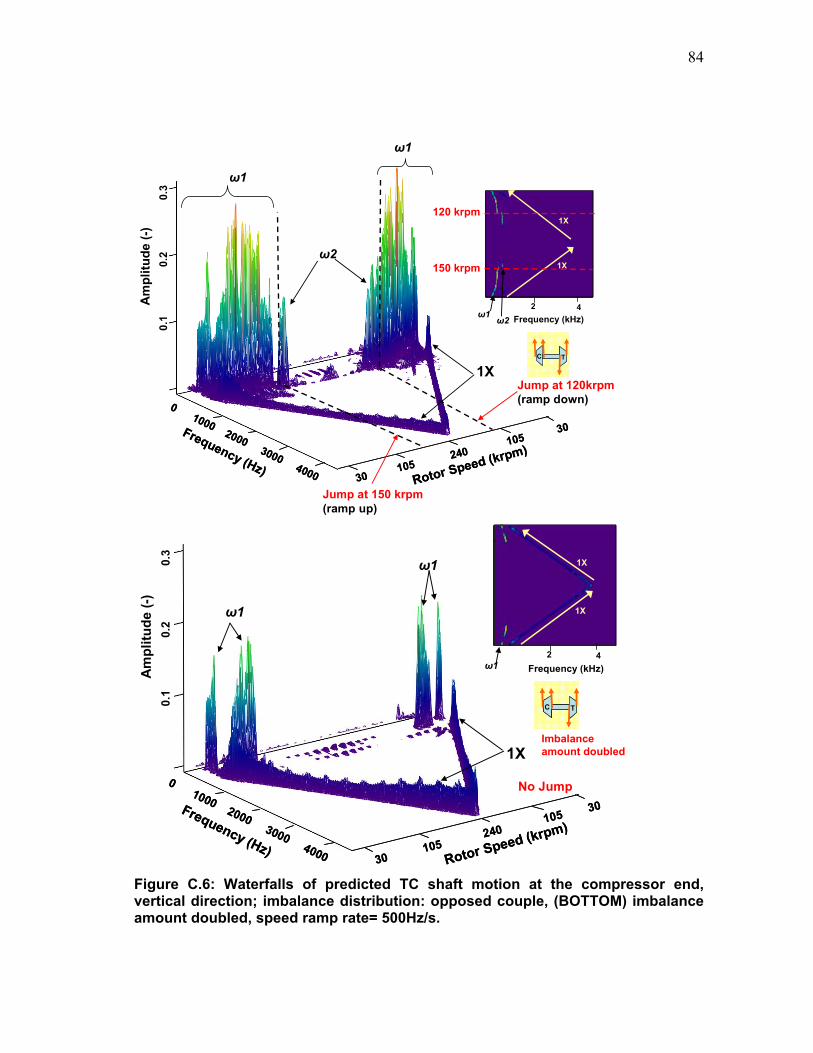
84
A
mpl
itude
(-)
0.1
0.
2
0.3
Rotor Speed (krpm)
30 105
240 105
30
Rotor Speed (krpm)
30 105
240 105
30 0 1000 2000 3000 4000
Frequency (Hz)
0 1000 2000 3000 4000
Frequency (Hz)
ω1
ω2
ω1
1XJump at 120krpm (ramp down)
Jump at 150 krpm (ramp up)
ω2 Frequency (kHz)42
1X
1X
ω1
150 krpm
120 krpm
C TC T
Am
plitu
de (-
)0.
1
0.2
0
.3
Rotor Speed (krpm)
30 105
240 105 30
Rotor Speed (krpm)
30 105
240 105 30
0 1000 2000 3000 4000
Frequency (Hz)
0 1000 2000 3000 4000
Frequency (Hz)
ω1
ω1
1X
No Jump
Frequency (kHz)42
1X
1X
ω1
C TC T
Imbalance amount doubled
Figure C.6: Waterfalls of predicted TC shaft motion at the compressor end, vertical direction; imbalance distribution: opposed couple, (BOTTOM) imbalance amount doubled, speed ramp rate= 500Hz/s.

85
APPENDIX D
ROTOR BEARING SYSTEM EQUATIONS OF MOTION Nomenclature
[M] Global translational mass matrix
[MR] Global rotational mass matrix
[C] Global damping matrix
[G] Global gyroscopic matrix
[K] Global Stiffness matrix
F Vector of (external and bearing reaction) forces and moments
Fbearing Bearing reaction forces (expressed as impedance formulas)
M External moment
m Imbalance mass
e Mass eccentricity (distance between center of mass and axis of rotation)
φ Rotor angular displacement (about axis of rotation)
φi
Rotor angular speed
φi i
Rotor angular acceleration
W Static load (i.e. rotor-bearing weight, hydrostatic side loads)
X Rotor displacement in horizontal direction
Xi
Rotor velocity in horizontal direction
Xii
Rotor acceleration in horizontal direction
Y Rotor displacement in vertical direction
Yi
Rotor velocity in vertical direction
Yii
Rotor acceleration in vertical direction
θ Rotor angular displacement
Subscripts
X Along the horizontal direction
Y Along the vertical direction
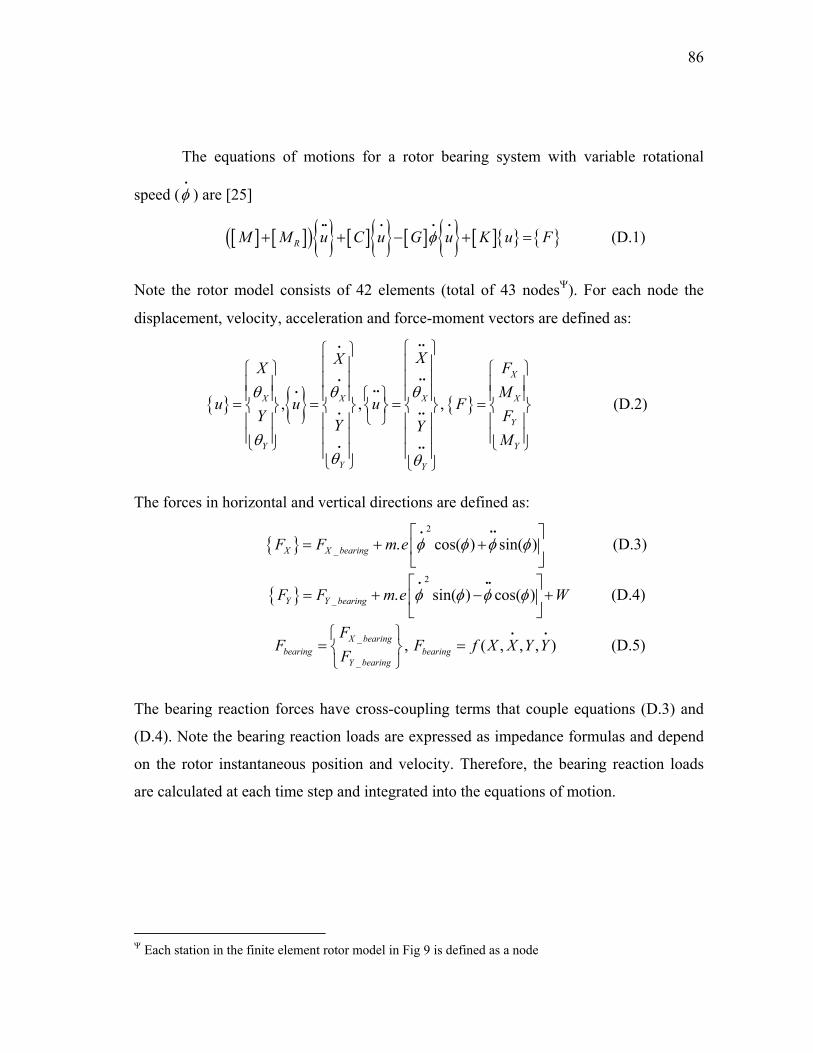
86
The equations of motions for a rotor bearing system with variable rotational
speed (φi
) are [25]
[ ] [ ]( ) [ ] [ ] [ ] RM M u C u G u K u Fφ+ + − + =ii i i i
(D.1)
Note the rotor model consists of 42 elements (total of 43 nodesΨ). For each node the
displacement, velocity, acceleration and force-moment vectors are defined as:
, , ,
X
X X X X
Y
Y Y
Y Y
XXX FM
u u u FY FY Y
M
θ θ θ
θθ θ
⎧ ⎫⎧ ⎫⎪ ⎪⎪ ⎪⎧ ⎫ ⎧ ⎫⎪ ⎪⎪ ⎪⎪ ⎪ ⎪ ⎪⎪ ⎪⎪ ⎪ ⎪ ⎪ ⎪ ⎪⎧ ⎫= = = =⎨ ⎬ ⎨ ⎬ ⎨ ⎬ ⎨ ⎬ ⎨ ⎬
⎩ ⎭⎪ ⎪ ⎪ ⎪ ⎪ ⎪ ⎪ ⎪⎪ ⎪ ⎪ ⎪ ⎪ ⎪ ⎪ ⎪⎩ ⎭ ⎩ ⎭⎪ ⎪ ⎪ ⎪
⎩ ⎭ ⎩ ⎭
iii
iiiiii
i ii
i ii
(D.2)
The forces in horizontal and vertical directions are defined as:
2
_ . cos( ) sin( )X X bearingF F m e φ φ φ φ⎡ ⎤
= + +⎢ ⎥⎣ ⎦
iii (D.3)
2
_ . sin( ) cos( )Y Y bearingF F m e Wφ φ φ φ⎡ ⎤
= + − +⎢ ⎥⎣ ⎦
i ii (D.4)
_
_, ( , , , )X bearing
bearing bearingY bearing
FF F f X X Y Y
F⎧ ⎫
= =⎨ ⎬⎩ ⎭
i i (D.5)
The bearing reaction forces have cross-coupling terms that couple equations (D.3) and
(D.4). Note the bearing reaction loads are expressed as impedance formulas and depend
on the rotor instantaneous position and velocity. Therefore, the bearing reaction loads
are calculated at each time step and integrated into the equations of motion.
Ψ Each station in the finite element rotor model in Fig 9 is defined as a node

87
VITA Name: Arian Vistamehr
Address: 10735 Mist Haven Terrace, Rockville, MD 20852 Email Address: [email protected] Education: A.S., Mechanical Engineering, Montgomery College, Rockville, MD,
2004 B.S., Mechanical Engineering, Texas A&M University, 2007 M.S., Mechanical Engineering, Texas A&M University, 2009