Analysis of an I-Beam
14
Engineering Simulation Analysis of an I-Beam MEng Emma Rose Latham (s5127929) 12-13-2019
Transcript of Analysis of an I-Beam

Engineering Simulation
Analysis of an I-Beam MEng
Emma Rose Latham (s5127929) 12-13-2019

Engineering Simulation: Analysis of an I-Beam by Emma Rose Latham s5127929
1
Abstract
Leading from the Engineering Simulation module, this report contains a comparison between two near-
identical scenarios involving an I-Beam which is fixed at one end and has a force applied at the opposite.
Using the Computer Aided Design software SolidWorks, and its Finite Element Analysis capabilities, scenarios
were simulated to calculate certain parameters about the experiment. To validate these, analytical
techniques are also employed, and the results are discussed in the following report
Table of Contents
Contents Abstract ............................................................................................................................................................... 1
Table of Contents ................................................................................................................................................ 1
Introduction ......................................................................................................................................................... 2
Methodology ....................................................................................................................................................... 2
Results and Discussion......................................................................................................................................... 4
von Mises Stress (downwards) ........................................................................................................................ 4
Displacement (downwards) ............................................................................................................................. 5
Equivalent Strain (downwards) ....................................................................................................................... 6
Von Mises Stress (upwards) ............................................................................................................................ 7
Displacement (upwards).................................................................................................................................. 8
Equivalent Strain (upwards) ............................................................................................................................ 8
Plastic Moment (applicable to both) ............................................................................................................... 9
Stress Concentration (both upwards and downwards) ................................................................................. 12
Conclusions .................................................................................................................................................... 13
References ......................................................................................................................................................... 13

Engineering Simulation: Analysis of an I-Beam by Emma Rose Latham s5127929
2
Introduction
An I-Beam consists of two horizontal planes (flanges) connected by the one vertical (the web) which
together create an I (H) cross-section- giving the beam its name. The I-Beam is the choice shape for
structural builds due to their high functionality; they are excellent for unidirectional bending
parallel to the web. This is because the horizontal flanges resist the bending moment, while the
web resists the shear stress. Available in a variety of configurations, the versatility and
dependability of I-Beams make them a coveted recourse for engineers. (Brakefield, n.d.)
Finite Element Analysis is a
numerical method for solving
problems of engineering physics;
it become useful for solving
complicated problems involving
geometrics, loadings and material
properties and can be used in
combination with analytical
solutions. (Saeed, 2019)
The task which will be analysed in this assignment involves an I-Beam of length 121cm and
dimensions shown in figure 1 with one fixed end whilst the other is loaded both in the downwards
and upwards direction with 450N. These are known as the boundary conditions in the simulation
and allow us to use this data to calculate the unknowns about the system. The FEM software used
is SolidWorks and within the program the material was set to carbon steel assuming tangential
modulus of 3.1e7 psi. This is a common material choice for an I-Beam in structural engineering (it
can often be referred to as structural steel) and means that the simulation is very applicable to
industry.
Methodology
To complete any finite element analysis (FEM) with computer- aided design (CAD) a finite element
mesh needs to be created of the part. It divides the CAD model into domains called elements over
which the equations are solved. These equations approximate the result for the simulations and
Figure 1 Hand- drawn diagram of I-Beam set-up

Engineering Simulation: Analysis of an I-Beam by Emma Rose Latham s5127929
3
since they are governed via a set of polynomial equations, as these elements are made smaller, the
CAD solution should approach the true solution. (Comsol inc., 2017)
Before running the
simulation, I made some
alterations to the
automatically created mesh
of the beam. I made sure to
increase the concentration of
the mesh in the highest area
of the stress in order to make
the end figure more accurate.
The mesh used for the simulation
models is unstructured and is a
more general mesh (which can be
used to approximate more complex
shapes.) The four areas which I
chose to edit were the inner fillets
of the I- Beam where there is a
stress concentration due to the convergence of stress flow. This meant that overall the mesh was
described overall as ‘fine’ by SolidWorks.
If I had a better understanding of SolidWorks and greater time allowance for the report, I could
have manually adjusted the mesh to maximise its efficiency. By leaving elements which are known
to not be of interest to the simulation to be larger means that computational time is not wasted but
the accuracy of the results would increase.
Figure 2: Selection of inner fillets in Solidworks to edit mesh
Figure 3 Close up image showing mesh within flanges of beam.

Engineering Simulation: Analysis of an I-Beam by Emma Rose Latham s5127929
4
An option could be to increase the concentration of the mesh to the finest option within
SolidWorks to maximise the accuracy, but this is inefficient for the computer programme and also
in a real industry example it cretes unnecessary calculations.
Results and Discussion Once the changes to the mesh had been made, CAD quickly and accurately approximates the
simulation and will demonstrate this visually. Often using a colour scale where the largest values
are red to the minimum values as blues, they offer a more user- friendly demonstration of the data
that is gathered.
von Mises Stress (downwards)
The first FEM simulation result is the von Mises Stress which is a metric measurement to determine
whether the structure has started to yield at the given boundary conditions. The stresses are
written into a scalar quantity which can then be compared with experimentally observed yield
points (the yield stress). (Harish, 2019)
Figure 4 Overview of Beam mesh - shows difference in concentration of elements.
Figure 5 SolidWorks Screen Capture of Stress simulation
Engineering Simulation: Analysis of an I-Beam by Emma Rose Latham s5127929
5
It can be seen from the key to the right of the
simulated image that the minimum value
occurred in node location 40696 with a value
of 2.171x10^3 N/m^2. The maximum
occurred at node location 23943 1.247x10^7
N/m^2. The greatest von Mises stress will
occur at the point which greatest force unit
area which is the loaded area, in the join
between the top flange and the web. This is
because the force has been set to be spread between the two vertices of the edge, creating a bend
in the flange.
Otherwise, if the load was concentrated to the centre of the vertices, the greatest area of von
Mises Stress would be the area which is currently second to it. The section of the beam which has
second greatest von Mises Stress is where there is the greatest elastic energy of distortion; which
occurs at the flanges closest to the fixed end of the beam. Here, the full force on the beam is felt
through a relatively small surface area of the cross- section, creating high stress concentration.
The minimum von Mises Stress occurs on the bottom flange of the beam at the loaded end because
very little force is exerted on this area.
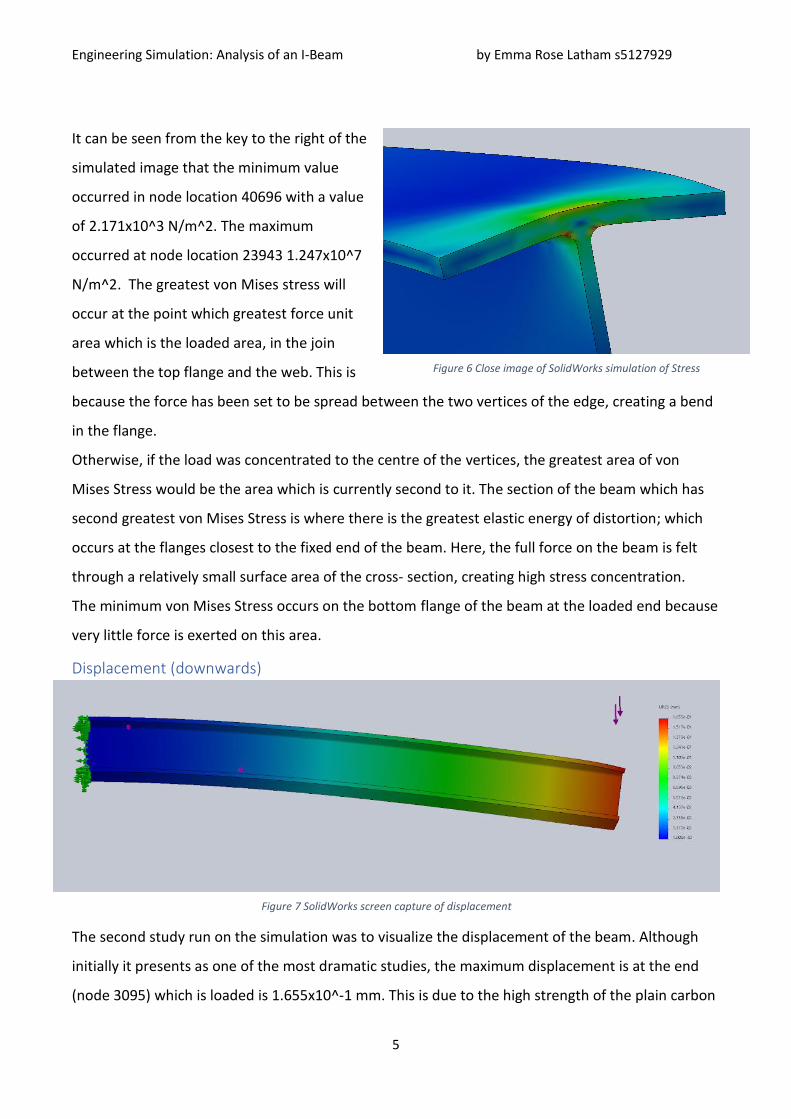
Displacement (downwards)
The second study run on the simulation was to visualize the displacement of the beam. Although
initially it presents as one of the most dramatic studies, the maximum displacement is at the end
(node 3095) which is loaded is 1.655x10^-1 mm. This is due to the high strength of the plain carbon
Figure 6 Close image of SolidWorks simulation of Stress
Figure 7 SolidWorks screen capture of displacement

Engineering Simulation: Analysis of an I-Beam by Emma Rose Latham s5127929
6
steel material, which has undergone very minimal deflection under the 450N weight. The minimum
displacement of the beam occurs nearest to fixed end, which is assumed as zero since the
displacement is so small. This simulation is straight forward in explanation.
Equivalent Strain (downwards)
The third data set demonstrated in Solidworks is the Equivalent Strain of the beam. Strain is defined
as the extension of the object over the unloaded length of the object; equivalent strain involves all
the points of an element in an FEM model placed in a matrix to create a three-dimensional
representation. Strain is a useful representation of the data since it shows the displacement within
the elements of the beam (rather than the beam from an outside prospective.) (PP Benham, 1996)
The maximum strain occurred at element 160 with a value of 3.487x10^-5 which is within the top
flange at the loaded end of the beam. Here, the flex in the flange adds to the strain within the
curved of the underside. The elements will be compressed in the vertical direction whilst elongated
in the horizontal- leaving the shape under a large
amount of strain.
The minimum strain occurs at element 8561 with a
value of 1.497 x10^-8 which is on the bottom edge
of the bottom flange at the end which is loaded. This
is because there is very little deformation in the
elements in this area due to other elements being
deformed first since they undergo a greater amount
of stress.
Figure 8 SolidWorks screen capture of Strain simulation
Figure 9 Close image of SolidWorks Strain simulation

Engineering Simulation: Analysis of an I-Beam by Emma Rose Latham s5127929
7
Von Mises Stress (upwards)
Figure 10 von Mises SolidWorks screen capture
The maximum value for von
Mises Stress 1.215x 10^7
N/m^2 occurred at the
bottom flange at the
location where the force is
applied. The minimum
value is 2.201x10^3 along
the top flange of the beam.
The stress is the value
which varies the least in the
simulations because it takes
into account the area it
occurs over.
Figure 11 Close image of SolidWorks simulated Stress

Engineering Simulation: Analysis of an I-Beam by Emma Rose Latham s5127929
8
Displacement (upwards)
Figure 12 SolidWorks Simulation of Displacement
The displacement of the upwards force was identical to the downwards force. This is expected, but
also since there is only a small displacement across the beam and comparatively large
measurement increments the measurements are less precise.
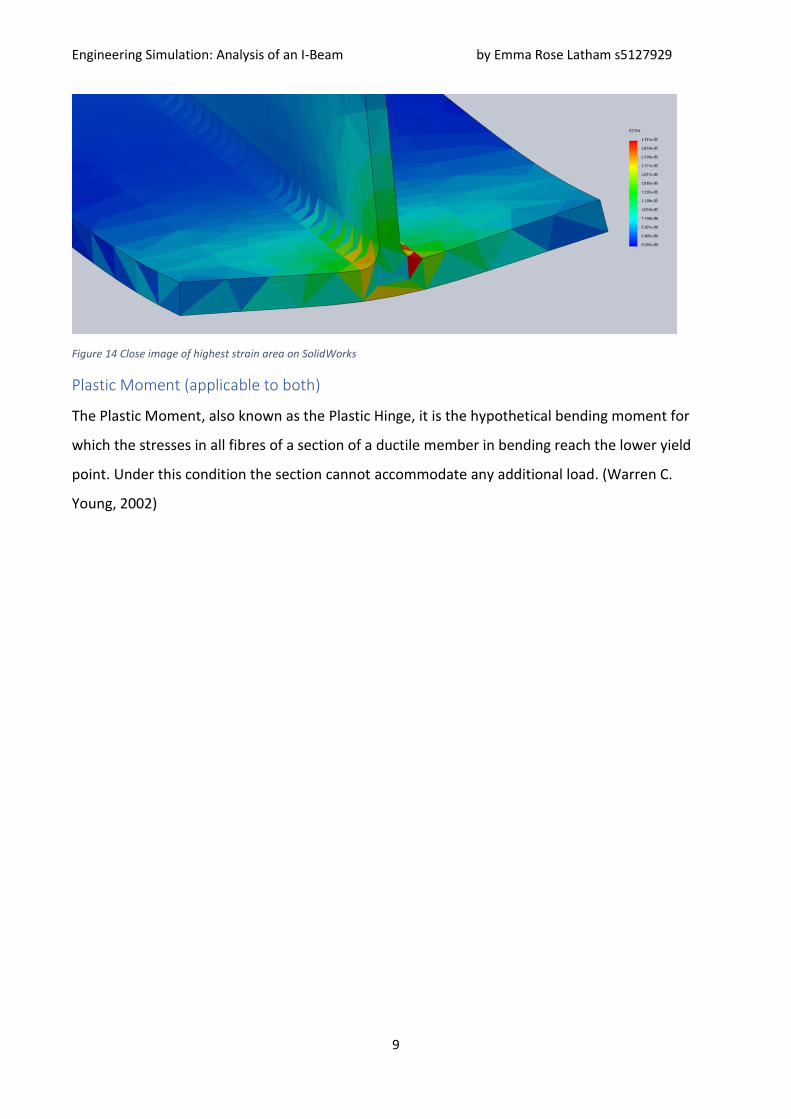
Equivalent Strain (upwards)
Figure 13 SolidWorks simulation of equivalent strain
The strain maximum value is 3.115x 10^-5 and the minimum value is 9.993x10^-9; which again, are
very minute differences in strain, overall and comparatively.
Engineering Simulation: Analysis of an I-Beam by Emma Rose Latham s5127929
9
Figure 14 Close image of highest strain area on SolidWorks
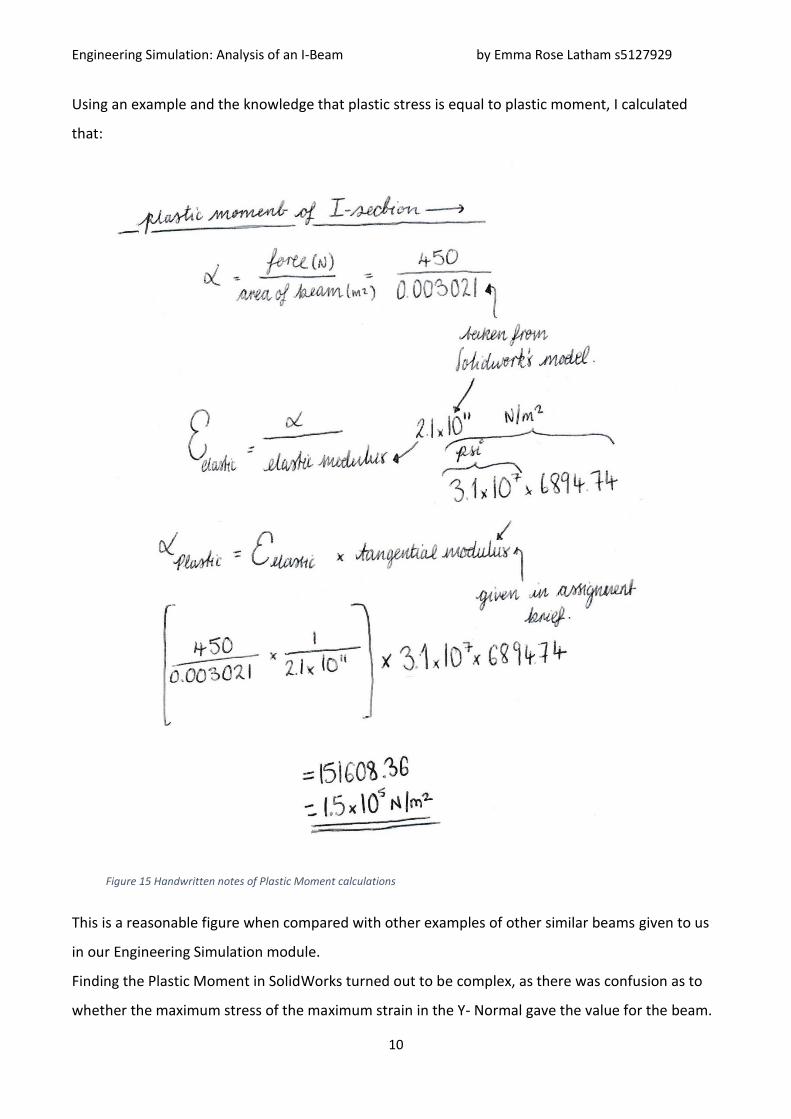
Plastic Moment (applicable to both)
The Plastic Moment, also known as the Plastic Hinge, it is the hypothetical bending moment for
which the stresses in all fibres of a section of a ductile member in bending reach the lower yield
point. Under this condition the section cannot accommodate any additional load. (Warren C.
Young, 2002)
Engineering Simulation: Analysis of an I-Beam by Emma Rose Latham s5127929
10
Using an example and the knowledge that plastic stress is equal to plastic moment, I calculated
that:
This is a reasonable figure when compared with other examples of other similar beams given to us
in our Engineering Simulation module.
Finding the Plastic Moment in SolidWorks turned out to be complex, as there was confusion as to
whether the maximum stress of the maximum strain in the Y- Normal gave the value for the beam.
Figure 15 Handwritten notes of Plastic Moment calculations

Engineering Simulation: Analysis of an I-Beam by Emma Rose Latham s5127929
11
Once consulting with the sources available it was evident that the Strain gave the plastic moment
figure.
Figure 16 Plastic Strain in the Y-Normal on Solidworks
Figure 17 Plastic Strain in Y Normal on Upwards direction
The Plastic moments for the downwards and upwards directions given via a simulation method are
6.42x10^-6 N/m^2 and 6.408x10^-6 N/m^2. As expected, they are almost identical which is what
we had assumed from the analytical method. Gravity is not considered in SolidWorks so there is no
change in the force acting upon the beams between the two scenarios.
The large discrepancy between the analytical and simulated method can be explained through the
inaccuracies in the mesh calculations which due to SolidWorks algorithm and automatically created
mesh will create differences when the direction of the force changes.
Engineering Simulation: Analysis of an I-Beam by Emma Rose Latham s5127929
12
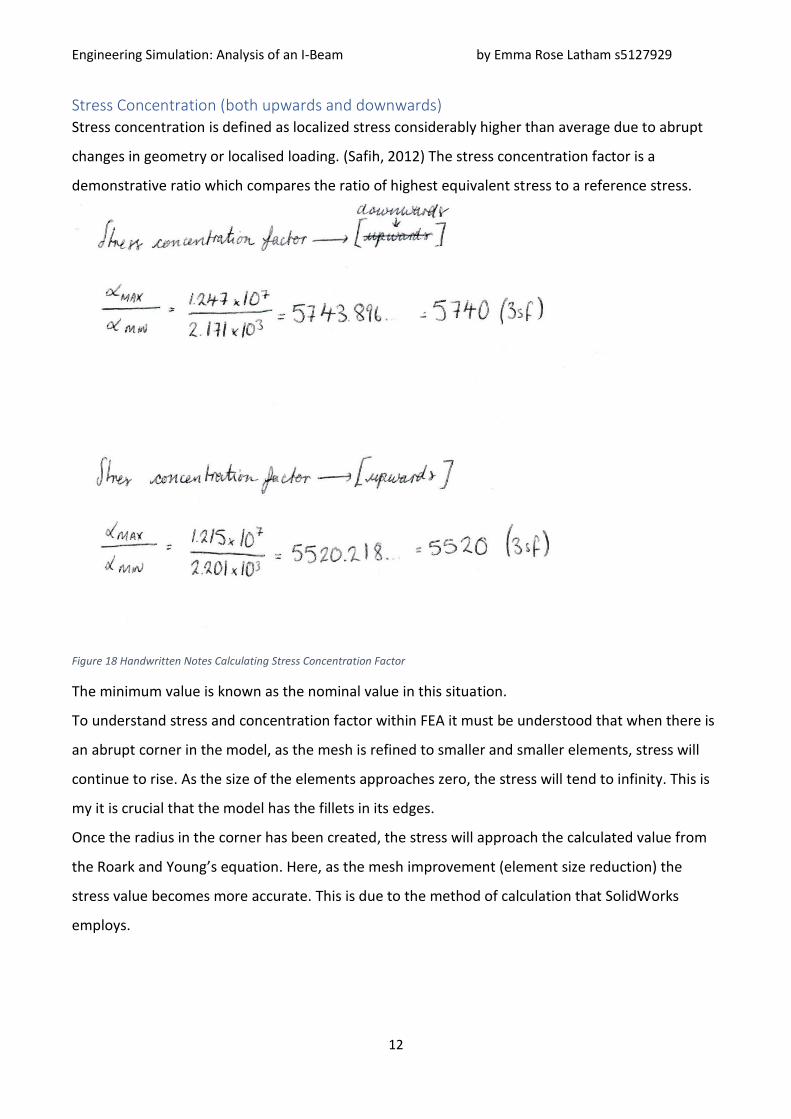
Stress Concentration (both upwards and downwards) Stress concentration is defined as localized stress considerably higher than average due to abrupt
changes in geometry or localised loading. (Safih, 2012) The stress concentration factor is a
demonstrative ratio which compares the ratio of highest equivalent stress to a reference stress.
Figure 18 Handwritten Notes Calculating Stress Concentration Factor
The minimum value is known as the nominal value in this situation.
To understand stress and concentration factor within FEA it must be understood that when there is
an abrupt corner in the model, as the mesh is refined to smaller and smaller elements, stress will
continue to rise. As the size of the elements approaches zero, the stress will tend to infinity. This is
my it is crucial that the model has the fillets in its edges.
Once the radius in the corner has been created, the stress will approach the calculated value from
the Roark and Young’s equation. Here, as the mesh improvement (element size reduction) the
stress value becomes more accurate. This is due to the method of calculation that SolidWorks
employs.

Engineering Simulation: Analysis of an I-Beam by Emma Rose Latham s5127929
13
Conclusions
Simulated Results:
Name Downwards Direction Upwards Direction
Von Mises Stress MIN (N/m^2) 2.171e+03 2.201e+03
Von Mises Stress MAX (N/m^2) 1.247e+07 1.215e+07
Resultant Displacement MIN (mm)
0.000e +00 0.000e+00
Resultant Displacement MAX (mm)
1.655e-01 1.655e-01
Equivalent Strain MIN 1.497e-08 9.999e-09
Equivalent Strain MAX 3.487e-05 3.115e-05
Plastic Moment 1.516e+05 1.516e+05
Stress Concentration Factor 5.744e+03 5.520e+03 Figure 19 Table of Simulated Data
As can be seen from the table above, there is very little difference between the values for the upwards and
downwards simulations. This can be expected since there is no variance in the boundary conditions between
the two different scenarios. Any small difference can be put down to calculation inaccuracies created in
SolidWorks and its use of significant figures and the mesh set- up. The variance between the values can be
explained due to the mesh because it is likely that the mesh in both studies were not completely accurate.
References
Brakefield, K., n.d. Why are I-Beams Used in Structural Steel Construction?. [Online]
Available at: https://blog.swantonweld.com/i-beams-in-structural-steel-construction
[Accessed 07 12 19].
Comsol inc., 2017. Finite Mesh Refinement. [Online]
Available at: https://uk.comsol.com/multiphysics/mesh-refinement
[Accessed 07 12 19].
Harish, A., 2019. What is the Meaning of the Von Mises Stess and the Yield Criterion?. [Online]
Available at: https://www.simscale.com/blog/2017/04/von-mises-stress/
[Accessed 09 12 2019].
PP Benham, R. C. C. A., 1996. Mechanics of Engineering Materials. Second ed. Harlow: Pearson Education
Limited.
Saeed, D. A., 2019. Engineering Simulation Lecture Series. [Online]
Available at: https://brightspace.bournemouth.ac.uk/d2l/le/content/68602/viewContent/434136/View
[Accessed 23 10 19].
Safih, 2012. Stress Concentration Fundamentals. [Online]
Available at:
https://www.engineersedge.com/material_science/stress_concentration_fundamentals_9902.htm
[Accessed 10 12 2019].
Warren C. Young, R. G. B., 2002. Roark's Formulas for Stress and Strain. Seventh ed. New York: McGraw- Hill.