
ANALYSIS OF ACCIDENT RATES BY AGE, AND TIME OF DAY …
90
ANALYSIS OF ACCIDENT RATES BY AGE, GENDER, AND TIME OF DAY BASED ON THE 1990 NATIONWIDE PERSONAL TRANSPORTATION SURVEY Dawn L. Massie and Kenneth L. Campbell February 1993 FINAL REPORT The L'n~versity of Michigan Transportation Research Institute Ann Arbor, Michigan 48109-2150
Transcript of ANALYSIS OF ACCIDENT RATES BY AGE, AND TIME OF DAY …

ANALYSIS OF ACCIDENT RATES BY AGE, GENDER, AND TIME OF DAY BASED ON THE 1990
NATIONWIDE PERSONAL TRANSPORTATION SURVEY
Dawn L. Massie
and
Kenneth L. Campbell
February 1993
FINAL REPORT
The L'n~versity of Michigan Transportation Research Institute Ann Arbor, Michigan 48109-2150

1990 NPTS
This work was supported by the Insurance Institute for Highway Safety. The opinions, finhngs, and conclusions expressed in this publication are those of the authors and do not necessarily reflect the views of the Insurance Institute for Highway Safety.

Technical Report Documentation Page
1 . Report No.
UMTRI-93-7 2. Government Accbssion No. 3. Recipient's Catalog No.
4. Title and Subtitle
Analysis of Accident Rates by Age, Gender, and Time of Day Based on the 1990 Nationwide Personal' Transporta- tion Survey
7. Author($)
Dawn L. Massie and Kenneth L. Campbell 9. Performing Organlzatlon Name and Addrbsr
The University of Michigan Transportation Research Institute 2901 Baxter Road, Ann Arbor, Michigan 48109
12. Sponsoring Agency Name and Address
Insurance Institute for Highway Safety 1005 N. Glebe Rd. Arlington, Virginia 22201
IS. Supplementary Notes
5. Report Dale
February 1993 6. Pe*Orming Organization Code
8. Performing Organization Report No.
UMTRI-93-7
10. Work Unit No.
11. Contract or Grant NO.
7188 13. Type of Report and Period Covered
Final Report
14. Sponsoring Agency Code
16. Abstract
Passenger-vehicle travel data from the 1990 Nationwide Personal Transportation Survey (NPTS) are combined with accident data from the 1990 Fatal Accident Reporting System (FARS) and the 1990 General Estimates System (GES) to produce accident involvement rates per vehicle- mile of travel. The same data sources are also used to generate rates per driver and per capita. Analyses are conducted according to the age and gender ofthe driver for fatal involvements, injury involvements, and all police-reported accidents. Elevated mileage-based rates of fatal involve- ments were observed for drivers 16-19 and 75 and over. The youngest drivers had 3.0 times the overall risk offatalinvolvement per mile driven, while the oldest drivers experienced 3.8 times the overall risk. Considering accidents of all levels of severity, drivers 16-19 had the highest rate per mile in 1990, experiencing 3.3 times the risk of drivers of all ages. Drivers 75 and older recorded a rate 2.0 times the overall.
Gender-related differences were observed in the 1990 accident involvement rates. Per mile driven, men had about 1.5 times the risk of women of experiencing a fatal accident. However, the difference in the fatal rate between men and women was most extreme among the younger age groups, and by age 60, the rates for men and women were essentially identical. For non-fatal accidents, a different picture emerged. Per mile driven, women were found to have a 26% higher injury involvement rate and 16% higher rate in all police-reported accidents compared to men. Women had hqher rates of non-htal acdden ts than men the same age for every age group 25 and over.
17. Key Words
Travel, accident rates, age, gender
I8 Dfslrlbullon Statement
Unlimited
19. Securlty Classif. (01 lhls report) YO Socur~tv Class~t (01 th~s pogb) 21. No. of Pages 22. Pricb
None None 90

1990 NPTS
Acknowledgment
The authors wish to gratefully acknowledge the sponsor of this research, the Insurance Institute for Highway Safety, and in particular the contributions of Allan Williams and Paul Zador.

Executive Summary
Every seven or so years, the Nationwide Personal Transportation Survey (NTPS) is conducted to collect data on the type and amount of personal travel that occurs in the United States. The most recent NPTS was conducted in 1990 by Research Triangle Institute under the sponsorship of the Federal Highway Administration and four other agencies of the U.S. Department of Transportation. The random sample survey was carried out by means of telephone interviews. Respondents provided detailed information on all personal trips they made over a particular 24-hour period. This information included the purpose, time of day, mileage distance, and means of transportation for each trip. Weighting the raw data in the NPTS file yields national, annual estimates of personal travel.
This report uses the 1990 NPTS data to calculate accident involvement rates in passenger vehicles. The objective is to compare the risk of accident involvement among different groups of people, defined by age and gender. Risk is measured by calculating the number of collisions per some unit of exposure. NPTS supplies three measures of exposure that are used in this report. The primary measure is vehicle- miles of travel. A mileage-based rate is calculated for a group by dividing the number of involvements they experienced by the number of miles they drove. Mileage-based rates directly assess risk while driving. The two other measures of exposure used are number of licensed drivers and number of persons, Calculating rates per driver and per capita allow one to assess a group's contribution to the overall traffic accident problem. Groups that drive relatively few miles will have a relatively low accident rate per driver, and groups with a low percentage of licensed drivers will have a relatively low rate per capita, compared to other groups with the same risk per mile.
The accident data come from two sources. The Fatal Accident Reporting System (FARS) supplies data on all fatal accidents occurring on public roads in the U.S. The source for accidents of all levels of severity is the General Estimates System (GES), a probability-based sample of police-reported accidents in the U.S.
When accident rates are calculated per mile driven, elevated rates are observed among the youngest and oldest dnvers. For example, drivers 16-19 had 3.0 times the overall risk of fatal involvement, and drivers 75 and over had 3.8 times the overall risk in 1990. Considering all police-reported accidents, teenage drivers had 3.3 times the overall risk, and the oldest drivers had 2.0 times the overall risk per mile.
When other measures of exposure are used, however, a different view of the elderly emerges. Because this group drives relatively few miles each year per person, their fatal involvement rate per licensed driver is only slightly above the overall rate. Furthermore, because a relatively low percentage of people over 74 have driver licenses a t all, their per capita fatal involvement rate is lower than the overall rate. For non-fatal accidents, the per dnver and per capita rates for this age group are even lower relative to younger people. Thus, people 75 and over experience a high risk of accident involvement when they drive, but they are involved in a relatively low number of acc~dents because their driving is limited relative to younger people.
Analyses are also conducted according to the gender of the driver. Per mile driven, men had about 1.5 times the risk of women of experiencing a fatal accident

1990 NPTS
in 1990. The difference in rates between men and women the same age was most pronounced among the younger age groups. By age 60, the fatal rates for men and women were essentially the same. In contrast, women were found to have a 26% higher injury involvement rate and a 16% higher rate in all police-reported accidents per mile driven compared to men. Women had higher rates of non-fatal accidents than men the same age for every age group 25 .and over.
NPTS travel data contain the starting time and duration in minutes of every trip. By defining daytime as 6 AM to 9 PM and nighttime as 9 PM t o 6 AM, trip mileage may be classified as occurring during the day or a t night. By categorizing accidents in a similar manner, daytime and nighttime rates per mile driven can be calculated. In general, the risk of accident is higher at night than during the day. Per mile dnven, the nighttime fatal involvement rate for drivers of all ages was 4.6 times the daytime rate. The difference varied with age of the driver, however. Among drivers 20-24, the nighttime fatal rate was 6.1 times the daytime rate, but among drivers 75 and over, the nighttime rate was only 1.1 times the daytime rate.
Comparisons are also made using the 1983 NPTS, the last year the survey was conducted. Comparing 1983 and 1990 rates provides an encouraging view of traffic safety trends in the 1980s. Passenger vehicle travel increased dramatically, rising 41% between the two years, but the rate of accidents per vehicle-mile travelled declined. The fatal involvement rate dropped 21%, the injury involvement rate fell 34%, and the rate of involvement in all police-reported accidents declined 23%. Lower accident rates were enjoyed by dnvers of all ages and by men as well as women.

Contents
Executive Summary . . . . . . . . . . . . . . . . . . . . . . . . . . . . . . . . . . . . . . . v
List of Tables . . . . . . . . . . . . . . . . . . . . . . . . . . . . . . . . . . . . . . . . . . . ix
List of Figures . . . . . . . . . . . . . . . . . . . . . . . . . . . . . . . . . . . . . . . . . . xi
1 Introduction . . . . . . . . . . . . . . . . . . . . . . . . . . . . . . . . . . . . . . . . . . . 1 1.1 Data Sources . . . . . . . . . . . . . . . . . . . . . . . . . . . . . . . . . . . . . . . . 2 1.2 Accident Rates . . . . . . . . . . . . . . . . . . . . . . . . . . . . . . . . . . . . . . . 3
. . . . . . . . . . . . . . . . . . . . . . . . . . . . . . 2 Mileage-Based Accident Rates 5 . . . . . . . . . . . . . . . . . . . . . . . . . . . . . . . . . . . . 2.1 Rates by Age Group 5
2.2 Rates by Single Year of Age . . . . . . . . . . . . . . . . . . . . . . . . . . . . . . . 7
3 Comparison of Accident Rates by Mileage. Licensed Drivers. and . . . . . . . . . . . . . . . . . . . . . . . . . . . . . . . . . . . . . . . . . . . Population 11
3.1 Fatal Rates Per Licensed Driver and Per Capita . . . . . . . . . . . . . . . . . 11 3.2 Injury and All Rates Per Licensed Driver and Per Capita . . . . . . . . . . . 14
. . . . . . . . . . . . . . . . . . . . . 4 Mileage-Based Rates for Men and Women 19 . . . . . . . . . . . . . . . . . . . . . . . . . . . . . . 4.1 Rates by Age and Gender - 2 0
. . . . . . . . . . . . . . . . . . . . . 4.2 Travel and Licensure by Age and Gender 22 . . . . . . . . . . . . . . . . 4.3 Discussion of Accident Rates for Men and Women 24
. . . . . . . . . . . . . . . . . . . . . . 5 Mileage-Based Rates by Light Condition 29 . . . . . . . . . . . . . . . . . . . . . . . . . . . . 5.1 Fatal Rates by Day and Night 29
. . . . . . . . . . . . . . . . . . . . . . . 5.2 Injury and All Rates by Day and Night 32 5.3 Discussion of Rates by Light Condition . . . . . . . . . . . . . . . . . . . . . . . 37
6 Changes in Travel and Hates Between 1983 and 1990 . . . . . . . . . . . . . . 41 . . . . . . . . . . . . . . . . . . . . . . . . . . . . . . . . . . . . . . . . . . . 6.1 Travel 41
. . . . . . . . . . . . . . . . . . . 6.2 Licensure Rate and Average Annual Mileage 43 . . . . . . . . . . . . . . . . . . . . . . . . . . . . . . . . . . . . . . . 6.3 Fatal Rates -45
. . . . . . . . . . . . . . . . . . . . . . . . . . . . . . . . . 6.4 Injury and All Rate% - 4 8
7 Summary of Accident Involvement by Age and Gender . . . . . . . . . . . . 51
. . . . . . . . . . . . . . . . . . . . . . . . . . . . . . . . . . . . . . . . . . . . . References 57
. . . . . . . . . . . . . . . . . . . . . . . . . . . . . . . . . . . . . Appendix A: Tables -59

1990 NPTS

Tables
. . . . . . . . . . . Table 4-1: Mileage and Accident Distributions by Gender. 1990 22
. . . . . . Table 4-2: Distribution of Involvements by Land Use and Gender. 1990 26
Table 4-3: Involvement Rates Per 100 Million Miles by Collision Type . . . . . . . . . . . . . . . . . . . . . . . . . . . . . . . . . and Gender. 1990 26
Table 5-1: Involvement Rates Per 100 Million Miles by Collision Type. Gender. and Light Condition. 1990 . . . . . . . . . . . . . . . . . . . . . . 38
Table 7-1: Age Distribution of Exposure and Involvement Categories. 1983 and 1990 . . . . . . . . . . . . . . . . . . . . . . . . . . . . . . . . . . . 51
Table 7-2: Relative Risk Based on Three Exposure Categories. 1983 and 1990 . . . . . . . . . . . . . . . . . . . . . . . . . . . . . . . . . . . 52
Table 7-3: Age Distribution of Exposure and Involvement Categories. . . . . . . . . . . . . . . . . . . . . . . . . . . Males Only. 1983 and 1990 - 5 3
Table 7-4: Relative Risk Based on Three Exposure Categories. Males Only 1983 and 1990 . . . . . . . . . . . . . . . . . . . . . . . . . . . . . . . . . . . 53
Table 7-5: Age Distribution of Exposure and Involvement Categories. . . . . . . . . . . . . . . . . . . . . . . . . . . Females Only. 1983 and 1990 54
Table 7-6: Relative h s k Based on Three Exposure Categories. Females Only 1983 and 1990 . . . . . . . . . . . . . . . . . . . . . . . . . . . . . . . . . . . 54
Table A-1: Fatal Involvements Per 100 Million Miles. 1990 . . . . . . . . . . . . . . 61
Table A-2: Injury Involvements Per Million Miles. 1990 . . . . . . . . . . . . . . . . 61
Table A-3: All Involvements Per Million Miles. 1990 . . . . . . . . . . . . . . . . . . 62
Table A-4: Fatal Involvements Per Lcensed Driver. 1990 . . . . . . . . . . . . . . . 62
Table A-5: Fatal Involvements Per Capita. 1990 . . . . . . . . . . . . . . . . . . . . . 63
Table A-6: Licensure Rate by Age. 1990 . . . . . . . . . . . . . . . . . . . . . . . . . . 63
. . . . . . . . . . . . Table A-7: Average Annual Mileage Per License Holder. 1990 64
Table A-8: Injury Involvements Per Licensed Driver. 1990 . . . . . . . . . . . . . -64
Table A-9: Injury Involvements Per Capita. 1990 . . . . . . . . . . . . . . . . . . . . 65
Table A-10: All Involvements Per Licensed Dnver. 1990 . . . . . . . . . . . . . . . . . 65
Table A-11: All Involvements Per Capita. 1990 . . . . . . . . . . . . . . . . . . . . . . 66
Table A-12: Fatal Involvements Per 100 Million Miles. Males vs . Females. 1990 . . 66

1990 NPTS
Table A-13: Injury Involvements Per Million Miles. Males vs . Females. 1990 . . . .67
. . . . . Table A-14: All Involvements Per Million Miles. Males vs . Females. 1990 .67
. . . . . . . . . . . . . . . . . . . Table A-15: Miles Driven by Age and Gender. 1990 .68
Table A-16: Licensure Rate and Average Annual Mileage Per License Holder. 1990 . . . . . . . . . . . . . . . . . . . . . . . . . . . . . . . . . . . . 68
. . . . . Table A-17: Fatal Involvements Per 100 Million Miles. Day vs Night. 1990 .69
Table A-18: Daytime Fatal Involvements Per 100 Million Miles. Males vs . Females. 1990 . . . . . . . . . . . . . . . . . . . . . . . . . . . . . . . . . . . 69
Table A-19: Nighttime Fatal Involvements Per 100 Million Miles. Males vs . Females. 1990 . . . . . . . . . . . . . . . . . . . . . . . . . . . . . . . . . . . 70
. . . . . . . Table A-20: Injury Involvements Per Million Miles. Day vs Night. 1990 .70
Table A-21: Daytime Injury Involvements Per Million Miles. Males vs . . . . . . . . . . . . . . . . . . . . . . . . . . . . . . . . . . . . Females. 1990 71
Table A-22: Nighttime Injury Involvements Per Million Miles. Males vs . Females. 1990 . . . . . . . . . . . . . . . . . . . . . . . . . . . . . . . . . . . 71
. . . . . . . . . Table A-23: All Involvements Per Million Miles. Day vs Night. 1990 .7 2
Table A-24: All Daytime Involvements Per Million Miles. Males vs . Females. 1990 . . . . . . . . . . . . . . . . . . . . . . . . . . . . . . . . . . . 72
Table A-25: All Nighttime Involvements Per Million Miles. Males vs . Females. 1990 . . . . . . . . . . . . . . . . . . . . . . . . . . . . . . . . . . . 73
. . . . . . . . . . . . . . . . . . Table A-26: Miles Driven by Age Group. 1983 and 1990 73
. . . . . . . . . Table A-27: Miles Driven by Age Group. Males Only. 1983 and 1990 74
Table A-28: Miles Driven by Age Group. Females Only. 1983 and 1990 . . . . . . . . 74
Table A-29: Licensure Rate and Average Annual Mileage Per License Holder. 1983 and 199 0. . . . . . . . . . . . . . . . . . . . . . . . . . . . . . -75
. . . . . . . . Table A-30: Percentage of Overall Travel by Age Group. 1983 and 1990 75
. . . . . . . . . . . . . . Table A-31: Fatal Involvements Per 100 Million Miles. 1983 .76
Table A-32: Fatal Involvements Per 100 Million Miles. Males vs . Females. 1983 . . . . . . . . . . . . . . . . . . . . . . . . . . . . . . . . . . . 76
. . . Table A-33: Injury Involvements Per Million Miles. Males vs . Females. 1983 (77
. . . . . . Table A-34: All Involvements Per Million Miles. Males vs Females. 1983 .7 7

Figures
. . . . . . . . . . . . . . . . . . . Figure 2-1: Fatal Crashes Per 100 Million Miles. 1990 5
Figure 2-2: All Crashes vs . Injury Only Rates. 1990 . . . . . . . . . . . . . . . . . . . . 6
Figure 2-3: Mileage-Based Crash Rates by Driver Age . . . . . . . . . . . . . . . . . . . 7
. . . . . . Figure 2-4: Fatal Crashes Per 100 Million Miles. 1990 (single year of age) 8
Figure 2-5: Injury Crashes Per Million Miles. 1990 (single year of age) . . . . . . . . 8
Figure 2-6: All Crashes Per Million Miles. 1990 (single year of age) . . . . . . . . . . 9
Figure 3-1: Fatal Crashes Per Licensed Driver. 1990 . . . . . . . . . . . . . . . . . . 11
Figure 3-2: Fatal Crashes Per Capita. 1990 . . . . . . . . . . . . . . . . . . . . . . . . 12
. . . . . . . . . . . . . . . . . . . . . . Figure 3-3: Fatal Crashes by Driver Age. 1990 13
. . . . . . . . . . . . Figure 3-4: Licensure Rate and Average Annual Mdeage. 1990 13
. . . . . . . . . . . . . . . . . . Figure 3-5: Injury Crashes Per Licensed Driver. 1990 14
. . . . . . . . . . . . . . . . . . . . . . . . Figure 3-6: Injury Crashes Per Capita. 1990 15
Figure 3-7: Injury Crashes by Driver Age. 1990 . . . . . . . . . . . . . . . . . . . . . . 15
Figure 3-8: All Crashes Per Licensed Driver. 1990 . . . . . . . . . . . . . . . . . . . . 16
. . . . . . . . . . . . . . . . . . . . . . . . . . Figure 3-9: All Crashes Per Capita. 1990 17
. . . . . . . . . . . . . . . . . . . . . . . . Figure 3-10: All Crashes by Driver Age. 1990 17
. . . . . . . . . . . Figure 4-1: Relative Risk of Involvement. Males vs Females. 1990 19
. . . . . . Figure 4-2: Fatal Crashes Per 100 Million Miles. Males vs Females. 1990 20
. . . . . . . Figure 4-3: Injury Crashes Per hlillion Miles. Males vs . Females. 1990 21
. . . . . . . . . Figure 4-4: All Crashes Per Million Miles. Males vs . Females. 1990 21
. . . . . . . . . . . . . . . . . . . . Figure 4-5: 1990 NPTS Tmvel by Age and Cender 23
Figure 4-6: Licensure Rate by Age and Gender. 1990 . . . . . . . . . . . . . . . . . . 23
. . . . . . . . . . . . Figure 4-7: Average Annual Mileage by Age md Gender. 1990 24
. . . . . . . . . Figure 4-8: Regression of Average Annual Mileage and Rates. 1990 27
Figure 5-1: Fatal Rates: Day ve . Night by Age. 1990 . . . . . . . . . . . . . . . . . . . 30
Figure 5-2: Fatal Rates: Day vs . Night by Gender. 1990 . . . . . . . . . . . . . . . . 30

1990 NPTS
Figure 5-3: Daytime Fatal Rates by Gender. 1990 . . . . . . . . . . . . . . . . . . . . 31
. . . . . . . . . . . . . . . . . . . Figure 5-4: Nighttime Fatal Rates by Gender. 1990 32
. . . . . . . . . . . . . . . . . . Figure 5-5: Injury Rates: Day vs Night by Age. 1990 33
. . . . . . . . . . . . . . . . Figure 5-6: Injury Rates: Day vs Night by ~ e n d e r . 1990 3 3
. . . . . . . . . . . . . . . . . . . Figure 5-7: Daytime Injury Rates by Gender. 1990 34
. . . . . . . . . . . . . . . . . . Figure 5-8: Nighttime Injury Rates by Gender. 1990 35
. . . . . . . . . . . . . . . . . . . Figure 5-9: All Crashes: Day vs Night by Age. 1990 35
. . . . . . . . . . . . . . . . . Figure 5-10: All Crashes: Day vs Night by Gender. 1990 36
. . . . . . . . . . . . . . . . . . . Figure 5-1 1: Daytime Overall Rates by Gender. 1990 37
. . . . . . . . . . . . . . . . . Figure 5-12: Nighttime Overall Rates by Gender. 1990 37
. . . . . . . . . . . . . . . . . . . . Figure 6-1: Driver Travel by Age. 1983 and 1990 .41
. . . . . . . . . . . . . . . . . . Figure 6-2: Driver Travel by Gender. 1983 and 1990 42
Figure 6-3: Driver Travel by Age. Males Only. 1983 and 1990 . . . . . . . . . . . . .42
Figure 6-4: Driver Travel by Age. Females Only. 1983 and 1990 . . . . . . . . . . . .43
. . . . . . . . . . . . . . . . . . . . Figure 6-5: Licensure Rate by Age. 1983 and 1990 .44
Figure 6-6: Average Annual Mileage by Age. 1983 and 1990 . . . . . . . . . . . . . .44
Figure 6-7: Percentage of Overall Travel by Age. 1983 and 1990 . . . . . . . . . . . .45
. . . . . . . . . . . Figure 6-8: Fatal Crashes Per 100 M~ll~on h11les. 1983 and 1990 .46
Figure 6-9: Fatal Crashes Per 100 hllll~on Miles by Gender. 1983 and 1990 . . . . . . . . . . . . . . . . . . . . . . . . . . . . . . . . . . 46
Figure 6-10: Fatal Crashes Per 100 S11111on Miles, Males Only. 1983 and 1990 . . . . . . . . . . . . . . . . . . . . . . . . . . . . 47
Figure 6-1 1: Fatal Crashes Per 100 Mllllon Mll~s. Females Only. 1983 and 1990 . . . . . . . . . . . . . . . . . . . . . . . . . . . . . . . . . . . 47
. . . . . Figure 6-12: Injury Crashes Per Milllon MlIes. XIRIPS Only. 1983 and 1990 .48
. . . Figure 6-13: Injury Crashes Per >11111on hlrltfi. Females Only. 1983 and 1990 .4 9
. . . . . . . Figure 6-14: All Crashes Per Mill~on 511les. ,\.Iales Only. 1983 and 1990 .49
Figure 6-15: All Crashes Per Mill~on 5111es. Females Only. 1983 and 1990 . . . . . 50
1 Introduction
In evaluating the contribution of different factors to traffic safety issues, two types of information are useful. One is prevalence and the other is risk. Prevalence is simply the proportion of accidents involving a particular factor, such as nighttime or an alcohol-involved driver. Countermeasures aimed a t a factor associated with a large proportion of accidents have greater potential benefit than those aimed at something that occurs only rarely. Risk is the likelihood of experiencing a collision involving a particular factor per unit of exposure to that factor. The identification of high-risk factors is also useful when determining where to channel collision- reduction efforts.
There are different measures of exposure to accidents, each more suited to particular purposes. In this report, rates are calculated for groups of people according to three different measures of exposure: vehicle-miles of travel, number of licensed drivers, and number of people. The rate that most directly reflects risk is the mileage-based rate. It is calculated by dividing the number of accidents experienced by drivers in the group over the course of a year by the number of miles that group drove in the same year. The second type of rate is the licensed driver rate. This is calculated by dividing the number of driver involvements in a group by the number of licensed dnvers in that group. The third type of rate is the per capita rate, calculated by dividing the number of driver involvements in a group by the total number of people in the group.
These three different rates yield different information. If one is interested in the risk of accident involvement once a person is behind the wheel of the car, the mileage-based rate should be used. Sometimes when comparing groups, however, one wants a measure of exposure that combines the risk per mile with the amount that people drive. Two groups of dnvers may have the same involvement rate on a per-mile basis, but the group that drives fewer miles per person will have the lower rate per driver. In this sense, the licensed driver rate combines the risk per mile and the average number of miles per driver,
risk miles - risk x - - - mile dnver dnver '
Similarly, the per capita mtc includes non-drivers (unlicensed people) as well as licensed drivers, so the per capita rate combines the risk per mile, miles per driver, and licensed drivers per capita,
risk - miles drivers - risk X --- x - - -
mile dnver capita capita '
Of the three types of rates, the mileage-based rate most directly assesses risk because it reflects the likelihood of experiencing an accident when actually driving.1 The licensed driver and per capita rates are more useful from a public health stand- point, where the contribution of a group to the overall problem is often of interest. For example, expressing nsk per capita allows the comparison of disparate phenomena, such as trafilc fatdi t~es, homicides, and cancer deaths.
l 0 f course, the risk nf accldent ~nvnlvrrncnt per m ~ l e IS not constant. Risk varies from mile to mile with factors such as rnad class. 1 1 ht cnndlt~nn, ruravurban, and traffic density. Some of these differences will be discussed later in SIB repnrt.
1990 NPTS
In this report, exposure data derived from the 1990 Nationwide Personal Transportation Survey (NPTS) are combined with data from two national accident files to produce rates of driver involvements in accidents. Three different levels of accident severity are considered, and rates are presented according to driver age and gender and time of day. While 1990 rates are the main emphasis, comparisons are made with rates from 1983, the previous NPTS data year.
1.1 Data Sources
The purpose of the NPTS is to provide comprehensive and nationally representative data on personal travel in the United States. The survey gathered information on all types of personal trips conducted for any purpose, using any mode of transportation except boat or ship. The 1990 NPTS was conducted by Research Triangle Institute (RTI) under the sponsorship of the Federal Highway Administra- tion and four other agencies of the U.S. Department of Transportation. This marks the fourth appearance of the NPTS; earlier surveys were conducted in 1969, 1977, and 1983.
RTI contacted a random sample of households by telephone and collected information on all trips taken by household members during a designated 24-hour period, called the travel day (RTI, 1991). Household members over age 13 were interviewed directly, while older members reported travel information for children 5 to 13 years old. Respondents provided information such as the purpose, time of day, mileage distance, and means of transportation for each trip. All personal trips, including trips to and from work, were reported in the survey. Trips made as an essential part of work were excluded, but respondents estimated their average weekly work travel.
The NPTS survey was conducted from March 2, 1990 through March 24, 1991. The household response rate was 8452, and within survey households, trip information was collected for 87% of eligible respondents (household members 5 and older). Sample coverage included all 50 states and the District of Columbia. The sample was stratified according to geography, time of year, and day of week to ensure uniform data collection. The completed survey contains records for 22,317 households, 48,385 persons, and 149,546 travel day trips. Weight factors applied to the raw data in the NPTS file yield national, annual estimates of personal travel.
The source of fatal accident data in this report is the 1990 Fatal Accident Reporting System (FARS). FARS is a census of motor-vehicle accidents involving at least one fatality and occurring on public roads in the United States. The states report data for FARS to the National Highway Traffic Safety Administration (NHTSA) in a standard format. NHTSA then constructs the FARS data file for each year.
Also developed by NHTSA, the General Estimates System (GES) is a probability-based sample of police-reported accidents of all levels of severity. The data for GES are coded from police reports. Each state has its own accident reporting system, and data elements vary from state to state. One purpose of GES is to provide a reasonably large, nationally representative set of accident data in a common format. This report uses GES for data on injury accidents and accidents of all severities.

Introduction
1.2 Accident Rates
This report compares 1990 accident involvement rates for drivers by age and gender. The following section contains mileage-based rates by age group and by single year of age. Section 3 presents per driver and per capita rates by age and compares them to the mileage-based rates. Section 4 compares rates per mile for men and women, and Section 5 expands the analysis to daytime versus nighttime rates. Section 6 discusses some of the changes in travel and accident rates between 1983 and 1990. The report concludes with a discussion of the contribution of different groups of drivers to the overall problem of motor-vehicle accidents.

1990 NPTS

2 Mileage-Based Accident Rates
This section contains 1990 involvement rates based on miles driven. The procedure is to divide the number of 1990 involvements by drivers of a particular age by the total number of miles driven in 1990 by all persons the same age. The rates pertain only to travel and involvements in passenger vehicles (cars, vans, pickup trucks, utility vehicles). Involvements are categorized according to the maximum injury severity sustained by any person involved in the accident. FARS data supply the number of fatal involvements, that is, driver involvements in accidents where at least one person died. GES data are used for injury involvements (including fatal injuries) and involvements of all severities (including property-damage-only accidents).
Driver mileage data come from two parts of the NPTS dataset. Personal travel was derived from driver-reported trips in the NPTS travel day file. Travel made as an essential part of work was derived from an estimate in the person file of weekly miles driven as part of work. Personal and work travel were summed, and the appropriate weights were applied to arrive a t annual travel estimates. Personal miles account for about 87% of the NPTS passenger vehicle travel.
2.1 Rates by Age Group
Overall there were 3.03 fatal involvements per 100 million vehicle-miles of travel (VMT) in 1990 (Table A-1). The youngest age group, drivers 16-19, had a rate of 9.21. The rate declined with each older age group to a low of 1.75 for the 40-44 group. The rate then rose with each age group, reaching a high of 11.53 for drivers 75 and older (Fig. 2-1). Based on miles driven, teenagers had 3.0 times the risk of being in a fatal accident compared to all drivers, and persons over 74 had 3.8 times the overall risk.
Fatal Crashes Per 100 Million Miles 1 990 FARS and 1 990 NPTS
15- U) Q - L S , , . . . . . . . . . . . . - . . . . . * . . . . . . . . . . . . . . . . . . . . . . . . . . . . . . . . . . *. . . .
.- k d b' z -
0- a i I I I I I
1619 529 3138 4 5 4 5559 65-69 75+ 2G24 3034 1044 50-54 60-64 70-74
Mcrap
Figure 2-1
-5-

1990 NPTS
Similar rate curves are shown for injury involvements and all police-reported accidents in Figure 2-2. In 1990 there were 2.04 injury involvements per million VMT (Table A-2) and 6.08 involvements of all severities per million VMT (Table A- 3). These rate curves share the general U-shape of the fatal curve, with one notable difference. While all three curves rise among the older age groups, the rate for the oldest group does not exceed the rate for the youngest group among all involvements or injury involvements, as it does among fatal involvements. For both injury and all accidents, teenagers had 3.3 times the risk of involvement compared to drivers overall, while drivers 75 and older had 2.0 times the risk of involvement. This pattern is likely related to the increased probability of fatality among the elderly given a crash of a particular severity (Evans, 1988; Pike, 1989).
All Crashes vs. In'u Onl Rates 1990GESan 19 NP S
25
b % Y $ 5 2 0 t
.5 \
- \ - \ 5 \
k \ \
4 \ -. AlCrashes-)). IryuryOnly \
I /
10 \ /
5 * I /
E *, \
rn #4*
5 h.- d
C --------. --*- -.--- - K-. *en
w--w-*.-*-*-*-*--w ,A+-*
' 1 1 9 2529 3539 *548 5558 6569 75e 20-24 30-34 rCUl W54 6M4 70-74
res-
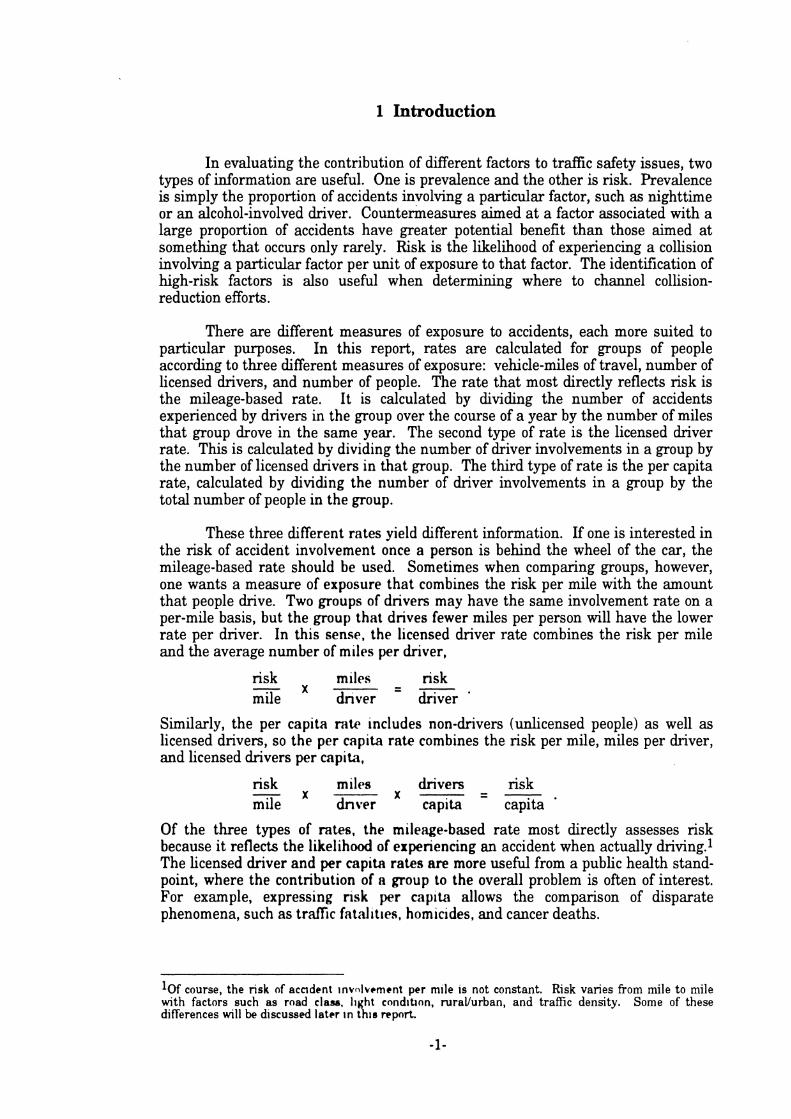
Figure 2-3 shows the mte cunlw for f i i td . injury, and all involvements together. All the rates are plotted ywr m~l l~on miles, with injury and all involvements plotted against the ltbft v-iims rind fiital ~nvolvements against the right. The graph reinforces the general shape shard by these curves, with elevations at either end of the age spectrum.
Mileage-Based Accident Rates
Figure 2-3
Mileage-Based Crash Rates by Driver Age
2.2 Rates by Single Year of Age
25
5 $20 - u 5 3 15 . . 8 - s .5 - 10- - 5 B 4 a:
Figure 2-4 is a plot of fatal rates by single years of age, from age 16 to age 75. The two rightmost ticks on the x-axis represent ages 76-79 and age 80 and over. The ends of this curve are steeper than the curve in Figure 2-1, which indicates even higher rates among the very youngest and oldest drivers compared to their aggregate rates. For example, the rdte for the 16-19 group was 9.2 involvements per 100 million VMT, but dnvers age 16 had a rate of 16.7, close to twice the rate of the teenage group as a whole. The rate was 12.5 for drivers age 17, 7.9 for age 18, and 7.2 for age 19. At the other end of the age spectrum, the fatal rate rises from 5.4 for drivers age 75, to 9.5 for age 76-79, to 19.3 for drivers 80 and above.
16-19 2529 35-39 45-49 55-59 6549 75+ 20-24 3034 40-44 50-54 60-64 70-74
Age Group
y \ \ \ \ 1
\ I \
+ All -M - Injury + Fatal \ / \ *
\ \ d/
*, \
* h.. ,FO*
\ ------*-----*--*--d M k. a - - K . '
\>-w-*=*--we - 1 @ .
- - - r
1.0
-0.8
E . . V)
-0.6 2 5
r 6 .- - - -0.4
a.
4 -0.2 [r
-0.0

1990 NPTS
Fatal Crashes Per 100 Million Miles 1990 FARS and 1 990 NPTS
20-
V) (D -
.......................................................................................
0 z
>
w ~ ~ ~ ~ ~ ~ ~ ~ ~ ~ ' ~ ~ ~ - ~ ~ ~ ~ - l ~ 4 ~ ~ ~ ~ ~ ~ ~ l ~ ~ ~ ~ ~ ~ 4 ~ ~ ~ ~ t r ~ ~ 4 r t o 3 8 l ~ - ~ T - r ~ ~ ~ - ~ ~
16 25 35 45 55 65 75 Driver Age
Figure 2-4
Injury rates show the same elevation among the youngest drivers, but not so much among the oldest (Fig. 2-5). The overall teenage rate was 6.7 involvements per million VMT. Drivers age 16 had a rate of 14.7, which is 2.2 times higher than for all teenagers. The rate was 10.2 for drivers age 17,5.3 for age 18, and 4.7 for age 19. Drivers age 80 and over had a rate of 6.4, which is 3.1 times the rate for drivers of all ages. In contrast, the rate for drivers age 16 was 7.2 times the overall rate.
Figure 2-5
-8-
Injury Crashes Per Million Miles 1990 GES and 1 990 NPTS
15-
8 s 6 10..
b d
-
........................................................................................
1 g o - . ~ ~ ~ ~ ~ . ~ ~ . ~ ~ ~ - T T . . v T . - ~ r T r 3 u u T ! - P ~ .
16 25 35 45 55 65 75 h A e e

Mileage-Based Accident Rates
The rate curve for all police-reported crashes (Fig. 2-6) is very similar to the injury rate curve. The rate for all drivers was 6.1 involvements per million VMT. Drivers age 16 had a rate of 43.2, which is 7.1 times the overall rate. Drivers age 17 had 5.0 times the overall rate. The oldest drivers, age 80 and above, had a rate 2.9 times the overall.
Figure 2-6
All Crashes Per Million Miles 1990 GES and 1990 NPTS
50
07 P) - & C 0 .- - - .-
: 3@ P
9 m
.----..--------.-. * -----.----.-...--------.--------.-.----.-.-------..---.---------.
.................*........-..............................*...........................
O ~ ~ s ~ v r m q t T . 7 T ~ n v T r . - y . v T ~ ~ ~ r ~ r . . r ~ ~ T 3 ~ l o , o a t n , , u ~ - ~ ~ ~ , ~ l 1
16 25 35 45 55 65 75 Dnvet Age

1990 NPTS

3 Comparison of Accident Rates by Mileage, Licensed Drivers, and Population
This section presents involvement rates per licensed driver and per capita. Both the estimated number of licensed ,drivers and the estimated number of persons were derived from the NPTS person file.2 Each respondent to the survey was asked if they had a license, and this information was inflated to produce national estimates of the number of license holders. Similarly, the weighted number of respondents over age 15 in NPTS yields an estimate of the total national driving-age population. Rates were derived by dividing the number of passenger-vehicle involvements by drivers of an age group by the number of licensed drivers or the total number of people in that age group. Licensed driver and per capita rates by age are compared t o the mileage-based rates for each of the three levels of accident severity.
3.1 Fatal Rates Per Licensed Driver and Per Capita
Figure 3-1 shows the number of fatal involvements per 100,000 licensed drivers. The curve is similar to the mileage-based fatal curve, except there is only a modest upturn in the rate for older drivers. Overall there were about 30 fatal involvements per 100,000 drivers in 1990 (Table A-4). Teenage drivers had the highest rate with 66.2. The rate then declined with each age group, reaching a low of 18.1 for drivers 55-59, before rising again, reaching a rate of 35.3 for drivers 75 and over. Teenage drivers had a risk of involvement that was 2.2 times the overall risk, while drivers 75 and above had a risk 1.2 times the overall.
2Alternative sources of l l c e n ~ d dnvrr and p p u l s t ~ n n data were considered. The Federal Highway Administration (FHWA) publishes rtate-rcprted numbers of licensed drivers each ear in Highway i Statistics. One difficulty wth these data I* that the states use different age group rackets in their reporting, which necessitates dlsrrggrcgaunn of the data into common age groups. Another problem is
Fatal Crashes Per Licensed Driver 1 990 FARS and 1 990 N PTS
100-
5 , > 2i
.......................................................................................
.................................................
vl$19 2529 sa 4MO 55-59 65-69 1 1 I I t 1 1 I I I
75+ 20-24 30.34 4044 5054 6061 70-74
4PC;rap

1990 NPTS
Fatal involvements per 100,000 population are plotted in Figure 3-2. This curve is less steep a t the low end of the age range than the licensed driver curve. Teenagers experienced 45.6 involvements per 100,000 population, and the rate decreased only to 44.2 for persons 20-24 (Table A-5). Thereafter the rate decreased more swiftly, to a low of 16.3 for persons 55-64. The rate then increased slightly for the older age groups, up to 22.2 for persons over age 74. Teenagers had a rate 1.7 times the overall rate of 26.1 involvements. In contrast, the 75 and older group experienced a lower risk of fatal involvements than persons of all ages combined, with a rate 0.85 times the overall rate.
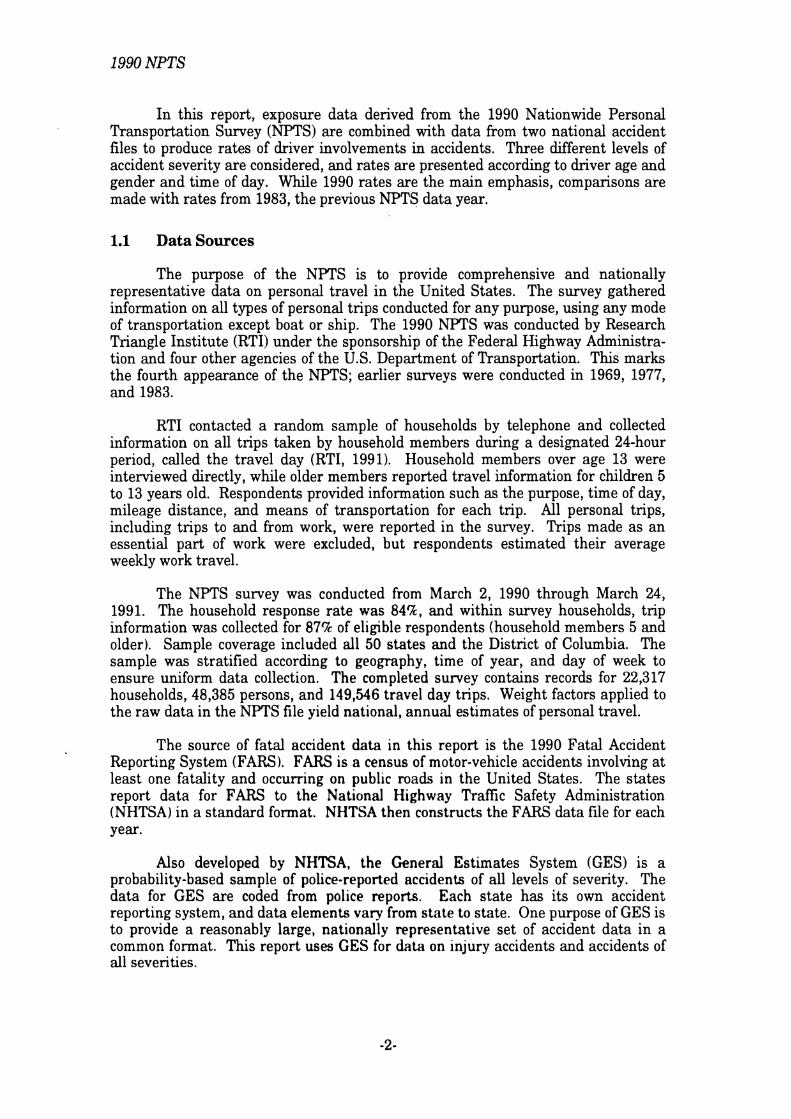
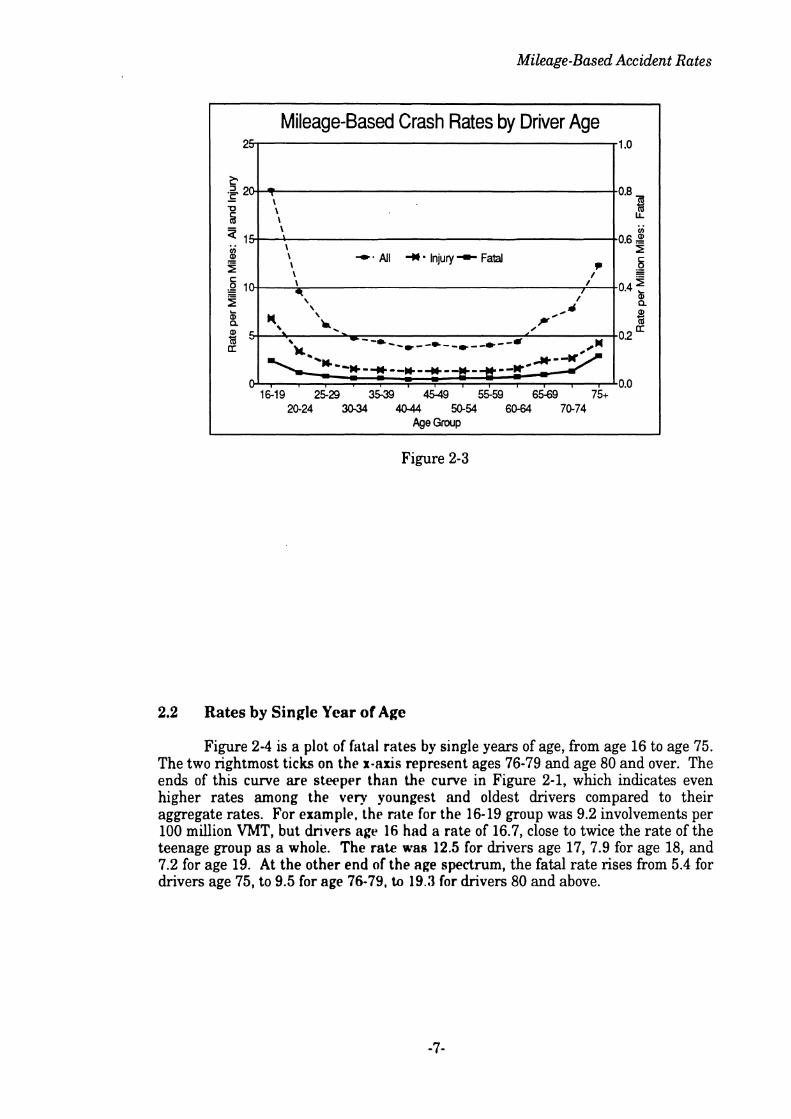
Figure 3-3 on the following page dep~ds three fatal rate curves, using mileage, population, and licensed dnvers as the bases for exposure. This figure emphasizes that per capita and p r licensed dnver rates are highest among the youngest drivers, while the mileage rate IS hlghest among the oldest drivers. The differences among the three curves reflect age-related differences in licensure rate and average annual mileage per dnvrr
Fatal Crashes Per Ca ita 1990 FARS and 1990 NP S
505
7
............................................
............................................ 7
The top curve in F i y r e 3-4 shows the percent of licensed drivers out of all people in each age group, based on Sf73 t.st~miltcs. Both the youngest and oldest age groups have low rates of licensure About 6W of teenagers and 63% of people over age 74 are licensed, while the I~censure rzte approaches 95% for people in their
E @ 6 '
C -
t h a t these da ta likely nveresbrnate the n u m b r of l ~ r r n v d d n c r r s due to eo le legally or othenvlse holding a license in more than one state T h ~ s i s nrjt a rrlnrern w t h the b f S hcennng data. The obvlnus source of populatinn e s t ~ r n a b s is the I%)c) 1's Census data The NPTS weighting procedures adjusted the raw survey data tn match t h e ('ensus Hurrnt~ s Marrh 1990 Current Population Survey, bu t this was done a t the hnusehnld Icvel, ni t t h e prrn~m Ir\rl I t ha yens t h a t the welghted number of
ersona in NPTS is sli htly lower than Cen.u. H u n a u ee t l rn~teo f,ikewse, the estimated number of ecensed dnvers in N h is slightl) beinr the FIWA e s t ~ m a t r s . Because t h e mlleage weights employed in NPl'S are based on the rrrnn Iebel weiyhl r , u u nf NFTS mileage da ta together with outside sources of licensed dnvcr and' ptllrt~~m data rnu ld result in inconnstenaes, i.e., milea e estimates would be low r c l a t ~ v r to the K c P r and p ulatlon data. t h u s mileage-based rates would % e relatively hi h. Therefore, tn ensure cnnns tmr) a n ~ m i n i r n l z e data manipulation, NPTS was used as B the source o all three types of expnsun data
..........................................................................................
0- I I 1 1 I , I I I
16-19 25-29 3539 4548 55.59 65-69 7 5 W24 30-34 4Od4 S 5 4 60-64 70-74
ree-
Comparison ofAccident Rates
thirties and forties (Table A-6). A similar attern holds for average annual mileage, plotted on the lower curve in Figure 3-4.9 Teenagers average slightly over 7,000 miles a year per driver, and drivers 75 and older average just over 3,000 miles a year (Table A-7). Persons 25-44 put on 11,000-12,000 miles a year per driver.
Fatal Crashes by Driver Age
16-19 2529 3539 45-49 55-59 6549 7% 20-24 30-34 4@-44 50-54 60-64 70-74
Age Group
Figure 3-3
Licensure Rate and Av . Annual Mileage 3 1990NP S
3~verage annual mileage was calculetrd h d~ndlng the total number of miles driven by licensed drivers by the number of lmnsed d n r r n he tntal number of miles reported by licensed drivers is about 0.3% lower than the total m~lcs for all dnvers.
1990 NPTS
Thus, age-related differences in average annual mileage and licensure rate account for the differences in fatal rates based on different measures of exposure. For example, on a per-mile basis the rate for the oldest drivers (75 and older) is 1.25 times the rate for the youngest drivers (16-19). However, per licensed driver, the oldest drivers have a rate 0.53 times that of the youngest drivers. This is a reflection of their different average annual mileages, 3,055 for the oldest compared t o 7,079 for the youngest. The oldest drivers'travel only 0.43 times as many miles per year as teenagers, per driver. This is the quotient produced by dividing the two ratios above (0.53/1.25=0.43).
Similarly, differences in licensure rate account for the difference between rates per licensed driver and rates per capita. Per capita, the oldest drivers have a rate 0.49 times that of teenagers, compared to 0.53 times the teenage rate per licensed driver. This quotient is 0.91, which equals the quotient of the licensure rate of the oldest drivers (62.7%) divided by that of the youngest drivers (68.9%).
3.2 Injury and All Rates Per Licensed Driver and Per Capita
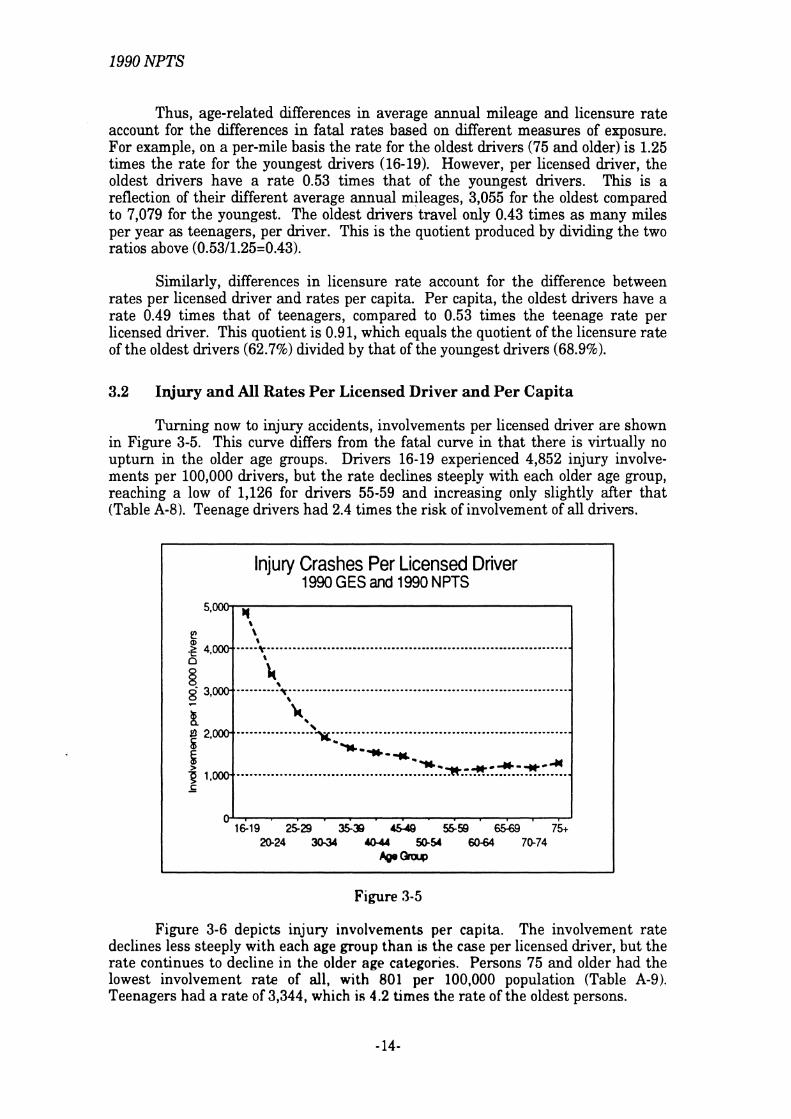
Turning now to injury accidents, involvements per licensed driver are shown in Figure 3-5. This curve differs from the fatal curve in that there is virtually no upturn in the older age groups. Drivers 16-19 experienced 4,852 injury involve- ments per 100,000 drivers, but the rate declines steeply with each older age group, reaching a low of 1,126 for drivers 55-59 and increasing only slightly after that (Table A-8). Teenage drivers had 2.4 times the risk of involvement of all drivers.
Figure 3-5
Injury Crashes Per Licensed Driver 1 990 G ES and 1 990 N PTS
Figure 3-6 depicts injury involvements per capita. The involvement rate declines less steeply with each age group than is the case per licensed driver, but the rate continues to decline in the older age categories. Persons 75 and older had the lowest involvement rate of all, with 801 per 100,000 population (Table A-9). Teenagers had a rate of 3,344, which is 4.2 times the rate of the oldest persons.
51000-
E .g 4,000. n
g 3,000. r
k s 2 , m
C 3 1 . m c -
0-
4
', ...............................................................................
i .......... ? ..........................................................*....... -,
h, \ ,.......-..........x............................................--...---..-. -n. *--w* -**-*-*-*-a .........................................................................
16-19 25-29 35-39 4 5 4 5559 65-69 75+ 20-24 3034 4 0 4 5054 60-64 7&74
EgeOlap

Comparison of Accident Rates
lnju Crashes Per Ca ita 19 GESand1990NP S
4,000
2L f 5 I 4. \ g 3,006 q. ---------......-- '-. .----.-....----.-.....*-------..--------.-.----------. L \
0 0 '. 0- 0 0 k. - 2,000- .-------.........-- 4; ............................................................... b &-.
i K--*. 'K,
-u-'*a-*%* --;....--. 6 , ,000-. - - - - - - -. - - - - -. - -. - . - - - - - - - - - - . . . . - . . - - - - - - - . - - - - - - -. . ' X 5
C -
@ 1$19 2<-29 ' 35-39 d49 ' 5d-59 65169 I I I -
7% 20-24 3044 40-44 50-54 60-64 70-74
Age WP
Figure 3-6
Figure 3-7 summarizes the different injury involvement rates per mile, per driver, and per capita. The youngest drivers have the highest involvement rate no matter which of the three measures of exposure is used. However, the mileage curve is essentially U-shaped, reflecting elevated risk at either end of the age spectrum. In contrast, the per driver and per capita curves generally slope down from left to right, indicating greatest risk for young people.
Injury Crashes by Driver Age
16-19 2529 35-38 45-49 55-59 65-69 75+ 20.24 31MI 4044 50-54 60-64 70-74
&(;roup
Figure 3-7
-15-

1990 NPTS
Per driver involvements for accidents of all levels of severity (Figure 3-8) show an age pattern similar to injury involvements. Involvements per 100,000 drivers are highest among teenagers with 14,468 (Table A-10). The rate quickly drops with each older age group and essentially stabilizes by age 50. The 60-64 group has the lowest rate of all age groups considered, with 3,252 involvements.
Figure 3-8
All Crashes Per Licensed Driver 1990 GES and 1990 NPTS
The per capita rate curve for accidents of all severities (Figure 3-9) is similar to the injury per capita curve. Involvement rates show a fairly steady decline from 9,971 per 100,000 people for the 16-19 group to 2,350 for the 75 and older group (Table A-11). The risk of involvement per capita for teenagers is 4.2 times the risk for the oldest group.
15,000
E > 5 8 1 0 , ~ . 8 z k In
g 5,000-
F2 T C -
0
t \ \ \ \
\ \ ....... .+ ........................................................................ \ \
\ \ -.
h- ........................... 'u.<-. ................................................. -* - -- -
----*--*--*--*---
I I I I I I I I I I I I I
16-19 25-29 35-39 4549 55.59 6!%9 75+ 20-24 3034 40-44 50-54 6044 70-74
Age Group

Comparison ofAccident Rates
Figure 3-9
1
All Crashes Per Ca ita 1990GESand 1990N TS
Involvement rates in all police-reported accidents per mile, per driver, and per capita are shown in Figure 3-10. Risk of involvement per mile is higher for the youngest drivers and, to a lesser extent, the oldest drivers. Risk per driver and per capita is highest for younger drivers.
10,OOO
All Crashes by Driver Age 15,
8 = 10,
! z fj 5.
Pa 100mlan des
16-19 2529 3$38 55-58 65-69 75+ M24 S34 JOu 5054 60-64 70-74
4PCla4
-,
Figure 3-10
/? 5 .w % 8 , m 0 n 0
8 6,000- 0 0 .- L
$ 4,000
f i
2,000- 5 c -
\
f \ ..... ............................ :-.......-.-..-..---.. ...........................
\ \
h ................. ?- ............................................................... , &.. m
................................... ?.:.-a ........................................ . -- ----*------
--I ...................................................................................
0 - , I I I I I I I I I I I I
16-19 2529 3539 45-49 5559 65-69 75+ 20-24 30-34 40-44 50-54 60-64 70-74
Age G ~ P

1990 NPTS
The comparison of involvement rates based on three types of exposure illustrates that risk assessment differs depending on the measure of exposure used. People 75 and older are a prime example. On a per-mile basis, they are involved in more fatal accidents than are people of any other age group. Because they drive relatively few miles each year, however, their fatal involvement rate per licensed driver is only slightly above the overall rate. Furthermore, because a relatively low percentage of people that age have driver 'licenses a t all, the per capita fatal involvement rate for people 75 and over is lower than for people of all ages combined. These differences will be discussed further in Section 7.

4 Mileage-Based Rates for Men and Women
In this section, driver involvement rates will be presented per mile driven, and the differences in rates between males and females will be explored. In 1990, men experienced 3.46 fatal involvements per 100 million miles, while women experienced 2.24. Women had higher rates of involvement than men in less severe accidents, however. Women had a rate of 2.32 injury involvements per million miles, while the male rate was 1.85. For all police-reported accidents, the rate for women was 6.54 involvements per million miles and the rate for men was 5.63.
Figure 4-1 represents these differences by depicting relative risk for men and women of being involved in an accident of each of the three levels of severity. In this case, relative risk is calculated by hviding each gender's share of involvements by its share of travel (see Table 4-1). A relative risk of 1.0 indicates no difference in risk of involvement between the group and the overall population. Relative risk values over 1.0 indicate overinvolvement, and values less than 1.0 indicate underinvolvement. For fatal involvements, men had a relative risk of 1.15 and women a relative risk of 0.74. Dividing these two numbers, or, equivalently, dividing the absolute fatal rates listed above, we see than men have 1.55 times the risk of women of being involved in a fatal accident. For injury involvements, however, men are underinvolved, with a relative risk of 0.91, while women have a relative risk of 1.15. Similarly, for all police-reported accidents, men have a relative risk value of 0.94, compared to 1.10 for women. Per mile driven, women have 1.26 times the risk of men of being involved in an injury accident and 1.16 times the risk of men of being in any police-reported accident.
Relative Risk of Involvement Males vs. Females
Figure 4-1
1990 NPTS
4.1 Rates by Age and Gender
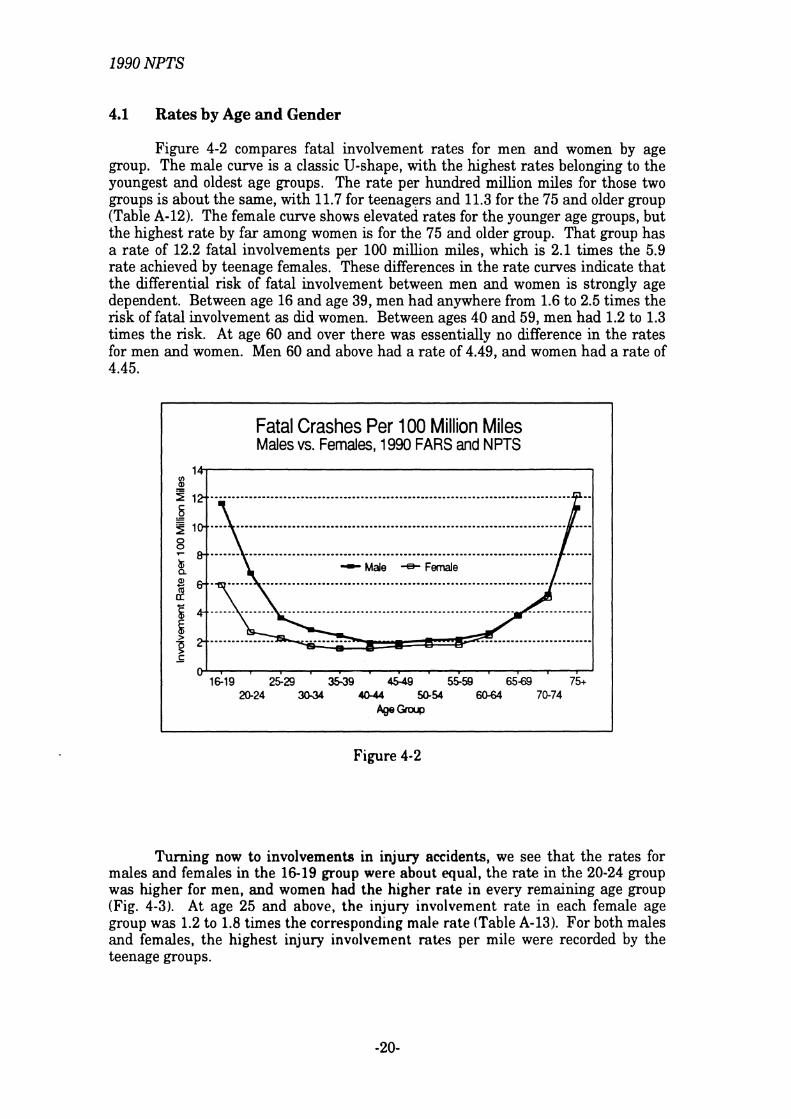
Figure 4-2 compares fatal involvement rates for men and women by age group. The male curve is a classic U-shape, with the highest rates belonging to the youngest and oldest age groups. The rate per hundred million miles for those two groups is about the same, with 11.7 for teenagers and 11.3 for the 75 and older group (Table A-12). The female curve shows elevated rates for the younger age groups, but the highest rate by far among women is for the 75 and older group. That group has a rate of 12.2 fatal involvements per 100 million miles, which is 2.1 times the 5.9 rate achieved by teenage females. These differences in the rate curves indicate that the differential risk of fatal involvement between men and women is strongly age dependent. Between age 16 and age 39, men had anywhere from 1.6 t o 2.5 times the risk of fatal involvement as did women. Between ages 40 and 59, men had 1.2 to 1.3 times the risk. At age 60 and over there was essentially no difference in the rates for men and women. Men 60 and above had a rate of 4.49, and women had a rate of 4.45.
Fatal Crashes Per 100 Million Miles Males vs. Females, 1990 FARS and NPTS
10-
-c Male * Female
C - 0 1
16-19 2529 35-39 45-49 55-58 6549 75+ 2C-24 3034 40-44 W54 60-64 70-74
AeeGrarp
Figure 4-2
Turning now to involvements in injury accidents, we see that the rates for males and females in the 16-19 group were about equal, the rate in the 20-24 group was higher for men, and women had the higher rate in every remaining age group (Fig. 4-3). At age 25 and above, the injury involvement rate in each female age group was 1.2 to 1.8 times the corresponding male rate (Table A-13). For both males and females, the highest injury involvement rates per mile were recorded by the teenage groups.

Mileage-Based Rates for Men and Women
Injury Crashes Per Million Miles Males vs. Females, 1990 GES and NPTS
8-
-c Male + Female
16-19 2529 35-39 45-49 55-59 65-69 75+ 20-24 30-34 40-44 50-54 60-64 70-74
Age Grwp
Figure 4-3
The rate curves for involvement in all police-reported accidents (Fig. 4-4) are similar to the injury involvement curves. Males had higher rates below the age of 25, while the rate for women was 1.2 to 1.7 times the corresponding male rate in all age groups 25 and over (Table A-14). Teenagers had the highest rates among both males and females. Among men, the teenage rate was 1.9 times the rate of the 75 and older age group. Among women, the teenage rate was only 1.2 times the 75 and older rate.
All Crashes Per Million Miles Males vs. Females, 1 990 G ES and N PTS
25
- W e -=-Female
Q- 1
16-19 2529 4 5 4 55-59 65-69 75+ a 2 4 30.34 404 W54 60-64 70-74
reectwp
Figure 4-4
-21-

1990 NPTS
4.2 Travel and Licensure by Age and Gender
We have seen that, on a per-mile basis, men have higher rates of fatal involvements than women, while women have higher rates of injury and all involve- ments. This is illustrated in Table 4-1, which shows the distribution of driver mile- age and accident involvements between men q d women (unknown cases have been excluded). Men accounted for 63% of the miles driven in 1990, compared to just 37% for women. Male drivers were over-represented in fatal accidents based on their share of the mileage, since they accounted for 72.5% of the involvements. Similarly, women were over-represented in injury involvements and all police-reported involvements.
Table 4 -1 Mileage and Accident Distributions by Gender
1990 FARS, 1990 GES, and 1990 NPTS
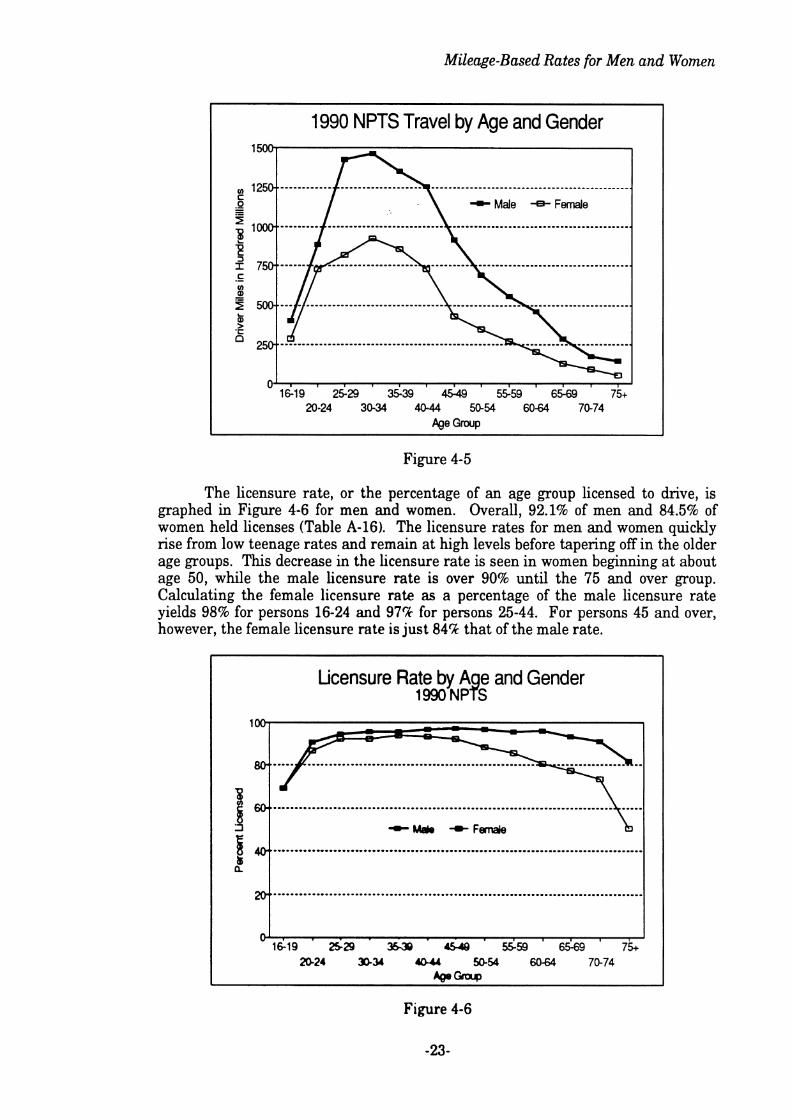
Travel distributions by age for men and women are plotted in Figure 4-5. In every age group, women drove fewer miles than men, but the magnitude of the difference varied with age. Table A-15 lists the total number of miles driven by men and women and also lists female mileage as a percentage of male mileage for each age group. From age 16 to 24, women logged 79.4% of the mileage of men. This percentage generally decreased with age. Between age 25 and 44, women drove only 60.4% of the miles that men drove, and this declined to just 47.2% for drivers 45 and over. For both men and women, total mileage rose with each age group to peak in the 30-34 group with 146 billion miles for men and 92 billion miles for women. Total mileage decreased with each age group thereafter for both men and women.
Travel or Accident Category
Driver Mileage Fatal Involvements Injury Involvements All Involvements .
Male
63.00% 72.46 57.56 59.44
Female
37.00% 27.54 42.44 40.56
Mileage-Based Rates for Men and Women
1990 NPTS Travel by Age and Gender
- Male -e- Female
..................................
16-19 2529 35-39 45-49 5559 65-69 75+ 20-24 30-34 40-44 50-54 60-64 70-74
Pge Grwp
Figure 4-5
The licensure rate, or the percentage of an age group licensed to drive, is graphed in Figure 4-6 for men and women. Overall, 92.1% of men and 84.5% of women held licenses (Table A-16). The licensure rates for men and women quickly rise from low teenage rates and remain at high levels before tapering off in the older age groups. This decrease in the licensure rate is seen in women beginning at about age 50, while the male licensure rate is over 90% until the 75 and over group. Calculating the female licensure rate as a percentage of the male licensure rate yields 98% for persons 16-24 and 97% for persons 25-44. For persons 45 and over, however, the female licensure rate is just 84% that of the male rate.
Figure 4-6
-23-
Licensure Rate by A e and Gender 9 1990NP S
-Mek +Femde
6 a! h
.......................................................................................
.......................................................................................
0- m
1&19 2529 35-32 4S4 S59 6 5 h ' 75+ B 2 4 m34 4 @ U -54 60-64 70-74
AgrGrarp

1990 NPTS
Average annual mileage per license holder is depicted in Figure 4-7 for men and women.4 For all ages combined, men averaged 12,508 miles per year compared to 7,116 for women (Table A-16). The peak average annual mileage for men was achieved by those age 25 to 49. Average annual mileage for these age groups ranged from 14,478 to 15,260 miles per year. For women the peak number of miles was driven by age groups from 20 to 44. Average annual mileage ranged from 8,470 to 8,986 miles per year for women that age. Average annual mileage for women as a percentage of that for men once again shows a decrease with age. The percentage is 73.5% for drivers 16 to 24, 58.69 for drivers 25-44, and just 47.2% for those 45 and over.
Average Annual Mileage by Age and Gender 1 990 NPTS
20,0007
".......".."
-we S F &
16-19 2129 35-3 45-08 55-59 65-69 75+ 20-24 30-3 4 M 4 W54 6064 70-74
&Graq
We have seen that men have more exposure to accident involvement than do women. A higher share of men rue Iict.nsed to dnve, and, both as a group and on an individual level, men drive more mrles each year than women. These differences in the amount of driving by men and women grow with increasing age. Compared to men, fewer older women are llwnstd to dnve and those with licenses drive much less than do men the same age. Rccnuae of these hfferences in exposure, men are involved in more accidents a t dl levels of seventy each year than women. However, women over age 25 have a h~ghtlr nsk of twrng lnvolved in a non-fatal accident per mile of driving than men.
4.3 Discussion of Accident Ratccr for Men and Women
The accident involvement rt1tt.s prcrrfbntcbd in this section suggest an interesting set of relations among dnvrr iigtl. dnvtar gender, accident severity, and risk of accident involvement. Men, espui;dly young men, were shown to have a higher fatal involvement rate than womthn, whrle women over age 25 were shown to have a higher rate of involvement rn non-ftital acclldunts than men. It has frequently
4 ~ g a i n , only miles dnven by lrcvnwd dnrcr- w e r r used ~n the calculation of average annual mileage.
-24-

Mileage-Based Rates for Men and Women
been suggested that men, especially young men, are more apt to engage in risky driving behaviors than women. Compared to female drivers, male drivers tend to speed or drive too fast for conditions more often, go through yellow lights more frequently, accept shorter gaps when entering the traffic stream or turning left before oncoming traffic, drive more aggressively, wear restraints less often, and drive under the influence of alcohol more often (Finn and Bragg, 1986; Polus et al., 1988; Storie, 1977; Veevers, 1982). These generalizations apply more strongly to young male drivers, for example those under age 25. Young male drivers have more confidence in their own driving abilities than do older drivers, and young men do not perceive specific driving situations to be as risky as older drivers perceive them (Finn and Bragg, 1986; Matthews and Moran, 1986).
It therefore seems plausible that men's higher fatal involvement rate compared to women is at least partly attributable to men's increased propensity to drive in a risky manner. This result of risky driving is not observed in the non-fatal accident rate. Fatal accidents are a rare event. Only 0.5% of all police-reported involvements in 1990 were fatal involvements. Compared to non-fatal accidents, fatal accidents are more likely to take place at night, in rural areas, involve alcohol, and result from a single-vehicle or head-on collision. It is possible that young males can usually rely on their quicker reaction times (AAA, 1966; Sivak et al., 1981; Welford, 1977) to avoid accidents, but when faced with the additional demands brought on by reduced visibility due to darkness andlor an impaired condition they have less success in avoiding an accident.
The results from GES and NPTS showing women to have a 26% higher injury involvement rate and 16% higher involvement rate in all police-reported accidents compared to men are somewhat more surprising than the higher fatal involvement rate for men. Although rates per mile provide an overall measure of the risk of crash involvement by gender, they do not take into account other risk factors, such as those associated with the driving environment. For example, women may conduct a greater share of their travel in urban areas, where the risk of accident involvement per mile may be greater than In rural areas. The NPTS data do not support a break- down of mileage into rural and urban travel, so accident rates in these two areas cannot be calculated. The d~stnbution of the accidents themselves can be examined in terms of the GES land use vmable, however. Table 4-2 presents these distribu- tions for both injury involvements and all involvements by gender. The leftmost column of the table indicates the size of the population area where the accident occurred. The land use involvement dstributions are almost identical between men and women, but the data suggest that men have a slightly higher percentage of urban involvements and women a slightly higher percentage of rural involvements. Given that women have a higher involvement rate than men in non-fatal accidents and that the distribution of involvements by land use is virtually the same between men and women, gender-related drfferences in rurallurban travel (defined in the same manner as the GES vanable) cannot explain women's higher involvement rate.

1990 NPTS
Table 4-2 Distribution of lnvolvements by Land Use and Gender
1990 G ES
Table 4-3 lists mileage-based involvement rates for different types of collisions by gender. Women are involved in more rear-end and angle collisions per mile than men. Men have slightly higher involvement rates in single-vehicle accidents than women. Head-on and sideswipe rates per mile are about the same between men and women. For whatever reason, women's higher propensity for involvement in rear-end and angle accidents compared to men drives their overall higher rate. Per mile driven, women experience 20% more rear-end collisions and 30% more angle collisions than men.
LandUse
< 25,000 25,000-50,000 50,000-100,000 1 OO,OOO+ Unknown
Total
Table 4-3 Involvement Rates Per 100 Million Miles
by Collision Type and Gender 1990 GES and 1990 NPTS
Another possible explanation for the observed gender differences in accident rates is related to the fact that women, on average, drive fewer miles than men. It has been suggested in the literature that the accident rate per mile decreases as the number of miles driven increaces (Burg, 1973; Chipman, 1982; Spolander, 1983; Veevers, 1982). The argument is that annual mileage represents one's current level of driving experience. The more experienced dnvers are thought to be more profi- cient in the driving task and so will do a better job of avoiding accidents, leading to a lower accident rate. A simple test of this hypothesis is to regress average annual mileage on the accident rate. This was done using NPTS travel data and all police- reported accidents from GES. The observations were age groups in five-year incre- ments. The results showed only a weak, inverse association between average annual
Injury Involvements
Collision Type
Single-Vehicle Rear-end Head-on Angle Sideswipe OtherIUnknown
Total .
All Involvements
Male
Freq.
898,830 171,960 171,302 549,745 69,467
1,861,304
Female Male
Injury Involvements
Col. Pct.
48.29% 9.24 9.20
29.54 3.73
1O0.OO0/~
Freq.
684,972 130,506 137,848 368,970 49,994
1,372,290
Freq.
2,729,007 477,660 638,610
1,615,709 204,356
5,665,342
Female
Male
38.56 59.1 1 5.55
75.86 4.90 0.93
184.91
All Involvements
Col. Pct.
49 91% 9.51
10.05 26.89 3.64
100.00%
Col. Pct.
48.1 7% 8.43
11.27 28.52 3.61
100.00%
Freq.
1,866,067 338,387 490,193
1,037,786 133,559
3,865,992
Female
37.36 77.72 5.76
105.27 5.15 0.89
232.1 6
Male
104.91 168.86
9.49 239.90 34.58
5.09
562.82
Col. Pct.
-
48.27% 8.75
12.68 26.84 3.45
100.00%
Female
92.66 203.1 9
9.28 311.15 33.38
4.36
654.03

Mileage-Based Rates for Men and Women
mileage (AAM) and accident rates, whether the regression was done separately by gender or by combining the genders. This is not surprising, since accident rates are certainly associated with many other factors than just average annual mileage. Figures 4-2 through 4-4 show that age is significantly associated with accident rate,
In an effort to control for age, the ratio of female to male AAM was calculated for each age group (data from Table A-16). This ratio will be one if both sexes drive the same amount, under one if males drive more than females, and so on. Similarly, the ratio of female to male accident rates was calculated for each age group (data from Table A-14). If the hypothesis that higher annual mileages are associated with lower rates is true, then there will be an association between the ratio of AAM by gender and the ratio of accident rates. In this case, we would expect that as the ratio of AAM by gender increases, the ratio of accident rates decreases. Age is controlled for by making the comparison within relatively narrow age bands.
Figure 4-8 shows some of the results of this analysis. The ratio of AAM is plotted against the ratio of accident rates and a regression line is fitted to the points. The scatter plot and regression line show that there is an association and it is in the expected direction. The fit of the line is quite good, with an R2 of 0.77. The slope of the line indicates that the relationship is strong, with a coefficient of -2.06. In age groups where women drive much less than men, their accident rates are higher than men's (ratios over 1.0). As their average annual travel approaches that of men, the female accident rate becomes closer to that of men and, in fact, where female average annual travel is about 70% or more of that of men, their accident rates are lower than men's. The age groups of the points are identified on the scatter plot. Females in the two youngest age groups have the highest AAM relative to men and are the only age groups with involvement rates below that of men. Without these two points, the relationship would be weaker, although still significant. The labels on the points illustrate that there is a general tendency for women to drive less relative to men with increasing age, and for their involvement rate to increasingly exceed that of men.
Figure 4-8
-27-
Regression of AAM and Rates Femalehlale, 1990 GES and NPTS
1.755
45-49
2024 0.75;
0.4 0.5 0.6 0.7 0.8 F m d e W e AAM

1990 NPTS
In sum, the fact that women drive less relative to men may be related to women's higher involvement rate in non-fatal accidents. The differences may also involve travel patterns, although there is no evidence that women's higher rate can be attributed to a higher share of urban travel, Ideally one requires travel data that are categorized according to many factors known to influence the risk of accident. These include rurdurban, but also road class, daylnight (discussed in the following section), and traffic density. Cross-classifying involvements and mileage according to such factors could point to gender-related differences in travel patterns that help explain the difference in accident rates. Other possible explanations may involve women's slower reaction times compared to men (AAA, 1952; Sivak et al., 1981; Wright and Shephard, 1978), or the possibility that women are more prone to distraction and perceptual errors than their male counterparts (Storie, 1977). This is a research topic that requires more work, and it is likely that multiple, interacting factors are responsible for the difference in rates by gender.

5 Mileage-Based Rates by Light Condition
This section compares daytime and nighttime involvement rates. In general, nighttime driving is associated with a higher risk of accident involvement due to factors such as reduced visibility, fatigue, and higher incidence of alcohol use. Ideally, one would wish to calculate rates according to actual light condition, whether i t was light or dark. This assessment can be made with the accident data, but it is not possible to make the determination for all of the NPTS trips. Instead, daytime was defined as 6 AM to 9 PM and nighttime as 9 PM to 6 AM for both the travel and accident data. NPTS includes information on the starting time and duration in minutes of each trip. This information was used to classify the mileage from each trip as either daytime or nighttime. Mileage from trips spanning the cutoff times was proportionately split between day and night, assuming a constant speed of travel.
Daylnight assignments could only be made for personal travel, since that was reported as individual trips in the NPTS travel day file. Work mileage was reported as a weekly estimate with no information on the time of travel. An arbitrary decision was made to assign all work mileage to daytime travel. Personal trips with an unknown start time or an unknown duration could not be classified as day or night and were excluded from the rate calculations. This resulted in a loss of 3.6% of the mileage data. Missing data rates for the time of the accident are quite low in FARS and GES. Only 0.5% of fatal involvements, 0.4% of injury involvements, and 0.6% of all involvements could not be classified as day or night. Because the missing data rate is higher in NPTS than in the accident files, the resulting involvement rates are relatively higher than the overall rates calculated previously without respect to light condition. In some cases, both the nighttime and daytime rates for a particular age cohort are higher than the overall rate for that group. This occurs more often among the older age groups because they have a higher missing data rate for time of travel than the younger groups. One could redistribute the unknown NPTS mileage into day and night categories. Since the daylnight distribution of the unknown miles may well be biased with respect to driver age and gender, however, we decided to minimize data manipulation and make no adjustment. Therefore, the absolute rates presented in this section are most properly compared to each other and not to the rates presented in earlier sections.
5.1 Fatal Rates by Day and Night
Drivers of all ages comb~ned experienced 10.37 fatal involvements per 100 million miles a t night and 2.25 during the day in 1990 (Table A-17). In general the difference between daytime and nighttime fatal rates was more pronounced among the younger age groups than the older ones (Fig. 5-11. For example, among drivers age 20-24, the nighttime rate was 6.1 times the daytime rate, while among drivers in the oldest age group, the nighttime rate was only 1.1 times the daytime rate. Note also that the highest nighttime rates were for the youngest drivers, while the highest daytime rates were for dnvem 75 and over.

1990 NPTS
Fatal Rates: Day vs. Ni ht by Age 1990 FARS and 1990 PTS
25
a
-C Night -ml-- Day
..... ..... * .....,...,.*.....*..... *..**-****
O 16-19 25-29 35-39 4549 5559 65-69 75+
20-24 30-34 4044 50-54 60-64 70-74 Age Grwp
Figure 5-1
Both males and females experienced higher fatal involvements rates a t night than during the day (Fig. 5-21. The male rate jumped from 2.44 during the day t o 12.25 a t night, while the female rate increased from 1.90 to 6.20. While men had a higher risk of fatal involvement than women both during the day and at night, their nighttime risk was more pronounced. The fatal involvement rate for men was 1.3 times that of women during the day, but 2.0 times that of women a t night.
- Fatal Rates: Da vs. Ni ht b Gender
19x1 F A R ~ ~ 14 NPYs
................................................
....................... ....................... .............
Female

Mileage-Based Rates by Light Condition
Daytime fatal rates by age and gender are plotted in Figure 5-3. While the rates are slightly higher for males, in general the two curves are very similar. Men had higher rates up to about age 40, the rates were very close between men and women from age 40 to 74, and women had the higher rate for the 75 and older group (Table A-18). The oldest group of drivers experienced the highest daytime rates among both men and women.
Daytime Fatal Rates by Gender 1990 FARS and 1990 NPTS
U)
15- 0) - a C .Q - - 2 ,@
.......-..-............................-..............*. 9 - Male * Female
C - 0-
16-19 25-29 35-39 4 5 4 55-59 6549 75+ B 2 4 3034 4044 50-54 60-64 70-74
Age -P
Figure 5-3
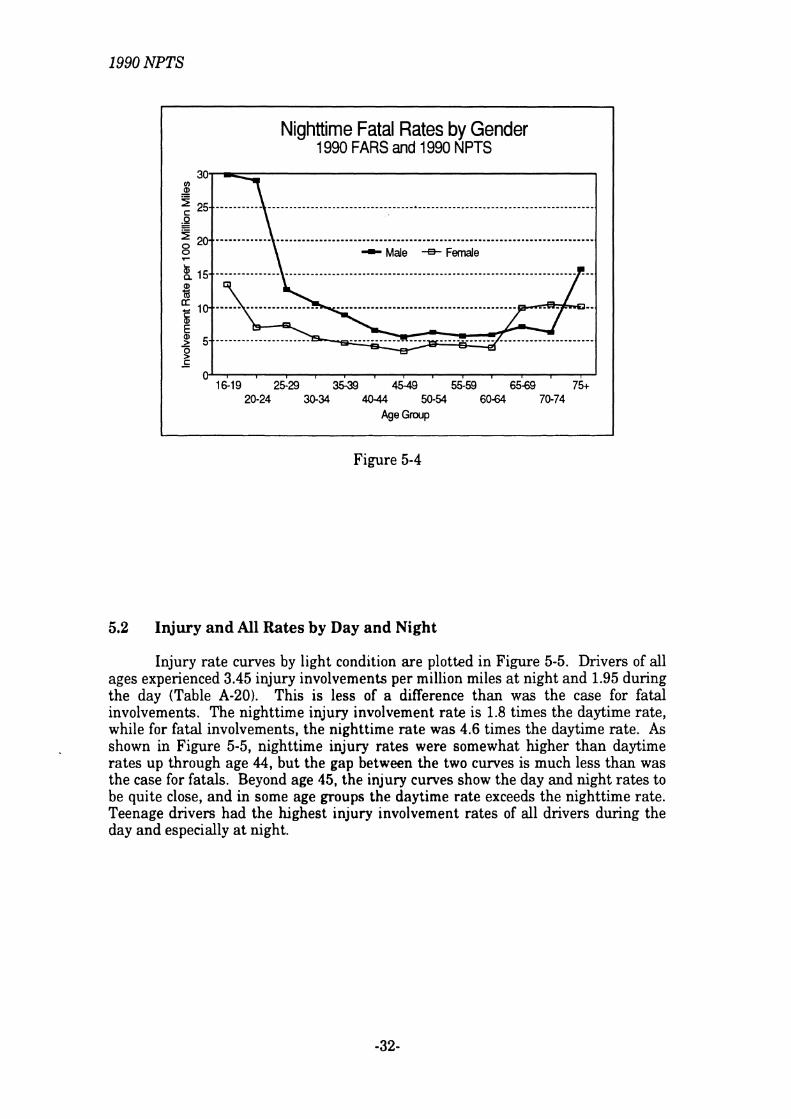
Nighttime fatal rates were higher for men than women in every age group except the 65-74 group (Fig. 5-41. Rates for the youngest male drivers were exceptionally high. Males 16-19 had a rate of 29.7 fatal involvements per 100 million miles, and males 20-24 had a rate of 28.8 (Table A-19). These rates are close to three times the rates experienced by drivers in general at night. To put this in perspective, excluding males 16-24 would lower the overall male nighttime fatal involvement rate from 12.2 to 8.9. Excluding males 16-24 would lower the fatal involvement rate for dl dnvers, both male m d female, from 10.4 to 8.0.
1990 NPTS
Nighttime Fatal Rates by Gender 1990 FARS and 1990 NPTS
-c Male -S Female
*.....................--*..-...-
16-19 25-29 35-39 45-49 55-59 65-69 7% 20-24 30-34 40-44 50-54 60-64 70-74
Age Group
Figure 5-4
5.2 Injury and All Rates by Day and Night
Injury rate curves by light condition are plotted in Figure 5-5. Drivers of all ages experienced 3.45 injury involvements per million miles a t night and 1.95 during the day (Table A-20). This is less of a difference than was the case for fatal involvements. The nighttime injury involvement rate is 1.8 times the daytime rate, while for fatal involvements, the nighttime rate was 4.6 times the daytime rate. As shown in Figure 5-5, nighttime injury rates were somewhat higher than daytime rates up through age 44, but the gap between the two curves is much less than was the case for fatals. Beyond age 45, the injury curves show the day and night rates to be quite close, and in some age groups the daytime rate exceeds the nighttime rate. Teenage drivers had the highest injury involvement rates of all drivers during the day and especially a t night.

Mileage-Based Rates by Light Condition
lnjury Rates: Day vs. Ni ht by Age 1 990 GES and 1 990 8 PTS
16-19 2529 3539 45-49 5559 65-69 75t 20-24 30-34 40-44 50-54 60-64 70-74
Age -P
Figure 5-5
There is an interesting difference in the injury involvement rates between men and women according to light condition (Fig. 5-6). During the day, female drivers had a higher rate than male drivers, but this was reversed a t nighttime. The difference in rates between men and women was not large in either case. During the day, the female rate was 1.4 times the male rate, and a t night, the male rate was 1.2 times the female rate. Nighttime rates exceeded daytime rates for both men and women, but especially for men.
Injury Rates: Day vs. Night b Gender 1990GES and 1990 NPT g
.............
.............
Figure 5-6
-33-
1990 NPTS
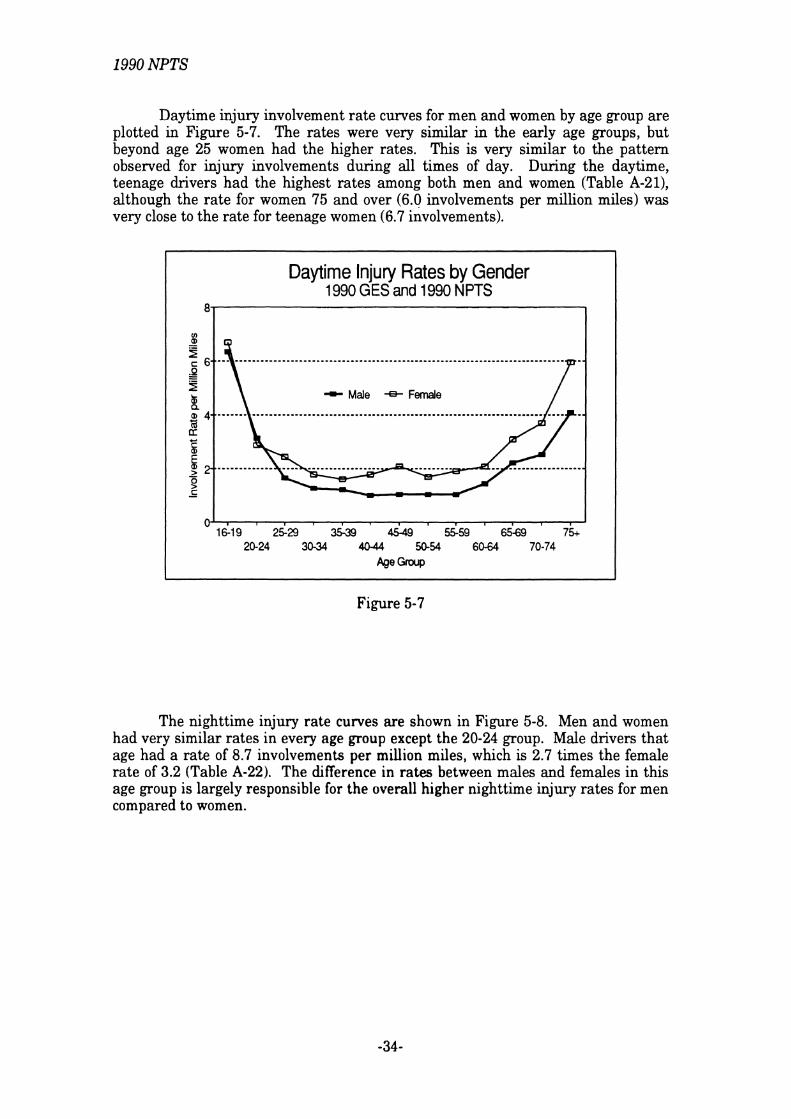
Daytime injury involvement rate curves for men and women by age group are plotted in Figure 5-7. The rates were very similar in the early age groups, but beyond age 25 women had the higher rates. This is very similar to the pattern observed for injury involvements during all times of day. During the daytime, teenage drivers had the highest rates among both men and women (Table A-21), although the rate for women 75 and over (6.0 involvements per million miles) was very close to the rate for teenage women (6.7 involvements).
>
Daytime Injury Rates by Gender 1 990 G ES and 1 990 N PTS
8
+ Male + Female ..............................................................
0- 1
16-19 25-29 3539 4549 55-59 65-69 75+ 20-24 3034 4044 50-54 60-64 70-74
Ase Grwp
Figure 5-7
The nighttime injury rate curves are shown in Figure 5-8. Men and women had very similar rates in every age group except the 20-24 group, Male drivers that age had a rate of 8.7 involvements per million miles, which is 2.7 times the female rate of 3.2 (Table A-22). The difference in rates between males and females in this age group is largely responsible for the overall higher nighttime injury rates for men compared to women.

Mileage-Based Rates by Light Condition
Nighttime Injury Rates by Gender 1 990 G ES and 1 990 N PTS
10-
- Male * Female
@16-19 2529 35-39 454 55-59 6549 75+ 20-24 3034 40-44 50-54 60-64 70-74
Age Group
Figure 5-8
Involvement rates for all police-reported accidents are plotted in Figure 5-9 according to light condition. The curves are quite similar to the injury involvement curves. Drivers of all ages experienced 9.13 involvements per million miles at night and 5.93 during the day (Table A-23). The nighttime rate was only 1.5 times the daytime rate, which is even closer than was the case for the injury rates. The nighttime rate for all involvements was slightly higher than the daytime rate for every age group up through age 54, but for each of the older age groups, the daytime rate was higher.
All Crashes: Day vs. Ni ht by Age 1 990 GES and 1 990 I! PTS
16-19 25-29 35-3 4 5 4 55-59 65-69 7% 2624 a31 4044 50-54 60-64 70-74
WQW
Figure 5-9
-35-

1990 NPTS
Involvement rates for males and females in all police-reported accidents by day and night are shown in Figure 5-10. Again, in a pattern similar to injury involvements, women had the higher rate during the day (6.67 to 5.35), and men had the higher rate a t night (9.28 to 7.61). During the day, the rate for women was 1.2 times that for men, and at night, the men's rate was 1.2 times the women's rate.
All Crashes: Day vs. Ni ht b Gender 1990GESand19 d ? NP S
Female
Figure 5-10
More specifically, the elevated ovrmll accident involvement rate for women during the daytime was restricted to dnvers 25 and over (Figure 5-11). Between age 16 and 24, men had a higher daytime involvement rate than women (Table A-24). At nighttime, men had a higher overall ~nvolvtlrnent rate than women from age 16 all the way through age 39 (F~gum 5-12 1 The n~ghttime rates were similar between men and women for all the older agt3 groups, with drivers of neither gender having the clearly higher involvement rate (Table A-25 I

Mileage-Based Rates by Light Condition
Daytime Overall Rates by Gender 1 990 G ES and 1 990 N PTS
25-
- Male 4 Female
0 - , 16-19 25-29 35-39 45-49 55-59 6543 75+
20-24 30-34 4044 50-54 60-64 70-74 Age Group
Figure 5-11
Nighttime Overall Rates by Gender 1 990 G ES and 1 990 N PTS
- W e -Female ......................................................
1619 25-29 35-30 4 5 4 55-59 6549 75+ M24 30-34 4014 50-54 60-64 70-74
+Clraq
Figure 5-12
5.3 Discussion of Rates by Light Condition
We have seen that in general accident rates per mile driven are higher at night than during the day, although this is more true for fatal involvements than for less severe accidents. Elevated nighttime risk is especially apparent for male drivers and younger drivers. For non-fatal accidents, older drivers often had higher involvement rates in the daytime than at night. This was especially true for female drivers.

1990 NPTS
At the end of the last section, the possibility was raised that women's higher rate of involvement in non-fatal accidents compared to men could be a consequence of greater urban travel by women. No support was found for this idea, but another possibility is that women have a higher share of nighttime travel than do men. This idea also fails since only 9.6% of women's travel is a t night, compared to 11.4% of men's travel.
We can look at mileage rates for various collision types, this time expanding the comparisons to include light condition. Earlier we noted that women have a higher rate per mile of rear-end and angle collisions than do men, As Table 5-1 shows, this is true only during the daytime. At night, the rates of rear-end and angle collisions between men and women are very similar, with men having the slightly higher rates. In fact, for both injury and all police-reported involvements, men have higher nighttime rates than women in every type of collision, but especially single-vehicle, head-on, and sideswipe accidents.
Furthermore, men's risk of involvement in single-vehicle accidents a t night is 5.3 times their daytime rate. Their risk of involvement in each of the other types of collisions is less than two times the corresponding daytime rate. Women's risk of involvement in single-vehicle accidents a t night is 3.4 times their daytime risk. Women's higher nighttime than daytime rate is almost entirely attributable to their higher risk of single-vehicle involvements a t night. Men's elevated nighttime rate is also largely driven by single-vehicle involvements, but the higher risk is seen across all types of collisions.
Table 5-1 Involvement Rates Per 100 Million Miles
by Coillsion Type, Gender, and Light Condition 1990 GES and 1990 NPTS
INJURY INVOLVEMENTS
Collision Type
Single-Vehicle Rear-end Head-on Angle Sideswipe OtherIUnknown
Total
Dayt~me
ALL INVOLVEMENTS
Male
26.46 59 08 4 83
73 78 4 45 0 82
16941
Nighttime
Male Female
Collision Type
Single-Vehicle Rear-end Head-on Angle Sidesw~pe OtherlUnknown
Total
Female
31 79 81 61 5 65
108 70 4 98 0 95
233 68
141.89 76.40 12.67
113.51 9.68 2.03
356.19
- 102.56 69.37
9.1 1 111.17
7.72 0.43
300.37
Oayt~ma Nighttime
Male
72 30 172 86
8 88 243 21 33 24
4 89
535 39
Male
385.12 183.81
16.34 280.62
54.79 7.67
928.36
Female
77 47 21 5 28
9 34 326 65 33 69
4 70
667 12
Female
265.06 162.85 12.49
276.81 41.62
2.48
761.31

Mileage-Based Rates by Light Condition
The role of alcohol in nighttime accidents also deserves mention. For accidents at all levels of severity, a greater percentage of drivers were under the influence of alcohol at night than during the day. In 1990, in the daytime, 2.0% of drivers in all police-reported accidents, 3.0% of drivers in injury accidents, and 13.4% of drivers in fatal accidents were under the influence of alcohol. The corresponding percentages at night were 16.1%, 22.8%, and 40.9%. A higher percentage of male drivers than female drivers were under the influence, and single- vehicle accidents had the greatest percentage of alcohol-involved drivers. Among nighttime fatal involvements, 49.4% of male drivers and 37.5% of female drivers in single-vehicle accidents were under the influence of alcohol.

1990 NPTS

6 Changes in Travel and Rates Between 1983 and 1990
The NPTS was last conducted in 1983. In this section, comparisons are made between the 1983 NPTS and the 1990 NPTS in terms of total number of miles driven, licensure rate, and average annual mileage. Accident rates per mile are also compared between these two years. The main changes that occurred during this time period were a large increase in the amount of travel in passenger vehicles but a drop in the accident rate per mile. The 1983 travel and accident data used in this section come from work done by Williams and Carsten (1989).
6.1 Travel
Overall, the number of miles driven in passenger vehicles rose from 1,136 billion in 1983 to 1,598 billion in 1990, an increase of 40.7% (Table A-26). Driver travel by age group for the two years is plotted in Figure 6-1. In terms of absolute number of miles, the greatest increases were among drivers age 25 to 54. Travel grew by 25 billion to 80 billion miles for each of the age groups in this range. In terms of percentage increase, the single largest rise was for the group of drivers 75 and over, whose mileage grew 90%, from 10.4 billion miles in 1983 to 19.8 billion miles in 1990 (Table A-26). Travel rose by over 70% among the 70-74 group and by close to 70% among drivers 40-49.
Driver Travel by Age: 1983 vs. 1 990
*- 1983- 1990
1&19 25.29 3539 4 5 4 5559 6!j-69 75t 2024 X-34 40-44 50-54 60-64 70-74
AeoGrap
Figure 6- 1
Mileage for male dnvers rose from 766 billion to 1,007 billion from 1983 to 1990, an increase of 31.5% (Table A-27~ Mileage for female drivers rose relatively more, growing from 370 billron to 591 billion, an increase of 59.8% (Table A-28). Because of this, the gap in travel between men and women narrowed between 1983 and 1990, although male dnvers accounted for the bulk of the travel in both years (Fig. 6-2). The male share of the travel declined from 67.4% to 63.0%, while women's share of driver mileage rose from 32.6% to 37.0%.
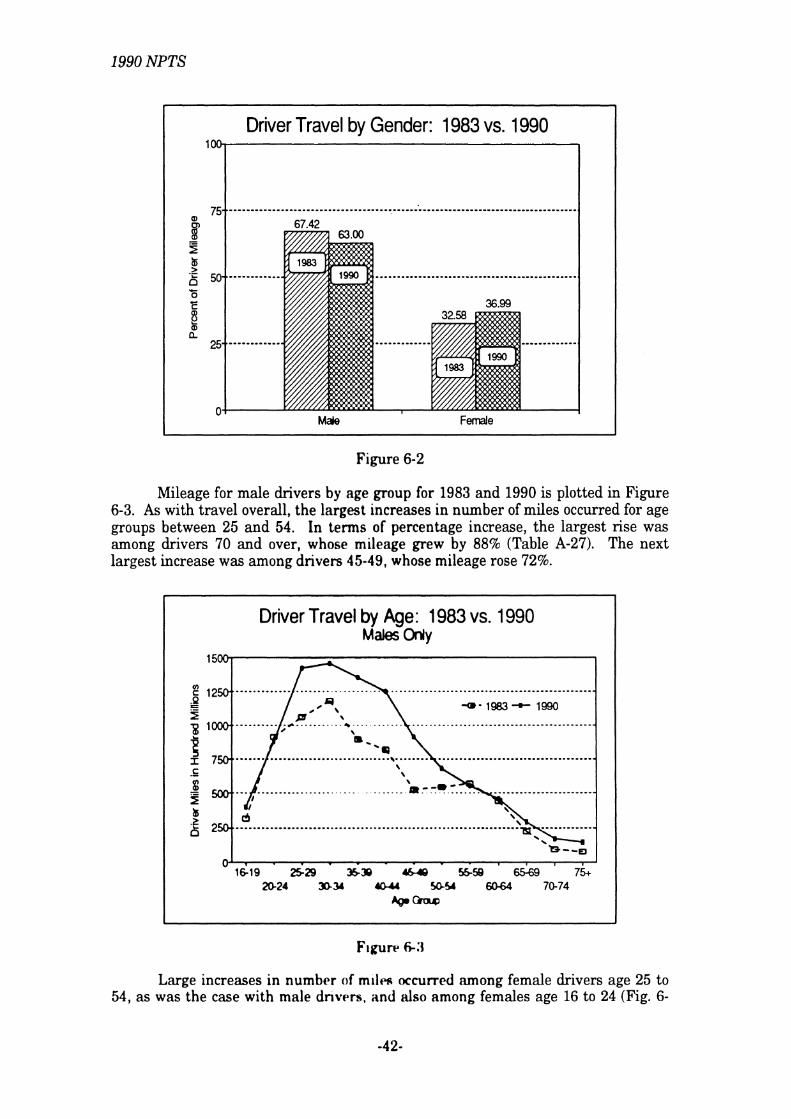
1990 NPTS
Driver Travel by Gender: 1983 vs. 1990
...............................................
............. .............
Figure 6-2
Mileage for male drivers by age group for 1983 and 1990 is plotted in Figure 6-3. As with travel overall, the largest increases in number of miles occurred for age groups between 25 and 54. In terms of percentage increase, the largest rise was among drivers 70 and over, whose mileage grew by 88% (Table A-27). The next largest increase was among drivers 45-49, whose mileage rose 72%.
Driver Travel by Age: 1983 vs. 1990 Males Only
a- 1983 - 1990
w1619 2529 3139 LMO 55% 6$69 75+ 2@24 3125, 4044 WCJ 6064 70-74
e- I
Large increases in number of miles occurred among female drivers age 25 to 54, a s was the case with male dnvers, and dso among females age 16 to 24 (Fig. 6-

Changes Between 1983 and 1990
4). The percentage increase in female travel between 1983 and 1990 was larger than the corresponding male percentage in every age group except two (45-49 and 70-74). A particular difference in travel changes between male and female drivers was in the 16-24 age group (Table A-28). Travel rose 51.8% between 1983 and 1990 for female drivers this age and just 4.5% for male drivers the same age.
Driver Travel by Age: 1983 vs. 1990 Females Only
-Q- 1983 + 1990
16-19 25-29 3539 4549 55-59 65-69 75+ 20-24 3G34 40-44 50-54 60-64 70-74
Age QWP
Figure 6-4
6.2 Licensure Rate and Average Annual Mileage
Figure 6-5 compares the percent of licensed drivers out of all persons of driving age between 1983 and 1990 using NPTS data. Overall, the licensure rate rose from 81.4% to 88.154 between those two years (Table A-29), and the percent of licensed drivers increased in every single age group. Increases in the licensure rate were especially apparent among older persons. In 1983,61.2% of people 65 and over held licenses, and this increased to 75.2% in 1990. The male licensure rate for individuals 65 and over rose from 80.3% in 1983 to 88.5% in 1990, while the female licensure rate for that age group went from 48.3% to 65.6%.

1990 NPTS
Figure 6-5
Licensure Rate by Age: 1 983 vs. 1990 100
.....................................
\ .......................................................................... Y""" \ \
4- 1983 -C 1990 \ b ..................................................................................
Average annual mileage per driver also increased between 1983 and 1990 (Fig. 6-6). Overall, average annual mileage rose from 7,925 to 9,771 miles, an increase of 23% (Table A-29). Increases were especially notable among younger drivers. Average annual mileage increased 36% for drivers 16-19 and 31% for drivers 20-24.
a a
2 .............. '."'-.."-......--~~.~.~...-..----.*.........--.....................-
Figure 6-6
O 16-19 25-29 3539 45-49 55-59 6549 75+ 20-24 30-34 40-44 50-54 60-64 70-74
Age Group
Avera e Annual Milea e b Age & i?, H 1 3NPTSvs. 1990 PT
-0.1983- 1990
a 2000.
b ....................................................................................
0-16-19 25-29 35.39 4148 55-59 6569 75+ 20-24 W34 4044 50-54 60.64 70-74
ABeGrarp

Changes Between 1983 and 1990
Figure 6-7 compares overall travel distributions across driver age groups between 1983 and 1990. The distribution of travel by age was relatively stable between the two years, but some minor differences are apparent (Table A-30). The percent of mileage driven by persons 16 to 34 declined from 46.2% to 43.4%, and mileage by the 50 to 69 group dropped from 21.5% to 18.3%. This was countered by increases among drivers 35-49 (30.0% to 34.6%) and by drivers 70 and older (2.3% to 2.9%). Thus, even though the licensure rate among the elderly has increased dramatically and their average annual mileage has risen as well, this group continues to account for only a tiny (although higher than in 1983) share of the overall mileage. In contrast, 53% of all passenger-vehicle travel in 1990 was recorded by drivers in their twenties and thirties.
Percentage of Overall Travel by Age 1 983 N PTS vs. 1 990 N PTS
1983- 1990
.........-..........**.--
16-19 2529 3539 45-49 55-59 65-69 75+ 20.24 3b34 40-44 50-54 6044 70-74
Age Grwp
Figure 6-7
6.3 Fatal Rates
The mileage-based fatal involvement rate showed a 20.6% drop between 1983 and 1990. In 1983 there were 3.81 fatal involvements per 100 million miles (Table A-31), and this declined to 3.03 in 1990. The fatal rate decreased in every age group except drivers 60-64, who recorded a slight increase (Fig. 6-8). Drops in the fatal involvement rate were especially pronounced at either end of the age spectrum. The rate fell 26.79 for drivers 16-19, 22.4% for those 20-24, and 21.2% for drivers 25-29. Among older drivers, the rate fell 20.8% for drivers 70-74 and 22.2% for drivers 75 and older. Part of the reason for the large overall decline in the fatal involvement rate is the shifts in the travel distribution by age group between 1983 and 1990, as discussed above. For example, the mileage share for drivers 20-24, a group with a higher than average fatal involvement rate, dropped from 12% to 10% of the total miles between 1983 and 1990 (Table A-30). Meanwhile, travel by drivers 35-49 rose from 30% to 35% of the overall, and the fatal rate for this group is lower than average.

1990 NPTS
Figure 6-8
Fatal Crashes Per 100 Million Miles 1983 vs. 1990, by Age
15 w
The fatal involvement rate declined for both male and female drivers between 1983 and 1990 (Fig. 6-9). The male rate dropped 18.3%, from 4.23 to 3.46 fatal involvements per 100 million miles. The female rate dropped 22.0%, from 2.87 to 2.24.
% 5
Fatal Crashes Per 100 Million Miles 1983 vs. 1990, by Gender
............................................................
.................................................
.............
............. .............
Female
I I
q I
Figure 6-9
S \ *. i983.+ i990 I = - I
..... ! c......--..-......-..-..................-----.-
C - 0 3
16-19 2529 3539 45-49 5559 65-69 7 s 20-24 30-34 40-44 50-54 60-64 70-74
Age -P
Figure 6-10 shows the fatal involvement rate curves for men in 1983 and 1990, and Figure 6-11 shows the similar curves for women. In general, the changes in fatal rates between 1983 and 1990 are similar for male and female drivers. The

Changes Between 1983 and 1990
only notable differences are at the ends of the age spectrum. The fatal involvement rate for men 16-24 dropped 12% between the two years, from 9.36 to 8.22 involve- ments per 100 million miles. However, the fatal involvement rate for women 16-24 fell much more sharply, from 5.23 to 3.55, a drop of 32%. Among drivers 70 and older, the male rate fell 30%, from 11.41 to 7.98, while the female rate showed an 8% rise, going from 7.17 to 7.76. The change in rates for drivers 25-69 was almost the same between men and women, falling 15% for male drivers and 18% for female drivers. Fatal rates by five-year age groups for men and women in 1983 are presented in Table A-32.
Figure 6-10
Fatal Crashes Per 100 Million Miles 1983 vs. 1990, Male Drivers Only
20- U) 0) - 5 C
2 S
Figure 6- 11
-47-
................................................................................. a-- I G' 1983- 1990 I
I
Fatal Crashes Per 100 Million Miles 1983 vs. 1990, Female Drivers Only
15
I
C - 0- 8
16-19 2529 3539 45-49 55-59 6569 75+ 20-24 3034 4C-44 50-54 60-64 70-74
@Group
8 5 S 3 1 &, 8
h
'J I
-0.1983- 1990
................................................................................... Q '\
.................................
- - * - - m - - m e - = - 0 -
16-19 2529 35-38 4543 55-59 65-69 75t 2@24 S34 40U 5054 60-64 70-74
4PC;rap

1990 NPTS
6.4 Injury and All Rates
The source for non-fatal accident data in 1983 presented in this section is the National Accident Sampling System (NASS). NASS was an annual accident data collection effort initiated in 1977 by the National Center for Statistics and Analysis of NHTSA. Trained teams of accident investigators collected data from accidents selected by means of a probability sample. NASS produced detailed information on vehicle crashworthiness and occupant injury outcomes. In addition, NASS data yielded national estimates of the annual number of police-reported accidents, just as GES does currently. Because of small sample sizes in NASS, three years of data (1982-1984) were averaged to produce the estimated number of involvements in 1983.
Injury rates declined even more steeply between 1983 and 1990 than did fatal rates. In 1983 there were 3.12 injury involvements per million miles, compared to 2.04 in 1990, a drop of 34.4%. For both male and female drivers, the injury involvement rate declined in every single age group between the two years (Fig. 6- 12, Fig. 6-13). The percentage decline in the injury rate was virtually identical for male and female drivers. The rate for men fell 34.98, and the rate for women fell 35.0%. Injury involvements for male drivers declined from 2.84 per million miles in 1983 to 1.85 in 1990. The rate for female drivers decreased from 3.57 t o 2.32 (Table A-33).
Injury Crashes Per Million Miles 1983 vs. 1990, Male Drivers Only
12-
VI
g 5 .- - - 5 8.
.................................................................................... \ \ \
4. 1903 -C lggO
...... \.............................................................................. \ /
P-- /
/ .................................................. 1.--- - - - -
I F'
/ ................................................
@16-19 25-29 35% UQ S S 6569 75+ M24 B34 1044 Xr54 60€4 70-74 +-
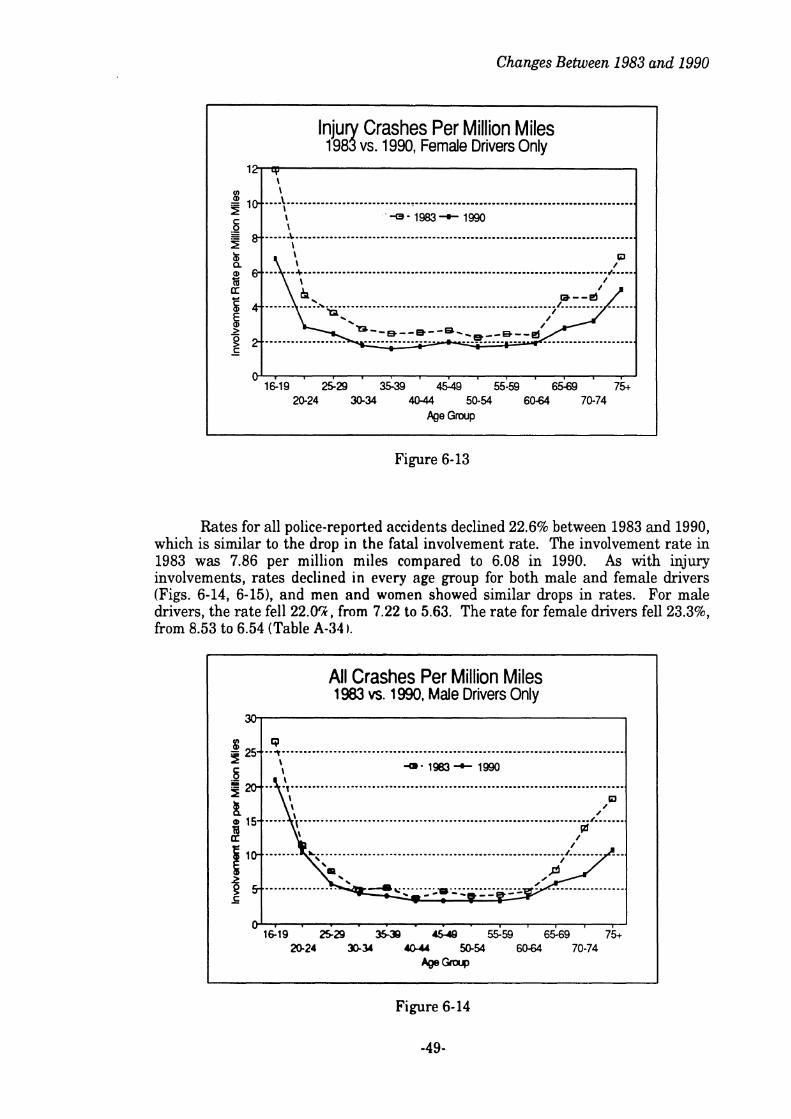
Changes Between 1983 and 1990
Figure 6-13
lnju Crashes Per Million Miles 198 vs. 1990, Female Drivers Only
12 y
7
Rates for all police-reported accidents declined 22.6% between 1983 and 1990, which is similar to the drop in the fatal involvement rate. The involvement rate in 1983 was 7.86 per million miles compared to 6.08 in 1990. As with injury involvements, rates declined in every age group for both male and female drivers (Figs. 6-14, 6-15), and men and women showed similar drops in rates. For male drivers, the rate fell 22.OCk, from 7.22 to 5.63. The rate for female drivers fell 23.3%, from 8.53 to 6.54 (Table A-34 r .
I 10.
z .- - - s
\ \ ..... \ ......... ......................................................................... \ \ - 0 - 1983- 1990 \ &.--.-.".............--.....--....................-............................*........ \
Figure 6-14
-49-
... ..+.......................................................................d......
LT ................. 4 ............. A ......................................................
E a. > - o 2 D--s--e--*-_e--~--d ...................................... ................................... s -
@- 1
16-19 25-29 35-3 4549 55-59 65a 7 5 20-24 30.34 40-44 50-54 60-64 70-74
Pge G ~ P
All Crashes Per Million Miles 1983 vs. 1990, Male Drivers Only
30
8 25 I Q -...+ .................................................................................
\ 4- 1983- 1990 ...................................................
E)
.................................... .... ...... @
O 1619 2529 3538 4 5 4 55-59 65-69 7 5
20-24 30-34 1044 50-54 6044 70-74 @Group

1990 NPTS
Figure 6-15
All Crashes Per Million Miles 1983 vs. 1990, Female Drivers Only
3 0 = -
Data supplied by the 1983 and 1990 NPTS provide an encouraging view of traffic safety trends in the 1980s. Passenger vehicle travel increased dramatically between 1983 and 1990, but the rate of accidents per vehicle-mile travelled declined. Passenger vehicle travel rose by 41%, the percent of the driving-age population holding a license increased from 81% to 88%, and average annual mileage per licensed driver climbed from 7,925 to 9,771 miles. Per mile of travel, however, fatal involvements decreased 21%, injury involvements dropped 34%, and all police- reported accidents fell 23%. Lower accident rates were enjoyed by drivers of all ages and by men as well as women.
g 25.- q ---..--.------.-.-.-----.----.---------.--------------------------.--------------- \
-Q- 1993- 1990 0 I I ..--.........-*.......-...--....-..........*.-.....--.--+-.---
I
0 1
16-19 25-29 35-39 45-49 55-59 6549 75+ 20-24 30-34 40-44 50-54 60-64 70-74
Age Group

7 Summary of Accident Involvement by Age and Gender
In this concluding section, three age-groups of the driving-age population will be compared in terms of the three measures of exposure used in this report (vehicle- miles of travel, number of licensed drivers, and number of people) and in terms of their number of involvements in fatal, injury, and all police-reported accidents. The three age groups are 16-24, 25-64, and 65 and over. The comparisons will be based on distributions of the exposure measures and distributions of the number of involvements across these three age groups. Comparing distributions allows one to quickly see instances of over-representation or under-representation. For example, if an age cohort comprises a higher percentage of involvements than it does a measure of exposure, then that group is over-represented in involvements compared with persons of all ages.
Table 7-1 presents these distributions based on 1983 and 1990 data. Missing data have been excluded from this table and subsequent ones in this section. Comparing the fatal involvement distribution to the mileage distribution, one sees that in both 1983 and 1990 younger drivers had a much higher share of fatal involvements than of travel. Older drivers were also overinvolved, while drivers 25- 64 were underinvolved in fatal accidents compared to their share of the mileage.
Table 7-1 Age Distribution of Exposure and Involvement Categories
1983 and 1990
Dividing the share of involvements by the share of mileage yields a measure of relative risk for a group. For example, dividing the percentage of fatal involvements for the 16-24 group in 1983 by its percentage of travel yields 2.09 (Table 7-2). This indicates that persons this age had 2.09 times the risk of involvement in a fatal accident per mile of driving compared to all people in 1983. In 1990, the relative risk for this age group had dropped slightly, to 2.04. The relative risk of fatal involvement for persons 25-64 increased slightly from 1983 to 1990, going from 0.72 to 0.74, but this group remained underinvolved in fatal accidents compared to persons of all ages. The mileage-based relative risk of fatal accident involvement also increased for persons 65 and over, rising from 1.84 to 1.97. Therefore, while the 16-24 group had a higher relative risk of fatal involvements than the 65+ group in both 1983 and 1990, the difference between the two groups narrowed between the two yews. The relative risk for the younger group declined slightly, while the relative risk for the older group showed a small increase.
Percent Distribution of:
Total mileage Licensed drivers Driving-age population Fatal involvements Injury involvements All involvements
1 &24
1983 1990
16.71Y0 14.51Y0 19.08 15.63 20.65 17.28 34.92 29.57 34.49 31.26 33.80 31.28
25-64
1983 1990
78.43% 79.95% 70.50 71 -79 65.49 67.98 56.14 59.51 58.37 60.90 58.66 61.04
65+
1983 1990
4.87% 5.54% 10.42 12.58 13.86 14.75 8.94 10.92 7.1 4 7.84 7.54 7.68

1990 NPTS
Table 7-2 Relative Risk Based on Three Exposure Categories
1983 and 1990
For non-fatal involvements, comparisons of the distributions again show overinvolvement for younger drivers and, to a lesser extent, older drivers. However, the trends in relative risk observed between 1983 and 1990 in the fatal involvements do not hold for the non-fatal involvements. The overinvolvement of the 16-24 group became slightly more pronounced between 1983 and 1990, with their relative risk of involvement in all police-reported accidents per mile rising from 2.02 to 2.16 (Table 7-21. Older drivers experienced a drop in relative risk, with this measure falling from 1.55 to 1.39. The relative risk for persons 25-64 in all police-reported involvements remained stable between 1983 and 1990.
RELATIVE RlSK PER MILE
If the involvement distributions are compared to the distributions of licensed drivers or the driving-age population, younger persons continue to be overinvolved in accidents, although to a slightly lesser extent than if mileage is used as the basis of exposure. Persons 25-64 are underinvolved using drivers or population as the expo- sure basis, although not to the same extent as when mileage is used. The most dramatic change in switching from mileage to dnvers or population as the exposure basis is seen among drivers 65 and older. This group is overinvolved on a mileage basis, but underinvolved per driver and even more underinvolved per capita. Per capita, this group has a lower relative risk than either of the other two age groups of involvement in accidents a t any level of severity (Table 7-2). Per driver, the same is true for non-fatal accidents. For fatal accidents, however, this group has a slightly higher relative risk measure than the 25-64 group per driver. As discussed pre- viously, older people have a much lower risk per driver and per capita compared to
Involvement Severity
Fatal Injury All
1 6-24
1983 1990
2.09 2.04 2.06 2.15 2.02 2.16
RELATIVE RlSK PER DRIVER
25-64
1983 1990
0.72 0.74 0.74 0.76 0.75 0.76
Involvement Severity
Fatal Injury All
65+
1983 1990
1.84 1.97 1.47 1.42 1.55 1.39
1 6-24 . 1983 1990
1.83 1.89 1.81 2.00 1.77 2.00
RELATIVE RlSK PER CAPITA
2 5-64
1983 1990
0.80 0.83 0.83 0.85 0.83 0.85
Involvement Severity
Fatal Injury All
65+
1983 1990
0.86 0.87 0.69 0.62 0.72 0.61
16-24
1983 1990
1.69 1.71 1.67 1.81 1.64 1.81
25-64
1983 1990
0.86 0.88 0.89 0.90 0.90 0.90
65+
1983 1990
0.65 0.74 0.52 0.53 0.54 0.52

Summary by Age and Gender
their mileage-based risk because relatively few people this age drive at all, and those who do drive accumulate a small number of miles each year relative to younger people.
Table 7 4 Age Distribution of Exposure and Involvement Categories
1983 and 1990, Males Only
Table 7 4 Relative Risk Based on Three Exposure Categories
1983 and 1990, Males Only
Percent Distribution of:
Total mileage Licensed drivers Driving-age population Fatal involvements Injury involvements All involvements
Table 7-3 and 7-4 present the same set of distributions and the associated relative risk measures for men only, and Tables 7-5 and 7-6 do the same for women. Beginning with comparisons on a mileage basis, the same general patterns of overinvolvement for younger m d older dnvers hold true for men and women
1 6-24
1983 1990
16.02% 12.82% 19.37 15.1 9 21.53 17.36 35.53 30.40 34.87 32.21 34.56 31.96
RELATIVE RlSK PER MILE
25-64
1983 1990
79.01% 81.1 6% 69.82 72.22 66.75 69.53 55.80 59.27 57.55 59.25 57.43 60 .O 1
65+
1983 1990
1.74 1.72 1.52 1.42 1.61 1.34
Involvement Severity
Fatal Injury All
65t
1983 1990
4.98% 6.02% 10.81 12.59 11.73 13.1 1 8.67 10.33 7.58 8.54 8.01 8.04
1 6-24
1983 1990
2.22 2.37 2.1 8 2.51 2.16 2.49
RELATIVE RlSK PER DRIVER
25-64
1983 1990
0.71 0.73 0.73 0.73 0.73 0.74
65+
1983 1990
0.80 0.82 0.70 0.68 0.74 0.64
Involvement Severity
Fatal Injury All
16-24
1983 1990
1.83 2.00 1.80 2.12 1.78 2.10
RELATIVE RlSK PER CAPITA
25-64
1983 1990
0.80 0.82 0.82 0.82 0.82 0.83
6%
1983 1990
0.74 0.79 0.65 0.65 0.68 0.61
Involvement Severity
Fatal Injury All
1 6-24
1983 1990
1.65 1.75 1.62 1.86 1.61 1.84
2 5 4 4
1983 1990
0.84 0.85 0.86 0.85 0 86 0.86

1990 NPTS
separately. More interesting differences come from calculating measures of relative risk per mile in 1983 and 1990. For example, young male drivers showed an increase in their relative risk of involvement in accidents at all three levels of severity between the two years (Table 7-4). Male drivers 65 and older experienced a decrease in their relative risk of involvement at all levels of severity. The situation is exactly reversed among female drivers, however. Young women showed a decrease in relative risk and older women showed an increased relative risk of involvement in accidents at all severity levels between 1983 and 1990 (Table 7-6).
Table 7-5 Age Distribution of Exposure and Involvement Categories
1983 and 1990, Females Only
Table 7-6 Relative Risk Based on Three Exposure Categories
1983 and 1990, Females Only
Percent Distribution of:
Total mileage Licensed drivers Driving-age population Fatal involvements Injury involvements All involvements
16-24 - 1983 1990
18.1 3% 17.39O/0 18.78 16.07 19.85 17.20 33.07 27.39 33.88 29.99 32.48 30.31
RELATIVE RlSK PER MILE
Involvement Severity
Fatal Injury All
25-64
1983 1990
77.23% 77.89% 71.20 71.36 64.35 66.59 57.18 60.1 6 59.69 63.1 0 60.80 62.52
65+
1983 1990
4.64% 4.72% 10.01 12.57 15.80 16.21 9.75 12.45 6.43 6.91 6.71 7.17
4
65+
1983 1990
2.1 0 2.64 1.39 1.46 1.45 1.52
1 &24
1983 1990
1.82 1 58 1.87 172 1.79 1 74
RELATIVE RlSK PER DRIVER
2544
1 983 1990
0 74 0.77 0 77 0.81 0 79 0.80
Involvement Severity
Fatal Injury All
65+
1983 1990
0.97 0.99 0.64 0.55 0.67 0.57
16-24
1983 1990
1.76 1 70 1 .80 1 87 1.73 1.89
RELATIVE RlSK PER CAPITA
25-64
1 983 1990
0 80 0.84 0 84 0.88 0 85 0.88
Involvement Severity
Fatal lnlury All
65+
1983 1990
0.62 0.77 0.41 0.43 0.42 0.44
1 &24
1983 1990
1.67 1 59 1.71 1 74 1.64 1 i6
25-64
1 983 1990
0 89 0.90 0 93 0.95 0 94 0.94
Summary by Age and Gender
Between 1983 and 1990, young men also showed an increase in relative risk of involvement in accidents at all levels of severity on a per driver and per capita basis. Older men generally showed a slight decrease in relative risk per driver and per capita in non-fatal involvements and a slight increase in fatal involvements. Young women experienced a decrease in relative risk in fatal involvements and an increase in non-fatal involvements per driver and per capita between 1983 and 1990. Like older men, older women showed an increase in relative risk of fatal involvements per capita and per driver. They showed a decrease in relative risk in non-fatal involvements per driver but a slight increase per capita.
There are many ways to assess the risk of accident involvement associated with particular groups of people. This report has illustrated several of them. Regardless of whether miles driven, number of drivers, or number of people is used as the basis of comparison, persons age 16 to 24 are overinvolved in accidents of all levels of severity. Persons age 25 to 64 are underinvolved, using any of the three measures of exposure. People over the age of 64 have a higher risk of accident involvement, particularly fatal involvements, per mile driven, but are underinvolved in relation to their national share of licensed drivers or persons of driving age. Gender also needs to be part of risk assessments. Women 25 and over have a higher rate of involvement in non-fatal accidents per mile driven than do men, while men have higher fatal involvement rates than women. To really understand differences between groups in mileage-based rates requires travel data that are split by environmental conditions such as road class, rurdurban, and dayhight. For example, the NPTS data allow categorization of mileage by time of day, a surrogate for light condition. Analysis of the data in this way showed that women's higher rate of non-fatal involvements compared with men's was entirely due to their accident experience in the daytime, not at night.

1990 NPTS

References
American Automobile Association, Traffic Engineering and Safety Department. 1952. Aee and com~lex reaction time. Report No. 41.
American Automobile Association, Traffic Engineering and Safety Department. 1966. Reaction time as related to age. Report No. 69.
. . Burg, A. 1973. The effects of exposure to risk on d n v l n ~ record. Report No. UCLA-
ENG-7350. Los Angeles: Institute of Transportation and Traffic Engineering, University of California.
Chipman, M.L. 1982. The role of exposure experience and demerit point levels in the risk of collision. Accident Analvsis and Prevention 14(6):475-483.
Evans, L. 1988. Risk of fatality from physical trauma versus sex and age. Journal of Trauma 28(3):368-378.
Finn, P. and Bragg, B.W.E. 1986. Perception of the risk of an accident by young and older drivers. Accident Analvsis and Prevention 18(4):289-298.
Matthews, M.L. and Moran, A.R. 1986. Age differences in male drivers' perception of accident risk: the role of perceived driving ability. Accident Analvsis and Prevention 18(4):299-313.
Pike, J.A. 1989. The quantitative effect of age on injury outcome. 89-1A-W-020. 12th Experimental Safetv Vehicle Conference. Gothenbure. Sweden.
Polus, A., Hocherman, I., and Efrat, E. 1988. Evaluation of the accident rates of male and female drivers. m o r t a t i o n Research Record 1172, pp. 42-46.
Research Triangle Institute. 199 1, 1 Survey. User's G o Use Tape$. Report No. FHWA-PL-92-007. Washington, D.C.: Federal Highway Administration.
Sivak, M., Post, D.V., and Olson, P.L. 1981. Automobile rear lights: effects of the number, mounting height, and lateral position on reaction times of following drivers. Perceut- 52(320:795-802.
Spolander, K. 1983. Accident risks of drivers-a model tested on men and women. VTI RaDDort. No. 268. Linkoping, Sweden: Swedish Road and Traffic Research Institute.
Storie, V.J. 1977. M a l e e f e m a l e : differences observed in accidents. TRRL Laboratory Report 761. Crowthorne, Berkshire, U.K.: Transport and Road Research Laboratory.
Veevers, J. 1982. Women in the dnver's seat: trends in sex differences in driving and death. POD- Policv Review 1(2):171-182.
Welford, A.T. 1977. Motor performance. In 9, Birren, J.E. and Schaie, K.W. (eds. ), pp. 450-496. New York: Van Nostrand Reinhold.

1990 NPTS
Williams, A.F. and Carsten, 0. 1989. Driver age and crash involvement. American Journal of Public Health 79(3):326-327.
Wright, G.R. and Shephard, R.J. 1978. Brake reaction time-effects of age, sex, and carbon monoxide. Archives 33(3):141-150.

Appendix A: Tables

1990 NPTS

Appendix
Table A-1 Fatal lnvolvements Per 100 Million Miles
1990 FARS and 1990 NPTS
Table A-2 Injury Involvements Per Million Miles
1990 GES and 1990 NPTS
Fatal Rate
9.21 4.85 3.12 2.38 2.03 1.75 1.85 1.97 2.05 2.51 3.78 5.20
11.53 3.70
3.03
1 o8 VMT
686 1,614 2,243 2,386 2,204 1,982 1,343 1,031
828 656 41 5 264 198 127
15,978
Age Group
16-19 20-24 25-29 30-34 35-39 40-44 45-49 50-54 55-59 60-64 65-69 70-74 75t Unknown
Total
Fatal Involvements
6,'323 7,833 6,993 5,680 4,471 3,477 2,484 2,035 1,700 1,646 1,569 1,375 2,282
470
48,338
J
Injury Rate
6.75 3.30 2.12 1.58 1.41 1.29 1.35 1.27 1.28 1.58 2.36 2.61 4.17 6.33
2.04
1 o6 VMT
68,645 161,358 224,339 238,616 220,391 198,176 134,291 103,125 82,759 65,634 41,548 26,444 19,785 12,716
1,597,827
Age Group
1&19 20-24 25-29 30-34 35-39 40-44 45-49 50-54 55-59 60-64 65-69 70-74 75+ Unknown
Total
lnPJr~ Invotvements
463,161 532,610 474.677 3 76.235 310.994 255.979 181.482 130.809 105.886 103.609 98.239 69.048 82.534 80.460
3.265.723

1990 NPTS
Table A-3 All lnvolvements Per Million Miles
1990 GES and 1990 NPTS
Table A-4 Fatal lnvolvements Per Licensed Driver
1990 FARS and 1990 NPTS
Age Group
16-19 20-24 25-29 30-34 35-39 40-44 45-49 50-54 55-59 60-64 65-69 70-74 75+ Unknown
Total
All Involvements
1,381,167 1,544,449 1,364,020 1,125,846
943,359 741,992 542,010 382,009 322,140 288,684 272,373 204,255 242,045 363,130
9,717,478
Involvements per 100,000 Drivers
66.2 50.0 36.4 28.5 23.7 21 .O 19.8 19.7 18.1 18.5 19.6 23.7 35.3 26.0
29.7
Age Group
16-1 9 20-24 25-29 30-34 35-39 40-44 45-49 50-54 55-59 60-64 65-69 70-74 75+ Unknown
Total
1 o6 VMT
68,645 161,358 224,339 238,616 220,391 198,176 134,291 103,125 82,759 65,634 41,548 26,444 19,785 12,716
1,597,827
Overall Rate
20.12 9.57 6.08 4.72 4.28 3.74 4.04 3.70 3.89 4.40 6.56 7.72
12.23 28.56
6.08
Fatal Involvements
6,323 7.833 6.993 5.680 4,471 3,477 2,484 2,035 1,700 1,646 1.569 1,375 2,282
470
48,338
Licensed Drivers (Thousands)
9.546 15,658 19,190 19.901 18.889 16.587 12,547 10.334 9,408 8.877 8.022 5.800 6.459 1,807
163,025

Appendix
Table A-5 Fatal lnvolvements Per Capita
1990 FARS and 1990 NPTS
Table A-6 Llcensure Rate by Age
1990 NPTS
Involvements per 100,000 Population
45.6 44.2 34.0 26.8 22.4 19.9 18.7 18.1 16.3 16.3 16.5 19.2 22.2 20.3
26.1
Population (Thousands)
13,851 17,728 20,594 21,195 19,963 17,501 13,268 11,218 10,402 10,128 9,487 7,167
10,302 2,310
185,113
,
Age Group
16-19 20-24 25-29 30-34 35-39 40-44 45-49 50-54 55-59 60-64 65-69 70-74 75+ Unknown
Total
Fatal Involvements
6,323 7,833 6,993 5,680 4,471 3,477 2,484 2,035 1,700 1,646 1,569 1,375 2,282
470
48,338
Percent Licensed
68.92 88.32 93.18 93.90 94.62 94.78 94.57 92.12 90.44 87.65 84.56 80.93 62.70 78.23
88.07
Total Population
13,851,166 17,728,336 20,593,673 21,194,839 19,963,324 17,500,955 13,267,543 11,218,151 10,401,970 10,127,913 9,486,770 7,166,930
10,301,510 2,309,939
185,113,020
Age Group
16-19 20-24 25-29 30-34 35-39 40-44 45-49 50-54 55-59 60-64 65-69 70-74 75+ Unknown
Total
Licensed Drivers
9.546.089 15,657,637 19,189,586 19,901,092 18,088.768 16,587,494 12,546,911 10.334.032 9,407,873 8,877.378 8.021 .845 5.799.956 6,458,869 1.807.141
163.024.671

1990 NPTS
Table A-7 Average Annual Mileage Per License Holder
1990 NPTS
Table A-8 Injury Involvements Per Licensed Driver
1990 GES and 1990 NPTS
Age Group
16-19 20-24 25-29 30-34 35-39 40-44 45-49 50-54 55-59 60-64 65-69 70-74 75t Unknown
Total
Miles Driven
67,574,369,197 160,862,331,564 223,630,113,689 238,041,494,699 219,999,203,117 197,916,335,806 134,208,324,487 102,643,982,106 82,673,805,527 65,096,662,879 41,498,383,405 26,304,428,918 19,730,298,934 12,684,013,112
1,592,863,747,438
Age Group
16-19 20-24 25-29 30-34 35-39 40-44 45-49 50-54 55-59 60-64 65-69 70-74 75+ Unknown
Total
Licensed Drivers
9,546,089 15,657,637 19,189,586 19,901,092 18,888,768 16,587,494 12,546,911 10,334,032 9,407,873 8,877,378 8,021,845 5,799,956 6,458,869 1,807,141
163,024,671
Injury Involvements
463,161 532,610 474,677 376,235 31 0,994 255,979 181,482 130,809 105,886 103,609 98,239 69,048 82,534 80,460
3,265,723
Average Miles Driven
7,079 10,274 11,654 11,961 1 1,647 1 1,932 10,697 9,933 8,788 7,333 5,173 4,535 3,055 7,019
9,771
Licensed Drivers (Thousands)
9,546 15,658 19,190 19,901 18,889 16,587 12,547 10,334 9,408 8.871 8,022 5,800 6.459 1,807
163,025
involvements per 100,000 Drivers
4,852 3,402 2,474 1,891 1,646 1,543 1,446 1,266 1,126 1,167 1,225 1,190 1,278 4,452
2,003

Appendix
Table A-9 Injury lnvolvements Per Capita
1990 GES and 1990 NPTS
Table A-10 All lnvolvements Per Llcensed Driver
1990 GES and 1990 NPTS
Age Group
1 6 1 9 20-24 25-29 30-34 35-39 40-44 45-49 50-54 55-59 60-64 65-69 70-74 75t Unknown
Total
Injury Involvements
463,161 532,610 474,677 376,235 31 0,994 255,979 181,482 130,809 105,886 103,609 98,239 69,048 82,534 80,460
3,265,723
Age Group
16-19 20-24 25-29 30-34 35-39 40-44 45-49 50-54 55-59 60-64 65-69 70-74 75+ Unknown
Total
Population (Thousands)
13,851 17,728 20,594 21,195 19,963 17,501 13,268 11,218 10,402 10,128 9,487 7,167
10,302 2,310
185,113
All Involvements
1,381,167 1 ,544.449 1,364.020 1,125,846
943.359 741.992 542.010 382.009 322.140 288.684 272.373 204.255 242.045 363.130
9,717.478
Involvements per 100,000 Population
3,344 3,004 2,305 1,775 1,558 1,463 1,368 1,166 1,018 1,023 1,036
963 801
3,483
1,764
Licensed Drivers (Thousands)
9,546 15,658 19,190 19,901 18,889 16,587 12,547 10,334 9,408 8,877 8,022 5,800 6,459 1,807
163,025
1
involvements per 100,000 Drivers
14,468 9,864 7,108 5,657 4,994 4,473 4,320 3,697 3,424 3,252 3,395 3,522 3,747
20,094
5,961

1990 NPTS
Table A-1 1 All lnvolvements Per Capita 1990 GES and 1990 NPTS
Table A-1 2 Fatal lnvolvements Per 100 Million Miles Males vs. Females, 1990 FARS and NPTS
. Age Group
1 6-1 9 20-24 25-29 30-34 35-39 40-44 45-49 50-54 55-59 60-64 65-69 70-74 75+ Unknown
Total
All Involvements
1,381,167 1,544,449 1,364,020 1 ,I 25,846 943,359 741,992 542,010 382,009 322,140 288,684 272,373 204,255 242,045 363,130
9,717,478
Age Group
1&19 20-24 25-29 30-34 35-39 40-44 45-49 50-54 55-59 60-64 65-69 70-74 75+ Unknown
Total
Population (Thousands)
13,851 17,728 20,594 21,195 19,963 17,501 13,268 11,218 10,402 10,128 9,487 7,167 10,302 2,310
185,113
Involvements per 100,000 Population
9,971 8,712 6,623 5,312 4,725 4,240 4,085 3,405 3,097 2,850 2,871 2,850 2,350 15,720
5,249
Males Females
Fatal Invohementr
4,620 5,913 5,183 4,141 3,213 2,406 1,769 1,435 1,226 1.163 1,092 904
1,585 159
34,809
Fatal Rate
5.87 2.63 2.22 1.67 1.48 1.47 1.67 1.75 1.75 2.40 3.79 5.05 12.19 0.30
2.24
10' VMT
397 885
1 427 1 ,462 1,352 1.255 915 688 558 455 290 171 141 72
10 066
Fatal Involvements
1,703 1,916 1,810 1.539 1.258 1.071 71 5 600 473 483 477 47 1 697 16
13.229
Fatal Rate
1165 668 3 63 2 83 2 38 1 92 1 93 209 2 20 2 56 3 77 5 28
1 1 27 2 21
3 46
1 o8 VMT
290 728 81 7 924 852 727 428 344 270 20 1 126 93 57 54
5,911

Appendix
Table A-13 lnjury lnvolvements Per Million Miles
Males vs. Females, 1990 GES and NPTS
Table A-14 All lnvolvements Per Million Miles
Males vs. Females, 1990 GES and NPTS
Age Group
16-19 20-24 25-29 30-34 35-39 40-44 45-49 50-54 55-59 60-64 65-69 70-74 75+ Unknown
Total
Age Group
16-1 9 20-24 25-29 30-34 35-39 40-44 45-49 50-54 55-59 60-64 65-69 70-74 75+ Unknown
Total
Males
Injury lnvolvements
265,100 323,205 272,051 209,306 1 75,404 131,406 97,488 73,452 58,101 64,933 62,695 39,358 53,977 34,827
1,861,304
Females
Injury Involvements
198,033 209,291 202,499 166,814 135,474 124,572 83,994 57,241 47,756 38,675 35,544 29,690 28,556 14,148
Males
'
l o6 VMT
39,652 88,520
142,667 146,204 135,205 125,482 91,518 68,773 55,762 45,495 28,956 17,113 14,068 7,185
1,006,599
Females
Injury Rate
6.69 3.65 1.91 1.43 1.30 1.05 1.07 1.07 1.04 1.43 2.17 2.30 3.84 4.85
1.85
lo6 VMT
28,993 72,837 81,673 92,412 85,186 72,694 42,773 34,351 26,996 20,140 12,592 9,331 5,718 5,411 --
Overall Rate
20.85 10.63 5.75 4 45 399 3 28 3.34 3.31 3 41 3.87 5 91 7 17
10.73 18.47
5.63
All involvements
553,967 602,812 543,268 474,055 402,438 330,753 236,634 154,532 131,939 112,414 100,974 81,602 91,148 49,454
3,865,992
All involvements
826.933 941.102 819,866 650,812 539,392 411,125 305,375 227,362 190,041 175,991 171,096 1 22,653 150,897 132,696
5.665.342
l nju ry Rate
6.83 2.87 2.48 1.81 1.59 1.71 1.96 1.67 1.77 1.92 2.82 3.18 4.99 2.61
1,372,290 591,107
106VMT
39.652 88.520
142.667 146.204 135.205 125.482 91.518 68.m 55.762 45.495 28,956 17,113 14.068 7.185
1.006.599
2.32
l o 6 VMT
28,993 72,837 81,673 92,412 85,186 72,694 42,773 34,351 26,996 20,140 12,592 9,331 5,718 5,411
591,107
Overall Rate
19.11 8.28 6.65 5.13 4.72 4.55 5.53 4.50 4.89 5.58 8.02 8.75
15.94 9.14
6.54

1990 NPTS
Table A-1 5 Miles Driven by Age and Gender
1990 NPTS
Table A-1 6 Licensure Rate and Average Annual Mileage Per License Holder
1990 NPTS
Age Group
16-19 20-24 25-29 30-34 35-39 40-44 45-49 50-54 55-59 60-64 65-69 70-74 75+ Unknown
Total
Female Mileage as Percent of Male Mileage
73.12 82.28 57.25 63.21 63.00 57.93 46.74 49.95 48.41 44.27 43.49 54.53 40.64 75.31
58.72
Male Mileage
39,651,955,257 88,520,392,832
142,666,525,333 146,204,400,480 135,204,917,858 125,482,318,033 91,517,630,800 68,773,138,164 55,762,195,309 45,494,546,247 28,955,737,379 17,113,054,420 14,067,719,979 7,184,575,367
1,006,599,107,458
Age Group
16-19 20-24 25-29 30-34 35-39 40-44 45-49 50-54 55-59 60-64 65-69 70-74 75+ Unknown
Total
Female Mileage
28,993,166,118 72,837,351,090 81,672,567,186 92,412,063,037 85,185,583,849 72,693,749,497 42,773,173,252 34,351,434,161 26,996,494,294 20,139,654,609 12,592,016,606 9,331,107,863 5,717,587,954 5,410,646,038
591,106,595,552
Females
Percent Licensed
69.0% 86.7 92.0 92.4 93.8 93.3 92.1 88.3 85.7 80.7 77.5 73.5 50.4 75.3
84.5%
Males
Average Miles Driven
5,838 8,855 8,470 8,986 8,857 8,665 6,858 6,692 5,809 4,440 3,089 3,037 1,811 4,766
7,116
Percent Licensed
68 .gO/o 90.2 94.4 95.6 95.5 96.3 97.1 96.3 95.6 95.8 93.3 91.2 81.5 87.8
92.1%
Average Miles Driven
8.394 11.831 14,822 15.125 14,530 15.260 14.478 13,130 1 1.679 10.206 7.308 6.203 4.231
11,110
12.508
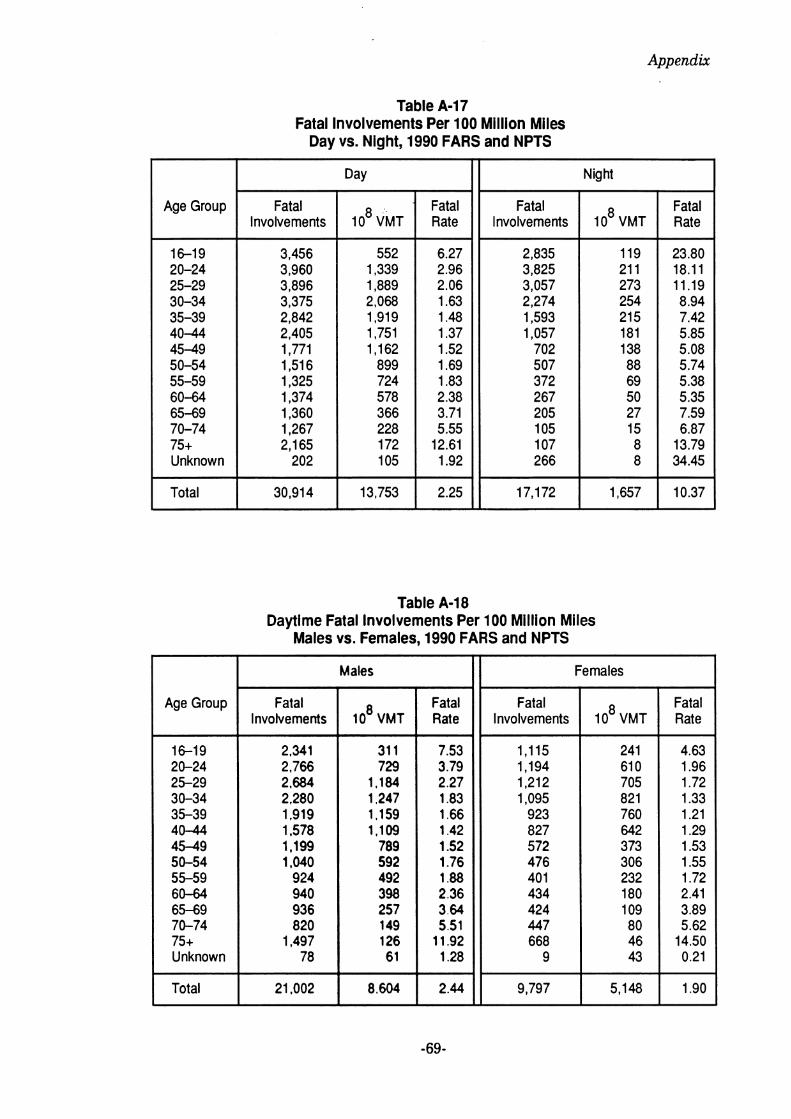
Appendix
Table A-17 Fatal lnvolvements Per 100 Million Miles
Day vs. Night, 1990 FARS and NPTS
Table A-1 8 Daytime Fatal lnvolvements Per 100 Milllon Miles
Males vs. Females, 1990 FARS and NPTS
Age Group
r
16-19 20-24 25-29 30-34 35-39 40-44 45-49 50-54 55-59 60-64 65-69 70-74 75+ Unknown
Total
Day
r
Age Group
16-1 9 20-24 25-29 30-34 35-39 40-44 45-49 50-54 55-59 60-64 65-69 70-74 75t Unknown
Total
Fatal Involvements
3,456 3,960 3,896 3,375 2,842 2,405 1,771 1,516 1,325 1,374 1,360 1,267 2,165
202
30,914
Night
Females
Fatal Involvements
2,835 3,825 3,057 2,274 1,593 1,057
702 507 372 267 205 105 107 266
Males
Fatal Involvements
1,115 1,194 1,212 1,095
923 827 572 476 40 1 434 424 447 668
9
9,797
1 o8 VMT
552 1,339 1,889 2,068 1,919 1,751 1,162
899 724 578 366 228 172 105
13,753
Fatal Rate
6.27 2.96 2.06 1.63 1.48 1.37 1.52 1.69 1.83 2.38 3.71 5.55
12.61 1.92
2.25
1 o8 VMT
119 21 1 273 254 21 5 181 138 88 69 50 27 15 8 8 --
Fatal Rate
7.53 3.79 2.27 1.83 1.66 1.42 1.52 1.76 1.88 2.36 3.64 5.51
11.92 1.28
2.44
lo8 VMT
241 61 0 705 821 760 642 373 306 232 180 109 80 46 43
5,148
Fatal Involvements
2,341 2,766 2,684 2,280 1,919 1,578 1,199 1,040
924 940 936 820
1,497 78
21,002
Fatal Rate
23.80 18.11 11.19 8 -94 7.42 5.85 5.08 5.74 5.38 5.35 7.59 6.87
13.79 34.45
17,172 1,657
Fatal Rate
4.63 1.96 1.72 1.33 1.21 1.29 1.53 1.55 1.72 2.41 3.89 5.62
14.50 0.21
1.90
lo8 VMT
31 1 729
1,184 1,247 1,159 1,109
789 592 492 398 257 149 126 6 1
8.604
10.37
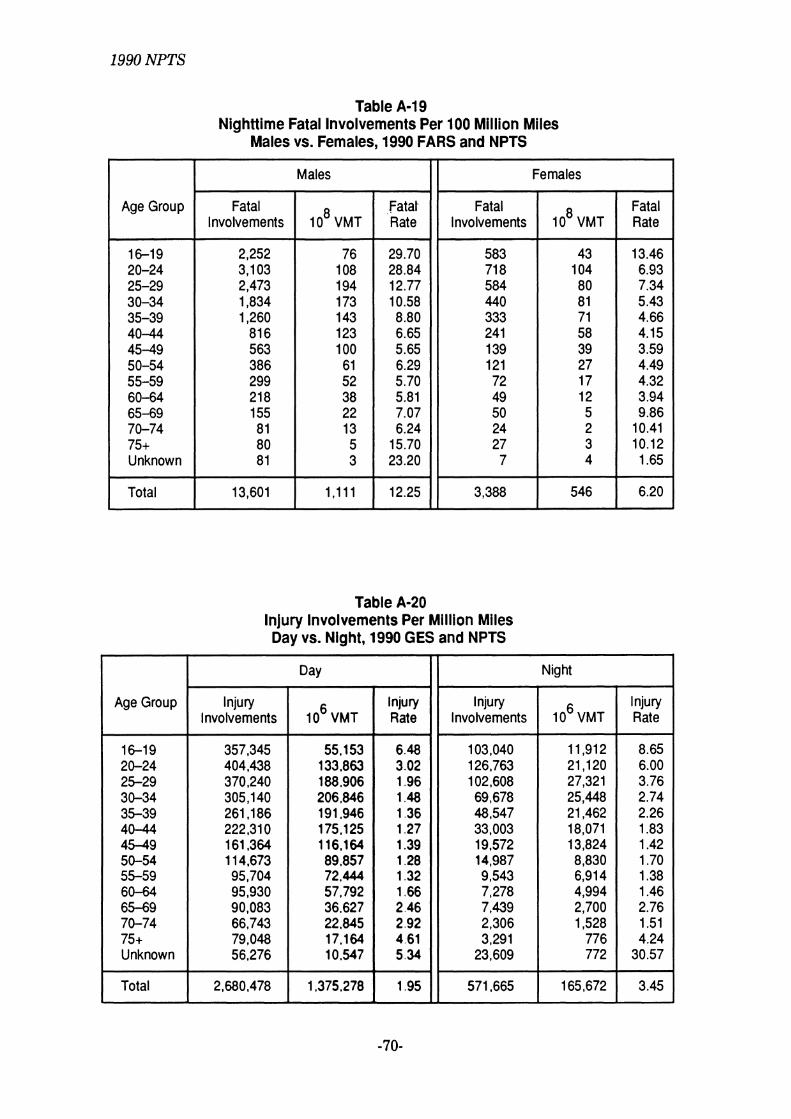
1990 NPTS
Table A-1 9 Nighttime Fatal Involvements Per 100 Million Miles
Males vs. Females, 1990 FARS and NPTS
Table A-20 lnjury lnvolvements Per Million Miles Day vs. Night, 1990 GES and NPTS
Age Group
16-19 20-24 25-29 30-34 35-39 40-44 45-49 50-54 55-59 60-64 65-69 70-74 75t Unknown
Total
Females
Age Group
16-19 20-24 25-29 30-34 35-39 40-44 45-49 50-54 55-59 60-64 65-69 70-74 75t Unknown
Total
Males
Fatal Involvements
2,252 3,103 2,473 1,834 1,260
81 6 563 386 299 21 8 155 81 80 8 1
13,601
Fatal Rate
13.46 6.93 7.34 5.43 4.66 4.15 3.59 4.49 4.32 3.94 9.86
10.41 10.12 1.65
6.20
Fatal Involvements
583 71 8 584 440 333 241 139 121 72 49 50 24 27 7
3,388
l o 8 VMT
43 104 80 81 7 1 58 39 27 17 12 5 2 3 4
546
Day
1 o8 VMT
76 108 194 173 1 43 123 100 6 1 52 38 22 13 5 3
1,111
Night
Injury Involvements
357,345 404,438 370,240 305,140 261,186 222,310 161,364 11 4,673 95,704 95,930 90,083 66,743 79,048 56,276
2,680,478
Fatat Rate
29.70 28.84 12.77 10.58 8.80 6.65 5.65 6.29 5.70 5.81 7.07 6.24
15.70 23.20
12.25
Injury Involvements
1 03,040 126,763 102,608 69,678 48,547 33,003 19,572 14,987 9,543 7,278 7,439 2,306 3,291
23,609
571,665
l o 6 VMT
55,153 133.863 188,906 206,846 191.946 175,125 116,164 89,857 72,444 57,792 36.627 22.845 17.164 10.547
1,375.278
1 o6 VMT
11,912 21,120 27,321 25,448 21,462 18,071 13,824 8,830 6,914 4,994 2,700 1,528
776 772
165,672
Injury Rate
6.48 3.02 1.96 1.48 1.36 1.27 1.39 1.28 1.32 1.66 2 46 2.92 4 61 5.34
1.95
Injury Rate
8.65 6.00 3.76 2.74 2.26 1.83 1.42 1.70 1.38 1.46 2.76 1.51 4.24
30.57
3.45

Appendix
Table A-21 Daytime lnjury Involvements Per Million Miles
Males vs. Females, 1990 GES and NPTS
Table A-22 Nighttime lnjury Involvements Per Million Miles
Males vs. Females, 1990 GES and NPTS
Age Group
1619 20-24 25-29 30-34 35-39 40-44 45-49 50-54 55-59 60-64 65-69 70-74 75+ Unknown
Total -
Females
Injury Involvements
160,736 175,821 172,701 1 45,675 120,397 113,280 77,799 51,681 44,779 37,711 33,490 29,265 27,475 12,122
1,202,935
Males
Age Group
16-19 20-24 25-29 30-34 35-39 40-44 45-49 50-54 55-59 60-64 65-69 70-74 75+ Unknown
Total
Females
1 o6 VMT
24,068 60,958 70,494 82,099 76,038 64,208 37,270 30,611 23,248 18,006 10,901 7,954 4,607 4,312
514,774
Injury Rate
6.32 3.13 1.67 1.28 1.21 0.98 1.06 1.06 1.03 1.46 2.20 2.52 4.11 4.01
1.69
Injury Involvements
196,580 228,503 197,532 1 59,465 140,788 109,031 83,564 62,875 50,896 58,218 56,592 37,478 51,573 24,510
1,457,606
Injury Involvements
36,182 33,311 28,866 20,568 14,658 11,013 5,917 5,123 2,642 921
1,461 425
1,071 1,883
164,041
Males
Injury Rate
6.68 2.88 2.45 1.77 1.58 1.76 2.09 1.69 1.93 2.09 3.07 3.68 5.96 2.81
2.34
'
lo6 VMT
31,085 72,904 118,412 124,746 115,907 110,917 78,894 59,246 49,196 39,786 25,726 14,891 12,557 6,114
860,382
Injury lnvolvemenls
66,858 93,452 73,623 48,995 33,773 21,991 13,655 9,864 6,901 6,357 5,979 1,880 2.219 10,031
395,578
lo6 VMT
4,330 10,362 7,961 8,110 7,144 5,808 3,867 2,693 1,668 1,242 507 230 267 423
54,614
Injury Rate
8.36 3.21 3.63 2.54 2.05 1.90 1.53 1.90 1.58 0.74 2.88 1.85 4.02 4.45
3.00
1 o6 VMT
7.582 10.758 19,360 17.338 14.318 12,263 9,956 6.136 5.246 3,752 2.193 1.298 509 349
111,058
1 n b r ~ Rate
8.82 8.69 3.80 2.83 2.36 1.79 1.37 161 132 1.69 273 1 45 4.36 28 73
3.56

1990 NPTS
Table A-23 All lnvolvements Per Million Miles Day vs. Night, 1990 GES and NPTS
Table A-24 All Daytime lnvolvements Per Million Miles
Males vs. Females, 1990 GES and NPTS
Age Group
16-1 9 20-24 25-29 30-34 35-39 40-44 45-49 50-54 55-59 60-64 65-69 70-74 75+ Unknown
Total
Age Group
1619 20-24 25-29 30-34 35-39 40-44 45-49 50-54 55-59 60-64 65-69 70-74 75+ Unknown
Total
Day Night
All Involvements
1,095,131 1,213,956 1,112,666 946,676 81 6,843 648,657 480,044 342,630 295,479 268,977 255,713 196,970 233,917 244,046
8,151,704
Males
Overall Rate
23.28 15.31 8.94 6.89 5.73 4.98 4.31 4.22 3.65 3.78 5.82 4.58 10.10 139.23
9.13
1 o6 VMT
55,153 133,863 188,906 206,846 191,946 175,125 116,164 89,857 72,444 57,792 36,627 22,845 17,164 10.547
1,375,278
All Involvements
277,278 323,375 244,246 175,216 123,074 90,025 59,603 37,240 25,226 18,903 15,703 6,995 7,840
107,513
All Involvements
635,090 702.698 635,467 521,202 450,783 349.258 264,767 1 99,500 170,880 1 59.768 158,644 1 16,795 145.221 96,361
4.606.433
Females
OveraH Rate
19.86 9.07 5.89 4.58 4.26 3.70 4.13 3.81 4.08 4.65 6.98 8.62 13.63 23.14
5.93
1 o6 VMT
11,912 21,120 27,321 25,448 21,462 18,071 13,824 8,830 6,914 4,994 2,700 1,528 776 772 --
All Involvements
459,775 510,723 476,595 424,611 365,198 299,286 21 5,277 143,013 1 24,440 108,931 96,767 80,175 88.696 40,701
1,512,239 1 65,672
1 o6 VMT
31085 72 904 118 412 124 746 115907 110.917 78.894 59 246 49 1% 39 786 25 726 14 891 12557 6114
8 W 382
Overall Rate
2043 9 64 5 37 4 18 3 89 3 15 336 3 37 3 47 4 02 6 17 784 1156 1576
5 35
1 o6 VMT
24,068 60,958 70,494 82,099 76,038 64,208 37,270 30,611 23,248 18,006 10,901 7,954 4,607 4,312 --
Overall Rate
19.10 8.38 6.76 5.17 4.80 4.66 5.78 4.67 5.35 6.05 8.88 10.08 19.25 9.44
3,434,187 514,774 6.67

Appendix
Table A-25 All Nighttime Involvements Per Million Miles
Males vs. Females, 1990 GES and NPTS
Table A-26 Mlles Drlven by Age Group 1983 NPTS and 1990 NPTS
Age Group
16-19 20-24 25-29 30-34 35-39 40-44 45-49 50-54 55-59 60-64 65-69 70-74 75+ Unknown
Total
Age Group
1 6 1 9 20-24 25-29 30-34 35-39 40-44 45-49 50-54 55-59 60-64 65-69 70-74 75+ Unknown
Total
Males
All Involvements
186,594 233,263 179,398 126,515 86,471 60,105 39,754 26,466 18,185 15,463 12,328 5,858 5,398
35,219
1,031,017
Females
1983 M~bage (Mdltons)
49.450 140,245 160.267 174.309 143.138 118.327 79.386 n.9~ 75.771 61.401 29.372 15,497 10.406
0
1.135.536
All Involvements
90,683 90,112 64,566 48,587 35,936 29,920 19,849 10,775 7,041 3,440 3,375 1,136 2,442 7,918
41 5,780
l o 6 VMT
7,582 10,758 19,360 17,338 14,318 12,263 9,956 6,136 5,246 3,752 2,193 1,298
509 349
111,058
1990 Mileage (Millions)
68,645 161,358 224,339 238,616 220,391 198,176 134,291 103,125 82,759 65,634 41,548 26,444 19,785 12,716
1,597,827
Overall Rate
24.61 21.68 9.27 7.30 6.04 4.90 3.99 4.31 3.47 4.12 5.62 4.51
10.60 100.85
9.28
l o6 VMT
4,330 10,362 7,961 8,110 7,144 5,808 3,867 2,693 1,668 1,242
507 230 267 423
54,614
Percent Increase 1983 to 1990
38.82 15.05 39.98 36.89 53.97 67.48 69.16 32-27 9.22 6.89
41.45 70.64 90.13 -
40.71
Overall Rate
20.94 8.70 8.1 1 5.99 5.03 5.15 5.13 4.00 4.22 2.77 6.65 4.93 9.16
18.72
7.61

1990 NPTS
Table A-27 Miles Driven by Age Group, Males Only
1983 NPTS and 1990 NPTS
Table A-28 Miles Driven by Age Group, Females Only
1983 NPTS and 1990 NPTS
Age Group
16-1 9 20-24 25-29 30-34 35-39 40-44 45-49 50-54 55-59 60-64 65-69 70-74 75+ Unknown
Total
1983 Mileage (Millions)
31,269 91,347 106,367 1 17,943 89,914 82,010 53,314 54,104 57,230 43,948 21,498 9,075 7,517
0
765,536
Age Group
16-19 20-24 25-29 30-34 35-39 40-44 4549 50-54 55-59 60-64 65-69 70-74 75t Unknown
Total
1990 Mileage (Millions)
39,652 88,520 142,667 146,204 135,205 125,482 91,518 68,773 55,762 45,495 28,956 17,113 14,068 7,185
1,006,599
1983 Mileage (Millions)
18,181 48,898 53,900 56,366 53,224 36,317 26,072 23.863 18,541 17,453 7,874 6,422 2,889
0
370,000
Percent Change 1983 to 1990
26.81 -3.09 34.13 23.96 50.37 53.01 71.66 27.1 1 -2.56 3.52 34.69 88.57 87.14 -
31.49
1990 Mileage (Millions)
28,993 72,837 81,673 92,412 85.186 72,694 42,773 34.351 26,996 20,140 12,592 9.331 5.718 5,411
591,107
Percent Increase 1983 to 1990
59.47 48.96 51.52 63.95 60.05 100.17 64.06 43.95 45.60 15.39 59.92 45.30 97.91 -
59.76

Appendix
Table A-29 Licensure Rate and Average Annual Mileage Per License Holder
1983 NPTS and 1990 NPTS
Table A-30 Percentage of Overall Travel by Age Group
1983 NPTS and 1990 NPTS
Age Group
16-19 20-24 25-29 30-34 35-39 40-44 45-49 50-54 55-59 60-64 65-69 70-74 75+ Unknown
Total
Age Group
16-1 9 20-24 25-29 30-34 35-39 40-44 45-49 50-54 55-59 60-64 65-69 70-74 75t Unknown
Total
1983
Percent Licensed
62.2% 84.7 88.6 89.3 90.4 88.9 87.9 84.1 84.8 84.0 74.6 67.5 44.7 -
8 1.4%
1990
Percent of 1983 Mileage
4.35 12.35 14.11 15.35 12.61 10.42 6.99 6.87 6.67 5 41 2.59 1.36 0.92 0.00
100.00
Average Miles Driven
5,199 7,865 9,211 9,679 9,830 9,988 8,115 8,336 7,122 6,518 4,600 3,590 2,464 -
7,925
Percent Licensed
68.9% 88.3 93.2 93.9 94.6 94.8 94.6 92.1 90.4 87.7 84.6 80.9 62.7 78.2
88.1%
Percent of 1990 Mileage
4.30 10.10 14.04 14.93 13.79 12.40 8.40 6.45 5.18 4.1 1 2.60 1.66 1.24 0.80
100.00
Average Miles Driven
7,079 10,274 1 1,654 11,961 1 1,647 11,932 10,697 9,933 8,788 7,333 5,173 4,535 3,055 7,019
9,771

1990 NPTS
Table A-31 Fatal lnvolvements Per 100 Million Miles
1983 FARS and 1983 NPTS
Table A-32 Fatal lnvolvements Per 100 Million Miles Males vs. Females, 1983 FARS and NPTS
Age Group
16-1 9 20-24 25-29 30-34 35-39 40-44 45-49 50-54 55-59 60-64 65-69 70-74 75+ Unknown
Total
Fatal Involvements
6,211 8,775 6,339 4,673 3,573 251 7 1,950 1,826 1,722 1,492 1,275 1,018 1,543
360
43,274
Age Group
16-1 9 20-24 25-29 30-34 35-39 40-44 45-49 50-54 55-59 60-64 65-69 70-74 75+ Unknown
Total
1 o8 VMT
495 1,402 1,603 1,743 1,431 1,183
794 780 758 61 4 294 155 104
0
11,355
Fatal Rate
12.56 6.26 3.96 2.68 2.50 2.13 2.46 2.34 2.27 2.43 4.34 6.57
14.83 -
3.81
Males
Fatal Involvements ----
4,664 6,813 4,921 3,546 2,658 1,793 1,439 1,353 1,247 1,069
909 754
1,139 113
32,418
>
Females
Fatal Involvements
1,547 1,961 1,418 1,127
91 5 724 51 1 473 475 423 366 264 404
14
10,622
1 o8 VMT
313 913
1,064 1,179
899 820 533 54 1 572 439 21 5 91 75 0
7,655
l o 8 VMT
182 489 539 564 532 363 261 239 185 175 79 64 29
0
3,700
Fatal Rate
14.92 7.46 4.63 3.01 2.96 2.19 2.70 2.50 2.18 2.43 4.23 8.31
15.15 -
4.23
Fatal Rate
8.51 4.01 2.63 2.00 1.72 1.99 1.96 1.98 2.56 2.42 4.65 4.1 1
13.98 -
2.87

Appendix
Table A-33 lnjury lnvolvements Per Million Miles
Males vs. Females, 198244 NASS and 1983 NPTS
Table A-34 All lnvolvements Per Mlllion Miles
Males vs. Females, 1982-84 NASS and 1983 NPTS
Age Group
16-19 20-24 25-29 30-34 35-39 40-44 45-49 50-54 55-59 60-64 65-69 70-74 75t Unknown
Total
Females Males
Injury Involvements
21 7,275 228,889 199,783 153,111 131,038 92,423 69,073 54,492 44,876 41,365 35,784 29,035 19,899 4,332
1,321,374
Age Group
16-1 9 20-24 25-29 30-34 35-39 40-44 45-49 50-54 55-59 60-64 65-69 70-74 75+ Unknown
Total
Females
Injury Rate
10.46 4.62 3.10 2.08 1.92 1.46 1.84 1.71 1.88 1.61 2.38 5.58 8.09 -
2.84
Injury Involvements
327,070 421,703 329,477 244,943 173,043 119,773 97,913 92,517 107,434 70,724 51,228 50,648 60,800 25,516
2,172,790
lo6 VMT
18,181 48,898 53,900 56,366 53,224 36,317 26,072 23,863 18,541 17,453 7,874 6,422 2,889
0
370,000
All Involvements
461,659 549,917 475,601 379,732 288,170 21 6,523 167,161 134,493 113,550 118,191 82,103 57,776 69,103 41,945
3,155,924
Males
1 o6 VMT
31,269 91,347 106,367 117,943 89,914 82,010 53,314 54,104 57,230 43,948 21,498 9,075 7,517
0
765.536
Injury Rate
11.95 4.68 3.71 2.72 2.46 2.54 2.65 2.28 2.42 2.37 4.54 4.52 6.89 -
3.57
All Involvements
827,821 1,042,849 819,944 579,981 481,362 308,294 253,215 219,945 241,793 204,222 169,632 126,692 137,493 1 1 0,373
5,523,614
lo6 VMT
18,181 48,898 53,900 56,366 53,224 36,317 26,072 23,863 18,541 17,453 7,874 6,422 2,889
0
370,000
Overall Rate
25.39 11.25 8.82 6.74 5.41 5.96 6.41 5.64 6.12 6.77 10.43 9.00 23.92 -
8.53
1 o6 VMT
31.269 91.347 106.367 1 17.943 89.914 82.010 53.314 54.1 04 57.230 43.948 21.498 9.075 7,517
0
765.536
Overall Rate
26.47 1142 7.71 4.92 5.35 3.76 4.75 4.07 4 22 465 7 89 13 % 1829 -
7.22

1990 NPTS