Analysis and Significance of HBCD and TBBP-A · 2011-07-26 · stereoisomers & lack of isomer...
29
Analysis and Significance of HBCD and TBBP-A Colin Allchin & Philippe Bersuder Cefas Burnham Laboratory
Transcript of Analysis and Significance of HBCD and TBBP-A · 2011-07-26 · stereoisomers & lack of isomer...

Analysis and Significance of HBCD and TBBP-A
Colin Allchin & Philippe BersuderCefas Burnham Laboratory
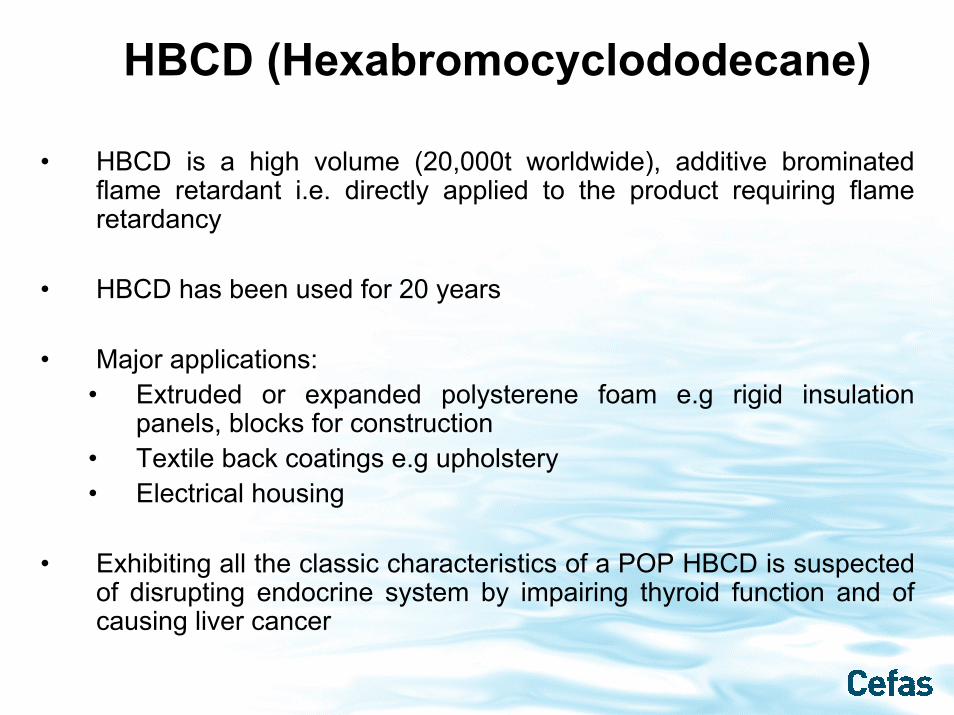
HBCD (Hexabromocyclododecane)
• HBCD is a high volume (20,000t worldwide), additive brominated flame retardant i.e. directly applied to the product requiring flame retardancy
• HBCD has been used for 20 years
• Major applications:• Extruded or expanded polysterene foam e.g rigid insulation
panels, blocks for construction• Textile back coatings e.g upholstery• Electrical housing
• Exhibiting all the classic characteristics of a POP HBCD is suspected of disrupting endocrine system by impairing thyroid function and of causing liver cancer

Complex stereochemistry
• HBCD is a technical mixture containing 16 possible stereoisomers, 6 pairs of enantiomers and 4 meso forms. (See Heeb et al Chemosphere 61 (2005) 65-73).
• For practical reasons we need only be concerned with the three dominant HBCD diasteromeric pairs (racemic mixtures) designated as α-, β- and χ-HBCD.

Composition of technical HBCD*
0.3%ε (meso)3/4/9/10b
3/4/9/10b
8a/b
7a/b
6a/b
Structure
δ (meso)
χ (racemic)
β(racemic)
α(racemic)
Designation
0.5%
70.35 - 81.6 %
5.8 – 12.83 %
11.8 – 16.20 %
Proportion in tech mixture
* After Heeb et al

The chemical structure of α-, β- and γ-HBCD diastereoisomers
α- HBCD β-HBCD γ-HBCD
Molecular Weight = 641.6

Common BFR structures

Analytical method development
• Inherent problems associated with traditional techniques (GC) used to quantify persistent organic compounds i.e. thermal rearrangements and decomposition of stereoisomers & lack of isomer resolution
• Use of LC-MS circumvents these problems

Isotopic distribution for Bromine (Br)Br 20/09/2004 17:59:59
Br1SimulationBrProfileResolution:
Daltons 0.25at 5% height
Charges 1Chrg dist 0Ions 2Min Ion Ab. 1e-020Min Ions 5000Max Ions. 20000
77.0 77.5 78.0 78.5 79.0 79.5 80.0 80.5 81.0 81.5 82.0 82.5m/z
0.00
0.05
0.10
0.15
0.20
0.25
0.30
0.35
0.40
0.45
0.50
Abun
danc
e
78.9280.91

Isotopic distribution for HBCD anion [M-H]
C12H17Br6 16/04/2003 11:08:26 C12 H17 Br6
SimulationC12H17Br6ProfileResolution:
Daltons 0.25at half height
Charges 1Chrg dist 0Ions 517Min Ion Ab. 1e-020Min Ions 5000Max Ions. 20000
633 634 635 636 637 638 639 640 641 642 643 644 645 646 647 648 649m/z
0.00
0.02
0.04
0.06
0.08
0.10
0.12
0.14
0.16
0.18
0.20
0.22
0.24
0.26
Abun
danc
e
640.63
638.63642.63
636.63644.62
641.63639.63 643.63
634.64 646.62637.64 645.63635.64 647.63 648.63 649.63

Ion Trap MS Detector parameters optimisation
Figure 5. Effect of Ion Transfer Capillary Temperature on HBCD ion abundance
5.00E+08
1.00E+09
1.50E+09
2.00E+09
2.50E+09
3.00E+09
3.50E+09
4.00E+09
120 140 160 180 200 220 240 260
Ion Transfer Capillary Temperature (in °C)
Rela
tive
ion
abun
danc
e(T
IC)
5.00E+06
1.00E+07
1.50E+07
2.00E+07
2.50E+07
3.00E+07
Rela
tive
ion
abun
danc
e(m
/z 6
40.7
Da)
TIC
m/z 640.7

Figure 2. Effects of mobile phase modifiers on HBCD parent ion [M-H]-
(m/z 640.7) intensity
0.00E+00
5.00E+06
1.00E+07
1.50E+07
2.00E+07
2.50E+07
3.00E+07
3.50E+07
ACN:H2O
ACN:FA
ACN:AA
ACN:AH
MeOH:H
2OMeO
H:FAMeO
H:AA
MeOH:A
H
Modifiers combinations
Rel
ativ
e io
n ab
unda
nc
m/z 640.7
Ion trap MS Detector parameters optimisation
Key: ACN: acetonitrile; FA: formic acid; AA: Ammonium acetate; AH: Ammonium hydroxide; MeOH: Methanol

γ-HBCD DIMERIC ADDUCT ION SPECTRA
1342.0
1357.9[2M+59]-
[2M+75]-[2M+37]-
1320.3
13801280 m/z
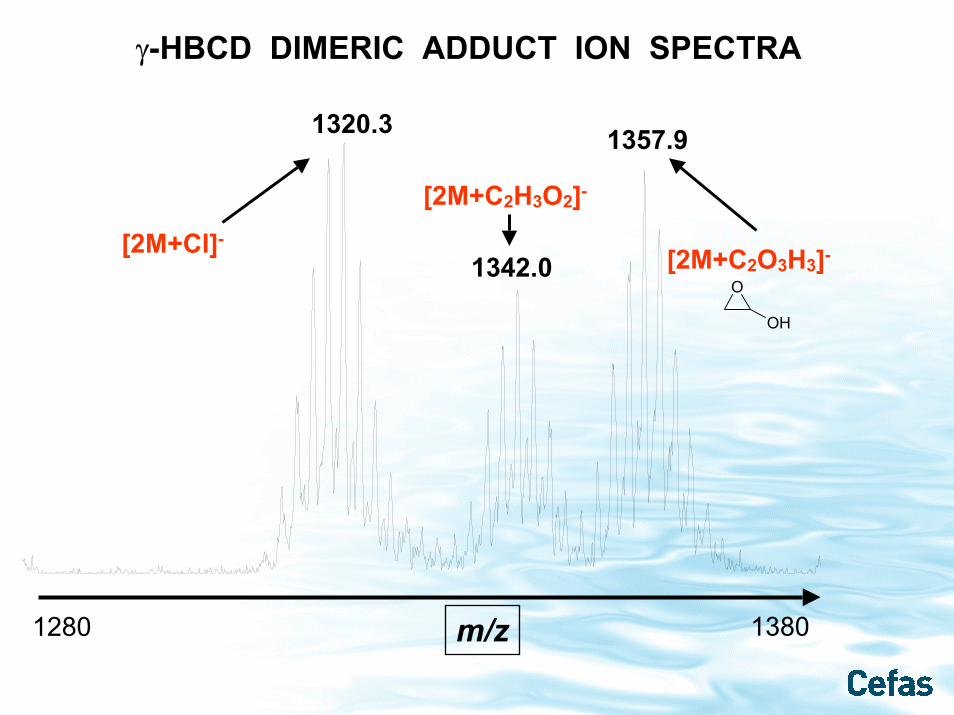
γ-HBCD DIMERIC ADDUCT ION SPECTRA
1342.0
1357.9
[2M+C2H3O2]-
[2M+C2O3H3]-[2M+Cl]-
O
OH
1320.3
13801280 m/z
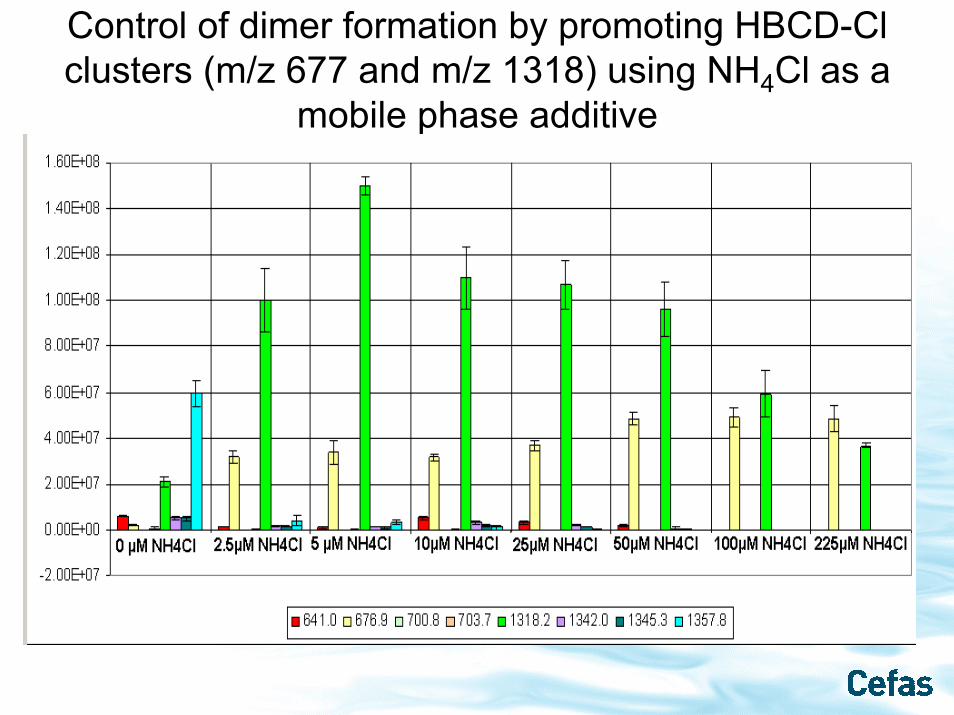
Control of dimer formation by promoting HBCD-Clclusters (m/z 677 and m/z 1318) using NH4Cl as a
mobile phase additive

Mass spectra for γ-HBCD separated by HPLC in the presence of 10 µM NH4Cl
[M+Cl]- [2M+Cl]-

ITMS CHARACTERISATION OF ANALYTES
LCQ Advantage in negative ESI and SIM mode
TBBP-A (MW = 543.9) m/z 541 & m/z 543
α-, β- & γ- HBCD (MW = 641.7) m/z 677 & m/z 1318[M+Cl]- and [2M+Cl]-
13C12 TBBP-A (MW = 555.8) m/z 555 & m/z 553
d18 α-, β- & γ- HBCD (MW = 659.7) m/z 695 & m/z 1354[M+Cl]- and [2M+Cl]-
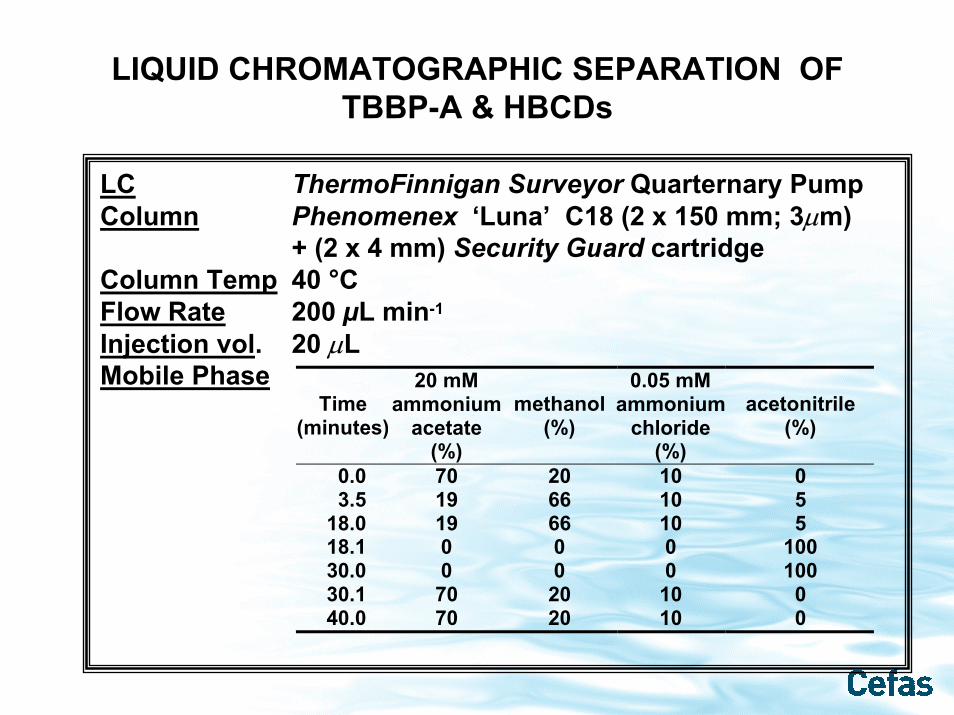
LIQUID CHROMATOGRAPHIC SEPARATION OFTBBP-A & HBCDs
LC ThermoFinnigan Surveyor Quarternary PumpColumn Phenomenex ‘Luna’ C18 (2 x 150 mm; 3µm)
+ (2 x 4 mm) Security Guard cartridgeColumn Temp 40 °CFlow Rate 200 µL min-1
Injection vol. 20 µLMobile Phase
Time (minutes)
20 mM ammonium
acetate (%)
methanol (%)
0.05 mM ammonium
chloride (%)
acetonitrile (%)
0.0 70 20 10 0 3.5 19 66 10 5
18.0 19 66 10 5 18.1 0 0 0 100 30.0 0 0 0 100 30.1 70 20 10 0 40.0 70 20 10 0

Calibration curves obtained for α-, β-, γ- HBCD using d18-HBCDs internal standards and 5 µM NH4Cl in the mobile
phase
HBCDs produce 2nd order calibration curves with a linear range from 10 to ca 500 ng/ml
α-HBCD([M+35]-+[2M+35]-)
0.0
0.5
1.0
1.5
2.0
2.5
0 100 200 300 400 500
Concentration (in ng/ml)
Are
a R
atio
β-HBCD([M+35]-+[2M+35]-)
0.00.2
0.40.6
0.81.0
1.21.4
1.61.8
2.0
0 100 200 300 400 500
Concentration (in ng/ml)
Area
Rat
io
γ-HBCD ([M+35]-+[2M+35]-)
0.00.20.40.60.81.01.21.41.61.82.0
0 100 200 300 400 500
Concentration (in ng/ml)
Are
a R
atio
R^2 = 0.999R^2 = 0.997R^2 = 0.995
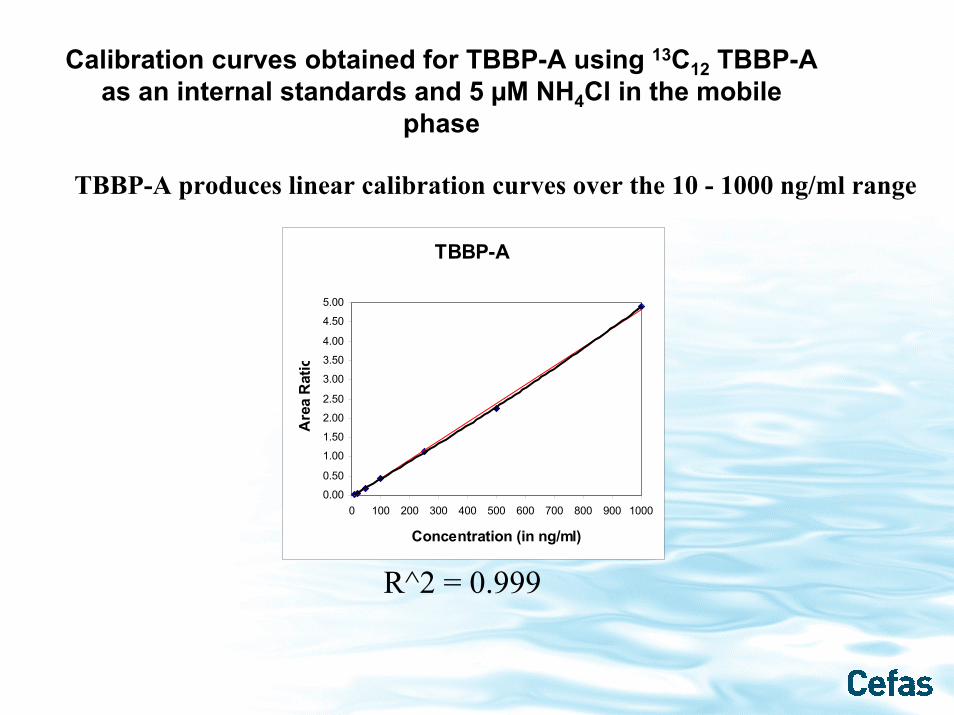
Calibration curves obtained for TBBP-A using 13C12 TBBP-A as an internal standards and 5 µM NH4Cl in the mobile
phase
TBBP-A produces linear calibration curves over the 10 - 1000 ng/ml range
R^2 = 0.999
TBBP-A
0.00
0.50
1.00
1.50
2.00
2.50
3.00
3.50
4.00
4.50
5.00
0 100 200 300 400 500 600 700 800 900 1000
Concentration (in ng/ml)
Are
a R
atio

Analytical scheme for HBCD & TBBP-AS o x h le t/M A S E /A S E
1 0 g a ir d rie d s e d im e n t/5 g b io ta1 3C 1 2 T B B P -A
d 1 8 H B C D s (a lp h a , b e ta & g a m m a )
2 g e q u iva le n t a liq u o t s e d im e n t/ 0 .2 5 ge q u ivq a le n t fa t
R e d u c e d to 1 .5 m l u n d e r O F N
C le a n u p b y H P G P C u s in g e th y l/a c e ta te :c yc lo h e x a n e 1 :1
A d d itio n a l c le a n u p w ith c o n cs u lp h u ric if n e c e s s a ry
R e c o n s titu te in m e th a n o l to 1 2 0 µ l
L C -M S
Trends in Analytical Chemistry, Vol. 25, No.4, 2006

HBCD QC using a Cod LRM (n=10)
α-HBCD β-HBCD γ-HBCD Σ-HBCDLRM concentration (µg/kg) 4.0 3.2 17.6 24.8Concentration (µg/kg) 3.5 3.0 13.4 19.9SD 0.7 0.3 2.7 2.2% RSD 21 9 20 11% Recovery 87 93 76 80
LOQ = 1 ng/g

HBCD Recovery from Silica(3g 3% Deactivated)
0
20
40
60
80
100
120
0-25ml Hexane 25-30ml 20%Ether/Hexane
30-35ml 20%Ether/Hexane
35-40ml 20%Ether/Hexane
40-45ml 20%Ether/Hexane
45-50ml 20%Ether/Hexane
AHBCDBHBCDGHBCD
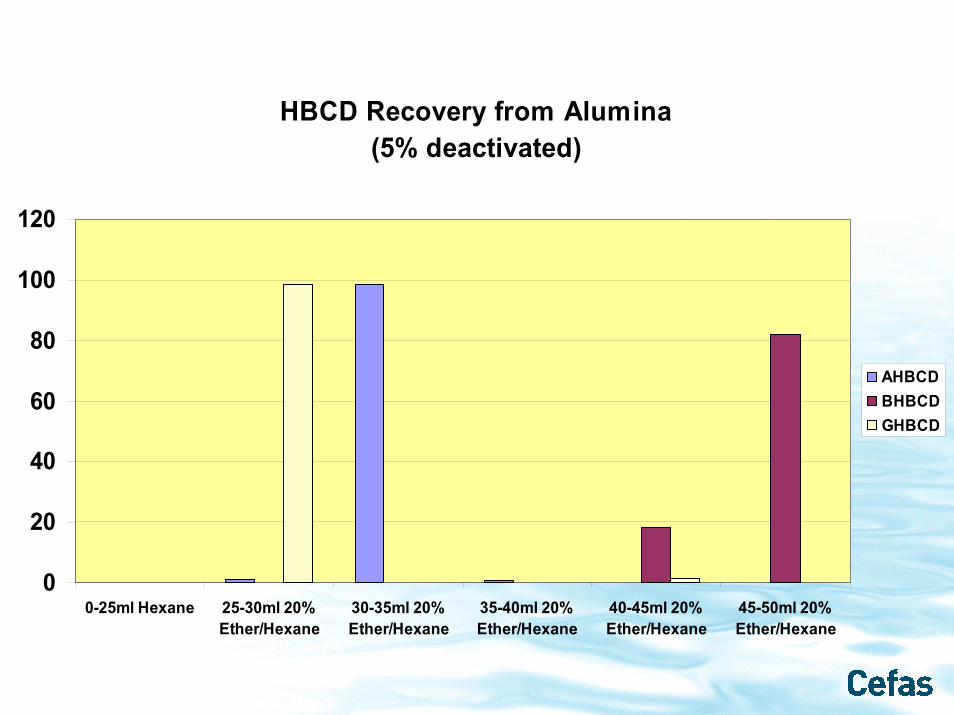
HBCD Recovery from Alumina(5% deactivated)
0
20
40
60
80
100
120
0-25ml Hexane 25-30ml 20%Ether/Hexane
30-35ml 20%Ether/Hexane
35-40ml 20%Ether/Hexane
40-45ml 20%Ether/Hexane
45-50ml 20%Ether/Hexane
AHBCDBHBCDGHBCD

Eel sample from the river Thames (2005)RT: 0.00 - 29.97 SM: 7G
0 2 4 6 8 10 12 14 16 18 20 22 24 26 28Time (min)
0
10
20
30
40
50
60
70
80
90
100
Rel
ativ
e Ab
unda
nce
0
10
20
30
40
50
60
70
80
90
100
Rel
ativ
e A
bund
ance
14.74
12.60
10.58 25.55 28.6720.67 27.5024.0522.0315.72 19.24
12.86
20.9323.01 26.20 28.8727.3110.51 14.94 19.4317.22
NL:2.69E4m/z= 694.10-695.10+1353.60-1354.60 MS 05-4493
NL:5.30E4m/z= 676.00-677.00+1317.30-1318.30 MS 05-4493
d18 α-HBCD
d18 β-HBCD d18 γ-HBCD
α-HBCD
ΣHBCD= 60 ng/g

RT: 0.00 - 29.99 SM: 5G
0 2 4 6 8 10 12 14 16 18 20 22 24 26 28Time (min)
0
10
20
30
40
50
60
70
80
90
100
Rel
ativ
e Ab
unda
nce
0
10
20
30
40
50
60
70
80
90
100
Rel
ativ
e A
bund
ance
13.71
12.93
11.96
10.99 15.59 25.1117.94 28.0423.4820.09 22.3712.15
13.90 22.1110.79 16.83 23.5418.0715.27 25.3720.94 28.8227.19
NL:3.53E5m/z= 694.10-695.10+1353.60-1354.60 MS 2655
NL:6.40E5m/z= 676.00-677.00+1317.30-1318.30 MS 2655
Stranded porpoise - Gibraltar point, Lincolnshire (2003)
d18 α-HBCD
d18 β-HBCD
d18 γ-HBCD
α-HBCD
ΣHBCD= 8223 ng/g

RT: 0.00 - 29.94 SM: 7G
0 2 4 6 8 10 12 14 16 18 20 22 24 26 28Time (min)
0
10
20
30
40
50
60
70
80
90
100
Rel
ativ
e A
bund
ance
0
10
20
30
40
50
60
70
80
90
100
Rel
ativ
e Ab
unda
nce
14.61
13.70
21.15 24.6012.47
25.8419.2015.49 28.9017.6411.17
14.86
12.73
20.76 24.0822.00 26.94 28.6418.4215.9411.75
NL:4.01E4m/z= 694.10-695.10+1353.60-1354.60 MS 2523-01
NL:1.61E6m/z= 676.00-677.00+1317.30-1318.30 MS 2523-01
d18 α-HBCD
d18 β-HBCDd18 γ-HBCD
α-HBCDβ-HBCD
γ-HBCD
ΣHBCD= 239 ng/g
Cork Sewage Sludge sample

SELECTED CHROMATOGRAMS OF TEES SEDIMENT EXTRACTS - TBBP-A
20.00 22.00 24.00 26.00 28.00 30.00 32.00 34.00 36.00 38.00Time0
100
%
0
100
%
0
100
%
0
100
%
C1433216 3: SIR of 1 Channel ES540.901.21e4
Area
25.66
20.94
C1433211 3: SIR of 1 Channel ES540.908.39e4
Area
25.66
C1433210 3: SIR of 1 Channel ES540.906.79e4
Area
25.70
C1433206 1: SIR of 1 Channel ES554.783.52e5
Area
25.93
TBBP-A=12 ng/g
TBBP-A=57 ng/g
TBBP-A=55 ng/g
13C12 TBBP-A
Standard
-
-
-
-

SEWAGE SLUDGE EXTRACTS
20.00 22.00 24.00 26.00 28.00 30.00 32.00 34.00 36.00 38.00Time0
100
%
0
100
%
0
100
%
0
100
%
C1433271 3: SIR of 1 Channel ES- 540.902.47e5
Area
26.04
C1433261 1: SIR of 1 Channel ES- 554.783.10e5
Area
26.17
C1433271 6: SIR of 1 Channel ES- 640.502.22e5
Area
34.98
32.59 33.05
C1433261 6: SIR of 1 Channel ES- 640.506.32e4
Area
35.0132.6833.14
13C12 TBBP-A
Standard
Sewage sludge
HBCD tech Standard
TBBP-A=192 ng/g
ΣHBCD=7,519 ng/g
Sewage sludge

Summary• LC-MS in single quad , triple quad or ion trap
configuration allows robust determination of TBBP-A & isomeric based HBCD measurement and is to be preferred over GC-MS techniques without isomeric resolution.
• The techniques presented has been fully validated and applied to a range of environmental matrices from biota (fish, shellfish, marine mammals) to abiotic materials (sediments and sewage sludge)